
This report examines welfare use (means-tested anti-poverty programs) for households headed by non-citizens by state using the 2021 to 2025 Current Population Survey Annual Social and Economic Supplement (CPS ASEC). About half of non-citizens are illegal immigrants, with lawful permanent residents making up most of the remaining. We find that non-citizen households use one or more means-tested programs at substantially higher rates than the U.S.-born in virtually every state. This is the case despite restrictions on non-citizens directly receiving some benefits, significant differences across states in non-citizens’ country of birth, and state welfare systems.
Among the Findings
- Traditional welfare programs examined are TANF, SSI, SNAP, WIC, free/subsidized school meals, Medicaid, and public/subsidized housing. The CPS ASEC also calculates eligibility for the “refundable” portion of the Earned Income Tax Credit (EITC) and the Additional Child Tax Credit (ACTC) — cash payment to low-wage workers who pay no federal income tax.
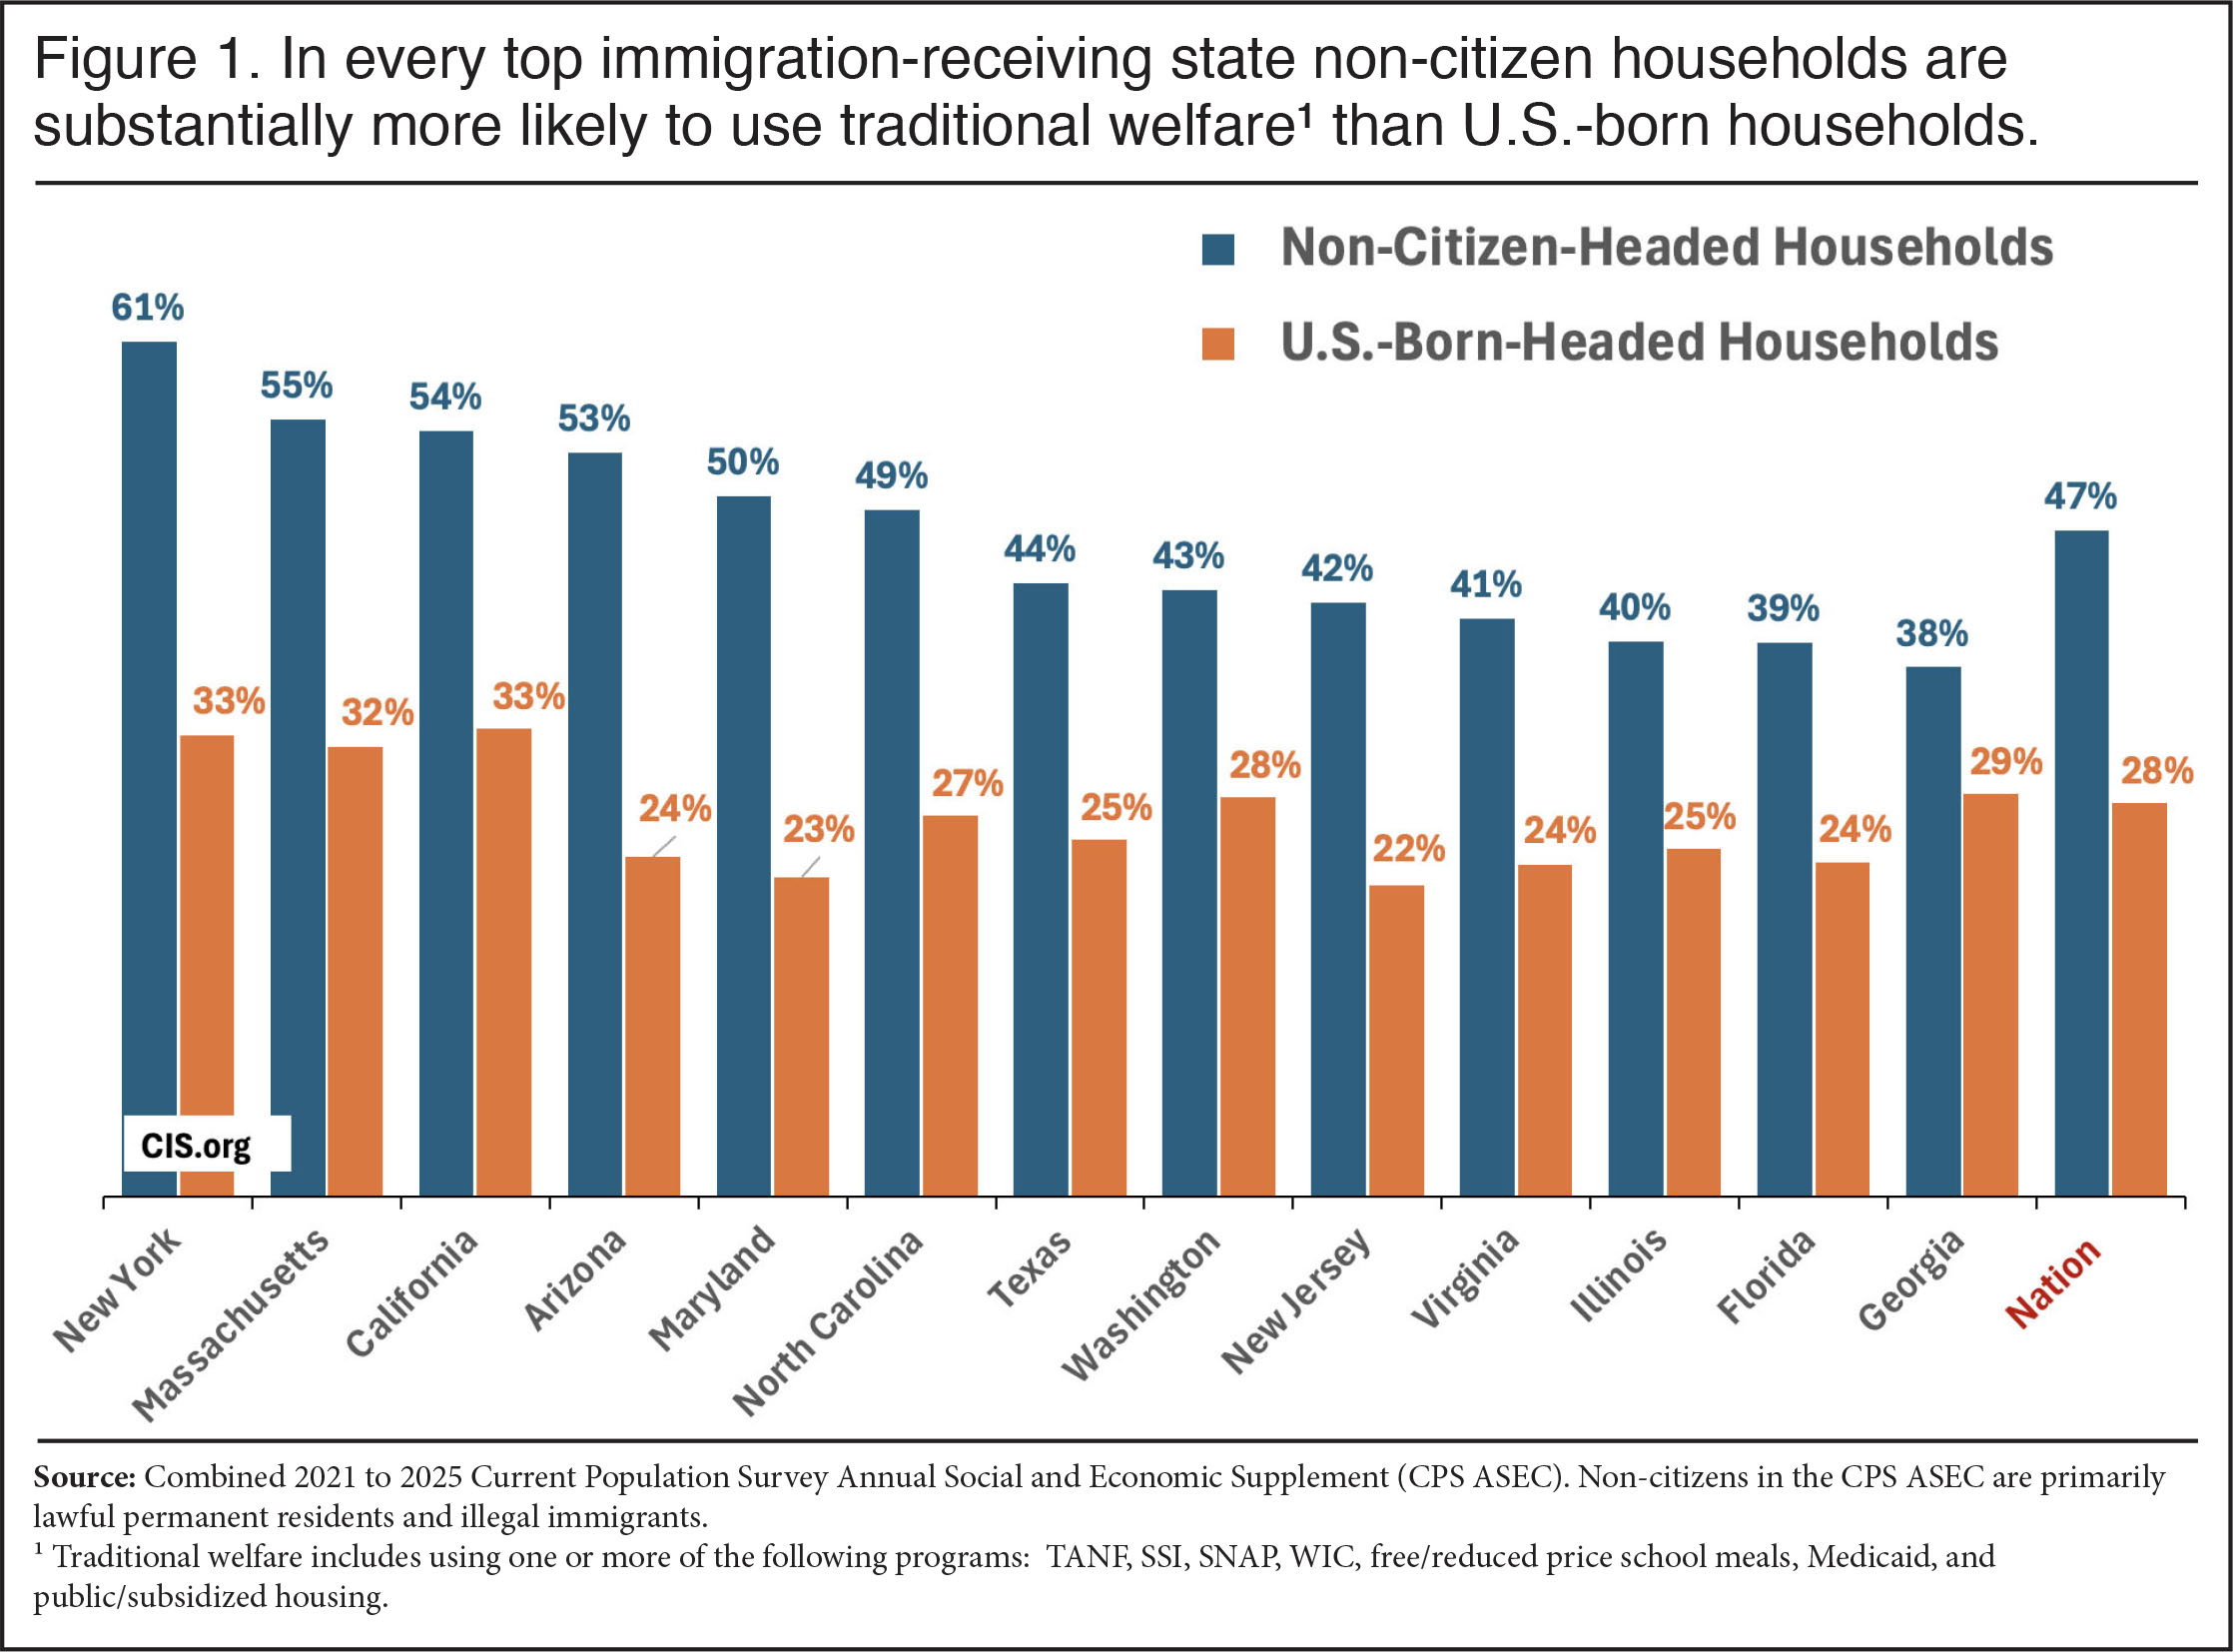
- Of households headed by non-citizens, 47 percent use one or more traditional welfare programs, 19 percentage points higher than the 28 percent for U.S.-born households. The non-citizen rate rises to 57 percent when eligibility for the EITC or ACTC is added, compared to 34 percent for the U.S.-born.
- Restrictions on welfare eligibility have a modest impact on non-citizen overall use rates primarily because: 1) non-citizens, including illegal immigrants, can receive benefits on behalf of their U.S.-born children; 2) the bar does not apply to all non-citizens or all programs; 3) some states provide welfare to ineligible immigrants on their own; and 4) most legal immigrants have lived here long enough to qualify for welfare.
- Compared to the U.S.-born, non-citizen households are much more likely to use one or more traditional welfare programs in 48 states. Adding in EITC/ACTC eligibility, the non-citizen rate is higher in every state.
- Non-citizen households use one or more traditional welfare programs or have incomes low enough to qualify for the EITC/ACTC or both in all of the states with the largest non-citizen populations. For example, the share is 65 percent in New York, 62 percent in California, 57 percent in Texas, 53 percent in Florida, and 51 percent in both Illinois and New Jersey.
- In states with larger non-citizen populations, their receipt of traditional welfare and/or EITC/ACTC eligibility exceeds the U.S.-born by the largest margins in Maryland (59 percent for non-citizen vs. 28 percent for the U.S.-born), Arizona (60 percent vs. 30 percent), New York (65 percent vs. 37 percent), and North Carolina (59 percent vs. 33 percent).
- Non-citizens use traditional welfare or are EITC/ACTC eligible at higher rates than the U.S.-born in states with generous welfare systems, such as Massachusetts (61 percent vs. 36 percent) and Illinois (51 percent vs. 30 percent); and in states with less generous systems, like Arizona (60 percent vs. 30 percent) and Florida (53 percent vs. 30 percent).
- Use of traditional welfare for non-citizen households tends to be the highest in absolute terms and relative to the U.S.-born for food assistance programs and Medicaid. Eligibility for the EITC and ACTC also significantly exceeds the U.S.-born. Use of traditional cash welfare (TANF and SSI) or housing programs are generally not significantly higher.
- Heavy non-citizen use of means-tested programs is not explained by their unwillingness to work. A larger share of non-citizen households have a worker than do U.S.-born households. But qualifying for a program reflects income, number of dependents, and sometimes assets, not employment. The relatively low education level of many non-citizens and their resulting low incomes means they or their U.S.-born children often qualify for means-tested programs at high rates.
Introduction
In 1996, the Personal Responsibility and Work Opportunity Reconciliation Act overhauled the welfare system, barring most new legal immigrants and illegal immigrants from receiving most federally funded means-tested programs. However, this analysis, and prior research by the Center for Immigration Studies using other government survey data and other analysis using the same data used here, shows that immigrants in general and non-citizen-headed households in particular make extensive use of the welfare system, typically at higher rates than the U.S.-born, whose use of welfare is certainly not low. This is all the more surprising because about half of all non-citizens in the data used here are illegal immigrants.1 The restrictions on non-citizen access to welfare are not all that effective for a number of reasons. First and foremost, non-citizens, including illegal immigrants, can receive benefits on behalf of their U.S.-born children. Of non-citizen households, 38.2 percent have a U.S.-born minor child. Second, the restrictions on new legal arrivals do not apply to all programs. This is especially true for non-citizen children. It is also the case that many legal immigrants have lived here long enough to qualify for welfare. Finally, a number of states provide welfare to otherwise ineligible non-citizens on their own.
As we will see, use rates vary by state, but in general use of means-tested programs tends to be a good deal higher for non-citizen households than for U.S.-born households in nearly every state. Non-citizen use of the welfare system matters for a number of reasons, not the least of which is that the federal government spends roughly $1 trillion annually on welfare programs. The federal government provides most of the funding for the programs reported on here. However, about one-third ($170 billion) of the costs of Medicaid come from state governments. Further many states have their own housing programs and general assistance cash programs, and state governments bear a significant share of the administrative cost of administering TANF, SSI, WIC, and SNAP. Further, by their consumption of scarce public resources, non-citizens may make it more difficult to assist the poor already here nationally and in the states. Finally, use of welfare is a key measure of self-sufficiency and therefore is an important measure of how non-citizens are adapting to life in America.
Data
This analysis uses a combined five-year sample (2021 to 2025) of the Census Bureau’s Current Population Survey Annual Social and Economic Supplement (CPS ASEC) to examine use of means-tested anti-poverty welfare programs by non-citizen-headed households.2 We use five years of the CPS ASEC to obtain statistically robust measures by state. Non-citizens in the survey are primarily lawful permanent residents and illegal immigrants.3 The U.S.-born, also called “natives” or the “native-born”, are all those who were U.S. citizens at birth.
Using the CPS ASEC allows us to examine the largest number of programs at the state level. Although the public-use data of the American Community Survey (ACS), which is also collected by the Census Bureau, reports respondents’ country of birth, it asks about fewer welfare programs than the CPS ASEC. The Bureau’s Survey of Income and Program Participation (SIPP) is generally thought to provide the most detailed and accurate information about means-tested programs. For this reason, the Center has used the SIPP numerous times in the past. However, the SIPP is a much smaller survey. As such, it can only provide reliable information on a limited number of states for the non-citizen population.4 Because we are interested in how use of the welfare system differs by state we use the CPS ASEC in this analysis even though the survey does tend to under-report welfare relative to the SIPP.
Unit of Analysis
We follow the common practice of reporting programs for households headed by non-citizens.5 We consider the household as receiving the program if one or more individuals in the household receives benefits. We focus on non-citizens because, given the large share who are illegal immigrants or non-immigrants (temporary visa holders), we would expect their use rates to be quite low. A household comprises all individuals living in the same housing unit.
By looking at households, we are primarily comparing program use by non-citizens and their U.S.-born dependent children to welfare use by the U.S.-born and their children. Of persons in non-citizen households, 87.5 percent are themselves non-citizens or are the U.S.-born children under age 18 of a non-citizen parent.6 Some researchers take the odd view that when immigrant parents, including non-citizens, are unable to support their own children and turn to the welfare system, this has nothing to do with the immigrant parents and so exclude such cases. This view ignores the fact that welfare received by the dependent children of non-citizens would not exist but for the parents. What’s more, it overlooks the obvious fact that when the government provides cash or in-kind assistance to children, it is a clear benefit to their parents who are legally and morally obligated to care for their dependent children.
Programs Examined
Our analysis is focused on means-tested anti-poverty programs, what the Census Bureau calls “social welfare programs”. Such programs are different from social insurance (e.g. Social Security and Medicare) that individuals pay into, and where benefit eligibility is more universal and not means-tested. In this analysis, we report figures for what we term “traditional welfare”. Use of these programs is based on self-reporting in the CPS ASEC and includes Supplemental Security Income (SSI), Temporary Assistance to Needy Families (TANF), free and reduced-price school lunch and breakfast (school meals), the Women, Infants, and Children (WIC) nutrition program, the Supplemental Nutrition Assistance Program (SNAP, also called food stamps), and subsidized and public housing.7 We refer to these programs as “traditional welfare”, as they can be received without working.
Based on income, number of dependents, and other information in the survey, the Census Bureau also calculates eligibility for the "refundable" portion of the Earned Income Tax Credit (EITC) and Additional Child Tax Credit (ACTC), which are cash payments to low-wage workers who pay no federal income tax.8 We report EITC and ACTC eligibility as well. Not all of those eligible for these two programs actually receive them, but we have previously estimated that two-thirds of non-citizen households identified as poor enough to qualify for the EITC actually receive it. The same is likely true of the ACTC. Of course, whether they actually receive these benefits or not, those income-qualified for these programs have incomes so low that they do not pay federal income tax.
Findings
Top Immigration States. Figure 1 reports the share of households by non-citizens and the U.S.-born receiving one or more traditional welfare programs in the 13 states with the largest non-citizen populations. Collectively, these states account for 77 percent of the non-citizen population in the United States. Figure 1 shows that in all of the top states the share of non-citizen households using one or more traditional welfare programs is much higher than the U.S.-born. Figure 2 shows the same thing when eligibility for the EITC and ACTC is added to traditional welfare use. This is the case in states with very generous welfare systems, such as Massachusetts where 61 percent of non-citizen households use traditional welfare and/or are EITC/ACTC eligible compared to 36 percent of the U.S.-born. It is also true in other generous welfare states like New York, where the corresponding figures are 65 percent for non-citizens and 37 percent for the U.S.-born, and California, where 62 percent of non-citizen households use traditional welfare and/or are EITC/ACTC eligible compared to 38 percent for U.S.-born households. The same pattern also exists in states with less generous welfare systems such as Florida, where 53 percent of non-citizen households access traditional welfare or are EITC/ACTC eligible compared to 30 percent of native-headed households, and Texas, where the figures are 57 percent and 32 percent.
 |
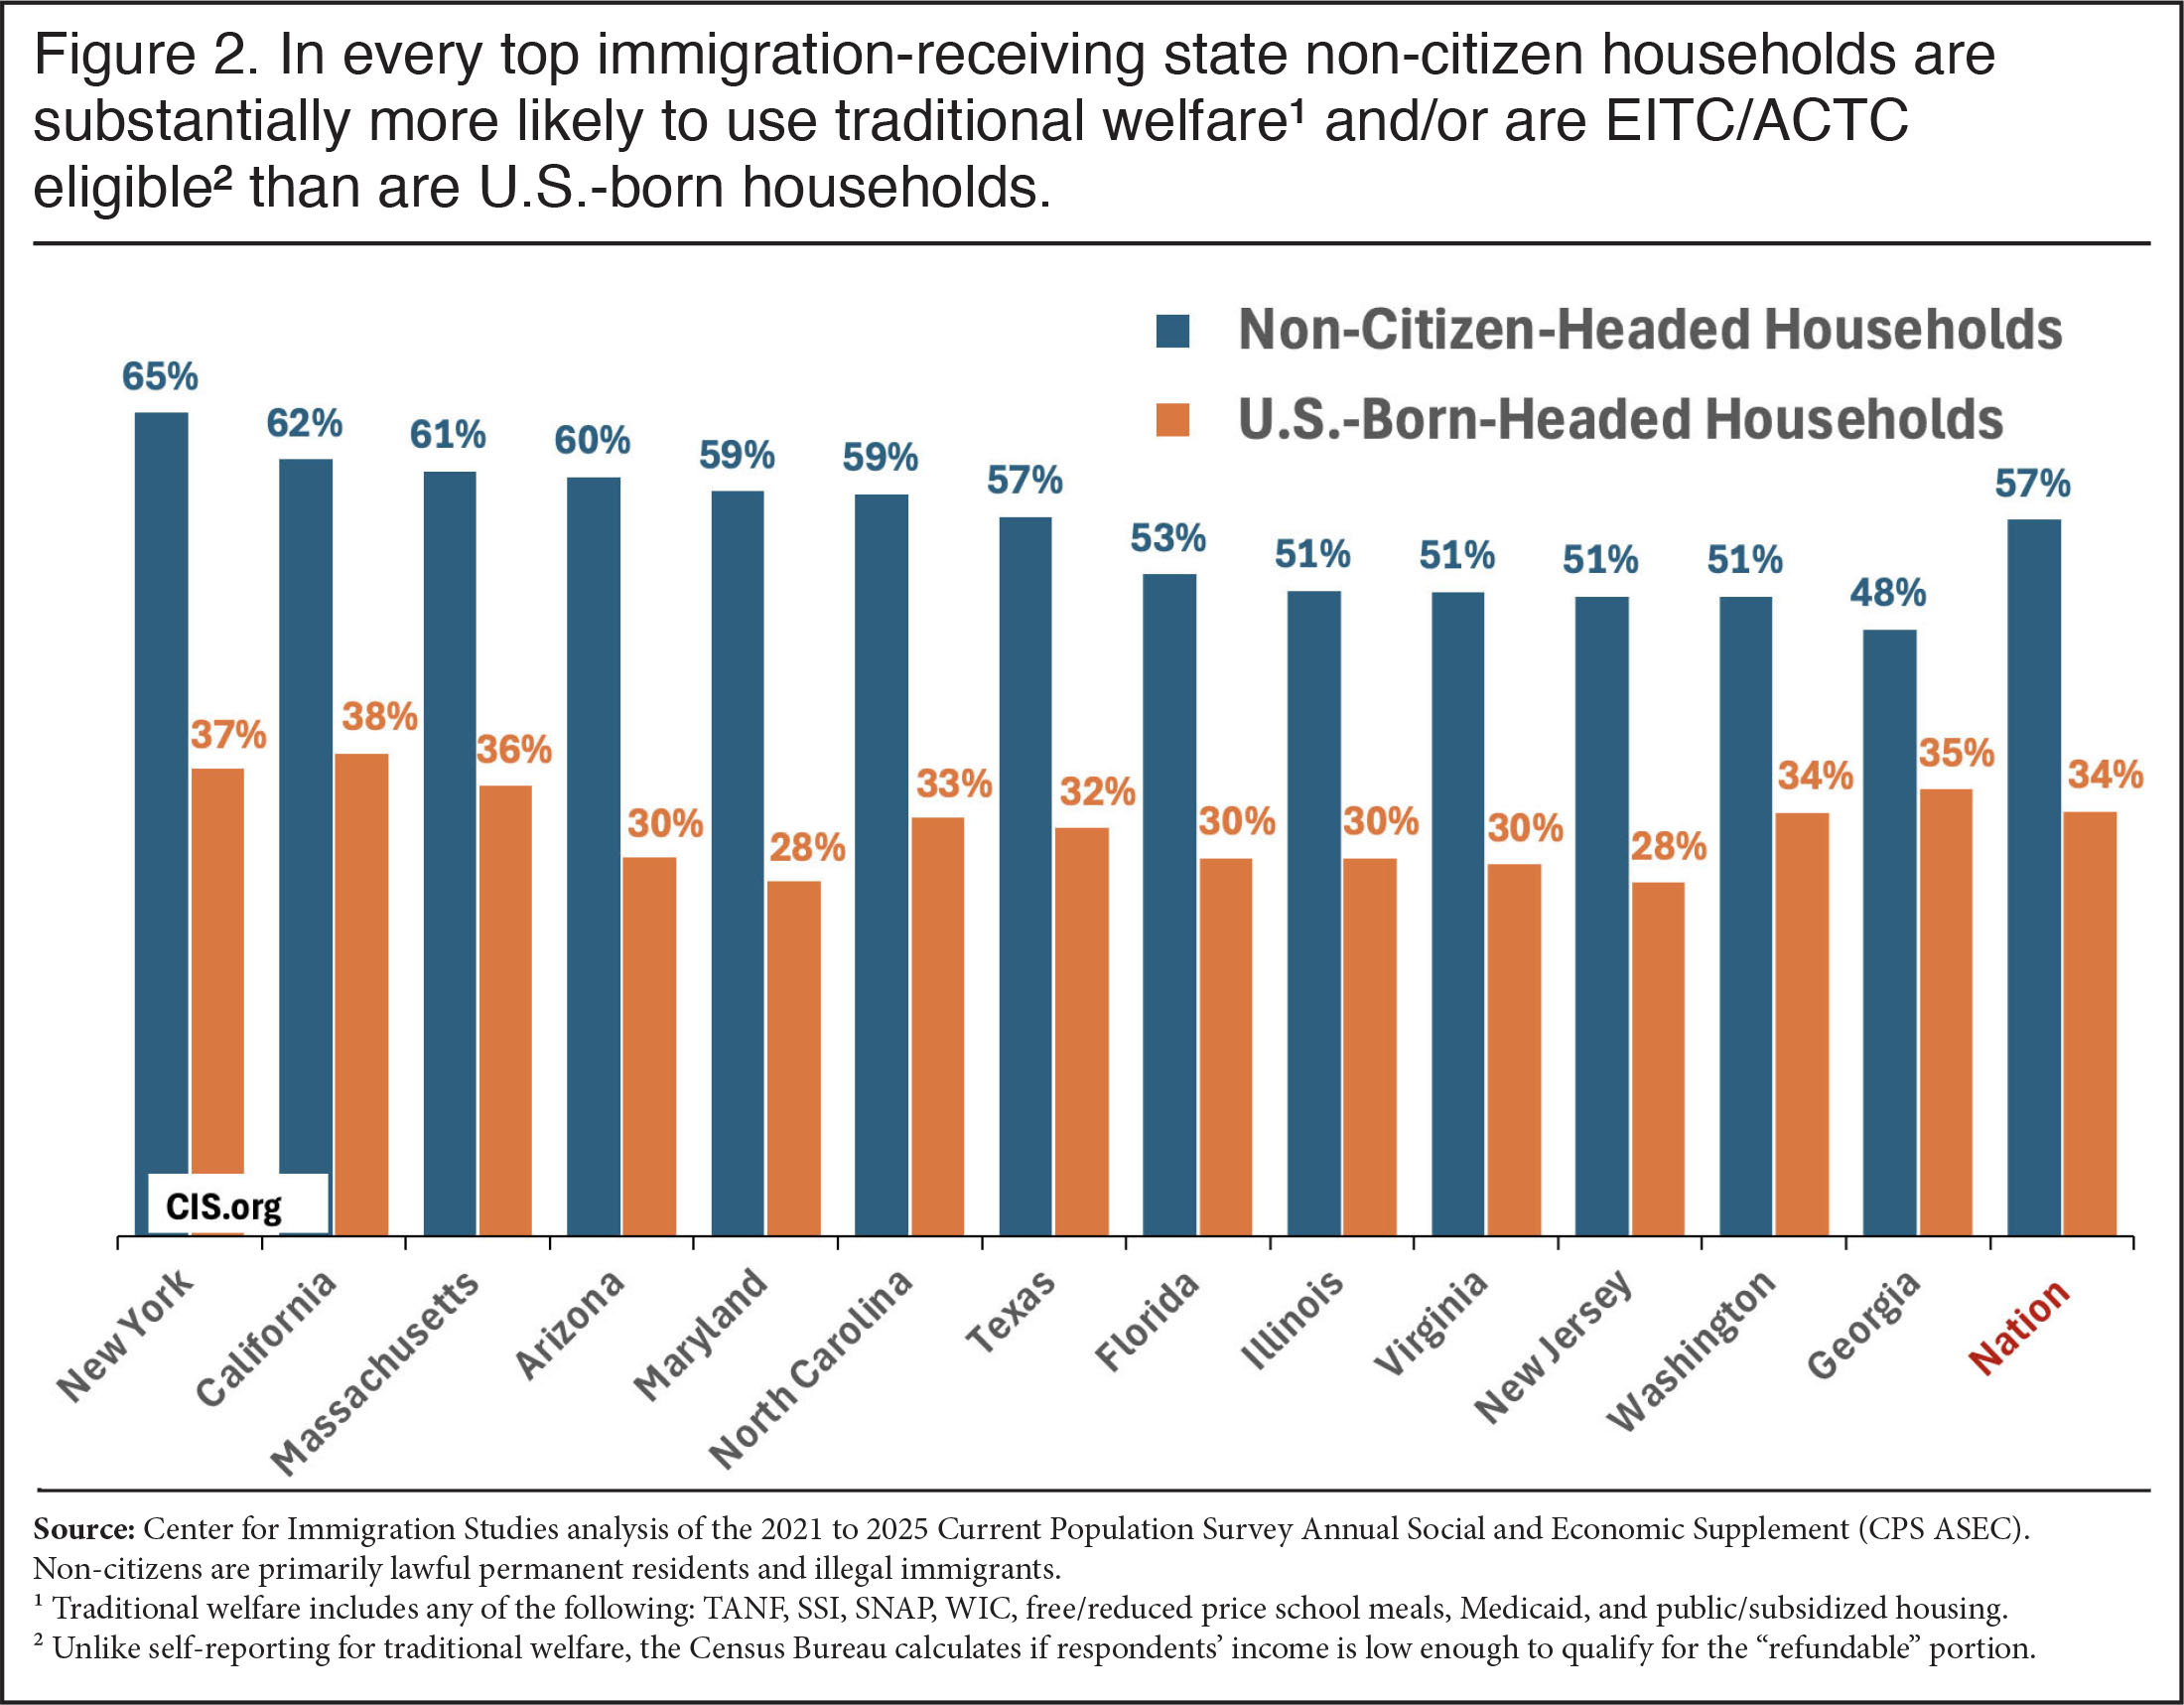 |
Table 1 provides more detailed information for different types of programs for every state. Although there are differences between states, in general non-citizen households’ greater propensity to use traditional welfare programs in just about every state reflects their heavier use of food assistance programs (school meals, SNAP, and WIC) and Medicaid. Their use of the cash assistance from the TANF and SSI programs is typically not higher than households headed by the U.S.-born and is lower in many states. However, the share of households, non-citizen or U.S.-born, using these programs tends to be quite low for both groups compared to other programs. Like cash assistance, use rates for housing programs measured in the CPS ASEC are quite low overall, and non-citizens and native-born Americans in most states typically have low use rates for these programs.
Eligibility for the EITC and ACTC tends to be much higher for immigrant households. As already discussed, based on other data we estimate that two-thirds of non-citizen households eligible for cash from the EITC and ACTC actually receive them. (Table 1 provides specific information on the share of households that are income-eligible for cash payments from these two programs.) If we assume this pattern holds in every state it would still mean that the percentage of non-citizen households receiving cash payments from the EITC and ACTC exceeds U.S.-born-headed households in just about every state, typically by large margins. Using this two-thirds estimate means that the share of non-citizen households receiving cash from tax credits and/or receiving traditional welfare is a good deal higher than households headed by the U.S.-born in every state.
The Entire Country. Map 1 shows the share of non-citizen and U.S.-born-headed households using one or more traditional welfare programs. The colors represent the size of the difference in traditional welfare use by non-citizens relative to the U.S.-born. The share of non-citizen households using traditional welfare tends to be a good deal higher than the U.S.-born across the entire country even in many states with modest-sized non-citizen populations. Higher welfare use by non-citizens is certainly not confined to any one region or part of the country. This despite the fact that non-citizens differ significantly across the United States, as does the generosity of state welfare systems. Map 2 adds eligibility for the EITC and ACTC and again shows that non-citizen-household use or eligibility for means-tested anti-poverty programs is substantially above that of the U.S.-born households across the country.
Map 1: Non-Citizen and U.S.-Born Households Using Traditional Welfare¹
Non-Citizen Welfare Use Relative to U.S.-Born2
Source: Center for Immigration Studies analysis of combined 2021 to 2025 Current Population Survey Annual Social and Economic Supplement (CPS ASEC). Non-citizens are primarily lawful permanent residents and illegal immigrants.
1 Traditional welfare includes reported use of any of the following: TANF, SSI, SNAP, WIC, free/reduced price school meals, Medicaid, and public/subsidized housing.
2 Size of the difference rounded and then categorized.
Map 2: Non-Citizen and U.S.-Born Households Using Traditional Welfare¹ and/or Eligible for EITC/ACTC²
Non-Citizen Welfare Use and/or EITC/ACTC
Eligibility Relative to U.S.-Born3
Source: Center for Immigration Studies analysis of combined 2021 to 2025 Current Population Survey Annual Social and Economic Supplement (CPS ASEC). Non-citizens are primarily lawful permanent residents and illegal immigrants.
1 Traditional welfare includes reported use of any of the following TANF, SSI, SNAP, WIC, free/reduced price school meals, Medicaid, and public/subsidized housing.
2 The Census Bureau calculates if respondents' income is low enough to qualify for cash from the Earned Income Tax Credit (EITC) & Additional Child Tax Credit (ACTC), which are payments to low-wage workers who pay no federal income tax.
3 Size of the difference rounded and then categorized.
Why Is the Non-citizen Use Rate So High? In our prior research on welfare use nationally or by sending country we have consistently emphasized that educational attainment is a major factor in immigrants’ income and use of the welfare system. At the state level, average years of schooling for households headed by non-citizens shows a strong negative correlation with receipt of traditional welfare or the EITC and ACTC.9 Table 1 has information on the educational level of household heads for non-citizens and the U.S.-born by state. The correlation between use of traditional welfare and the average years of schooling for non-citizen households is high and negative (r=-.60) even though welfare systems and the country of birth of the foreign-born differ significantly across states. The connection between traditional welfare and/or the two tax credits and non-citizen average years of schooling is also high and negative (r=-.73). There is nothing surprising about these findings. Because a much larger share of non-citizens have modest levels of education relative to natives they tend to earn lower wages, making a larger share eligible for means tested programs.
Welfare Use for Working Households. There is a common misperception that welfare is primarily for those who do not work. In fact, one of the primary goals of the American welfare system is to assist low-wage workers, particularly those with children. Table 1 reports on the share of households with at least one worker. The vast majority of households headed by non-citizens in every state have at least one worker. Overall, 87.5 percent of all non-citizen households have at least one worker, as do 70 percent of all native households. But this in no way means that they cannot use means-tested programs. Turning first to traditional welfare, 47 percent of non-citizen households with at least one worker use one or more welfare programs; the corresponding figure for working native households is 27 percent. These figures are virtually identical to those for all households, working and non-working. If we add in eligibility for the EITC and ACTC the figures increase to 57 and 34 percent, respectively, for working non-citizens and working U.S.-born households. Again, this is nearly the same as when all households are considered. Non-citizen use of means-tested programs is not explained by an unwillingness to work.
Conclusion
Although most new legal immigrants and illegal immigrants are barred from accessing most means-tested programs, this analysis, like others going back decades, shows that these restrictions have not prevented a large share of non-citizen-headed households from accessing the welfare system across the country. This is primarily because non-citizens often receive benefits on behalf of their U.S.-born children and the restrictions only apply to some programs. This analysis focuses on use of means-tested anti-poverty programs at the state level and finds that in all of the top immigration-receiving states non-citizen households make extensive use of the welfare system. Further, non-citizen-headed households’ reliance on means-tested programs exceeds that of households headed by the U.S.-born in virtually every state. This is the case both in states that have generous welfare systems, like California and New York, and in states with relatively less generous systems, such as Texas and Florida.
The larger share of non-citizen households with modest levels of education and their resulting lower incomes means many qualify for means-tested anti-poverty programs. In general, states where non-citizens have the lowest levels of education tend to have the highest use of means-tested programs. One factor that does not explain immigrant households’ higher use of programs is an unwillingness to work. In fact, immigrant households are more likely to have a worker present than households headed by the U.S.-born. However, working in no way prevents use of welfare programs. In fact, most households, non-citizen and U.S.-born, that access means-tested programs have at least one worker. What matters is income, number of dependents, and sometimes assets — not employment. Of course, employers do not see the costs created by allowing in large numbers of less-educated workers because the burden is diffuse, borne by all taxpayers. But that does not make the costs any less real.
Our findings may lead some to think of non-citizens disparagingly as having come to America to exploit the welfare system. But the evidence is pretty clear that most people come to America to work. Non-citizen men in particular have relatively high rates of employment.10 Moreover, there is no evidence in this data that non-citizens are using fraud to access programs. They are simply accessing programs for which they or their children are eligible at a time when the social stigma surrounding welfare has largely disappeared. It makes more sense to view non-citizens’ heavy reliance on means-tested programs as an unavoidable consequence of not enforcing immigration laws and having a legal immigration system that does not select people based on their skills and likely income.
End Notes
1 Our prior estimate, based on the monthly CPS, averaged from 2021 to 2025, finds 12.6 million illegal immigrants in the monthly CPS before making any undercount adjustments. Assuming this same number in the CPS ASEC, then about half of the 25 million non-citizens in the 2021-2025 CPS ASEC are illegal immigrants. Of course, all estimates of illegal immigrants are subject to uncertainty, but 12.6 million is consistent with other organizations’ estimates of the illegal immigrant population. Like other researchers and the government, we include those with deferred action, temporary protected status, parole, and pending asylum claims in our estimate of illegal immigrants. Almost none of these individuals have been formally admitted and all are subject to removal under the Immigration and Nationality Act.
2 The survey asks about receipt of government programs in the prior calendar year.
3 In addition to lawful permanent residents and illegal immigrants, there are also “non-immigrants”. DHS estimated that 3.6 million were in the country in 2024; these long-term temporary visitors are primarily foreign students, guestworkers, and exchange visitors. Some of these non-immigrants are captured in the survey. Pew Research estimates roughly two million non-immigrants in Census Bureau data. These individuals should have very low use of the welfare system since they are technically barred from receiving nearly all federally funded programs directly, though not WIC or free school lunch. (States can also provide them with other benefits with their own resources.) Of course, like all non-citizens, they can receive benefits on behalf of U.S.-born children. Further, since guestworkers; some foreign students, particularly those with Optional Practical Training authorization; and most exchange visitors have valid Social Security numbers, they can receive the EITC and ACTC if they are "resident aliens", which generally means they have lived in the U.S. for at least six months.
4 The 2021 to 2024 SIPP has only 9,100 non-citizens in its combined sample (2024 is the most recent year available). In contrast, the 2021 to 2025 CPS ASEC used here has a combined sample of 55,000 non-citizens.
5 The late Julian Simon of the Cato Institute, himself a strong immigration advocate, also argued that it did not make sense to examine individuals when looking at the fiscal impact of immigrants. He observed that, "One important reason for not focusing on individuals is that it is on the basis of family needs that public welfare, Aid to Families with Dependent Children (AFDC), and similar transfers are received." For this reason, Simon examined families, not individuals. While not exactly the same as households, as Simon also observed, the household "in most cases" is "identical with the family". Another reason to look at households is that some of the welfare variables in the ASEC are reported at the household level.
6 Almost everyone else in these households are U.S.-born adult children of immigrant or naturalized-citizen parents. There are only a very small number of U.S.-born adults with U.S.-born parents.
7 State-sponsored general assistance (GA) cash programs, which are small in size, are captured in the TANF numbers.
8 To get the EITC and the ACTC, one has to work, meet the low-income requirements, file a tax return, and, in the case of the ACTC, have at least one child. For many years receipt of the EITC has required that at least one parent and all children claimed as dependents have a valid Social Security number (SSN). In tax years 2024 and 2025 this was also required for the ACTC. Prior to 2024, only the dependent children were required to have a valid SSN to receive the ACTC. Illegal-immigrant parents were able to obtain a temporary tax identification number to receive ACTC benefits. In practice, this meant that illegal immigrants with U.S.-born children but no valid SSN could still claim the ACTC, but not the EITC. This is no longer the case. All this said, it must be understood that illegal immigrants have never been formally barred from either program. Rather, they and their children need valid SSNs. All U.S.-born children of illegal immigrants have a valid number and perhaps three million adult illegal immigrants have been given work authorization, which includes a SSN. Adult illegal immigrants with work authorization include, but are not limited to, those with temporary protected status, deferred action, parolees, and many with pending asylum claims. Some number of illegal immigrants also have stolen or otherwise acquired identities which may allow them to receive cash payments from both programs.
9 The education variable in the CPS ASEC is not a true continuous variable, with multiple years grouped together or a general description of the respondent’s highest degree. We transform the categories into numerical values that correspond best to the average years of education associated with each category. We do this with the following recodes: grades one to four are recoded to 2.5 years; 5th and 6th grade are 5.5 years; 7th to 8th grade are 7.5; 9th, 10th, and 11th grade are their own values; those who attended 12th grade but did not graduate are coded as an 11.5; those who completed high school are 12; those with some college and no degree are 13; both vocational or academic associate's degrees are 14; a bachelor’s degree is 16; a master’s degree is 18; and professional and doctorate degrees are both coded as 20.
10 In the combined 2021-25 ASEC CPS, 87 percent of non-citizen men ages 18 to 64 are in the labor force, compared to 79.3 percent of U.S.-born men 18 to 64.