This report uses the Current Population Survey Annual Social and Economic Supplement (CPS ASEC) to examine welfare use (means-tested anti-poverty programs) for households headed by non-citizens in the U.S. by country and region of birth. Non-citizens in the CPS ASEC are primarily lawful permanent residents and illegal immigrants. The CPS ASEC provides the most detailed information on welfare use by country of birth of any government survey, which is the focus of this analysis. We find that use of means-tested programs is high for non-citizens from many sending countries and regions. We also find significant variation in program use across countries that is closely linked to educational attainment.
Among the findings:
- Of households headed by non-citizens, 47 percent use one or more traditional welfare programs. This rises to 54 percent when eligibility for payments from the Earned Income Tax Credit (EITC) or the Additional Child Tax Credit are added. The corresponding figures for U.S.-born households are 28 percent and 31 percent.
- Major means-tested anti-poverty programs include traditional welfare: TANF, SSI, SNAP, WIC, free/subsided school meals, Medicaid, and public/subsidized housing. The CPS ASEC also calculates eligibility for the “refundable” portion of the EITC or ACTC — cash payments to low-wage workers who pay no federal income tax.
- Restrictions on non-citizen access to welfare have only a modest impact on overall use rates, primarily because: 1) non-citizens can receive benefits on behalf of U.S.-born children; 2) the bar does not apply to all non-citizens or all programs, nor does it apply to non-citizen children in some cases; 3) most legal immigrants have lived here long enough to qualify for welfare; 4) some states provide welfare to otherwise ineligible immigrants on their own.
- By sending region, non-citizen households that are most likely to use traditional welfare or have incomes low enough to qualify for the EITC/ACTC, or both, are from Central America (74 percent), the Caribbean (65 percent), South America (53 percent), the Middle East (51 percent), and Sub-Saharan Africa (46 percent). Non-citizens with the lowest percentages are from East Aisa (38 percent), Europe (34 percent), and South Asia (19 percent).
- Among the top sending countries, non-citizen households that are most likely to use traditional welfare or have incomes low enough to qualify for the EITC/ACTC, or both, are those from Afghanistan (87 percent), Dominican Republic (78 percent), Guatemala (77 percent), Honduras (75 percent), and Mexico (67 percent). Percentages are lowest for non-citizens from Korea (30 percent), United Kingdom (25 percent), Canada (21 percent), and India (16 percent).
- Heavy non-citizen use of means-tested programs is not explained by an unwillingness to work. Most are employed, but the relatively low education level of many and the resulting low incomes means they or their U.S.-born children often receive traditional welfare and/or are income-eligible for the EITC and ACTC.
- If we look at only non-citizen households with at least one worker, 46 percent use traditional welfare. The number rises to 53 percent when those who are income eligible for EITC/ACTC payments are added in. The corresponding figures for households headed by the U.S.-born are 27 and 31 percent.
- When non-citizens are grouped by country, there is a strong negative correlation between years of schooling and use of traditional welfare and/or eligibility for the EITC/ACTC or both (r = -83). Further, a one-year increase in a country’s average years of schooling is associated with nearly a seven percentage-point decrease in benefits use or eligibility.
Download Excel Tables Here
Introduction. In 1996, the Personal Responsibility and Work Opportunity Reconciliation Act overhauled the welfare system, barring most new legal immigrants and illegal immigrants from receiving most federally funded means-tested programs. However, this analysis, and prior research by the Center for Immigration Studies using other government survey data shows non-citizen-headed households make extensive use of the welfare system, typically at higher rates than the U.S.-born, whose use of welfare is certainly not low. This is all the more surprising because about half of all non-citizens in the data used here are illegal immigrants.1 The restrictions on non-citizen access to welfare are not all that effective for a number of reasons First and foremost, non-citizens, including illegal immigrants, can receive benefits on behalf of U.S.-born children. Of non-citizen households, 36.2 percent have a U.S.-born minor child. Second, the restrictions on new legal arrivals do not apply to all programs. This is especially true for non-citizen children. It is also the case that most legal immigrants have lived here long enough to qualify for welfare. Finally, a number of states provide welfare to otherwise ineligible non-citizens on their own.
As we will see, use rates vary enormously by sending region and country, with education being a key factor that explains these differences. Non-citizen use of the welfare system matters for a number of reasons, not the least of which is that the federal government spends roughly $1 trillion annually on welfare programs. Further, by their consumption of scarce public resources, non-citizens may make it more difficult to assist the poor already here. Finally, use of welfare is a key measure of self-sufficiency and therefore is an important measure of how non-citizens are adapting to life in America.
Data. This analysis uses a combined three-year sample (2023 to 2025) of the Census Bureau’s Current Population Survey Annual Social and Economic Supplement (CPS ASEC) to examine use of means-tested anti-poverty welfare programs by non-citizen-headed households.2 We use three years of the CPS ASEC to obtain statistically robust measures by country. Non-citizens in the survey are primarily lawful permanent residents and illegal immigrants.3 The U.S.-born, also called “natives” or the “native-born”, are all those who were U.S. citizens at birth.
The CPS ASEC is the only government survey that provides detailed information on means-tested programs by country of birth. Although the public-use data of the American Community Survey (ACS), which is also collected by the Census Bureau, reports respondents’ country of birth, it asks about fewer welfare programs than the CPS ASEC. The Bureau’s Survey of Income and Program Participation (SIPP) is generally thought to provide the most detailed and accurate information about means-tested programs. For this reason, the Center has used the SIPP numerous times in the past. However, the SIPP does not provide any information by country, and the sending regions that are available in that survey are highly aggregated. Because we are interested in how use of the welfare system differs by sending region and country, we use the CPS ASEC in this analysis even though the survey does tend to under-report welfare relative to the SIPP.
Unit of Analysis. We follow the common practice of reporting programs for households headed by non-citizens.4 We focus on non-citizens because given the large share who are illegal immigrants or non-immigrants (temporary visa holders) we would expect their use rates to be quite low. A household comprises all individuals living in the same housing unit. We consider the household as receiving the program if one or more individuals in the household receives benefits.
By looking at households, we are primarily comparing program use by non-citizens and their U.S.-born dependent children to welfare use by the U.S.-born and their children. Of persons in non-citizen households, 87 percent are themselves non-citizens or are the U.S.-born child under age 18 of a non-citizen parent.5 Some researchers take the rather odd view that when immigrant parents, including non-citizens, are unable to support their own children and turn to the welfare system this has nothing to do with the immigrant parents and so exclude such cases. This view ignores the fact that welfare received by the dependent children of non-citizens would not exist but for the parents. What’s more, it overlooks the obvious fact that when the government provides cash or in-kind assistance to children, it is a clear benefit to their parents who are legally obligated to care for their dependent children.
Programs Examined. Our analysis is focused on means-tested anti-poverty programs, what the Census Bureau calls “social welfare programs”. Such programs are different from social insurance (e.g. Social Security and Medicare) that individuals pay in to, and where benefit eligibility is more universal and not means-tested. In this analysis, we report figures for what we term “traditional welfare”. Use of these programs is based on self-reporting in the CPS ASEC and includes Supplemental Security Income (SSI), Temporary Assistance to Needy Families (TANF), free and reduced-price school lunch and breakfast (school meals), the Women, Infants, and Children (WIC) nutrition program, the Supplemental Nutrition Assistance Program (SNAP, also called food stamps), and subsidized and public housing.6 Based on income, number of dependents, and other information in the survey, the Census Bureau also calculates eligibility for the "refundable" portion for the EITC and ACTC, which are cash payments to low-wage workers who pay no federal income tax.7 We report EITC and ACTC eligibility as well. Not all of those eligible for these two programs actually receive them, but other survey data indicates that perhaps two-thirds of non-citizen households identified as poor enough to qualify for the EITC actually receive it.8 The same is likely true of the ACTC. Of course, whether they actually receive these benefits or not, those income-qualified for these programs have incomes so low that they do not pay federal income tax.
Welfare Use by Region. Figure 1 reports the share of households receiving one or more welfare programs based on the sending region of the household head, with Mexico reported separately.9 Excel Table 1 provides more detailed information, including sample size, educational attainment, and use of particular types of programs for more countries. Turning first to traditional welfare, we see that 47 percent of non-citizen households use one or more traditional welfare programs, much higher than the 28 percent rate for the U.S. born.10
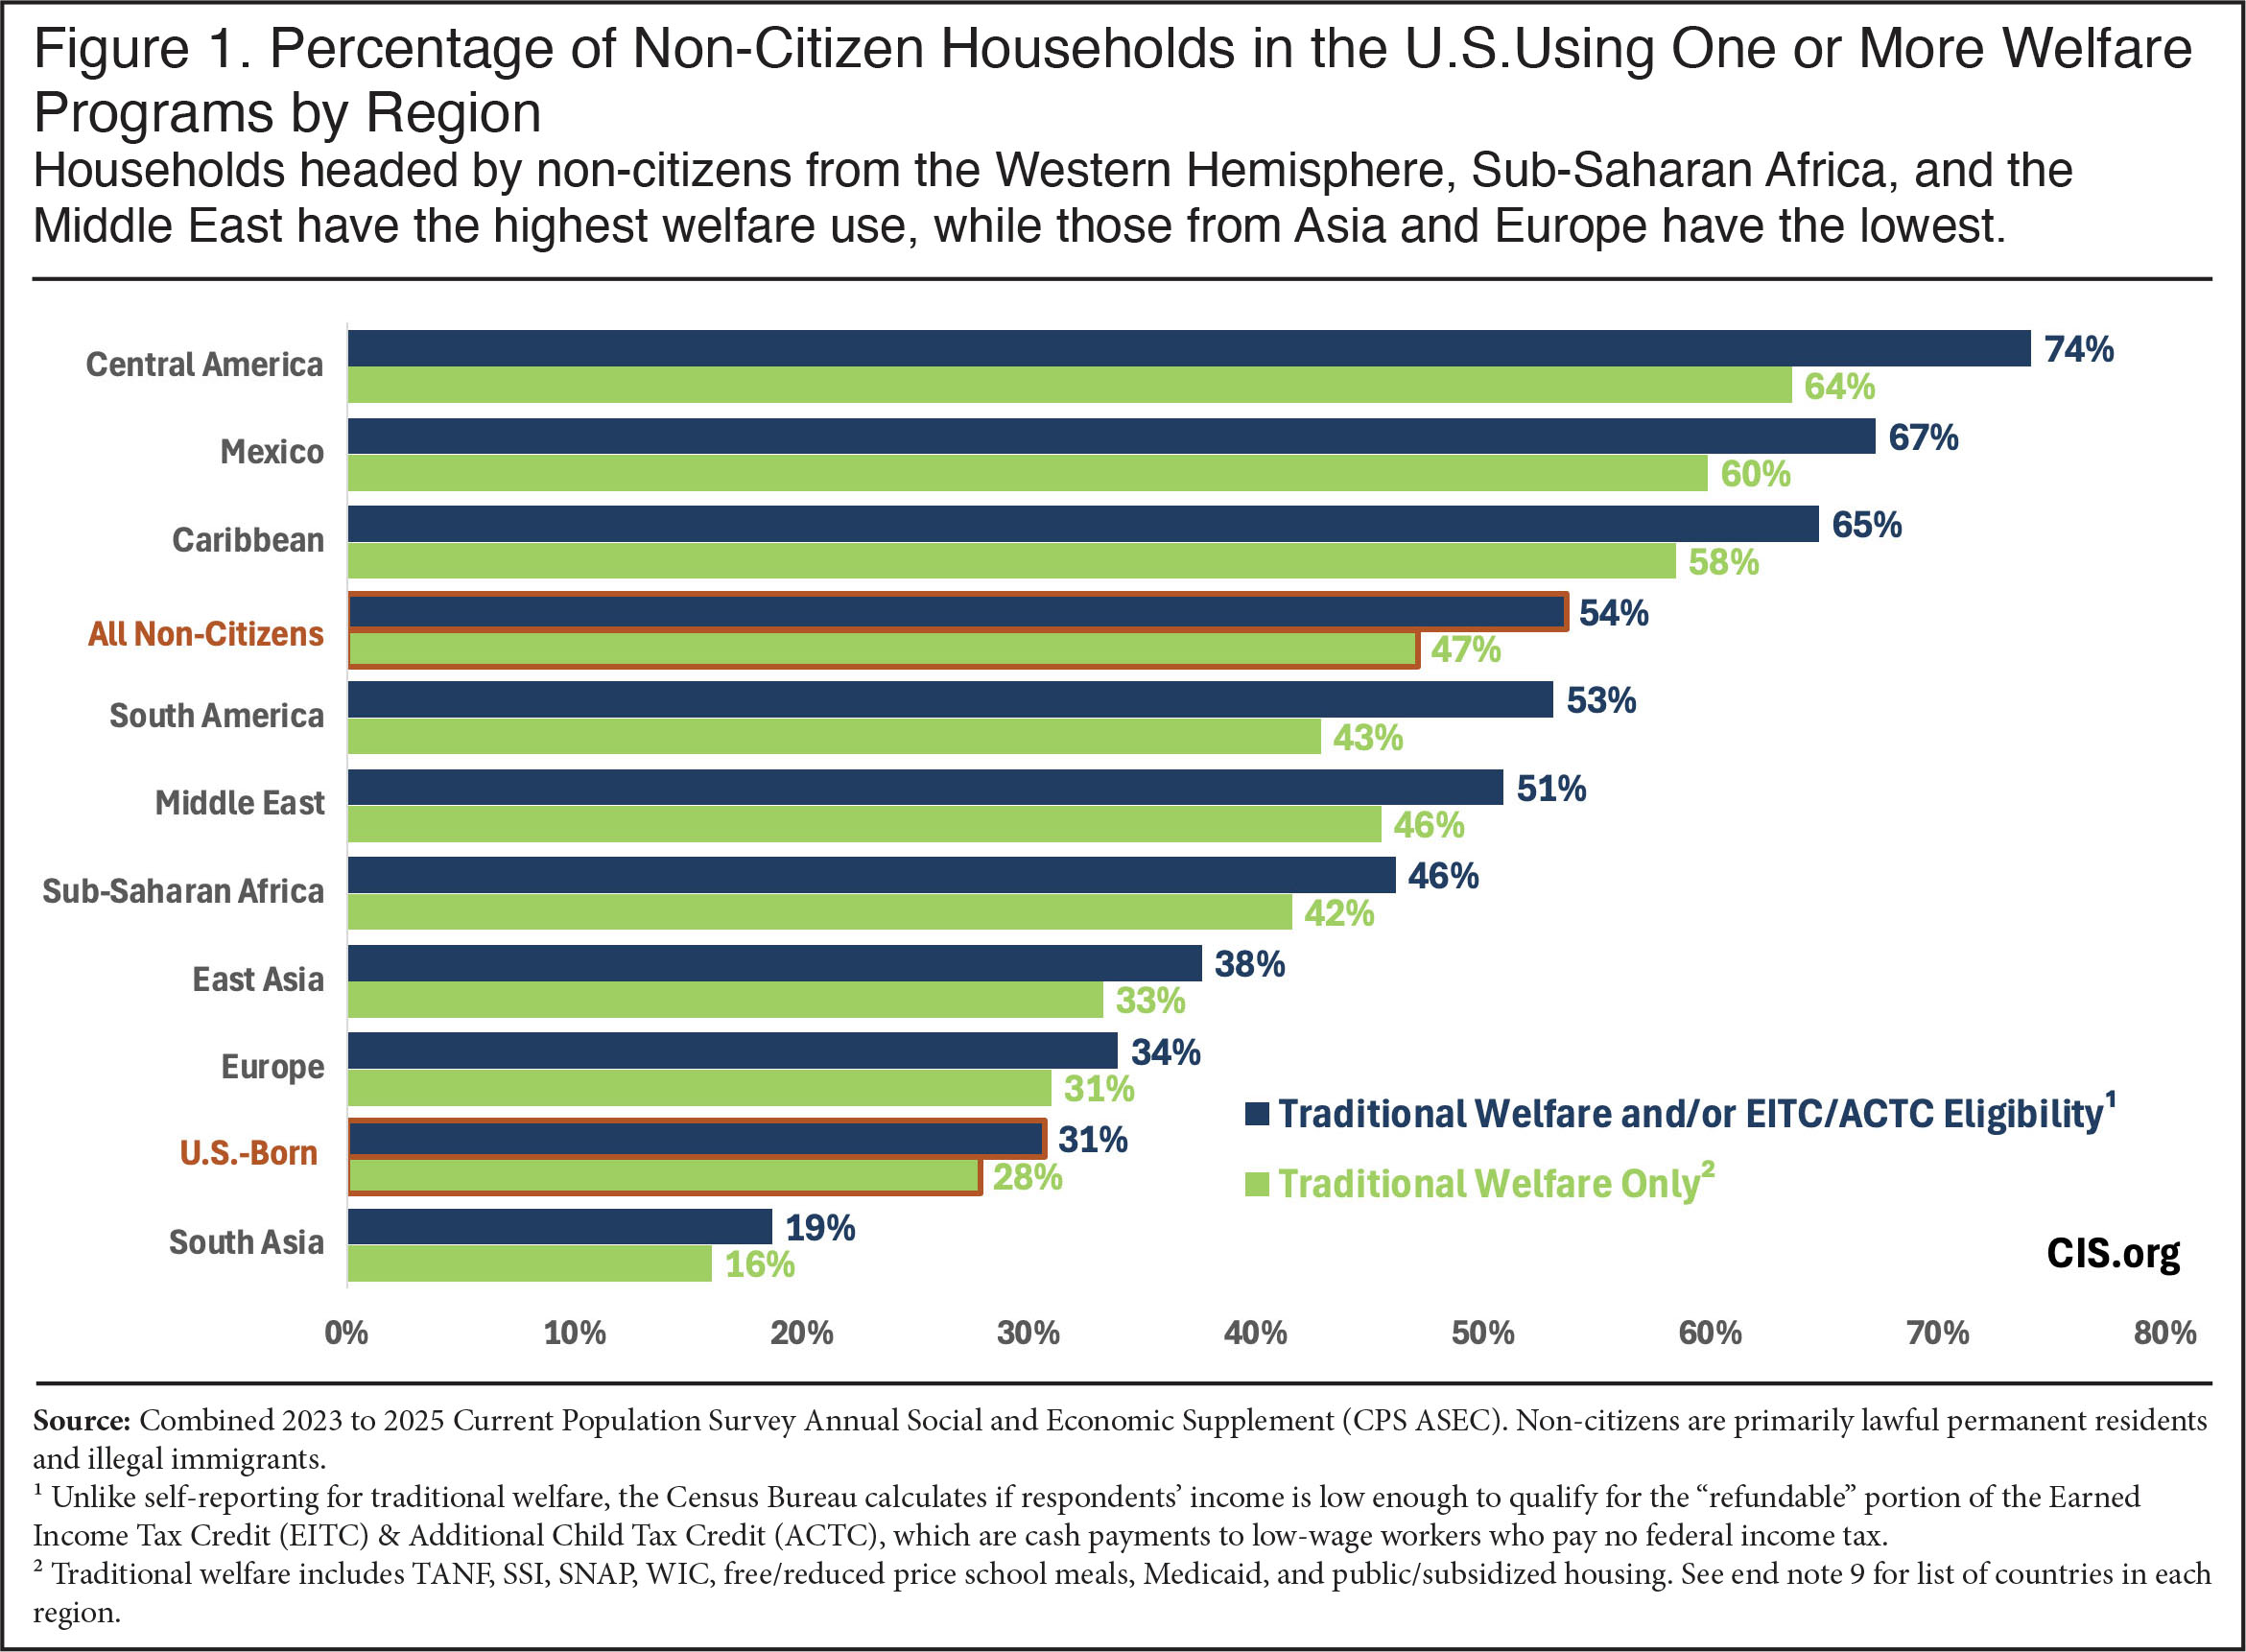 |
Figure 1 also shows very large variation in use rates by region, with a high for non-citizens from Central America at 64 percent for traditional welfare to a low of 16 percent for those from South Asia. Households headed by non-citizens from the Western Hemisphere, Sub-Saharan Africa, and the Middle East have the highest welfare use, while those from Asia and Europe have the lowest. The same pattern exists when eligibility for the EITC and ACTC is included, with 54 percent of non-citizen households using traditional welfare or having incomes low enough to qualify for the EITC/ACTC, or both. This is also well above the 31 percent for households headed by the U.S.-born. If only the EITC and ACTC are considered, then about 4 percent of native households are eligible for at least one of the programs and do not receive any traditional welfare and this is the case for 12 percent of non-citizen households.
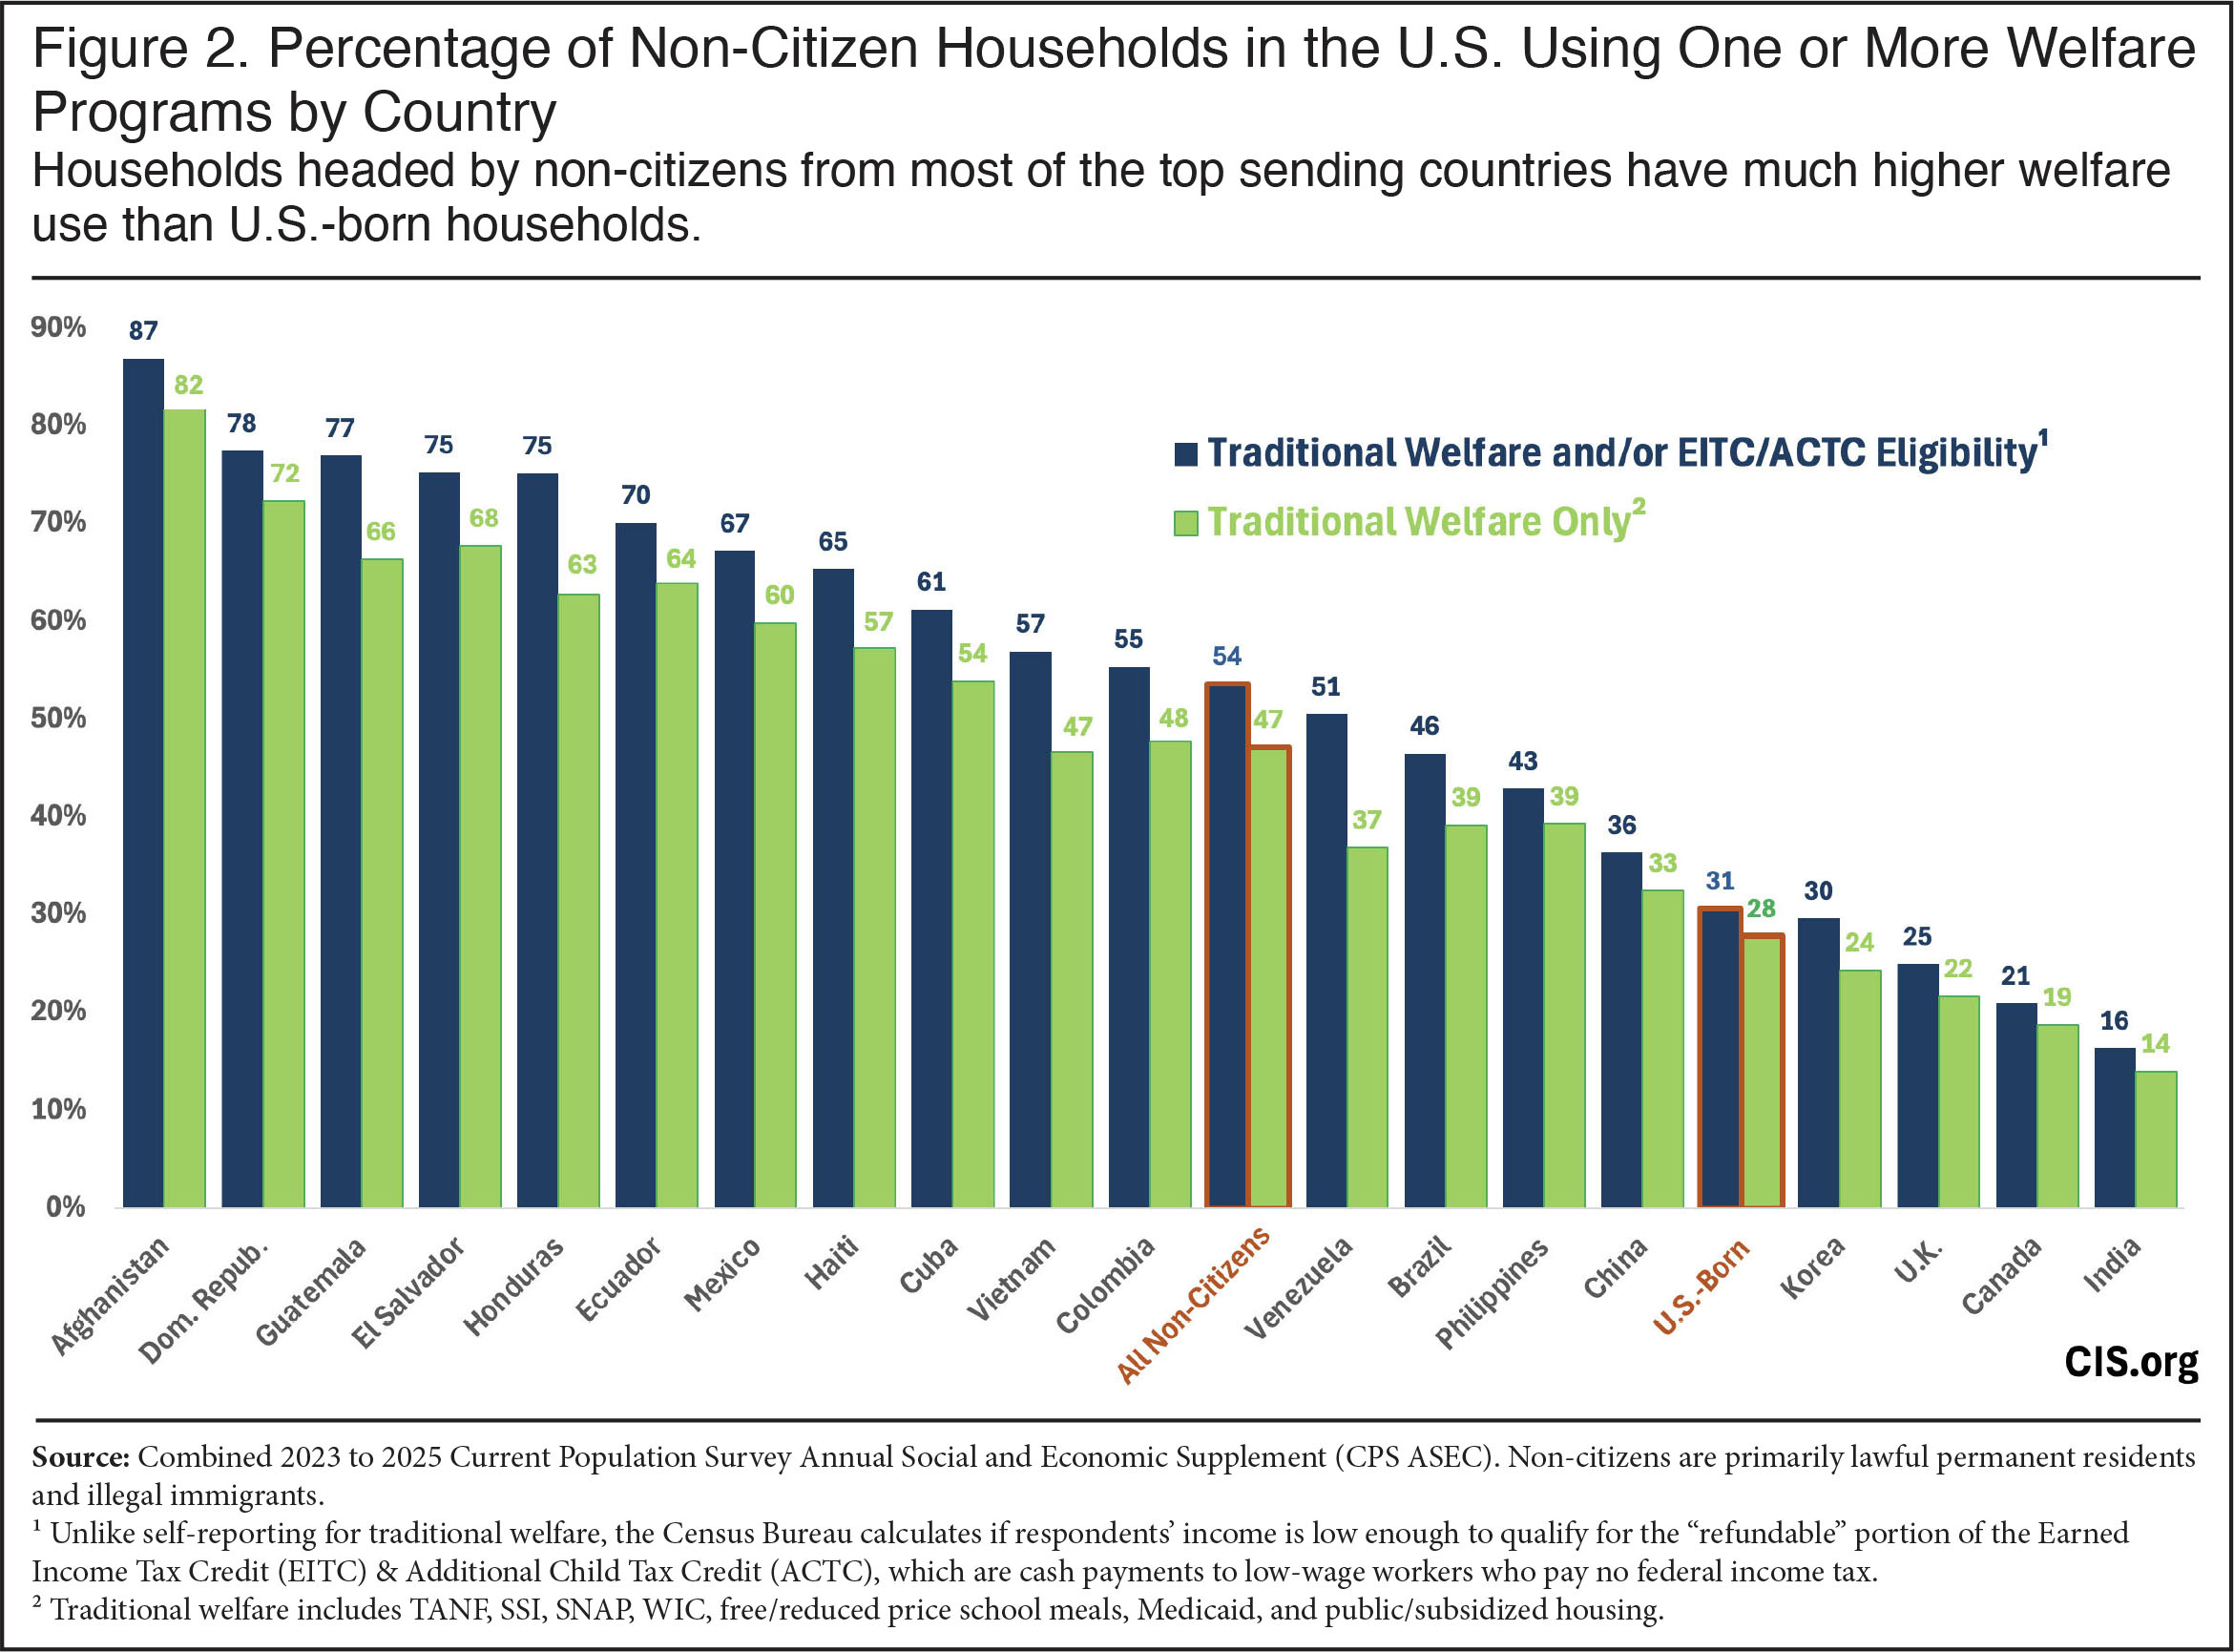
Welfare Use by Country. Figure 2 reports the same information as Figure 1 except instead of regions the figure shows the share of non-citizen households from top sending countries that use traditional welfare or have incomes low enough to qualify for the EITC/ACTC, or both. Non-citizen households from Latin American countries like the Dominican Republic, Guatemala, El Salvador, Honduras, and Mexico tend to have the highest welfare use. This is the case whether only traditional welfare is considered or if eligibility for the EITC and ACTC is included. Outside of the western hemisphere, households headed by non-citizens from Afghanistan and Vietnam have the highest welfare use by sending countries. Households headed by non-citizens from Korea, the United Kingdom, Canada, and India have the lowest use rates.
 |
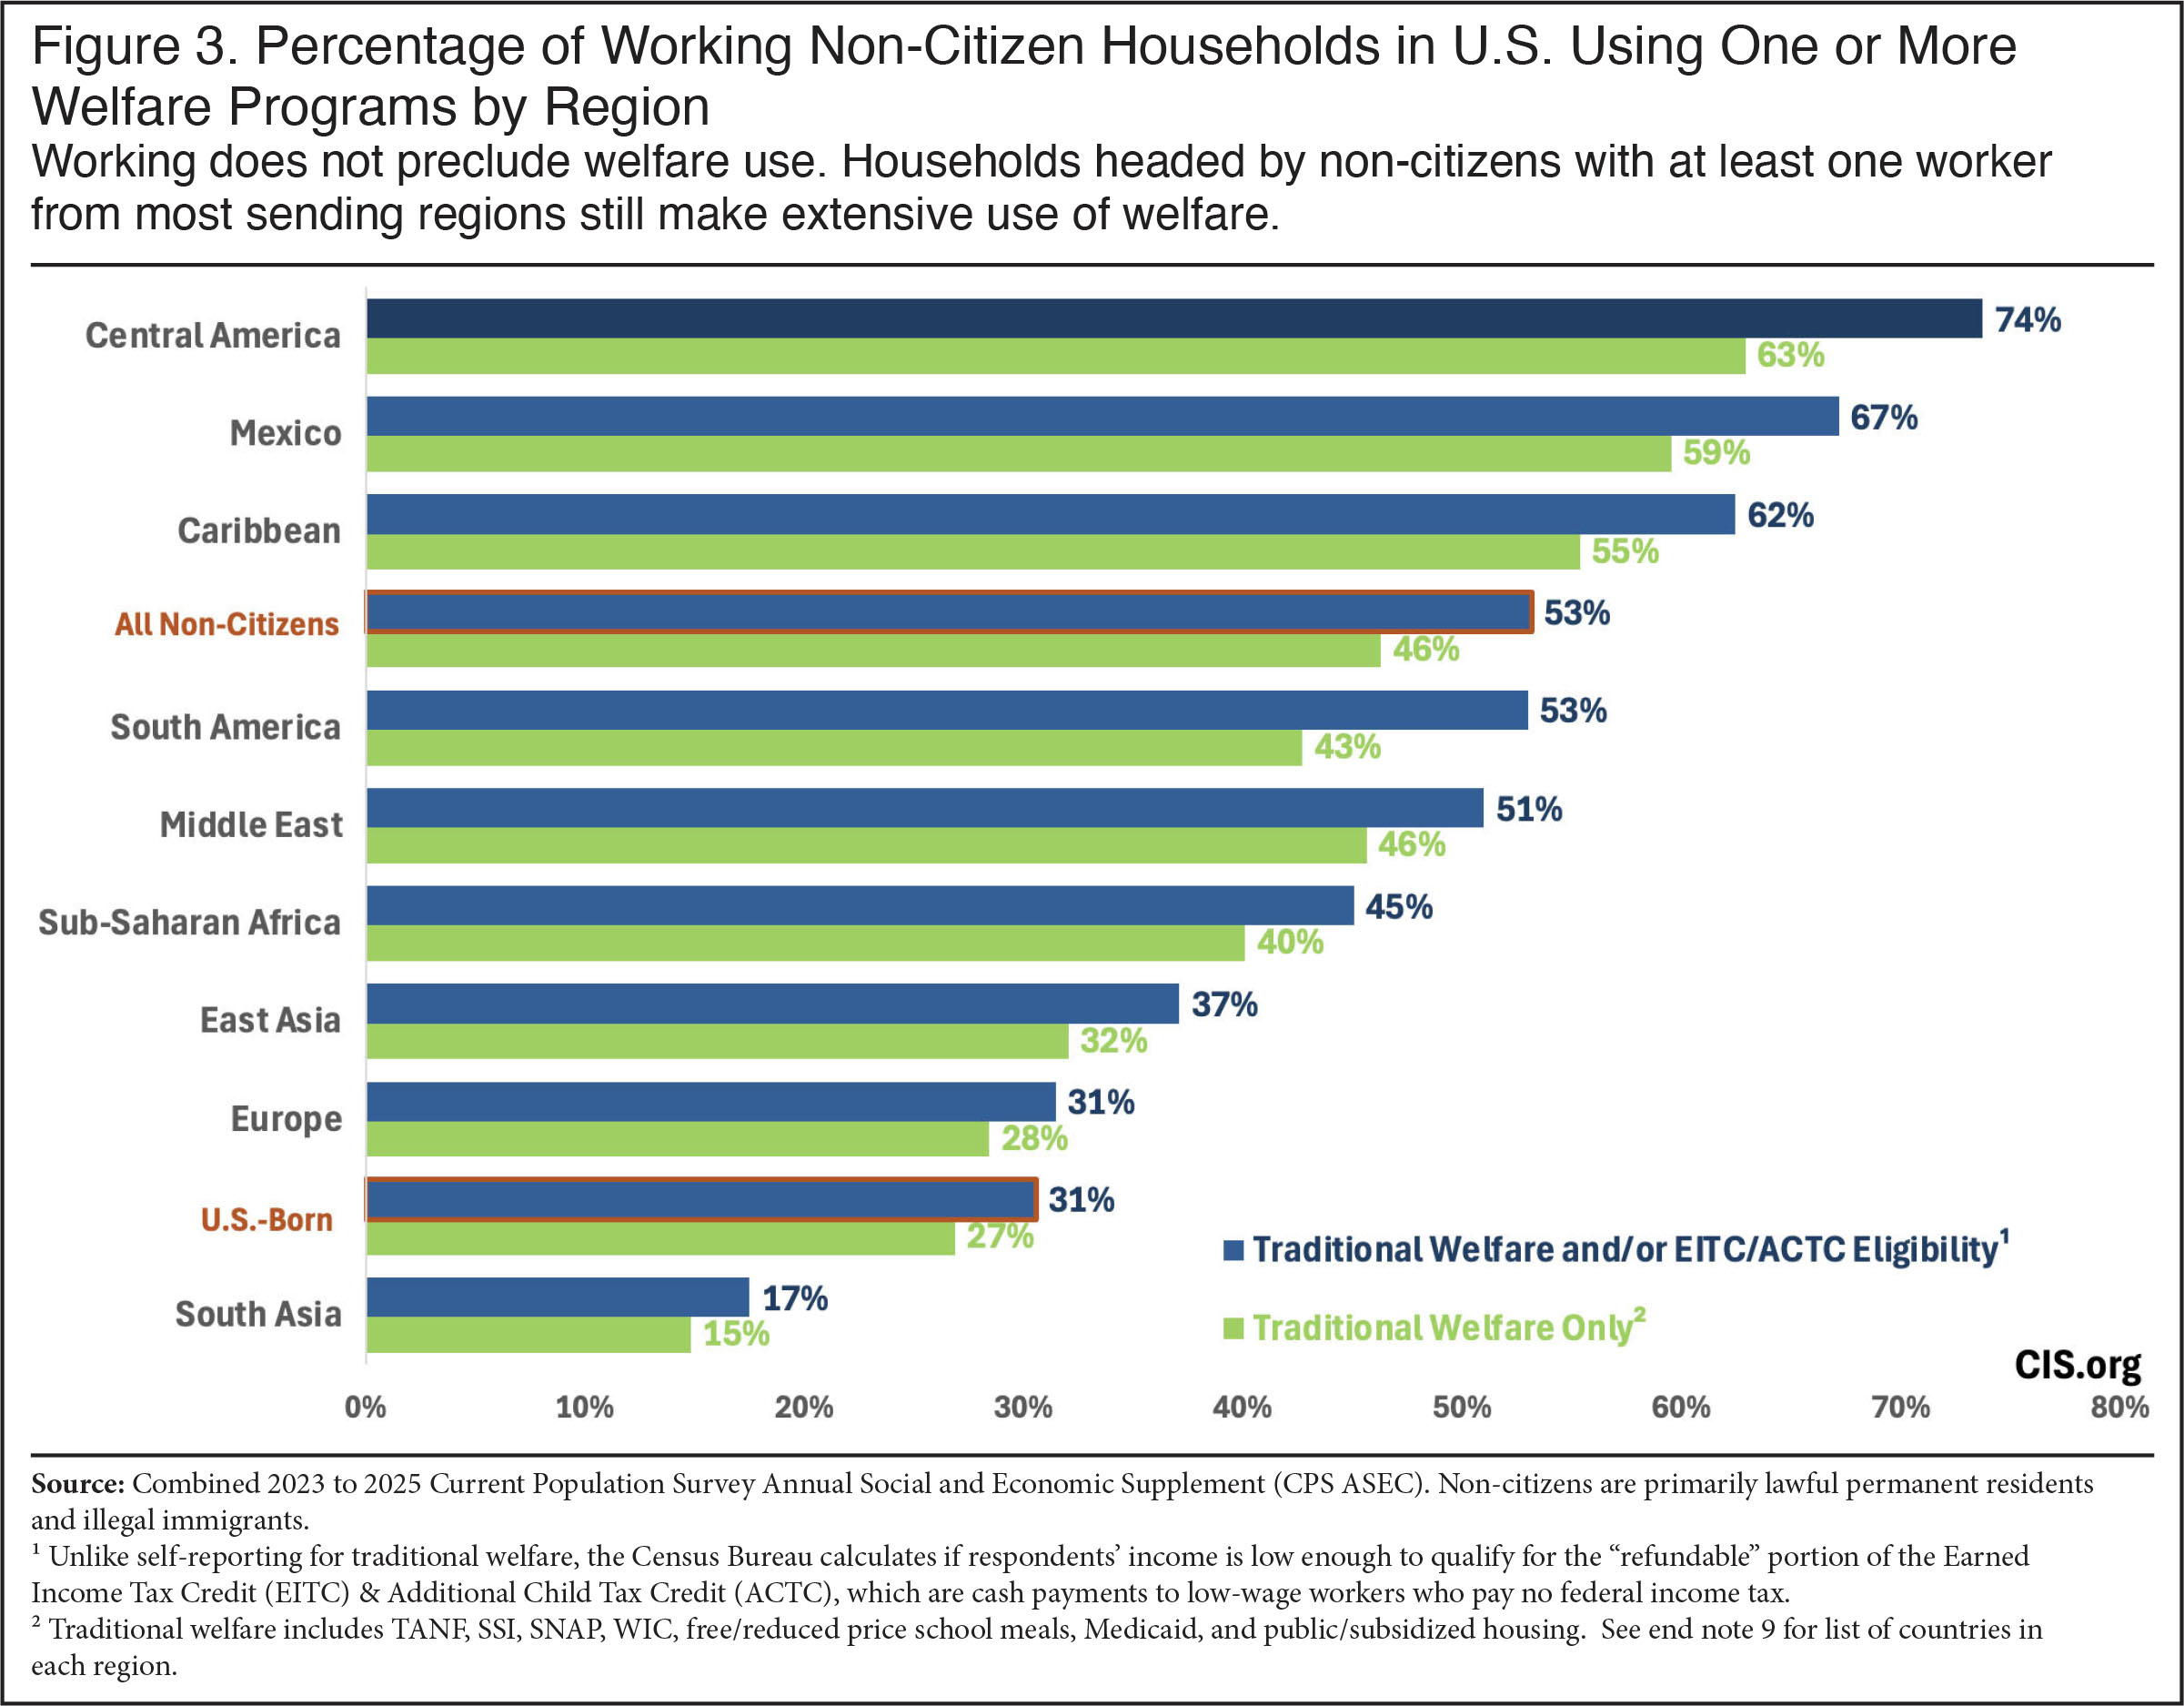
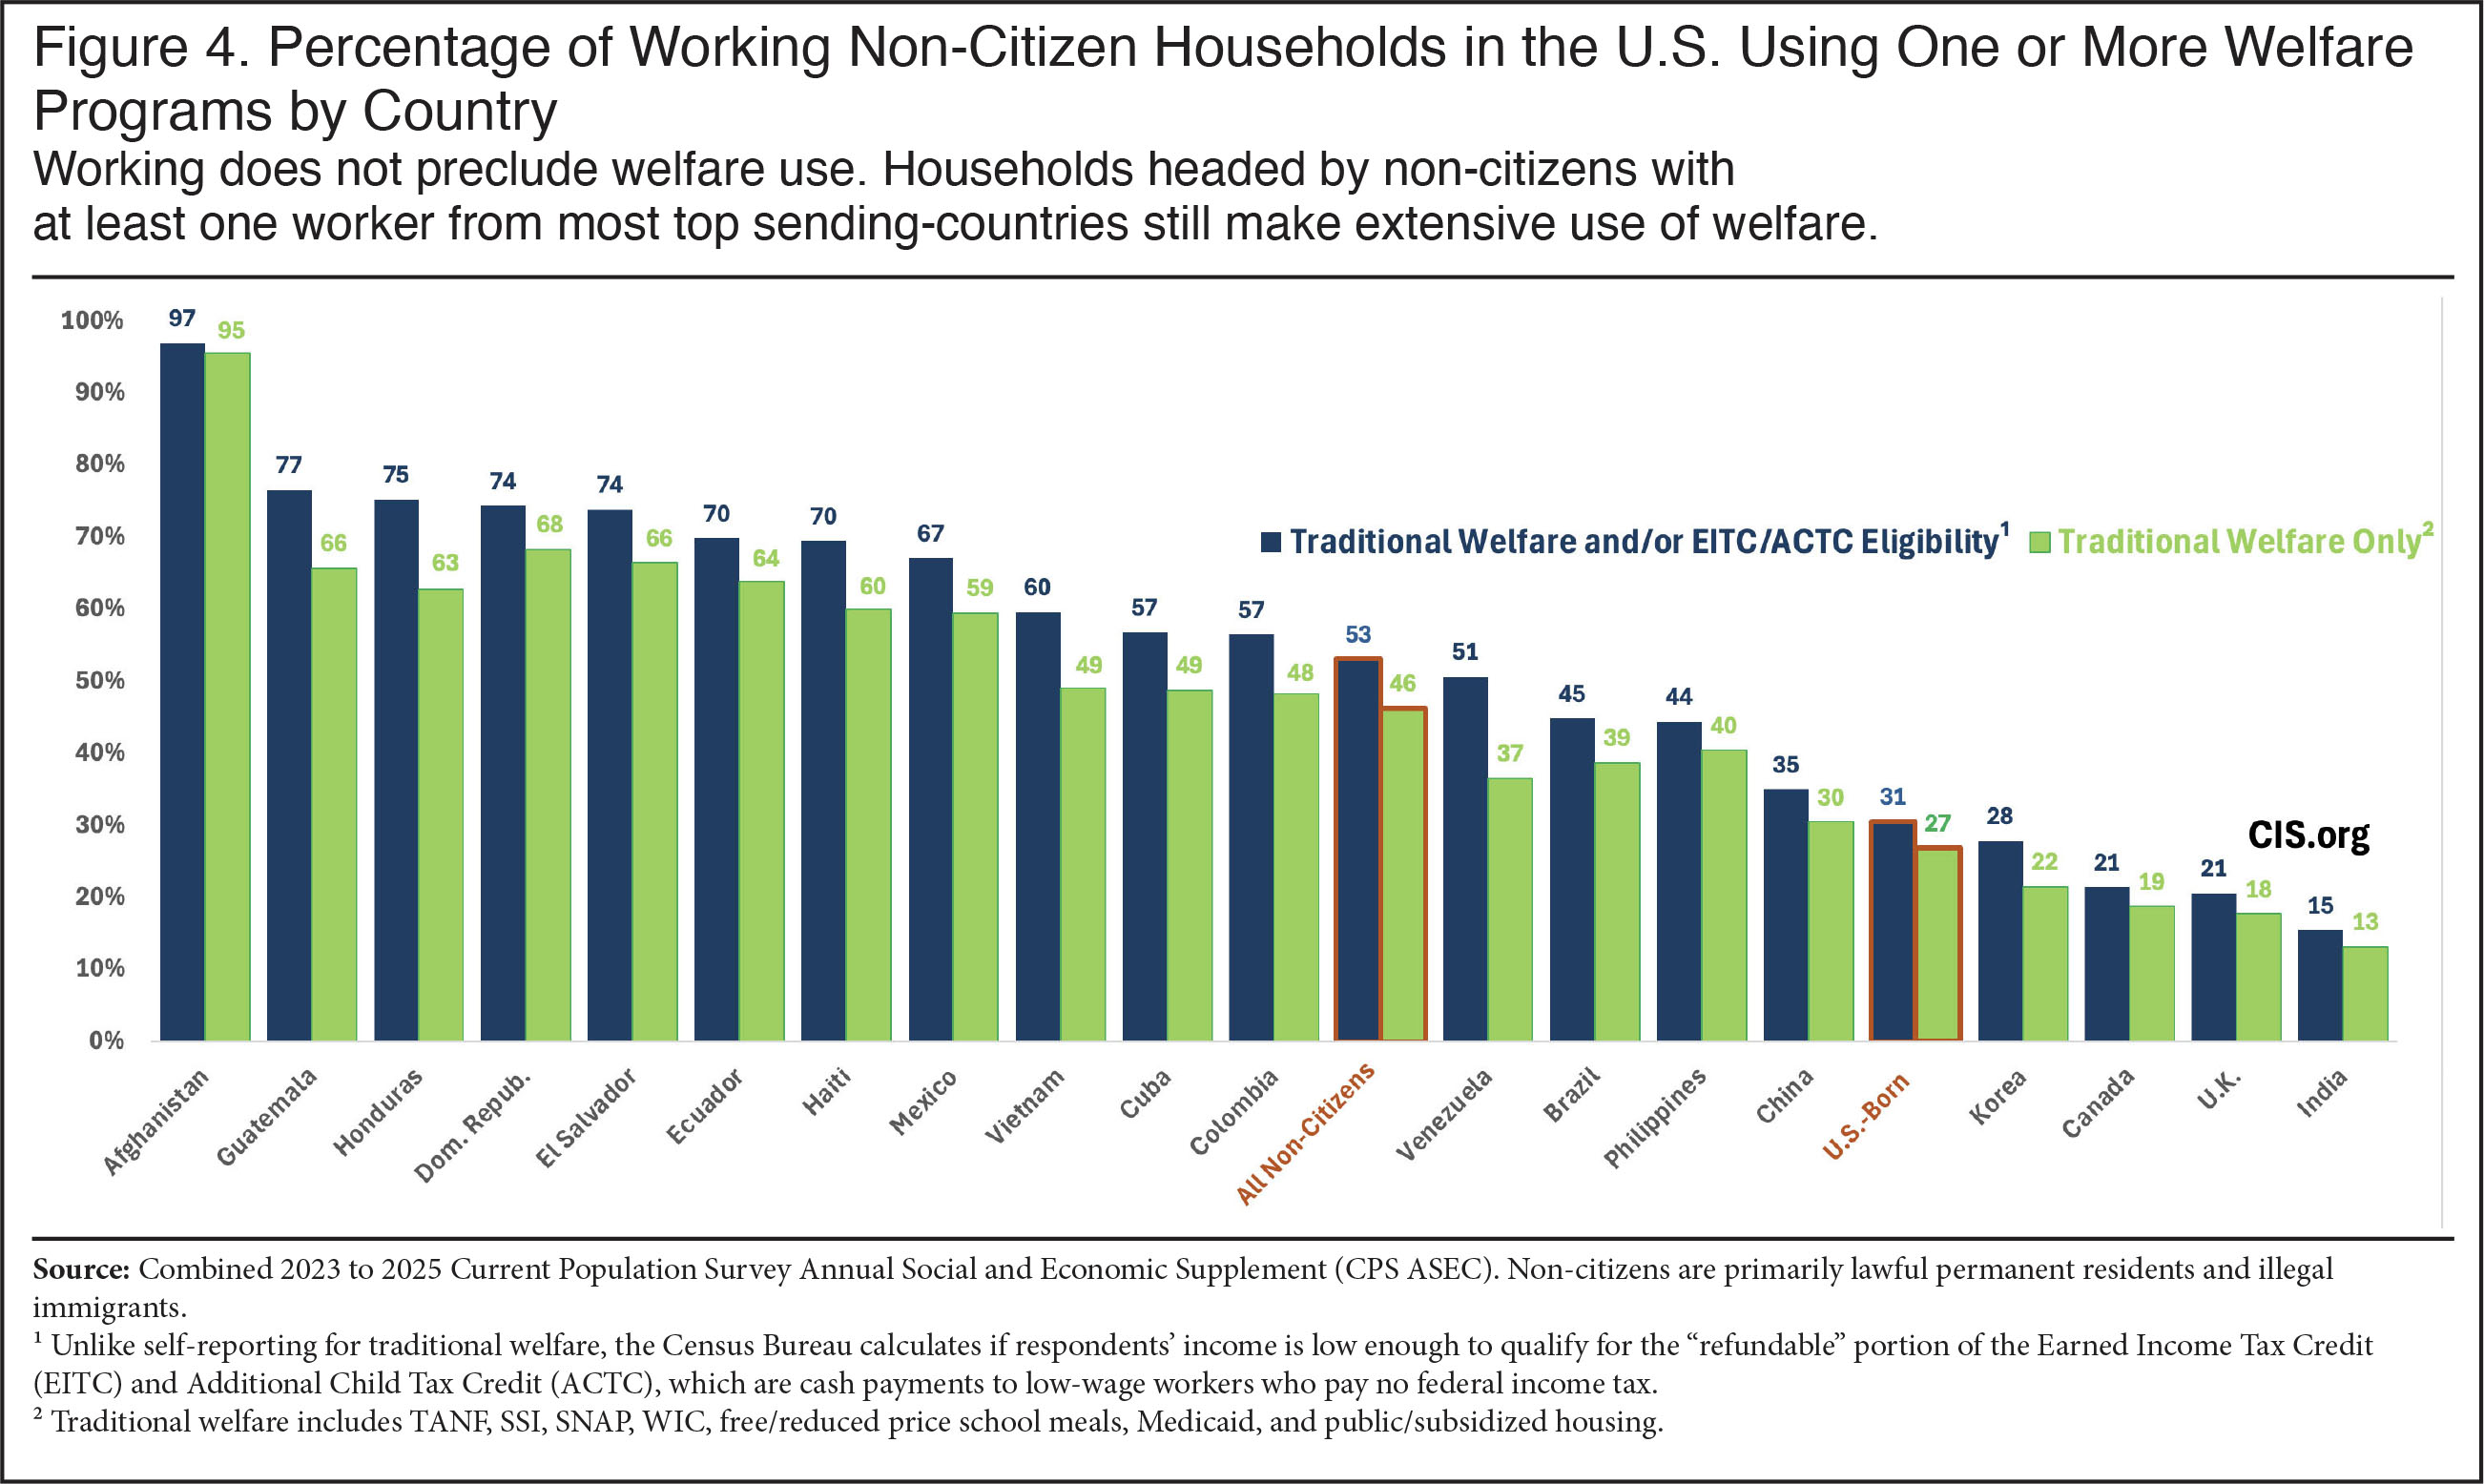
Welfare Use for Working Households. There is a common misperception that welfare is primarily for those who do not work. In fact, one of the primary goals of the American welfare system is to assist low-wage workers, particularly those with children. Figures 3 and 4 report the share of working households headed by non-citizens by region and country of birth using one or more welfare programs. Excel Table 2 provides much more detailed information for working households. What is so striking about Figures 3 and 4 is that they look extremely similar to Figures 1 and 2, which reported welfare use for all non-citizen households. Of working non-citizen households, 46 percent use one or more traditional welfare programs, and it rises to 53 percent when eligibility for the EITC and ACTC is included. This is almost exactly the same as the 47 percent for traditional welfare and 54 percent when the EITC and ACTC are included for all households. Work in no way precludes welfare use. It is worth noting that non-citizen households are more likely to have at least one worker than are U.S.-born households — 88 percent vs. 70 percent. Clearly, heavy non-citizen use of means-tested programs is not explained by an unwillingness to work.
 |
 |
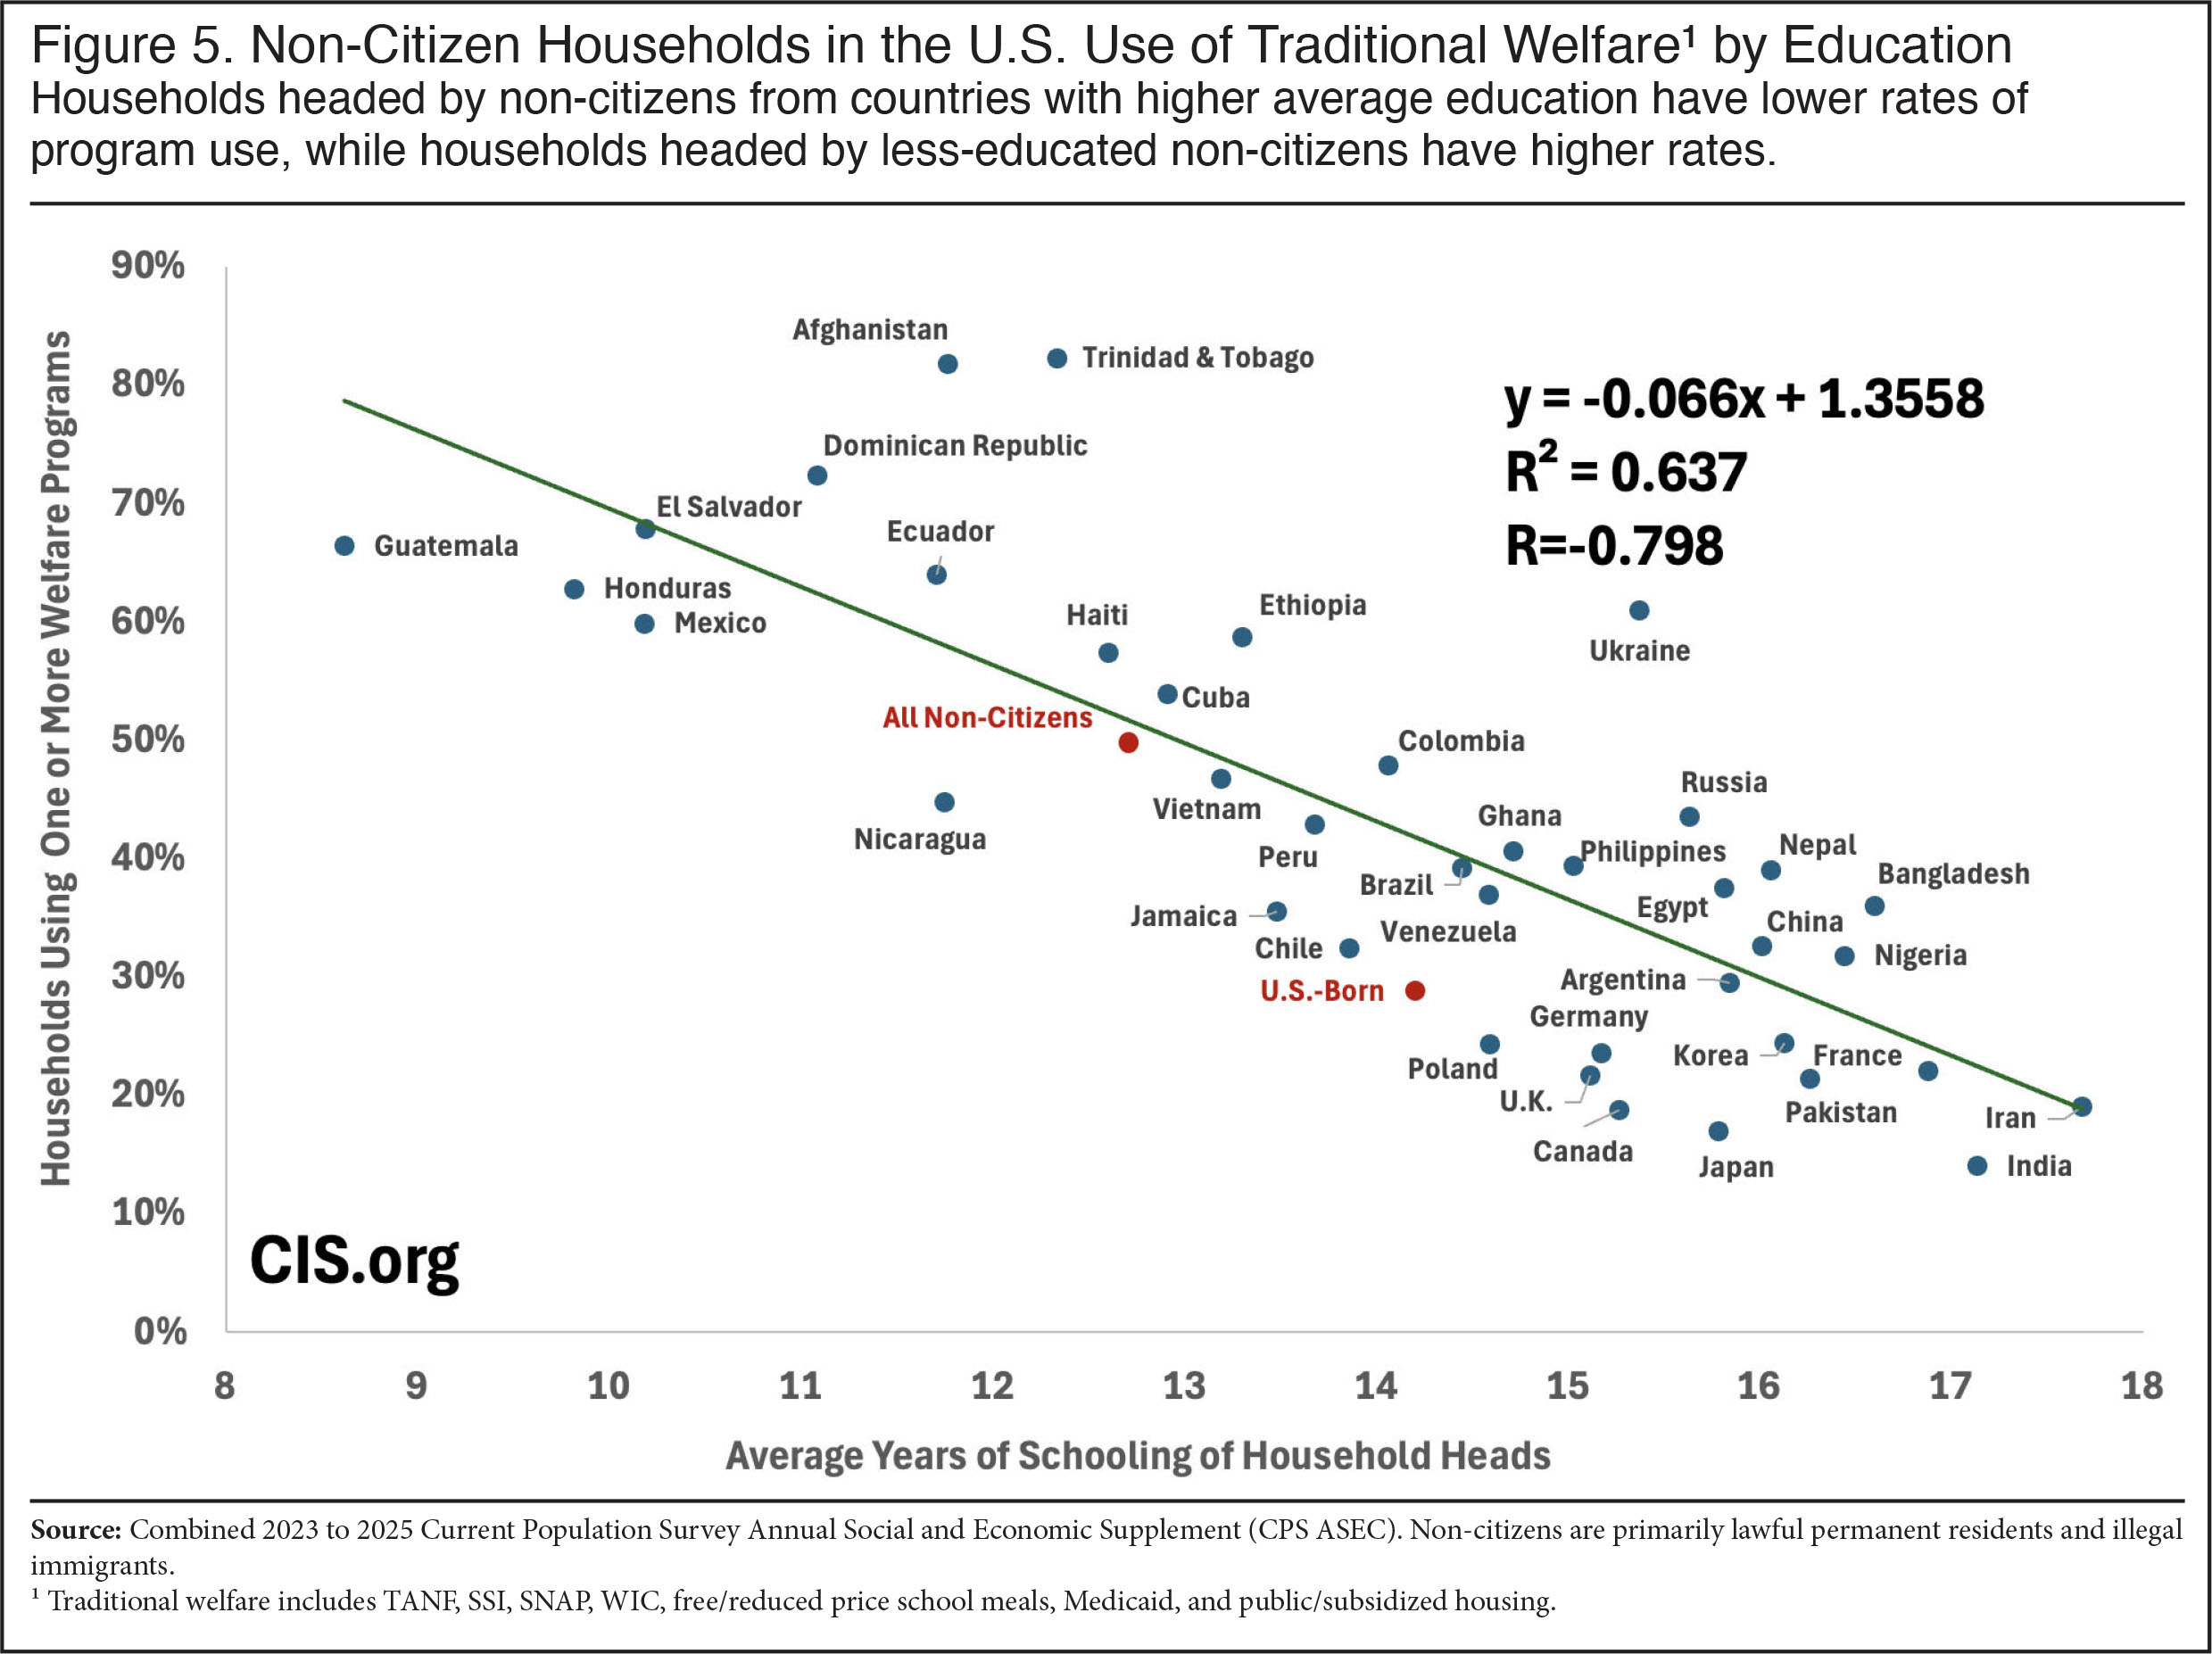
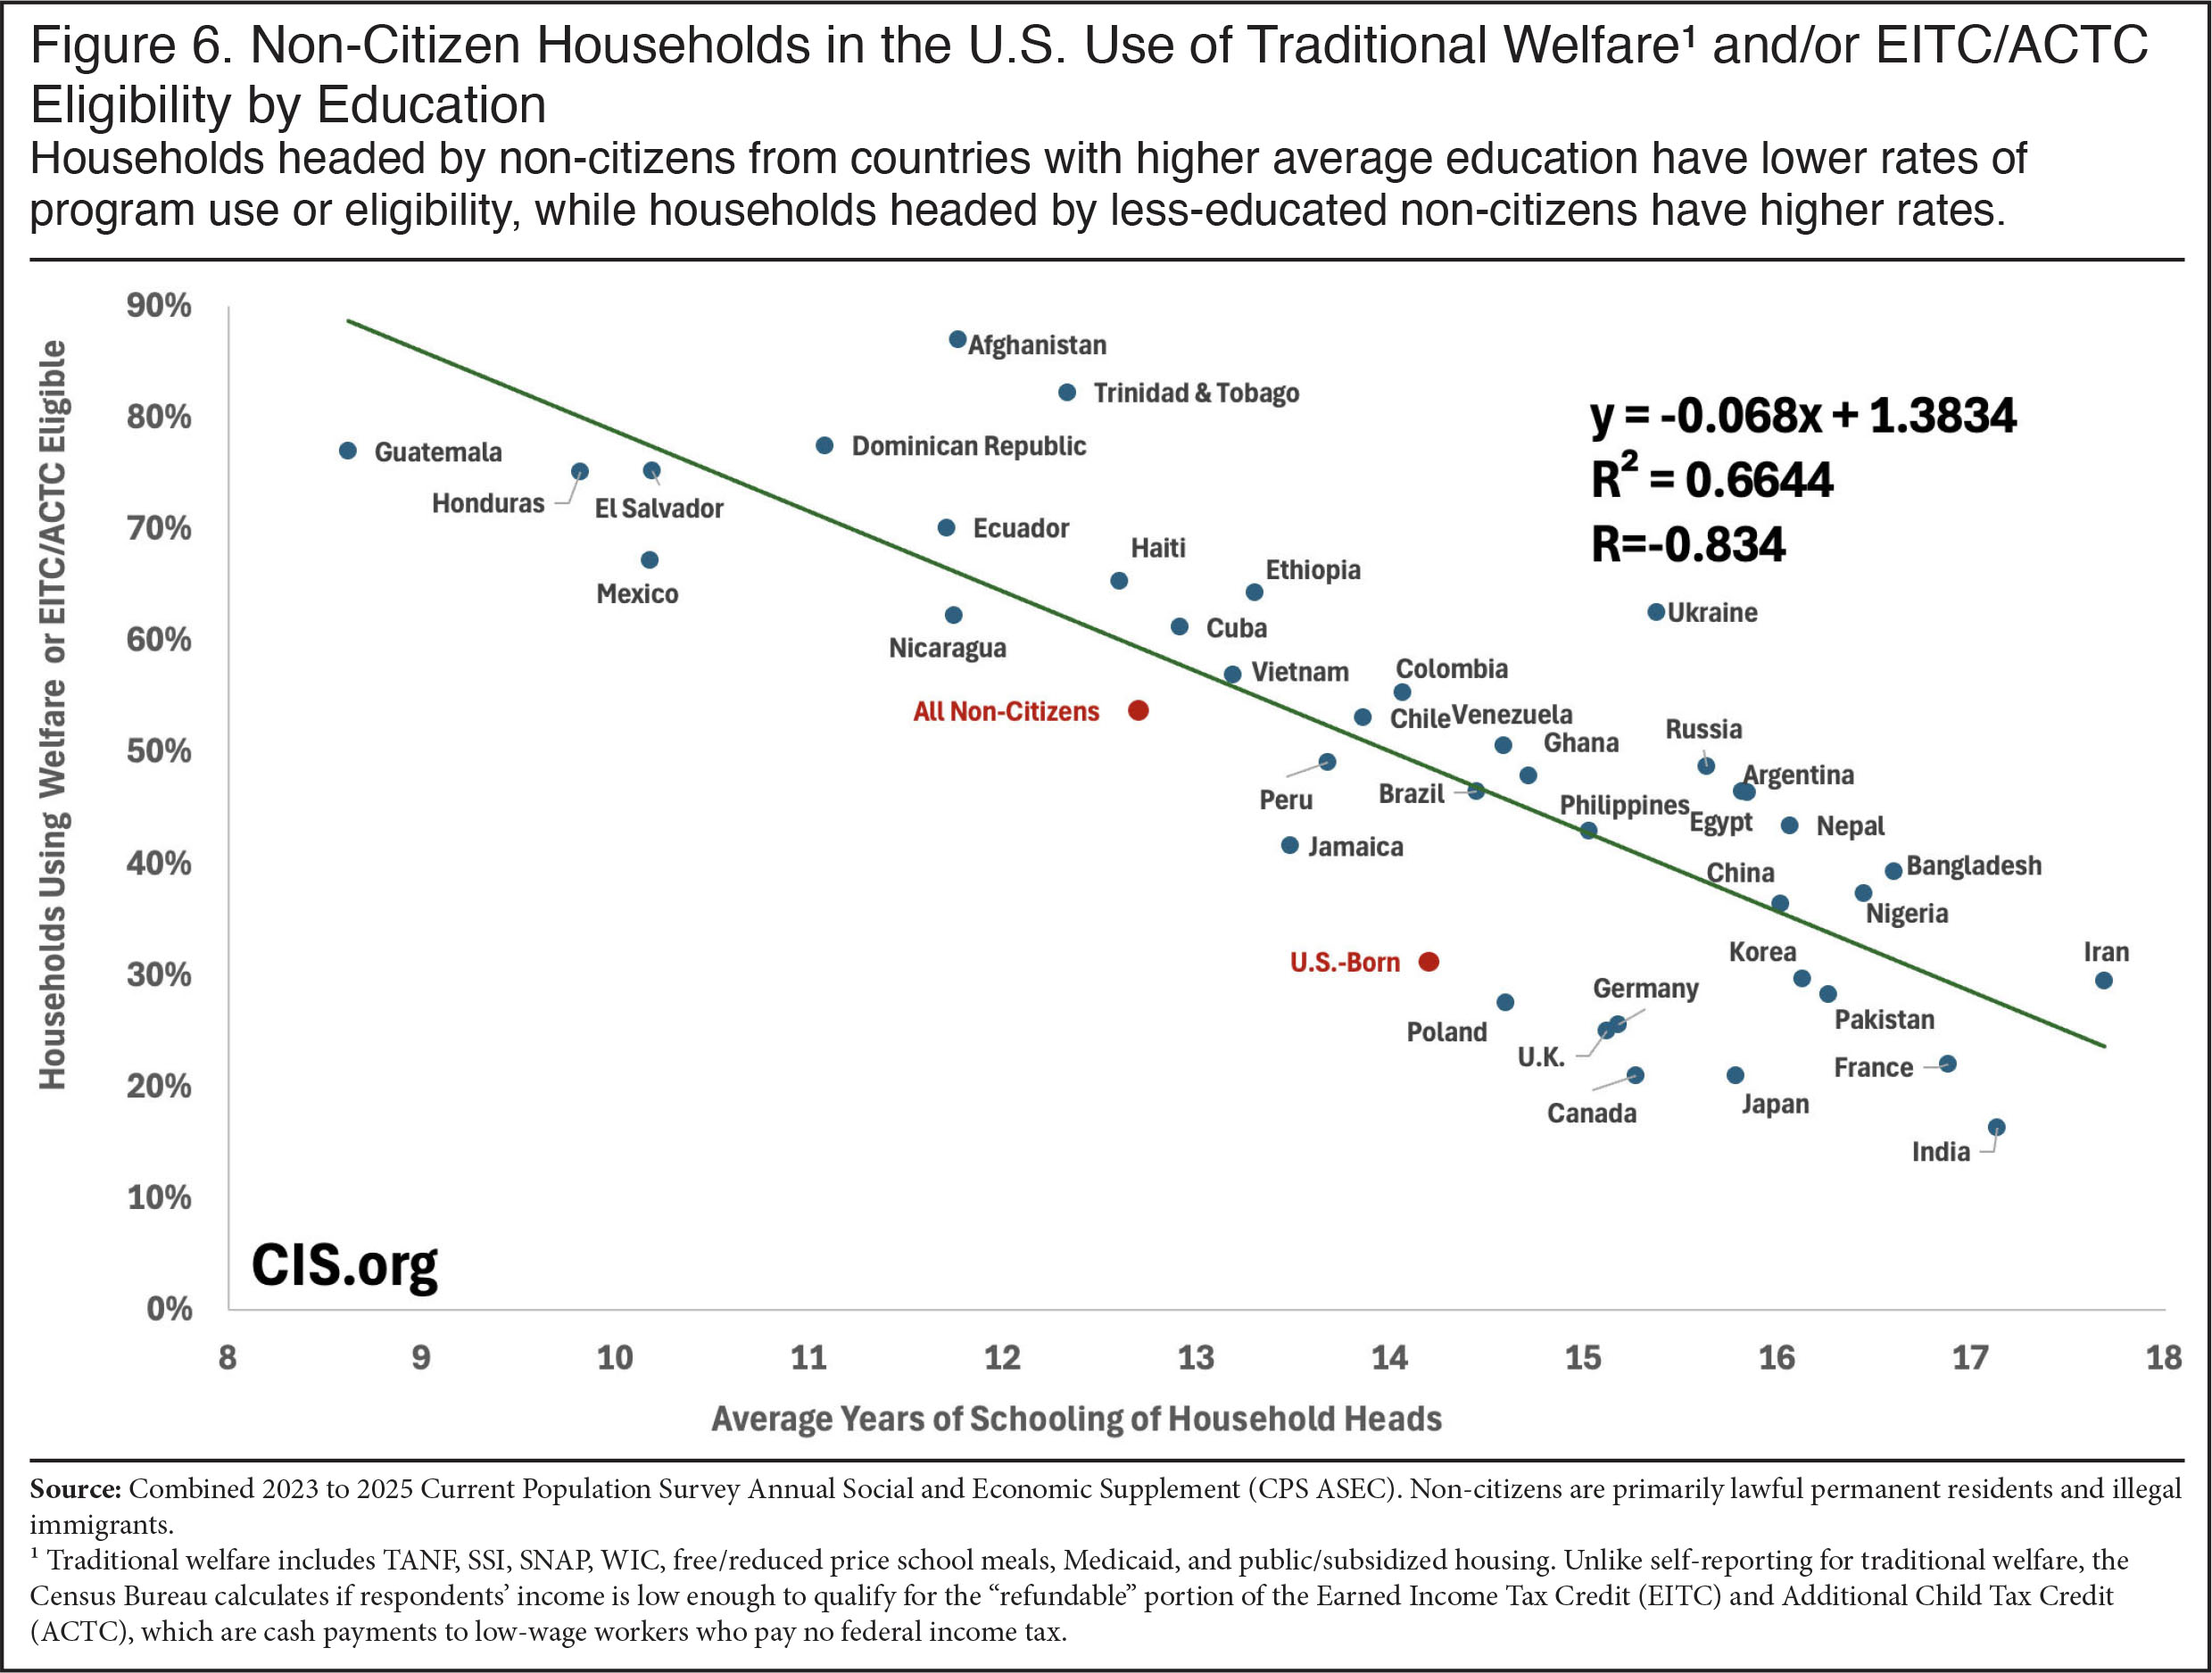
Educational Attainment and Welfare Use. In our prior research we have consistently emphasized that educational attainment is a major factor in immigrants’ income and use of the welfare system. Figure 5 shows the relationship between average years of schooling for top sending-countries and their use of traditional welfare.11 The plot shows a strong negative correlation (r = -.80) between average years of schooling of household heads by country and use of traditional welfare. Figure 6 adds in eligibility for the EITC and ACTC and the correlation increases to -.83. Further, the slope in Figures 5 and 6 are very similar, showing a one-year increase in a country’s average years of schooling is associated with a nearly seven percentage-point decrease in use of benefits. Figures 5 and 6 make clear that the education level of non-citizens is an extremely important factor in explaining use of means-tested programs by non-citizen households.12
 |
:
 |
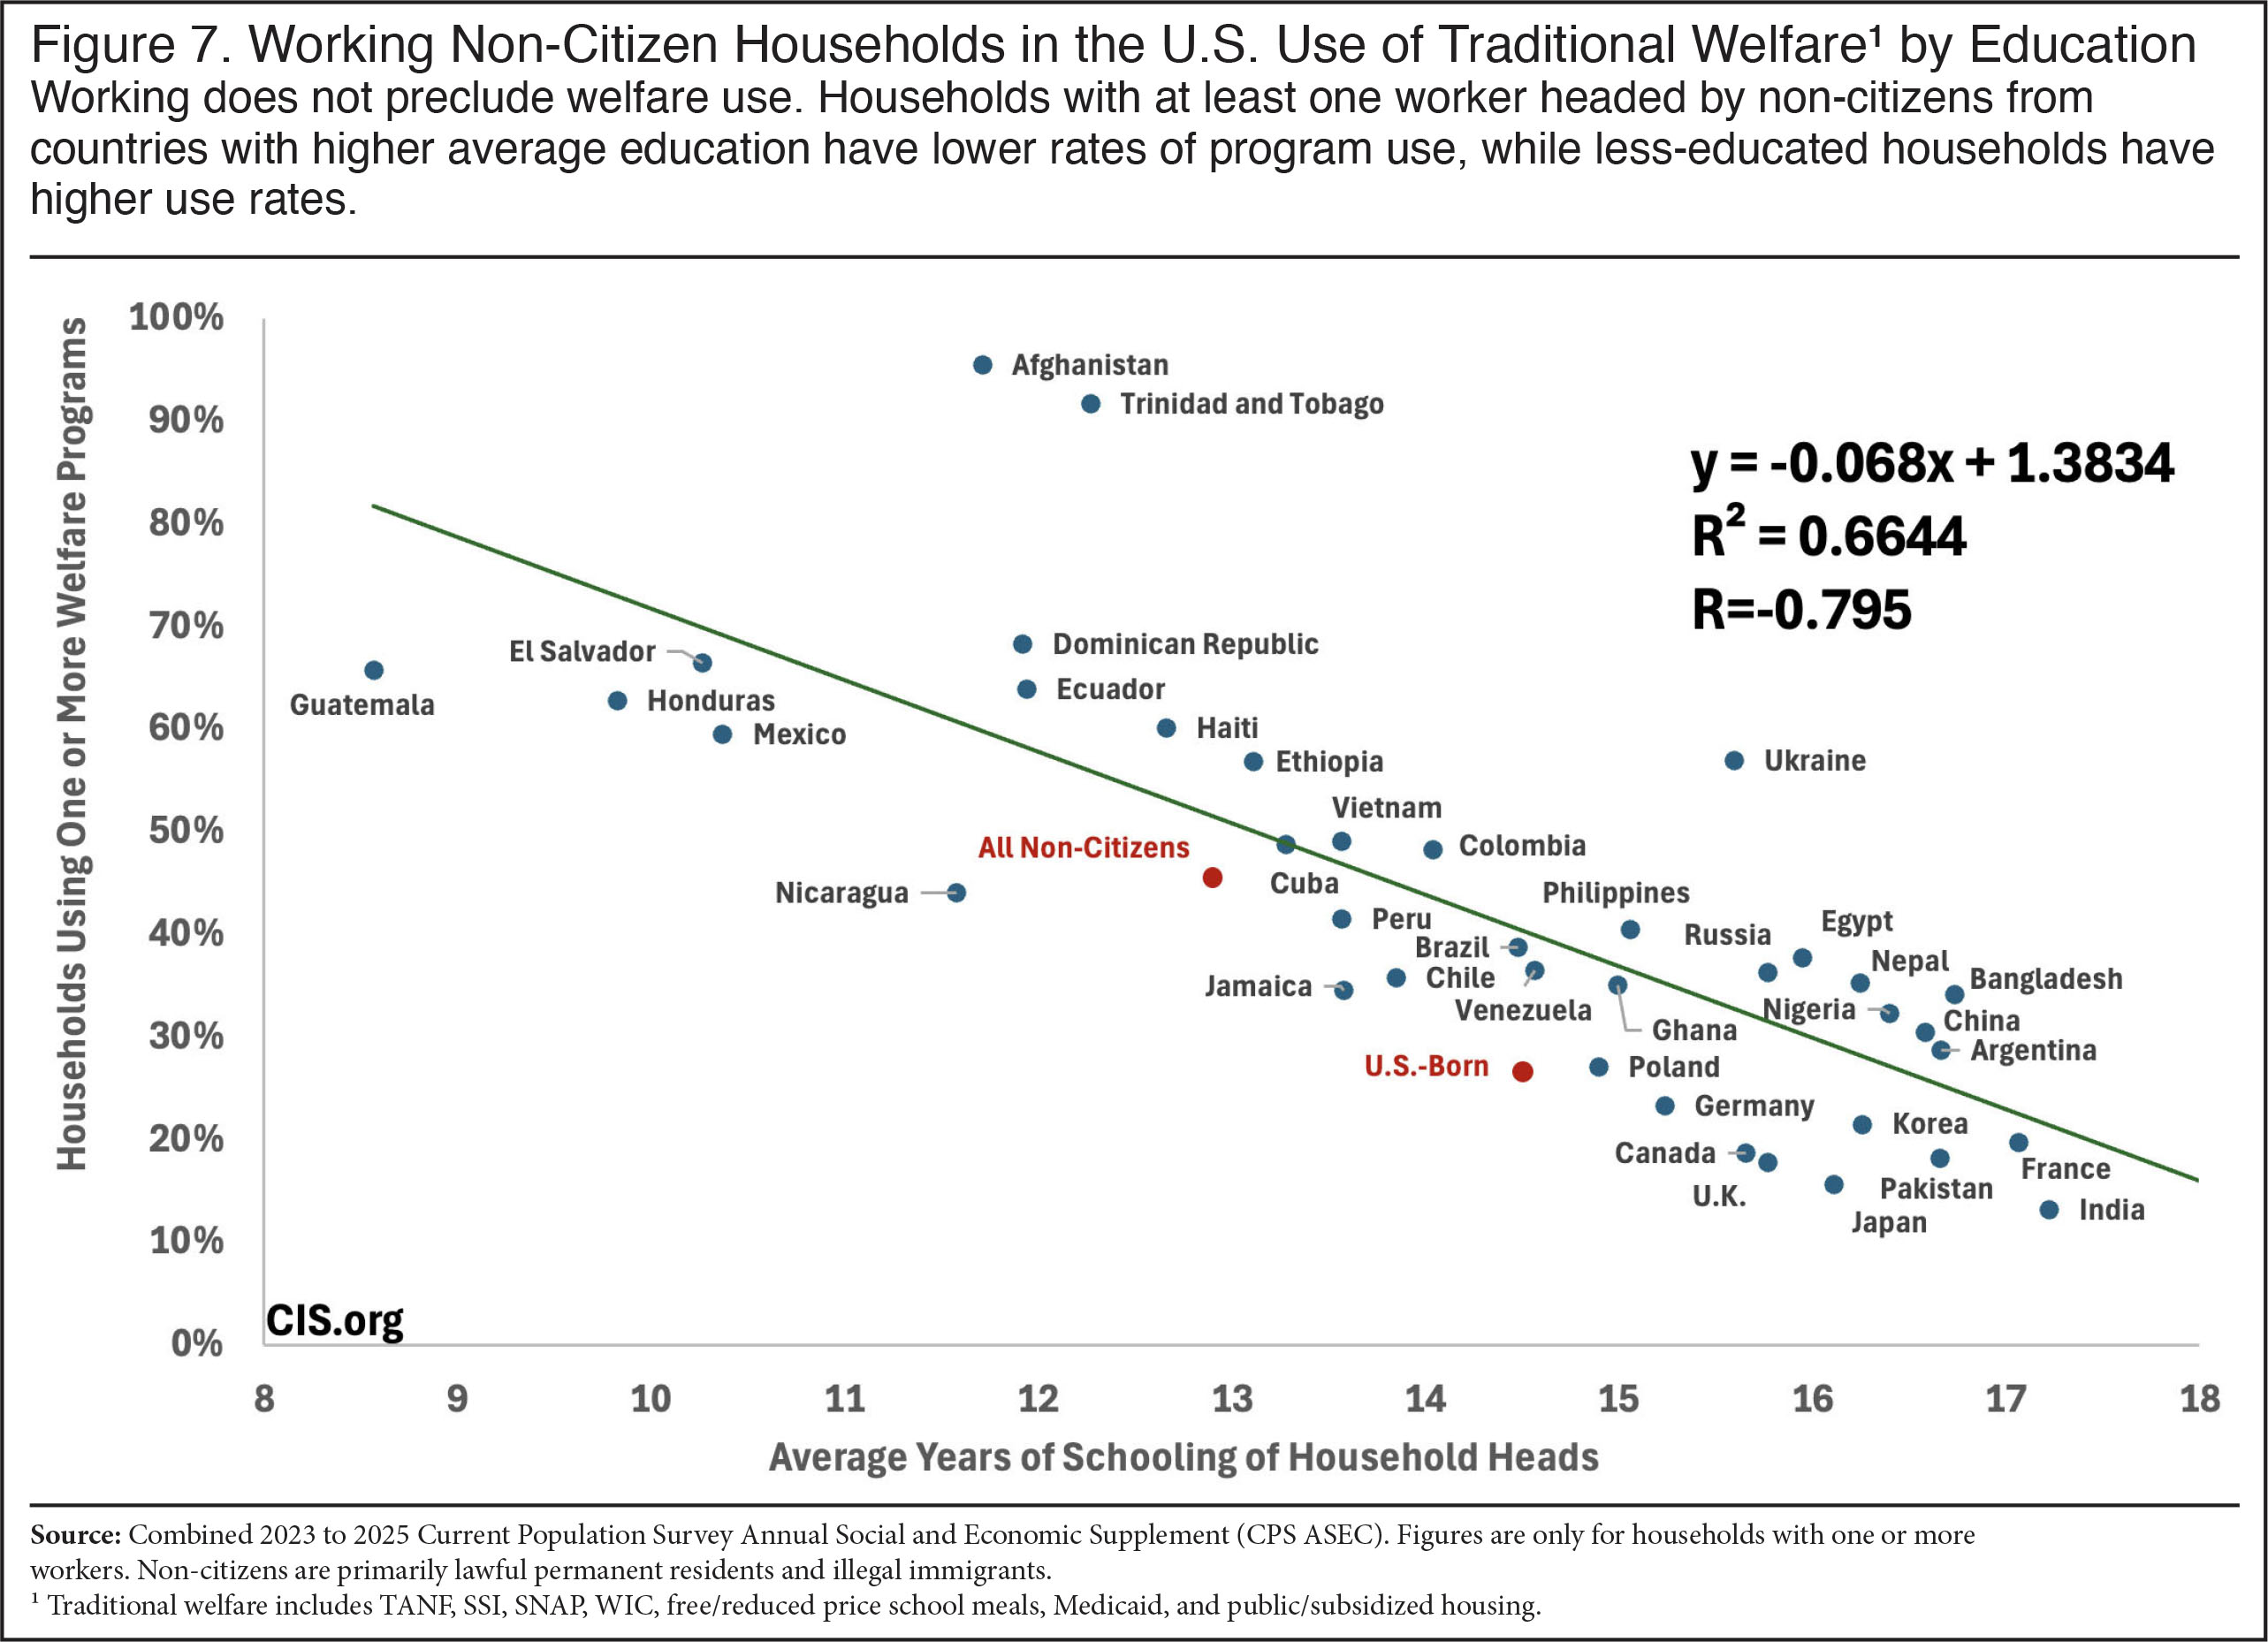
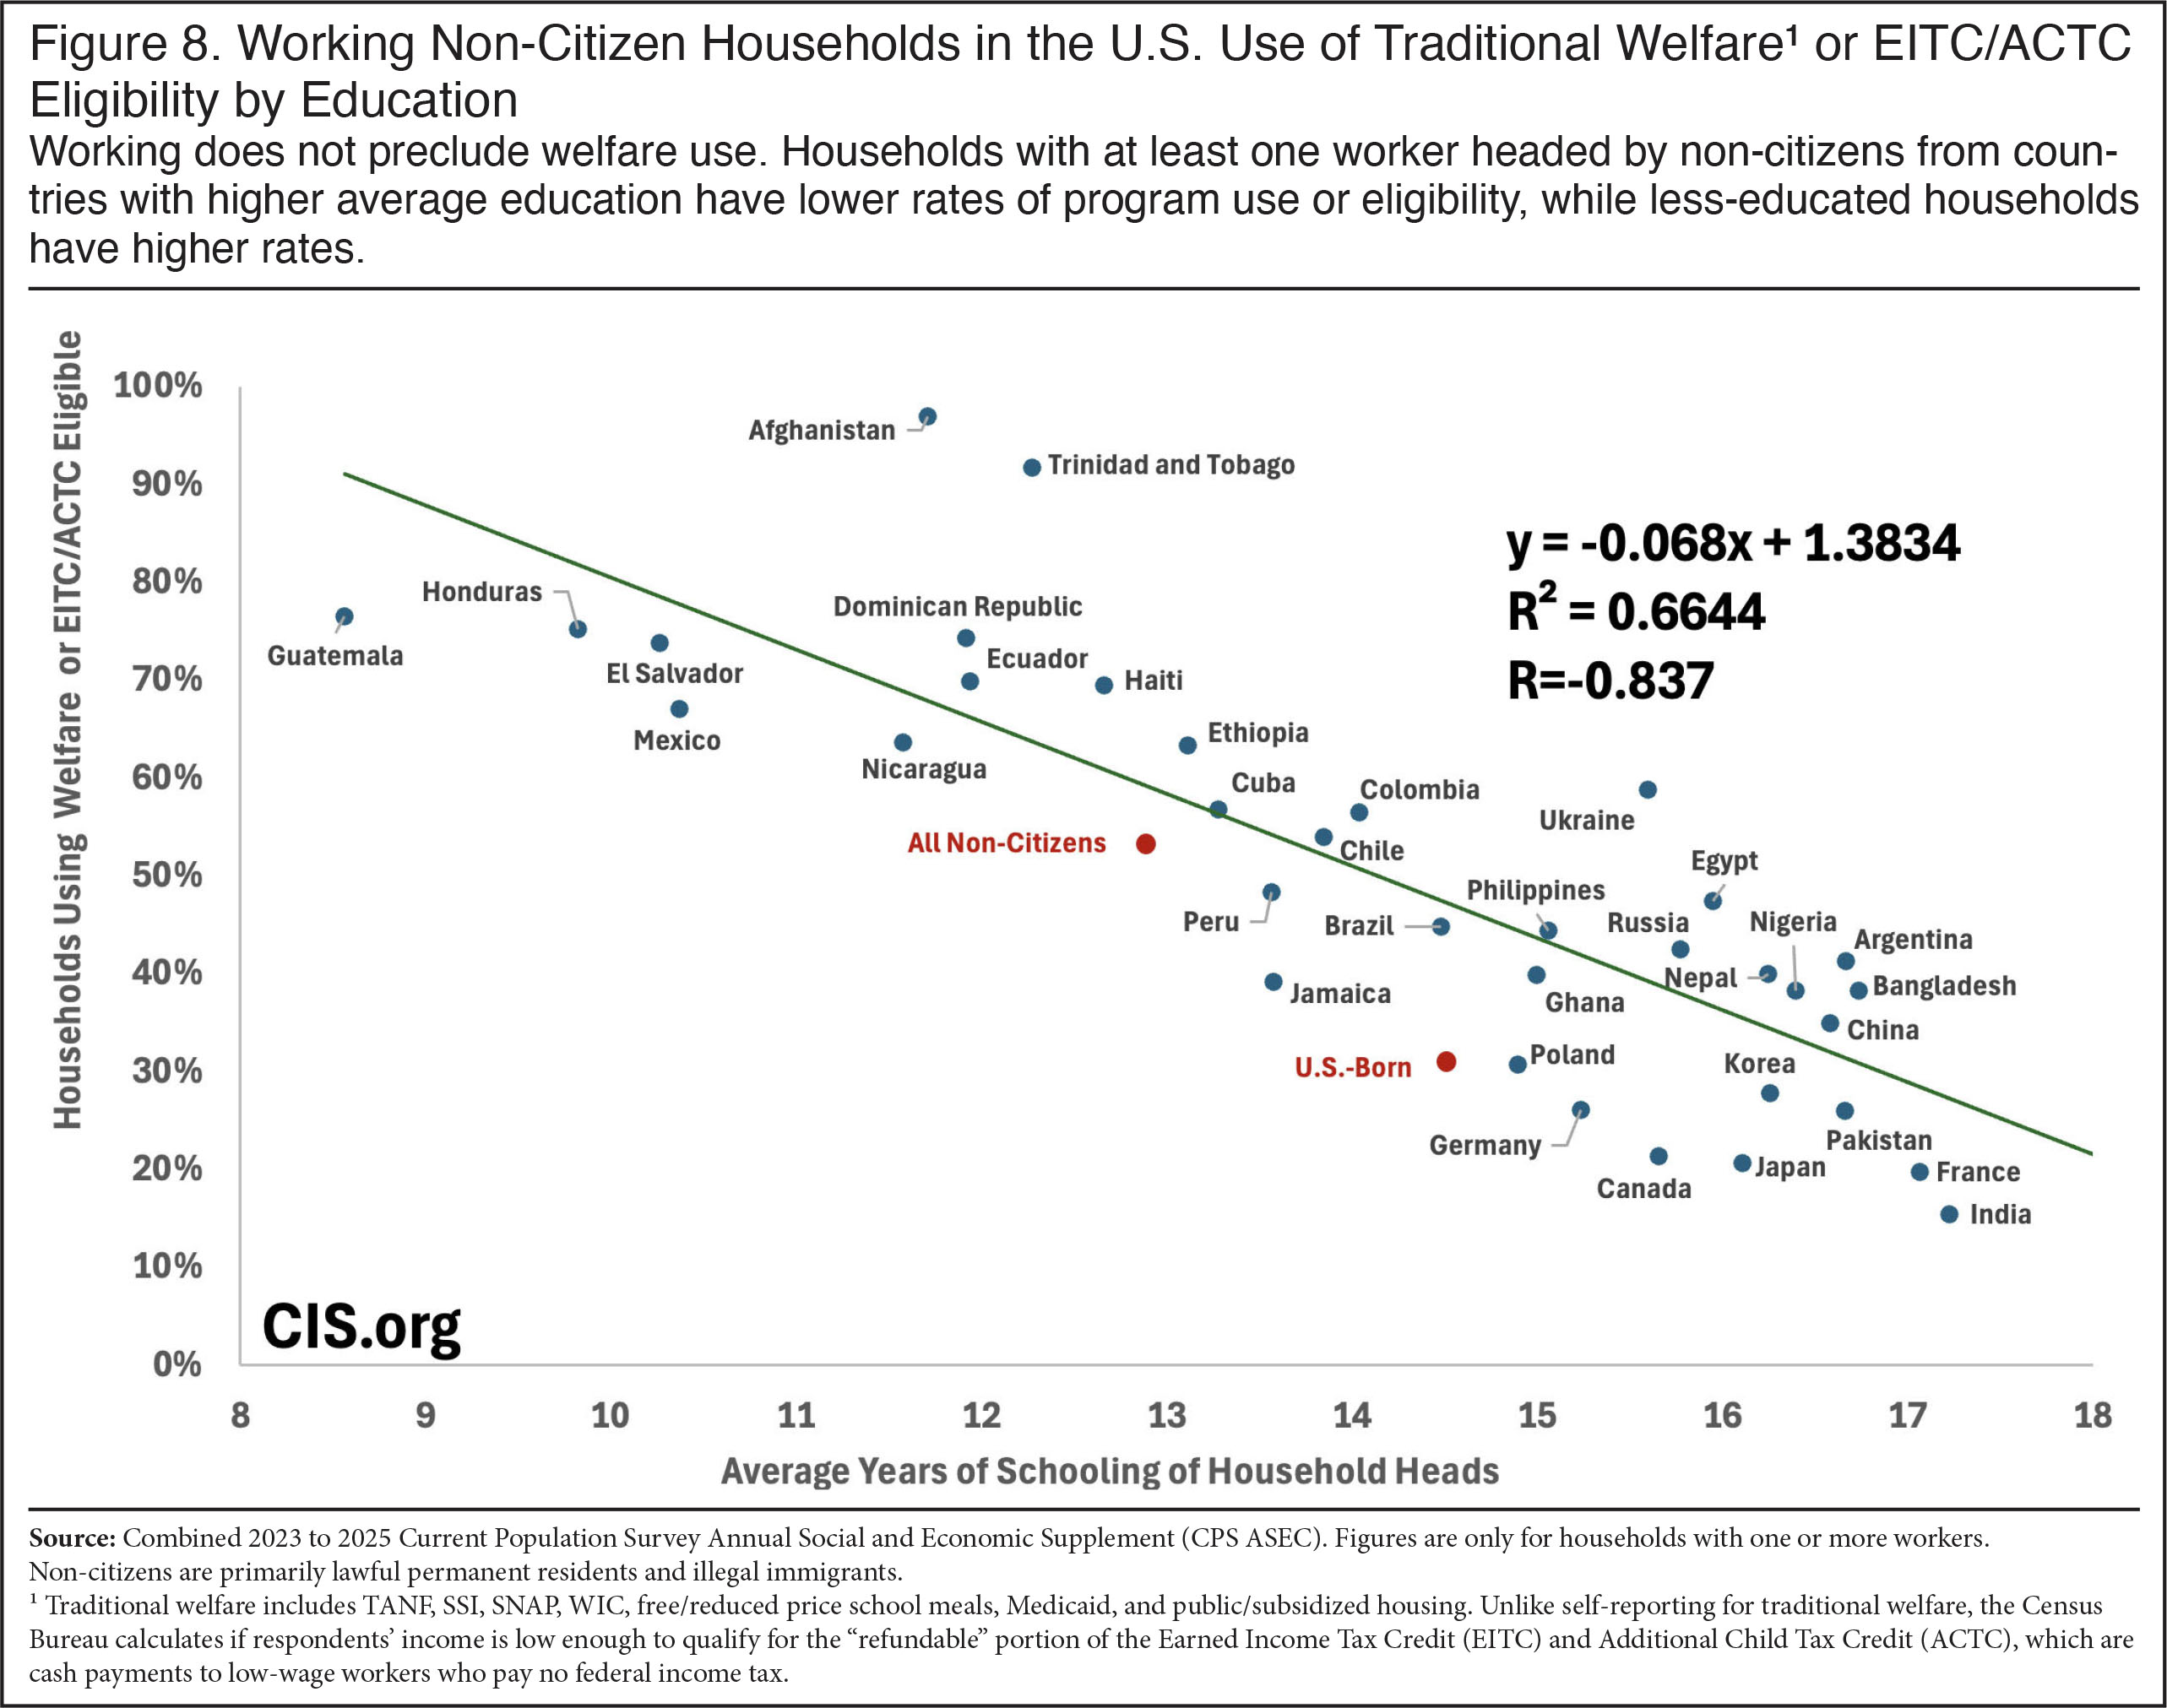
Working Households by Education. Figures 7 and 8 are the same as Figures 5 and 6 except only households with one or more workers are included. The correlations are as strong or stronger for working households as they are non-citizen households in general. The data shows that households headed by non-citizens from countries with higher average levels of education have much lower rates of program use or eligibility, while households headed by less-educated non-citizens have much higher use rates. None of this is surprising. But it does mean that working and accessing the welfare system is very common for less-educated non-citizens.
 |
:
 |
Conclusion
Although most new legal immigrants and illegal immigrants are barred from accessing most means-tested programs, these restrictions have not prevented a large share of non-citizen-headed households from accessing the welfare system. This is primarily because non-citizens often receive benefits on behalf of their U.S.-born children and the restrictions only apply to some programs. These facts coupled with the large share of non-citizens who have modest levels of education and their resulting low incomes mean many can use means-tested anti-poverty programs.
Traditionally, one of the most important arguments for immigration is that it benefits the United States — that is, the existing population of Americans. From this perspective, it is certainly reasonable to expect that those who come from other countries should, with the possible exception of refugees and asylees, use very little welfare. However, this analysis, like others going back decades, has found that for many countries and regions this is not the case. Households headed by non-citizens in the United States from sending countries with lower average levels of education tend to have very high use of the welfare system, while those with very high average education levels tend to receive much less welfare.
One factor that does not explain immigrant households’ higher use of programs is an unwillingness to work. In fact, immigrant households are more likely to have a worker present than households headed by the U.S.-born. However, working in no way prevents use of welfare programs. What matters is income, number of dependents, and sometimes assets — not employment. Of course, employers do not see the costs created by allowing in large numbers of less-educated workers because the burden is diffuse, borne by all taxpayers. But that does not make the costs any less real.
Our findings may lead some to think of non-citizens disparagingly as having come to America to exploit the welfare system. But the evidence is pretty clear that most people come to America to work. Non-citizen men in particular have relatively high rates of employment.13 Moreover, there is no evidence in this data that non-citizens are using fraud to access programs. They are simply accessing programs for which they or their children are eligible at a time when the social sigma surrounding welfare has largely disappeared. It makes more sense to view non-citizens’ heavy reliance on means-tested programs as an unavoidable consequence of not enforcing immigration laws and having a legal immigration system that does not select people based on education and marketable skills.
Prior efforts to bar non-citizens, including illegal immigrants, from welfare once they have been allowed to settle in the country have not been very effective. If we wish to avoid high use of welfare by non-citizens in the future, then moving to a system that selects legal immigrants based on their education and skills, and likely income, would make a good deal of sense. Enforcing immigration laws would also be very helpful. Roughly half of all non-citizens in this data are illegal immigrants, yet we still find that non-citizens use the welfare system at very high rates. Our prior research specifically focusing on illegal immigrant households also finds that a very large share receive benefits, which are typically received on behalf of U.S.-born children. The bottom line is that a more selective legal immigration system and robust immigration enforcement are almost certainly the best ways to reduce welfare use associated with non-citizens in the future.
End Notes
1 If we use our prior estimate, based on the monthly CPS, averaged from 2023 to 2025, we find 13.3 million illegal immigrants in the monthly CPS before making any undercount adjustments. Assuming this same number in the CPS ASEC, then about 51 percent of the 26.2 million non-citizens in the 2023-2025 CPS ASEC are illegal immigrants. Of course, all estimates of illegal immigrants are subject to uncertainty, but 13.3 million is consistent with other organizations’ estimates of the illegal immigrant population. Like other researchers and the government, we include those with deferred action, temporary protected status, parole, and pending asylum claims in our estimate of illegal immigrants. Almost none of these individuals have been formally admitted and all are subject to removal under the Immigration and Nationality Act.
2 The survey asks about receipt of government programs in the prior calendar year.
3 In addition to lawful permanent residents and illegal immigrants, there are also “non-immigrants”. DHS estimated that 3.6 million were in the country in 2024; these long-term temporary visitors are primarily foreign students, guestworkers, and exchange visitors. Some of these non-immigrants are captured in the survey. Pew Research estimates roughly two million non-immigrants in Census Bureau data. These individuals should have very low use of the welfare system since they are technically barred from receiving nearly all federally funded programs directly, though not WIC or free school lunch. (States can also provide them with other benefits with their own resources.) Of course, like all non-citizens, they can receive benefits on behalf of U.S.-born children. Further, since guestworkers; some foreign students, particularly those with Optional Practical Training authorization; and most exchange visitors have valid Social Security numbers, they can receive the EITC and ACTC if they are "resident aliens", which generally means they have lived in the U.S. for at least six months.
4 The late Julian Simon of the Cato Institute, himself a strong immigration advocate, also argued that it did not make sense to examine individuals when looking at the fiscal impact of immigrants. He observed that, "One important reason for not focusing on individuals is that it is on the basis of family needs that public welfare, Aid to Families with Dependent Children (AFDC), and similar transfers are received." For this reason, Simon examined families, not individuals. While not exactly the same as households, as Simon also observed, the household "in most cases" is "identical with the family". Another reason to look at households is that some of the welfare variables in the ASEC are reported at the household level.
5 Almost everyone else in these households are U.S.-born adult children of immigrant or naturalized-citizen parents. There are only a very small number of U.S.-born adults with U.S.-born parents.
6 State-sponsored general assistance (GA) cash programs, which are small in size, are captured in the TANF numbers.
7 To get the EITC and the ACTC, one has to work, meet the low-income requirements, file a tax return, and, in the case of the ACTC, have at least one child. For many years receipt of the EITC has required that at least one parent and all children claimed as dependents have a valid Social Security number (SSN). In tax years 2024 and 2025 this was also required for the ACTC. Prior to 2024, only the dependent children were required to have a valid SSN to receive the ACTC. Illegal immigrant parents were able to obtain a temporary tax identification number to receive ACTC benefits. In practice, this meant that illegal immigrants with U.S.-born children but no valid SSN could still claim the ACTC, but not the EITC. This is no longer the case. All this said, it must be understood that illegal immigrants have never been formally barred from either program. Rather they and their children need valid SSNs. All U.S.-born children of illegal immigrants have a valid number and perhaps three million adult illegal immigrants have been given work authorization, which includes an SSN. Adult illegal immigrants with work authorization include but are not limited to those with temporary protected status, deferred action, parolees, and many with pending asylum claims. Some number of illegal immigrants also have stolen or otherwise acquired identities which may allow them to receive cash payments from both programs.
8 Unlike the CPS ASEC, the Survey of Income and Program Participation (SIPP) actually asks respondents if they receive cash from the EITC. (The SIPP does not ask about the ACTC.) Averaging results from the 2023 and 2024 SIPP (The 2025 SIPP is not yet available) shows that 19.1 percent of non-citizen households received the EITC based on self-reporting, substantially higher than the 10.3 percent of U.S.-born households getting the EITC in the SIPP. The Census Bureau eligibility estimates included with the public-use files of the 2023 and 2024 CPS ASEC show that 29.7 percent of non-citizen households have an adult in the household, typically with dependents, with low enough income to qualify for the EITC. Assuming non-citizens do not underreport receipt of the EITC in the SIPP, then all of these numbers imply that 64.3 percent of non-citizen households that are income-qualified to receive the credit actually get cash payments from it. While we do not have a comparable estimate for receipt of the ACTC, the program is similar to the EITC, so it seems reasonable to assume that roughly two-thirds of non-citizen households eligible for the program receive ACTC payments.
9 Countries that are identified in the survey are grouped into the following regions in this analysis: Canada; Mexico; Central America: Belize/British Honduras, Costa Rica, El Salvador, Guatemala, Honduras, Nicaragua, Panama, Central America, n.s.; Caribbean: Cuba, Dominican Republic, Haiti, Jamaica, Bahamas, Barbados, Dominica, Grenada, Trinidad and Tobago, Antigua and Barbuda, St. Kitts-Nevis, St. Lucia, St. Vincent and the Grenada, Bermuda, Caribbean n.s.; South America: Argentina, Bolivia, Brazil, Chile, Colombia, Ecuador, Guyana/British Guiana, Peru, Uruguay, Venezuela, Paraguay, South America n.s.; East Asia: China, Japan, Korea, Mongolia, Cambodia, Indonesia, Laos, Malaysia, Philippines, Singapore, Thailand, Vietnam, Burma, Asia n.s./n.e.c.; South Asia: India, Bangladesh, Bhutan, Pakistan, Sri Lanka, Nepal; Middle East: Afghanistan Iran, Iraq, Israel, Palestine, Jordan, Lebanon, Saudi Arabia, Syria, Turkey, Kuwait, Yemen, United Arab Emirates, Middle East n.s., Azerbaijan, Uzbekistan, Kazakhstan, Northern Africa, Egypt, Morocco, Algeria, Sudan, Libya; Africa: Ghana, Nigeria, Cameroon, Cape Verde, Liberia, Senegal, Sierra Leone, Guinea, Ivory Coast, Togo, Eritrea, Ethiopia, Kenya, Somalia, Tanzania, Uganda, Zimbabwe, South Africa (Union of), Zaire, Congo, Zambia, Africa n.s./n.e.c.; Europe: Denmark, Finland, Iceland, Norway, Sweden, United Kingdom, Ireland, Belgium, France, Netherlands, Switzerland, Greece, Italy, Portugal, Azores, Spain, Austria, Czech Republic, Slovakia, Czech Republic, Germany, Hungary, Poland, Romania, Bulgaria, Albania, Yugoslavia, Bosnia and Herzegovina, Croatia, Macedonia, Serbia, Kosovo, Montenegro, Estonia, Latvia, Lithuania, Other USSR/Russia, Ukraine, Belarus, Moldova, Cyprus, Armenia, Georgia, Europe n.s.; Australia, Oceania, Elsewhere: Australia, New Zealand, Pacific Islands, Fiji, Tonga, Samoa, Marshall Islands, Micronesia, Americas n.s., other n.e.c., and unknown. In the public-use CPS ASEC, the abbreviation “n.s.” means “not specified” and “n.e.c.” means “not elsewhere specified”. In recent Census Bureau surveys, like those used in this report, there are relatively few individuals from countries that are coded as n.s. or n.e.c.
10 Although not the focus of this analysis, the CPS ASEC shows that 37 percent of households headed by naturalized citizens use at least one traditional welfare program, and it is 41 percent when EITC/ACTC eligibility is added. These are lower than the rates for non-citizens but still a good deal higher than the 28 and 31 corresponding percentages for U.S.-born-headed households. Of course, naturalized citizens are a relatively older and a more educated group compared to non-citizens. In the three-year sample used in this report, the average naturalized-citizen household head is 55 years year old compared to 43 years for non-citizen heads. Naturalized citizens are even older than U.S.-born household heads, who are 53 years old on average.
11 The education variable in the CPS ASEC is not a true continuous variable, with multiple years grouped together or a general description of the respondent’s highest degree. We transform the categories into numerical values that correspond best to the average years of education associated with each category. We do this with the following recodes: grades one to four year are recoded to 2.5 years; 5th and 6th grade are 5.5 years; 7th to 8th grade are 7.5; 9th, 10th, and 11th grade are their own values; those who attended 12 grade but did not graduate are coded as an 11.5; those who completed high school are 12; those with some college and no degree are 13; both vocational or academic associates degrees are 14; a bachelor’s degree is 16; a master’s degree is 18; and professional and doctorate degrees are both coded as 20.
12 The r² can be interpreted as the share of variation in the variable of interest that is explained by the controlling variable. Thus in Figure 5, 63.7 percent of the variation in use of welfare can be explained by the education level of the household head. In Figure 6, it is 66.4 percent. Of course, it should be kept in mind that this is a simple correlation.
13 In our the combined 2023-25 ASEC CPS, 87 percent of non-citizen men ages 18 to 64 are in the labor force, compared to 81 percent of U.S.-born men 18 to 64.