

Expanded immigration enforcement has triggered several claims that the effort is having a “chilling effect” and imposing a “devastating toll” on the U.S. economy. In fact, data through June of 2026 shows evidence that since President Trump took office the native-born have made significant job gains. This analysis looks at native employment gains in the Bureau of Labor Statistics’ household survey, formally known as the Current Population Survey (CPS), and discusses the reweighting of the government data at the start of 2026, its impact on estimates of native employment, and limitations associated with using CPS data to measure employment trends by nativity.
Among the findings:
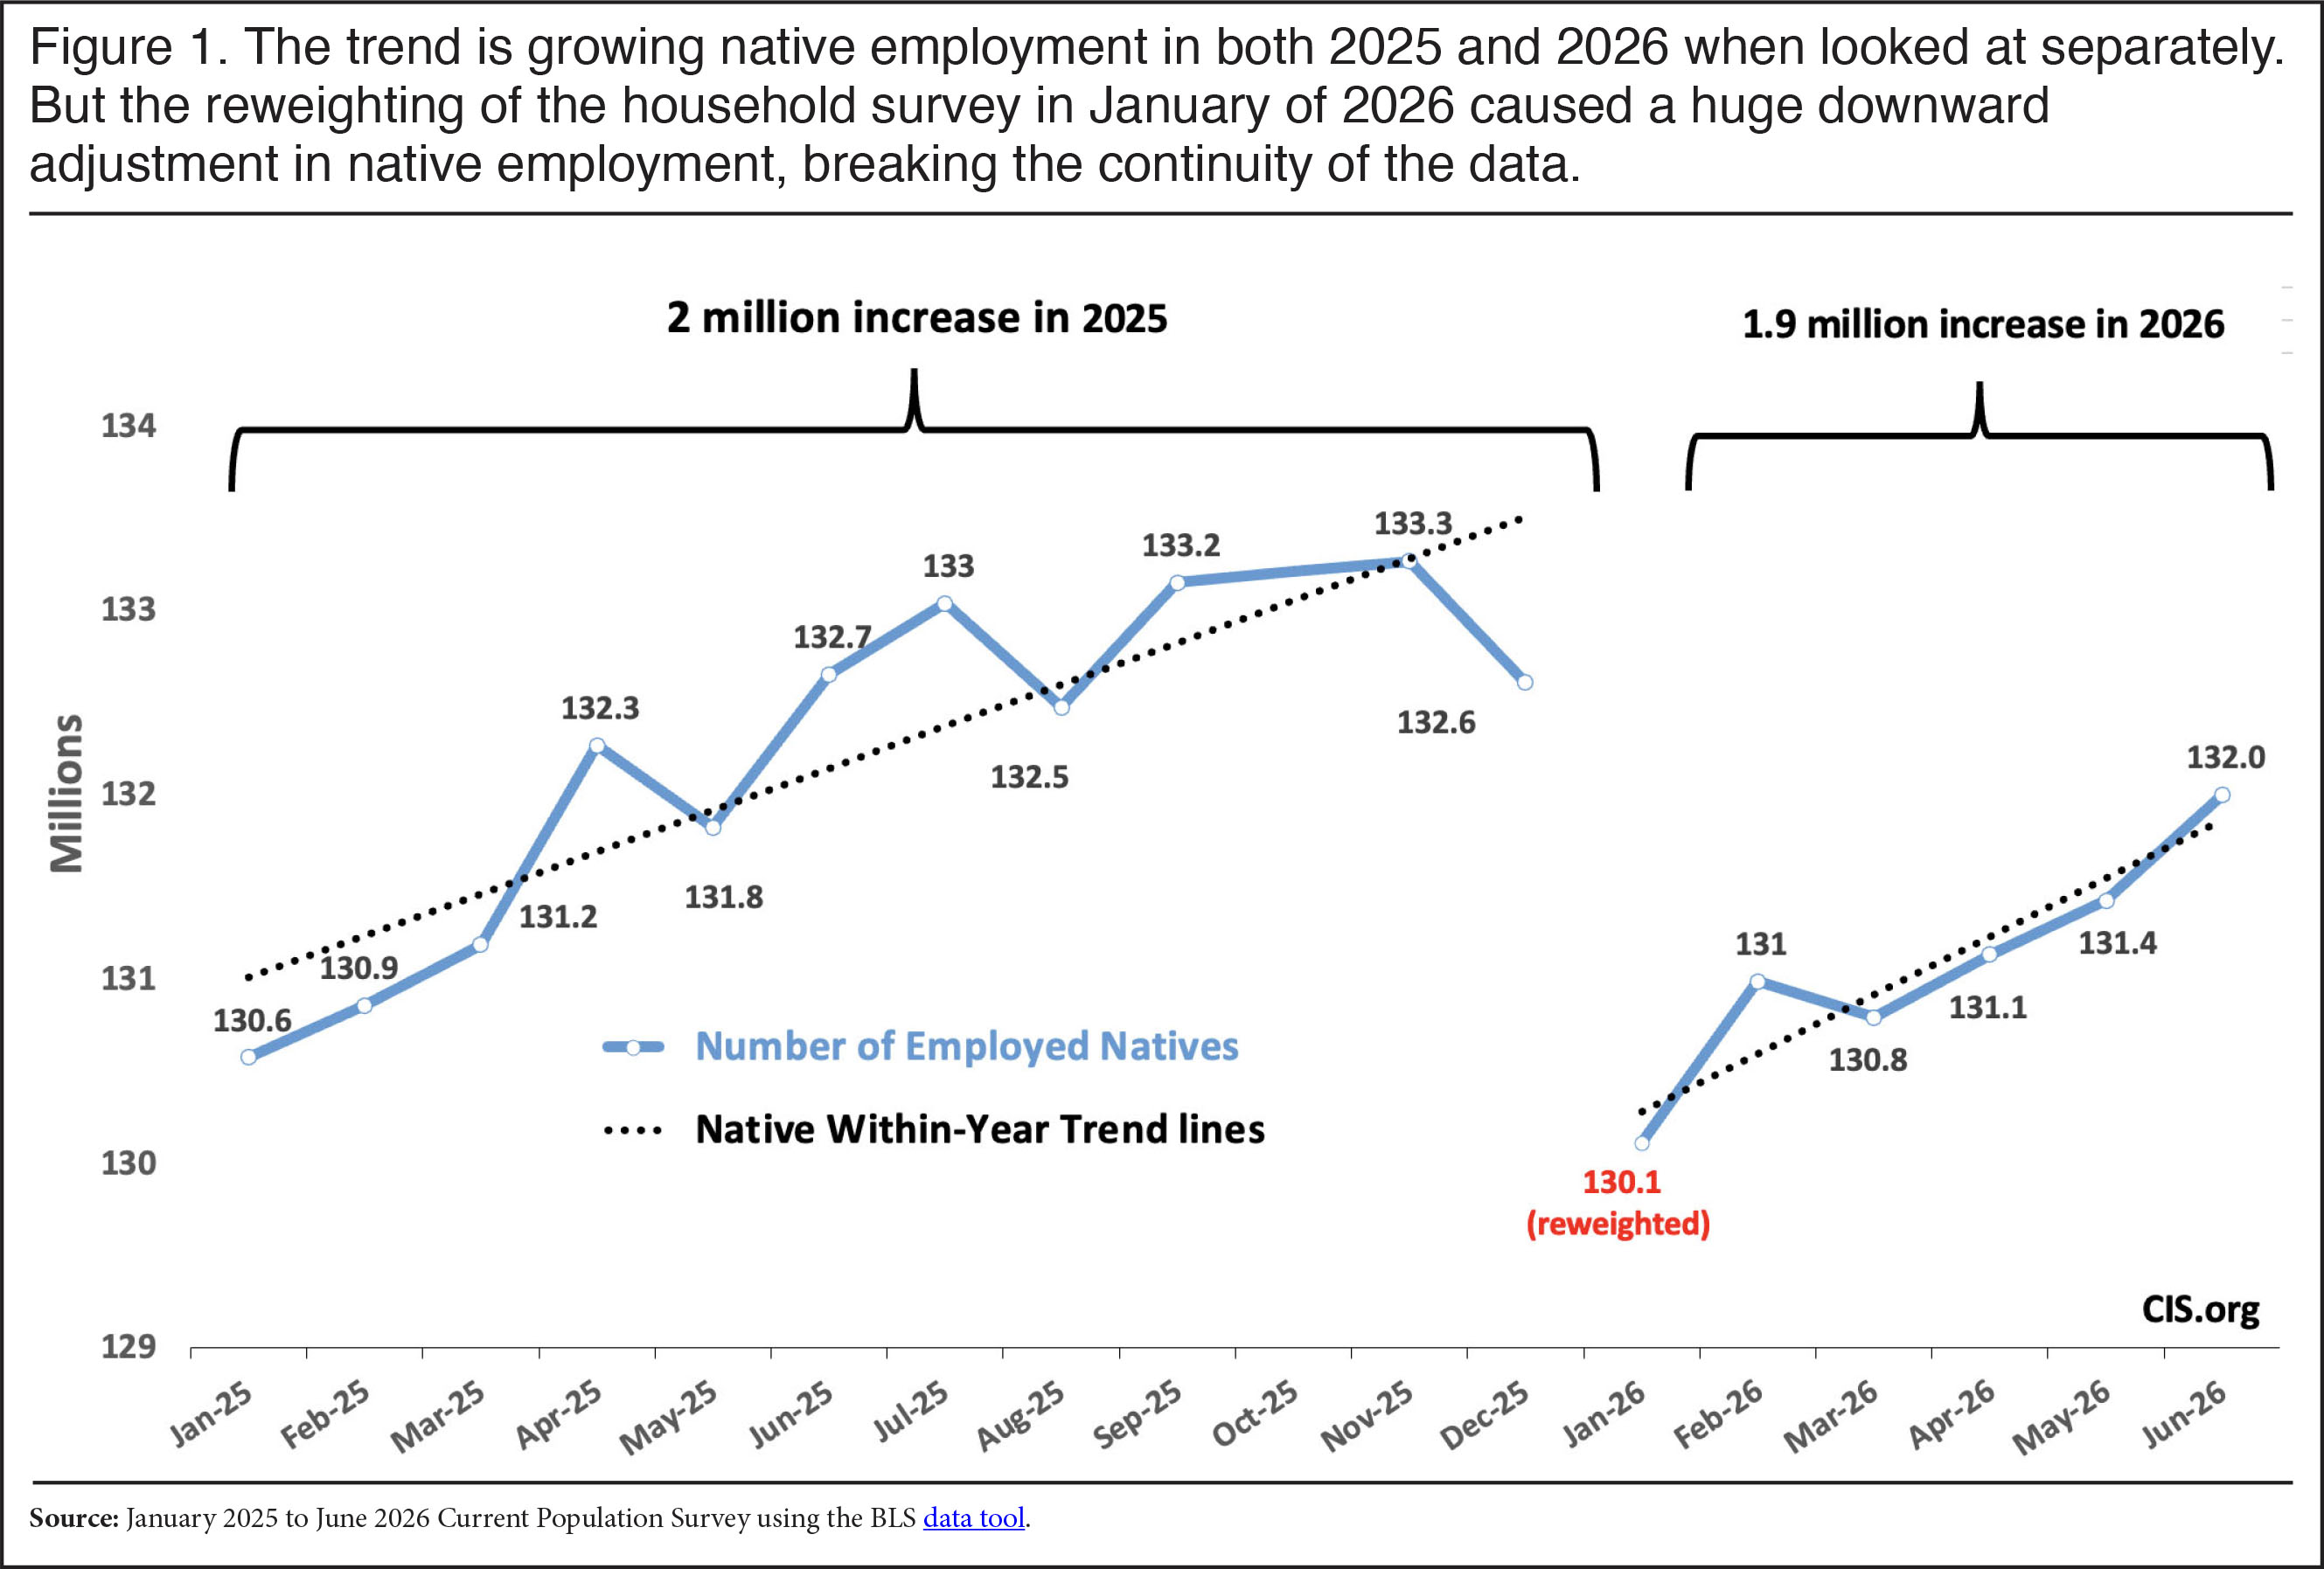
- When 2025 and 2026 are looked at separately using within-year consistent survey weights, they show two million and 1.9 million increases, respectively, in the number of natives employed.
- The within-year native employment gains in 2025 and 2026 are substantially larger than the within-year increase of 758,000 from January to December of 2024, or the 367,000 increase in 2023.
- The reweighting of the data by the government in January of 2026 caused a huge 2.5 million decline in the estimated number of natives employed ─ the largest decline in native employment associated with the annual reweighting of the data since 1996.
- Even with the January adjustment, there were still 1.4 million more natives employed in June 2026 than in January 2025, when increased enforcement began.
- In addition to the large native employment gains, the general stability in the unemployment and labor force participation rates of natives indicate that the administration’s stepped-up immigration enforcement efforts have not harmed their labor market prospects.
- Estimates of employment by nativity have to be interpreted with caution due to the lack of seasonal adjustment in the available data, normal sampling variability, and the weighting scheme used in the survey, which causes a decline in the estimated immigrant population to mechanically create an estimated increase in the native population, and vice versa.
Discussion
Within-Year Growth in Native Employment. In the technical supplement below we discuss the complexities of the survey’s weighting scheme, which is revised each January, and other limitations of the survey. That said, the CPS is the only data available that directly measures native and immigrant (also called foreign-born) employment.1 Figure 1 shows that using consistent within-year sample weights, from January to December 2025, native employment increased by two million. From January to June 2026, native employment increased by slightly under 1.9 million.
 |
These changes are substantially larger than the within-year increase of 758,000 in the number of employed natives from January to December 2024, or the 367,000 increase in 2023. In fact, the 2025 and 2026 within-year increases in native employment are roughly on par with the 2.1 million within-year native employment increase from January to December 2022, when the U.S. economy was rapidly recovering in the immediate aftermath of Covid.
The Impact of Survey Reweighting. The CPS is reweighted each January to reflect updated estimates of the size and composition of the U.S. population. The January 2026 readjustment resulted in a large downward shift in the number of natives employed. The total increase in natives employed when January 2025 is compared to June 2026 is “only” 1.4 million, even with the January 2026 downward adjustment. This increase is substantial, but not as large as the increase implied by the within-year comparisons when consistent sample weights are used. As the figure shows, the number of employed natives was reduced by an implausibly large 2.5 million in the January 2026 CPS. January of 1996 was the last time there was as large a downward adjustment in native employment associated with the annual re-adjustment of the survey weights.
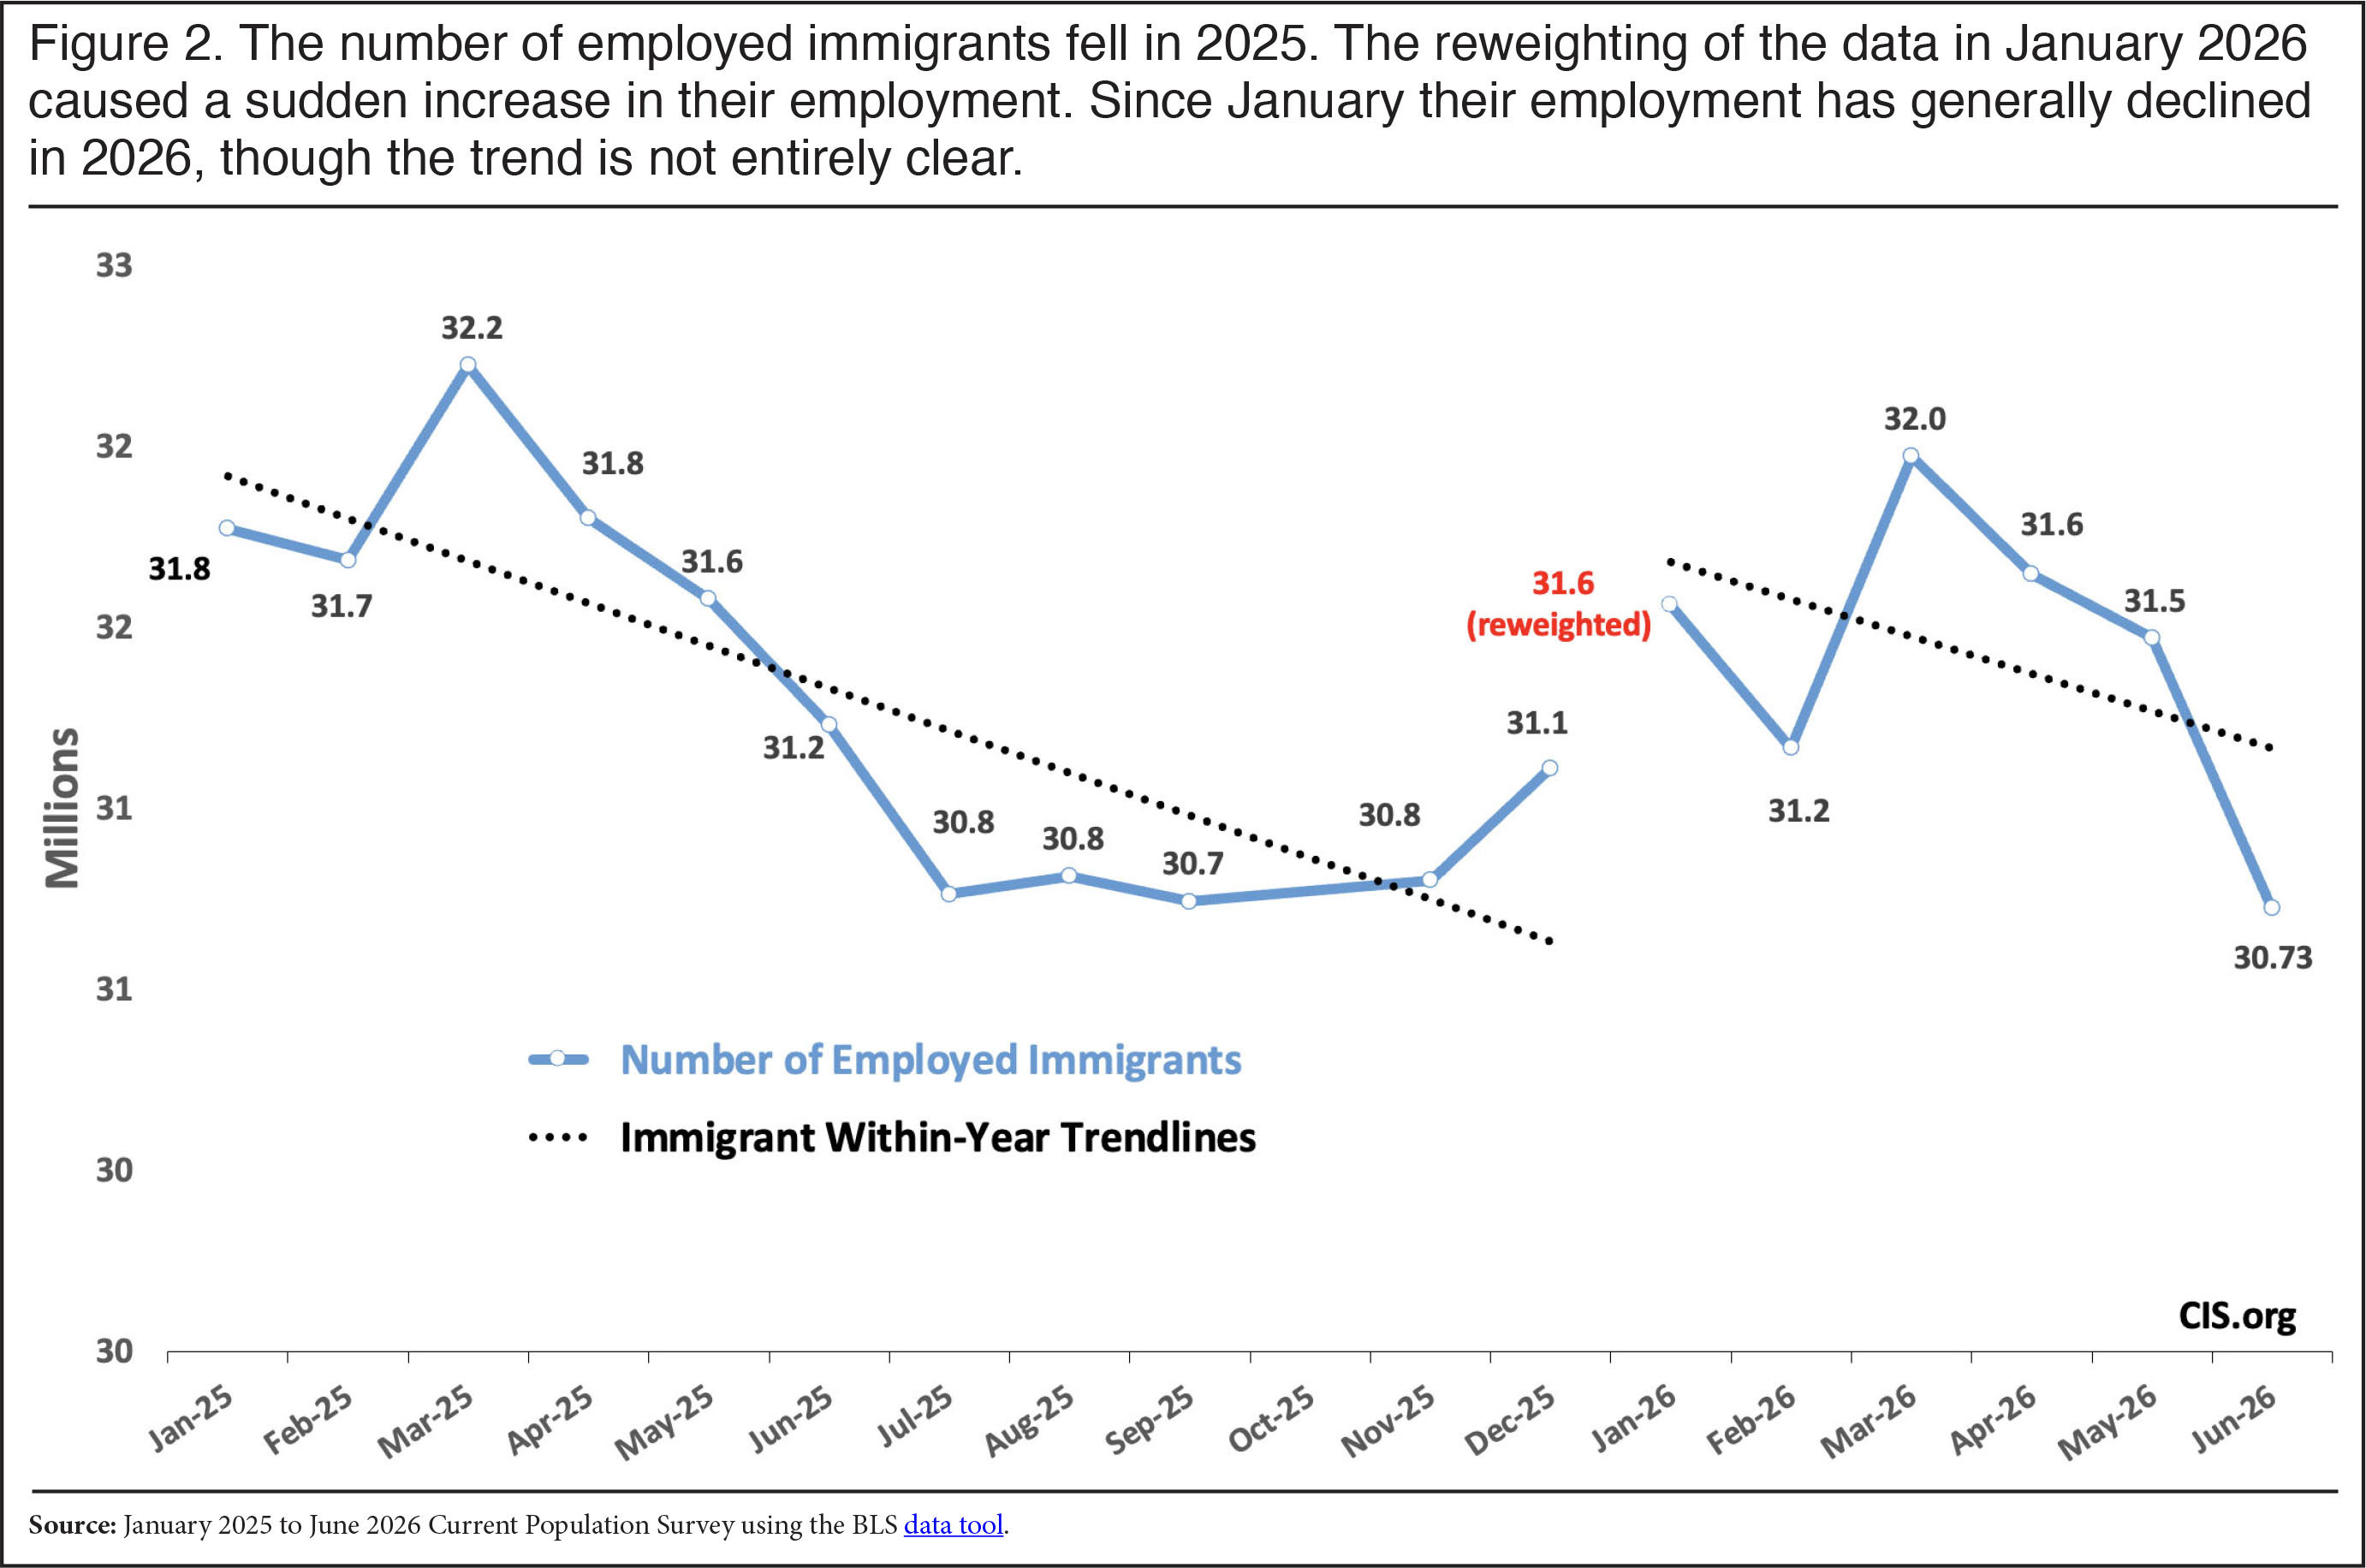
The number of employed immigrants actually went up from December 2025 to January 2026 by 450,000 (see Figure 2). This means the total decline in the number of people employed (immigrant and native together) was 2.1 million. Although there was an increase in immigrants working associated with the January adjustment in 2026, the number of working immigrants in June 2026 was about one million less than what it was in January 2025 at the start of the Trump administration. The public-use microdata, which are only available through May, show that all of the decline in employment among immigrants was due to a falloff in the number of non-citizens working. This is certainly consistent with the possibility that increased immigration enforcement caused non-citizens to leave the country, or at least leave the job market.
 |
The Implausible Decline in Native Employment from 2025 to 2026. A one-month decline in native employment of 2.5 million is not really possible unless there was a severe recession, which is certainly not the case in 2026. As we will discuss below, there is no question that this falloff was due primarily to the adjustments to the CPS sample weights made by the Census Bureau in January 2026. That said, Figure 1 shows that the slope of the within-year trend lines in the number of employed natives for 2025 and 2026 are large and positive. The labor force participation of working-age (18 to 64) natives and their unemployment rate remained largely unchanged since the current administration took office in January 2025.2 The large increase in native employment and the stability of their unemployment and labor force participation rates indicates that increased immigration enforcement in the last year and a half are not associated with a significant deterioration in the employment situation of the U. S.-born.
Conclusion
Keeping in mind the limitations of the CPS, it is still the case that it is the best data available to examine monthly trends in native employment. The survey indicates that immigration enforcement has not harmed the employment prospects of natives as some have argued. In fact, when we look at the number of employed natives, we find very large employment gains in both 2025 and 2026 when consistent within-year survey weights are used.
Technical Supplement
CPS Data. We can look at overall job numbers from the establishment survey, officially the Current Employment Statistics Survey, which surveys employers monthly. It is also possible to use the Job Openings and Labor Turnover Survey (JOLTS) to examine trends in hiring and in those leaving their jobs each month. But the Current Population Survey (CPS), informally known as the household survey, is really the only government survey that measures monthly employment and asks respondents if they are immigrants. The CPS is conducted by the Census Bureau for the Bureau of Labor Statistics (BLS) and reflects the nation’s non-institutionalized population.
The data tool provided by the BLS makes it easy to look at employment figures by nativity. It is also possible to run much more detailed breakdowns of the CPS by downloading the public-use microdata, which the Center has done in many reports over the years. This blog post is based almost entirely on the table-generating tool from the BLS, unless otherwise indicated.
CPS Data Weights. Like virtually every modern survey, the CPS is weighted to reflect the estimated size of the entire non-institutionalized U.S. population. This means that each individual is “weighted up” so that the total population in the survey looks like the total U.S. population, or the best estimate of what the government thinks the population looks like. Based on administrative data such as birth and death records, legal immigration arrivals, and estimates of irregular migration, the complex methodology in the CPS weights the survey respondents by key “control” variables such as age, gender, and race to reflect the nation’s population size and composition. However, foreign-born status, while correlated with some of the control variables like race, is itself not a control variable and is allowed to vary based on respondent answers, just like unemployment or educational attainment.
The Annual Readjustment of the Survey. Normally, the data is updated every January with new weights based on the latest estimate of the population so that the totals match what the Census Bureau believes is the size and composition of the U.S. population.3 After being readjusted each January, the survey weights are carried forward each month based on short-term projections of births, deaths, and net international migration (NIM) during the year. Estimating net migration is by far the most difficult part of creating the survey weights, especially because illegal immigration is so difficult to measure. As we have written before, the Census Bureau, which creates the weights for the CPS, has struggled to estimate how many people are coming and going, which has caused them to significantly revise prior estimates of NIM over the years. Whether the Census Bureau properly reweighed the data in January 2026 is outside the scope of this post.
Impact of Reweighting on Employment. The BLS acknowledges that the annual January reweighting of the CPS breaks the continuity of the survey. For example, they stated at the beginning of 2026 that “household survey data for January 2026 and later months will not be strictly comparable with data for December 2025 or earlier periods” due to the annual readjustment of the weights. For January 2026, BLS reports that reweighting decreased the population level for men (primarily those 25 to 54), while it increased the population of women, particularly among those age 65 and over. As a result, it reduced the overall number of people working because men ages 25 to 54 have high labor force participation rates, while women 65 and older have low rates; the unemployment rate (share looking for work) was unaffected.
In addition to the changes made in the data by gender and age, the BLS also reports that reweighting resulted in a “substantial increase in the Asian population”, while the white and black populations were reduced. In the January 2026 CPS, non-Hispanic blacks (84.4 percent) and non-Hispanic whites (95.1 percent) ages 16 and older are disproportionately native-born, and a very large share of 16 and older Asians (68.2 percent) are foreign-born. As a result, the reweighting helps explain why the number of immigrants employed increased even as native employment fell very sharply in January 2026 relative to the preceding December.4
The January 2026 CPS with Different Weights. Partly because of the government shutdown, the January data was initially issued with the 2025-based weights carried forward from December. The new 2026-based weights were not applied until the release of the February data in March 2026. This makes it possible to see the direct impact of reweighting on the data by comparing the January 2026 CPS with the 2025-based weights to the same survey with 2026-based weights. The January 2026 CPS shows 161.7 million people employed when the 2026-based weights are used; this is 1.4 million fewer than the 163.1 million in the same data when the 2025-based weights are used.
If we compare the number of people employed in the January 2026 CPS using the 2025-based weights to the prior month of December, then the number of people (immigrant and native) employed declined by only 630,000. But if we compare December 2025 to the January data using the 2026-based weights then the decline in total employment was an enormous 2.1 million. While a decline of 630,000 may not be too surprising given the normal falloff in employment after the Christmas season, a 2.1 million month-to-month decline in the total number of employed people outside of a recession is extremely unusual.
In addition to changing the gender, race, and age of the U.S. population in the survey, the new weights resulted in a downward revision in the size of the overall U.S. population, not just in the number employed. Based on our analysis of the CPS public-use microdata, the nation’s total non-institutionalized population of all ages in the CPS is 812,000 smaller in January 2026 when the 2026-based weights are used than when the 2025-based weights are used. If we compare the December 2025 total population in the CPS to the January 2026 total population (with 2026-based weights) the decline was 675,000. Typically, the reweighting is associated with an increase in the size of the total population. In fact, there have only been three times in the last 30 years when a reduction in the size of the overall U.S. population associated with the January reweighting, relative to December, was this large.
Other Factors That Affect the Data. Finally, in addition to reweighting, several factors could have contributed to the decline in native employment. First, there is natural variability in the data. Using a 90 percent confidence level, the margin of error in the number of employed native-born Americans is 690,000 in January 2026.5 The margin is similar in size in prior months. Second, the data tool for the CPS used here does not report seasonally adjusted data; for most months this should not make a large difference.6 Employment almost always declines in January after the Christmas season is over. Third, it is possible that a decline in native employment might be due at least in part to an increase in immigrants’ willingness to identify as foreign-born, thereby indirectly reducing the reported number of natives in the survey. As Figure 2 shows, immigrant employment increased from December 2025 to January 2026.
Linked Nature of Nativity Data. As we have pointed out in the past, because the survey is controlled to a predetermined size each month, “If the overall foreign-born population declines in the survey, it must be accompanied by an increase in the overall U.S.-born because individuals can only be U.S.- or foreign-born.” This is also true in the other direction — an increase in the foreign-born must result in a corresponding decline in the native-born. This, of course, does not necessarily have to be the case when looking at employment figures, as people can remain in the country but leave or join the labor force. But in general, a change in the number of employed immigrants will typically be offset by a corresponding inverse change in the number of employed natives.
End Notes
1 The term “immigrant” has a specific meaning in U.S. immigration law, which is all those inspected and admitted as lawful permanent residents (green card holders). In this analysis, we use the term “immigrant” in the non-technical sense to mean all those who were not U.S. citizens at birth, which in government surveys includes naturalized citizens, permanent residents (green card holders), long-term temporary visitors, and illegal immigrants. “Immigrant” and “foreign-born” are used synonymously in this report. Natives, by contrast, are all those who are U.S. citizens at birth, including individuals born to immigrant parents of any legal status. It also includes all those born abroad to U.S. citizen parents.
2 The native unemployment rate was 4.3 percent in January 2025, and it was 4.6 percent in June 2026. Using the public-use microdata, which is only available through May, the share of natives 18 to 64 in the labor force was basically unchanged in May 2026 at 77.1 percent, compared to 77.2 percent in January 2025. Looking specifically at the population that has been the focus of much concern and prior research, the share of prime-age (25 to 54), non-college, U.S.-born men in the labor force was somewhat improved at 85 percent in May 2026 compared to 84.3 percent in January 2025.
3 The reweighting of the survey in 2026 was delayed until February because of the earlier government shutdown. The January data with the new sample weights was released with the February data.
4 These figures come from our analysis of the weighted CPS using the public-use microdata.
5 This is based on the parameter estimates and formula from the latest Source and Accuracy statement provided by the BLS.
6 While seasonally adjusted employment figures for immigrants and natives are not published separately by the government, the total number of people employed seasonally adjusted and unadjusted is available. For the 11 months that employment data is available for 2025 (there is no data for November), the average size of the monthly difference in the total number of employed people adjusted and unadjusted was 438,000, or 0.3 percent.