
Analysis of the Census Bureau’s American Community Survey (ACS) confirms our earlier work based on the much smaller Current Population Survey showing that new immigrants (legal and illegal together) who arrived in the Biden administration during the border surge (2021 to 2024) are significantly less educated and have lower incomes than newcomers before the surge. The decline in education primarily reflects the enormous increase in illegal immigrants from Latin America, who tend to be significantly less educated than legal immigrants. Prior to the surge, the education level of newcomers had improved. The deterioration is important because education levels have profound implications for new immigrants’ social mobility and impact on the United States.
- Of adult immigrants (legal and illegal) who arrived in the first part of 2024, 39 percent had at least a bachelor’s degree, down from 48 percent of those who arrived in 2019, before the border surge.
- Of those who arrived in 2024, 45 percent had no education beyond high school, an increase from 36 percent in 2019.
- The years 2022 to 2024 are the first time in more than a decade that new immigrants with no education beyond high school outnumbered those with a bachelor’s degree.
- The decline in education is pronounced relative to the U.S.-born, whose education levels steadily improved. Before the surge, the share of new immigrants with no more than a high school education matched the U.S.-born; but by 2024 a 10 percentage-point gap had opened up — 45 percent for newcomers and 35 percent for the U.S.-born.
- Immigrants of every education level increased during the Biden administration, but the less-educated increased proportionally much more than the better educated and as a result the overall education of new arrivals declined significantly.
- The surge in illegal immigration is reflected in a dramatic increase in new arrivals from Latin America, who tend to have the lowest education levels of any sending region. Latin Americans increased from 38 percent of new entrants in 2019 to 55 percent by 2023 at the height of the border surge.
- The decline in the education of new immigrants helps explain why the median earnings of newly arrived adult immigrant men fell from 62 percent that of U.S.-born men in 2019 to only 52 percent in 2024.1
Introduction
The importance of education level to success in the modern American economy is well established. This is true not only for immigrants, but for the U.S.-born as well. Occupation, earnings, poverty rate, home ownership, productivity, use of welfare programs, tax payments, and many other measures of economic and social well-being are strongly correlated with educational attainment. For example, based on data from 2024, employed adult new immigrants (men and women) with at least a bachelor’s degree had median earnings of $46,028, compared to $22,321 for those with no education beyond high school.2 Also, based on other government survey data, 78 percent of households headed by an immigrant without a high school education used at least one major welfare program, as did 69 percent for households headed by an immigrant with only a high school education. In contrast, the figure is 34 percent for immigrants with at least a bachelor’s degree. The average federal income tax liability of households headed by a new immigrant with no education beyond high school is only $3,025, compared to newcomers with at least a bachelor’s degree ($10,720).3 The list of socio-economic outcomes that vary by educational attainment is nearly endless.
The reasons for this are relatively straightforward: Education provides skills, making one more productive, employable, and marketable in the job market. Education is also seen by employers as an indication that a person has the persistence or grit to complete a degree. Education increases social status and may make one a more thoughtful and discerning citizen as well. In addition to all this, adding large numbers of less-educated workers may reduce the productivity of the U.S. labor force, to say nothing of increasing job competition for less-educated Americans who already earn the lowest wages.
We use the term “immigrant” in this report synonymously with “foreign-born”. The foreign-born are all individuals who were not U.S. citizens at birth, including illegal immigrants.4 To examine trends in the education of newly arrived immigrants, we use the American Community Survey, which asks individuals the year they came to the United States, making it easy to determine who are the newcomers. In a prior analysis on this same topic we used the much smaller Current Population Survey. By using the much larger ACS, we are able to obtain more statistically robust estimates by individual year of arrival. Further the CPS groups year of arrival data into three- and four-year cohorts making it hard to determine trends among newcomers over a shorter time frame. The ACS provides information by individual year of entry.
It should be noted that the Census Bureau reports that due to pandemic-related disruptions, the ACS, "did not meet our statistical quality standards” in 2020. Even if it did, 2020 is a very unusual year as it was the height of the Covid-19 pandemic. The number of immigrants arriving in that year was much smaller than in prior or subsequent years and their characteristics are atypical as well. Although we report figures for that year in this analysis, we do not concentrate on them and instead concentrate on comparing trends prior to 2020 to those after that unusual year. It also should be emphasized that we do not attempt to adjust the data for the undercount of illegal immigrants or legal immigrants in any of the years for which we report figures. We simply take the data as it is, without any modifications.
Findings
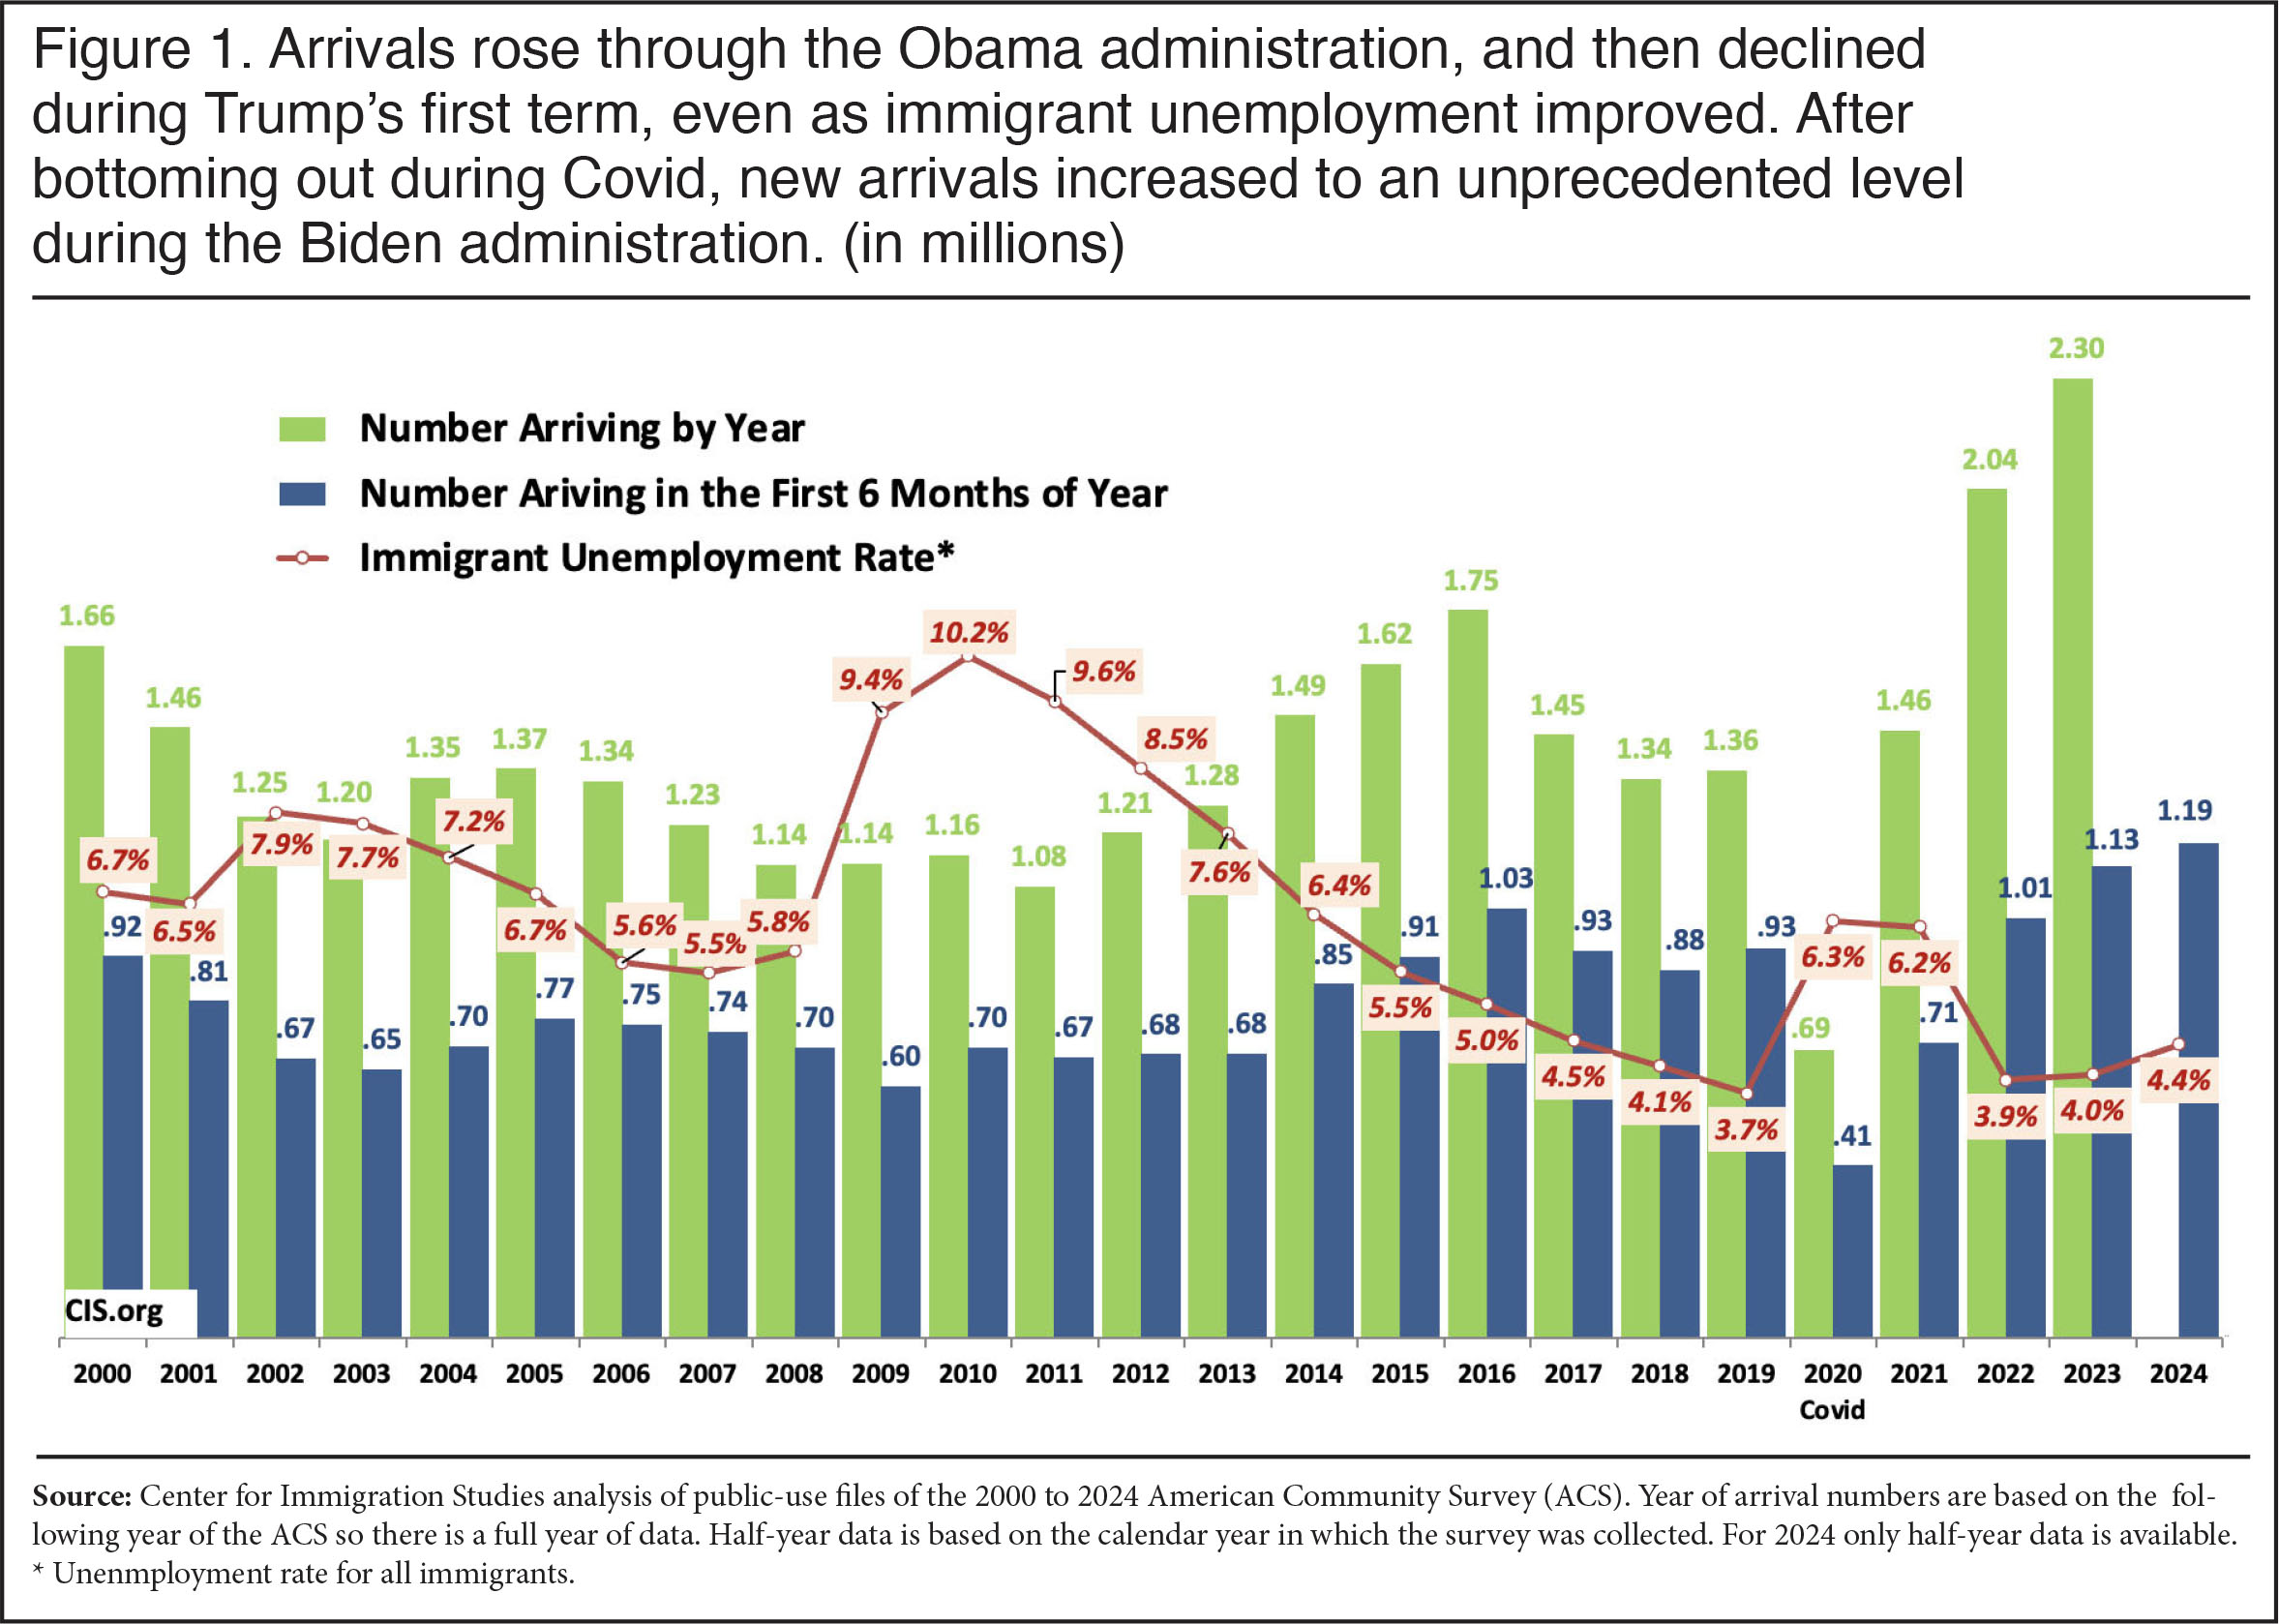
A Surge in Immigration. The ACS reflects the population of the United States on July 1 of each year. Immigrants are asked in the survey when they came to the United States to live. To obtain a full calendar year of arrival data, it is necessary to use the following year’s survey. This means that the 2024 ACS provides the number of immigrants who arrived in all of 2023, but only the first six months of 2024, the 2023 ACS reports the number of immigrants who arrived in 2022 and the first half of 2023, and so on. Figure 1 shows the number of immigrants who came each year based on the following year’s ACS and the number who came in the first part of each year based on that year’s ACS. It shows that immigration hit a high in 2016 of 1.75 million, President Obama’s last year. It then fell in the first three years of the Trump administration, even though the economy was expanding and immigrant unemployment was low and declining. By itself this is an interesting development because it is often asserted that immigration simply reflects underlying economic conditions. Yet the first Trump administration was able to reduce new immigration during this time period. After Covid in 2020, Figure 1 shows that the level of new arrivals surged dramatically to unprecedented levels, reaching 2.3 million in 2023, the last full year for which data is available from the ACS.
 |
Education Level of New Arrivals. Figure 2 reports the share of adult immigrants with no education beyond high school and the share with at least a bachelor’s degree by year. (Those with some college are not included in the figure.) Table 1 shows more detailed information on the education level of the newly arrived foreign-born and the U.S.-born from 2000 to 2024. Figure 2 shows that the share of newly arrived foreign-born residents with at least a bachelor’s degree increased substantially after 2004.5 But the share of newcomers with a bachelor’s or more declined substantially when the border surge started — from 48 percent in 2019 to 39 percent in 2024. The ACS also shows that the share of new immigrants with no education beyond high school increased from 36 percent in 2019 to 45 percent in 2024 over the same period. For the first time in a decade, more new immigrants had no education beyond high school than had at least a college degree.
 |
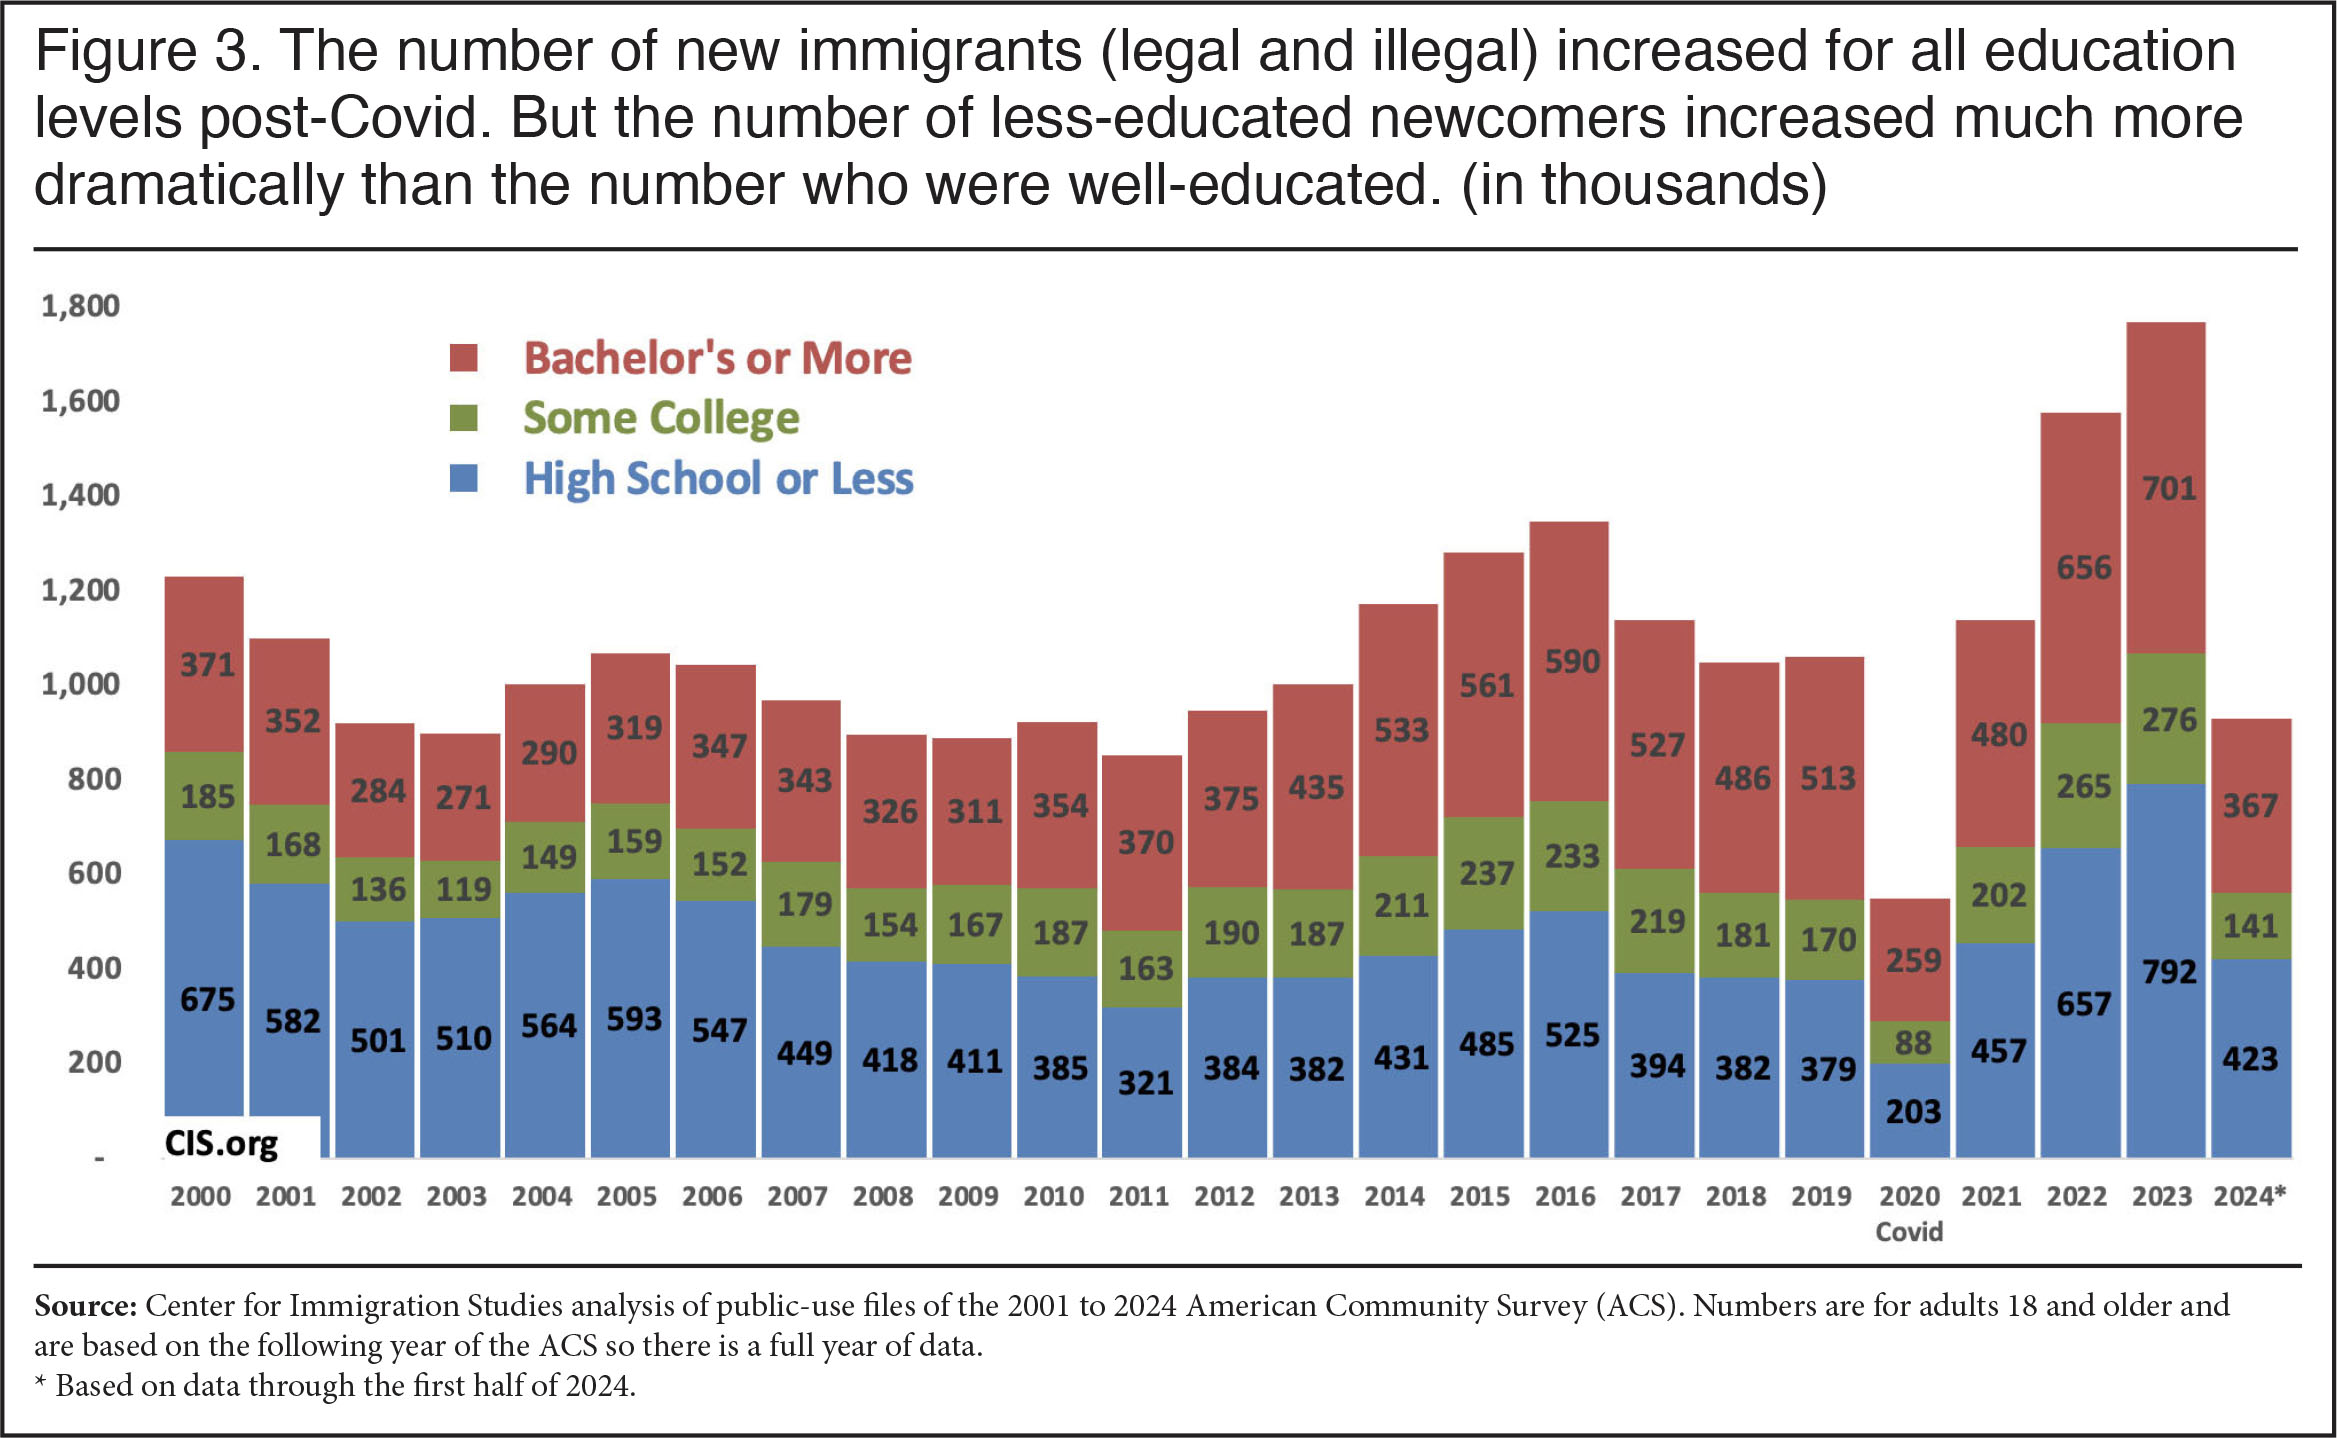
Increase in the Less-Educated. While Figure 2 shows the percentage of newcomers for different levels of education, Figure 3 reports the number of immigrants by year of entry and education level. Immigrants of every education level increased during the Biden administration; however, the less-educated increased the most. By 2023, at the height of the surge, the number of new immigrants with no education beyond high school had more than doubled compared to 2019, while the number with at least a bachelor’s increased 37 percent. Figure 3 shows that 379,000 immigrants with no more than a high school education arrived in 2019; by 2023 it was 792,000 — a 413,000 increase. At the same time, the number with a bachelor’s or more increased from 513,000 to 701,000 — a 188,000 increase. The huge relative increase in less-educated new immigrants is why the overall share of newcomers with lower-levels of education increased so much even though the absolute number of more educated immigrants also increased.
 |
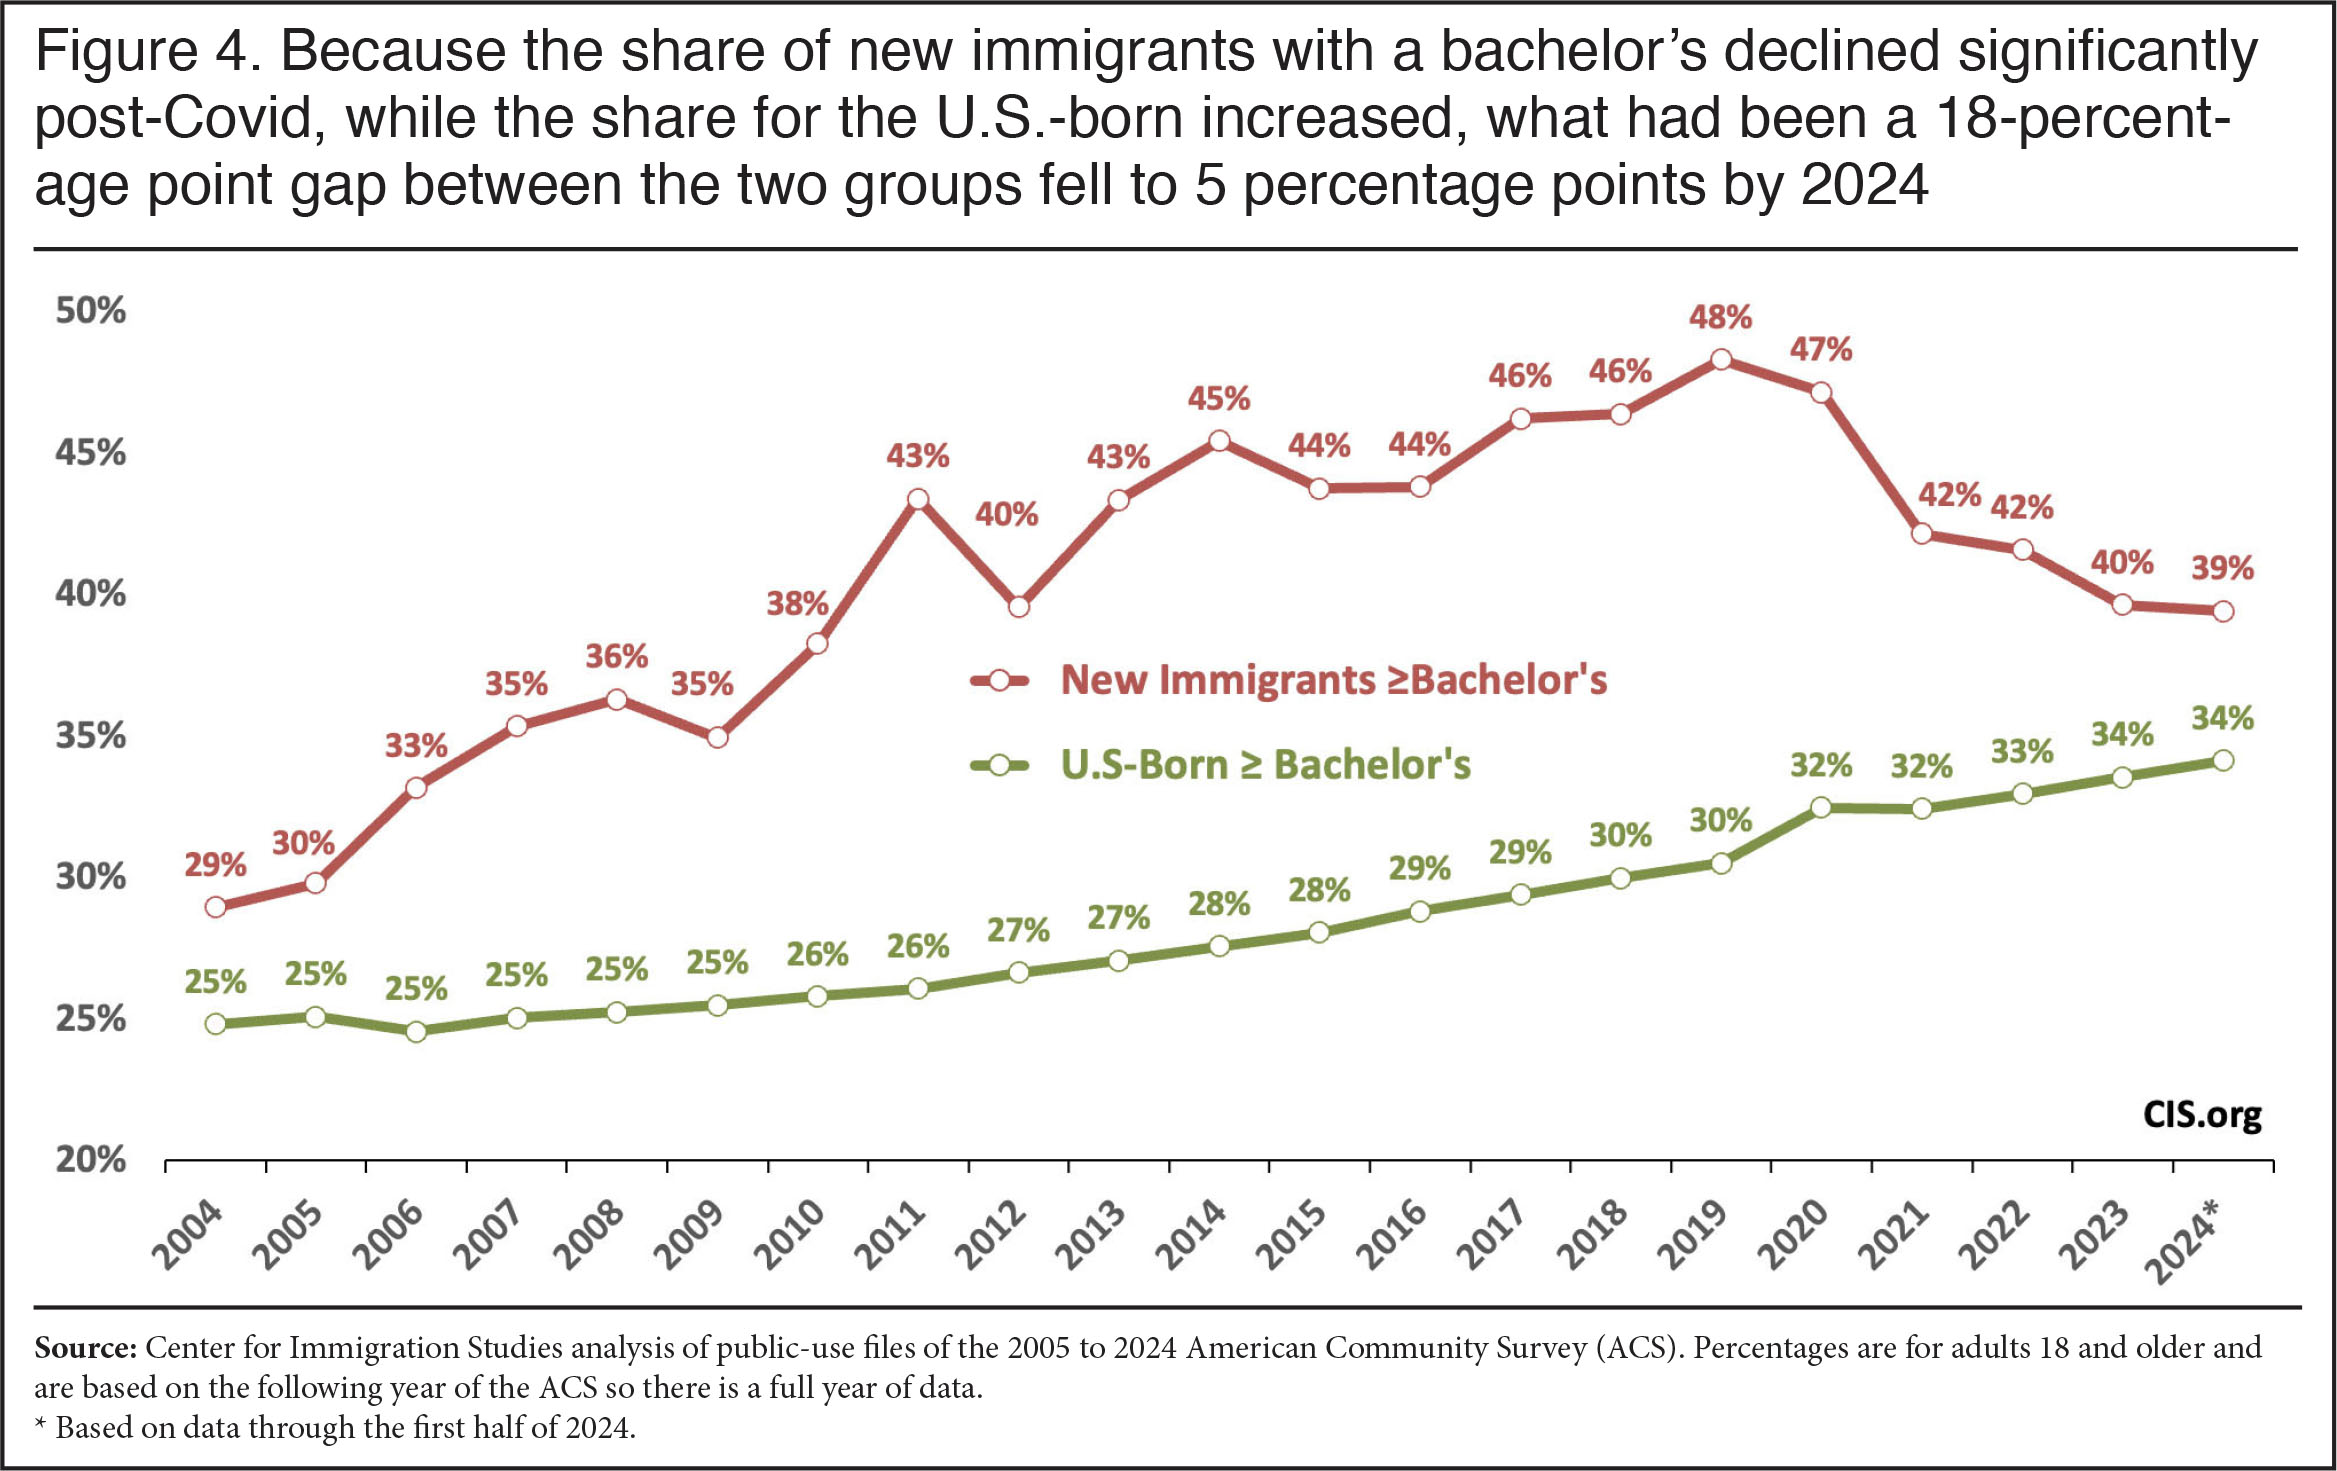
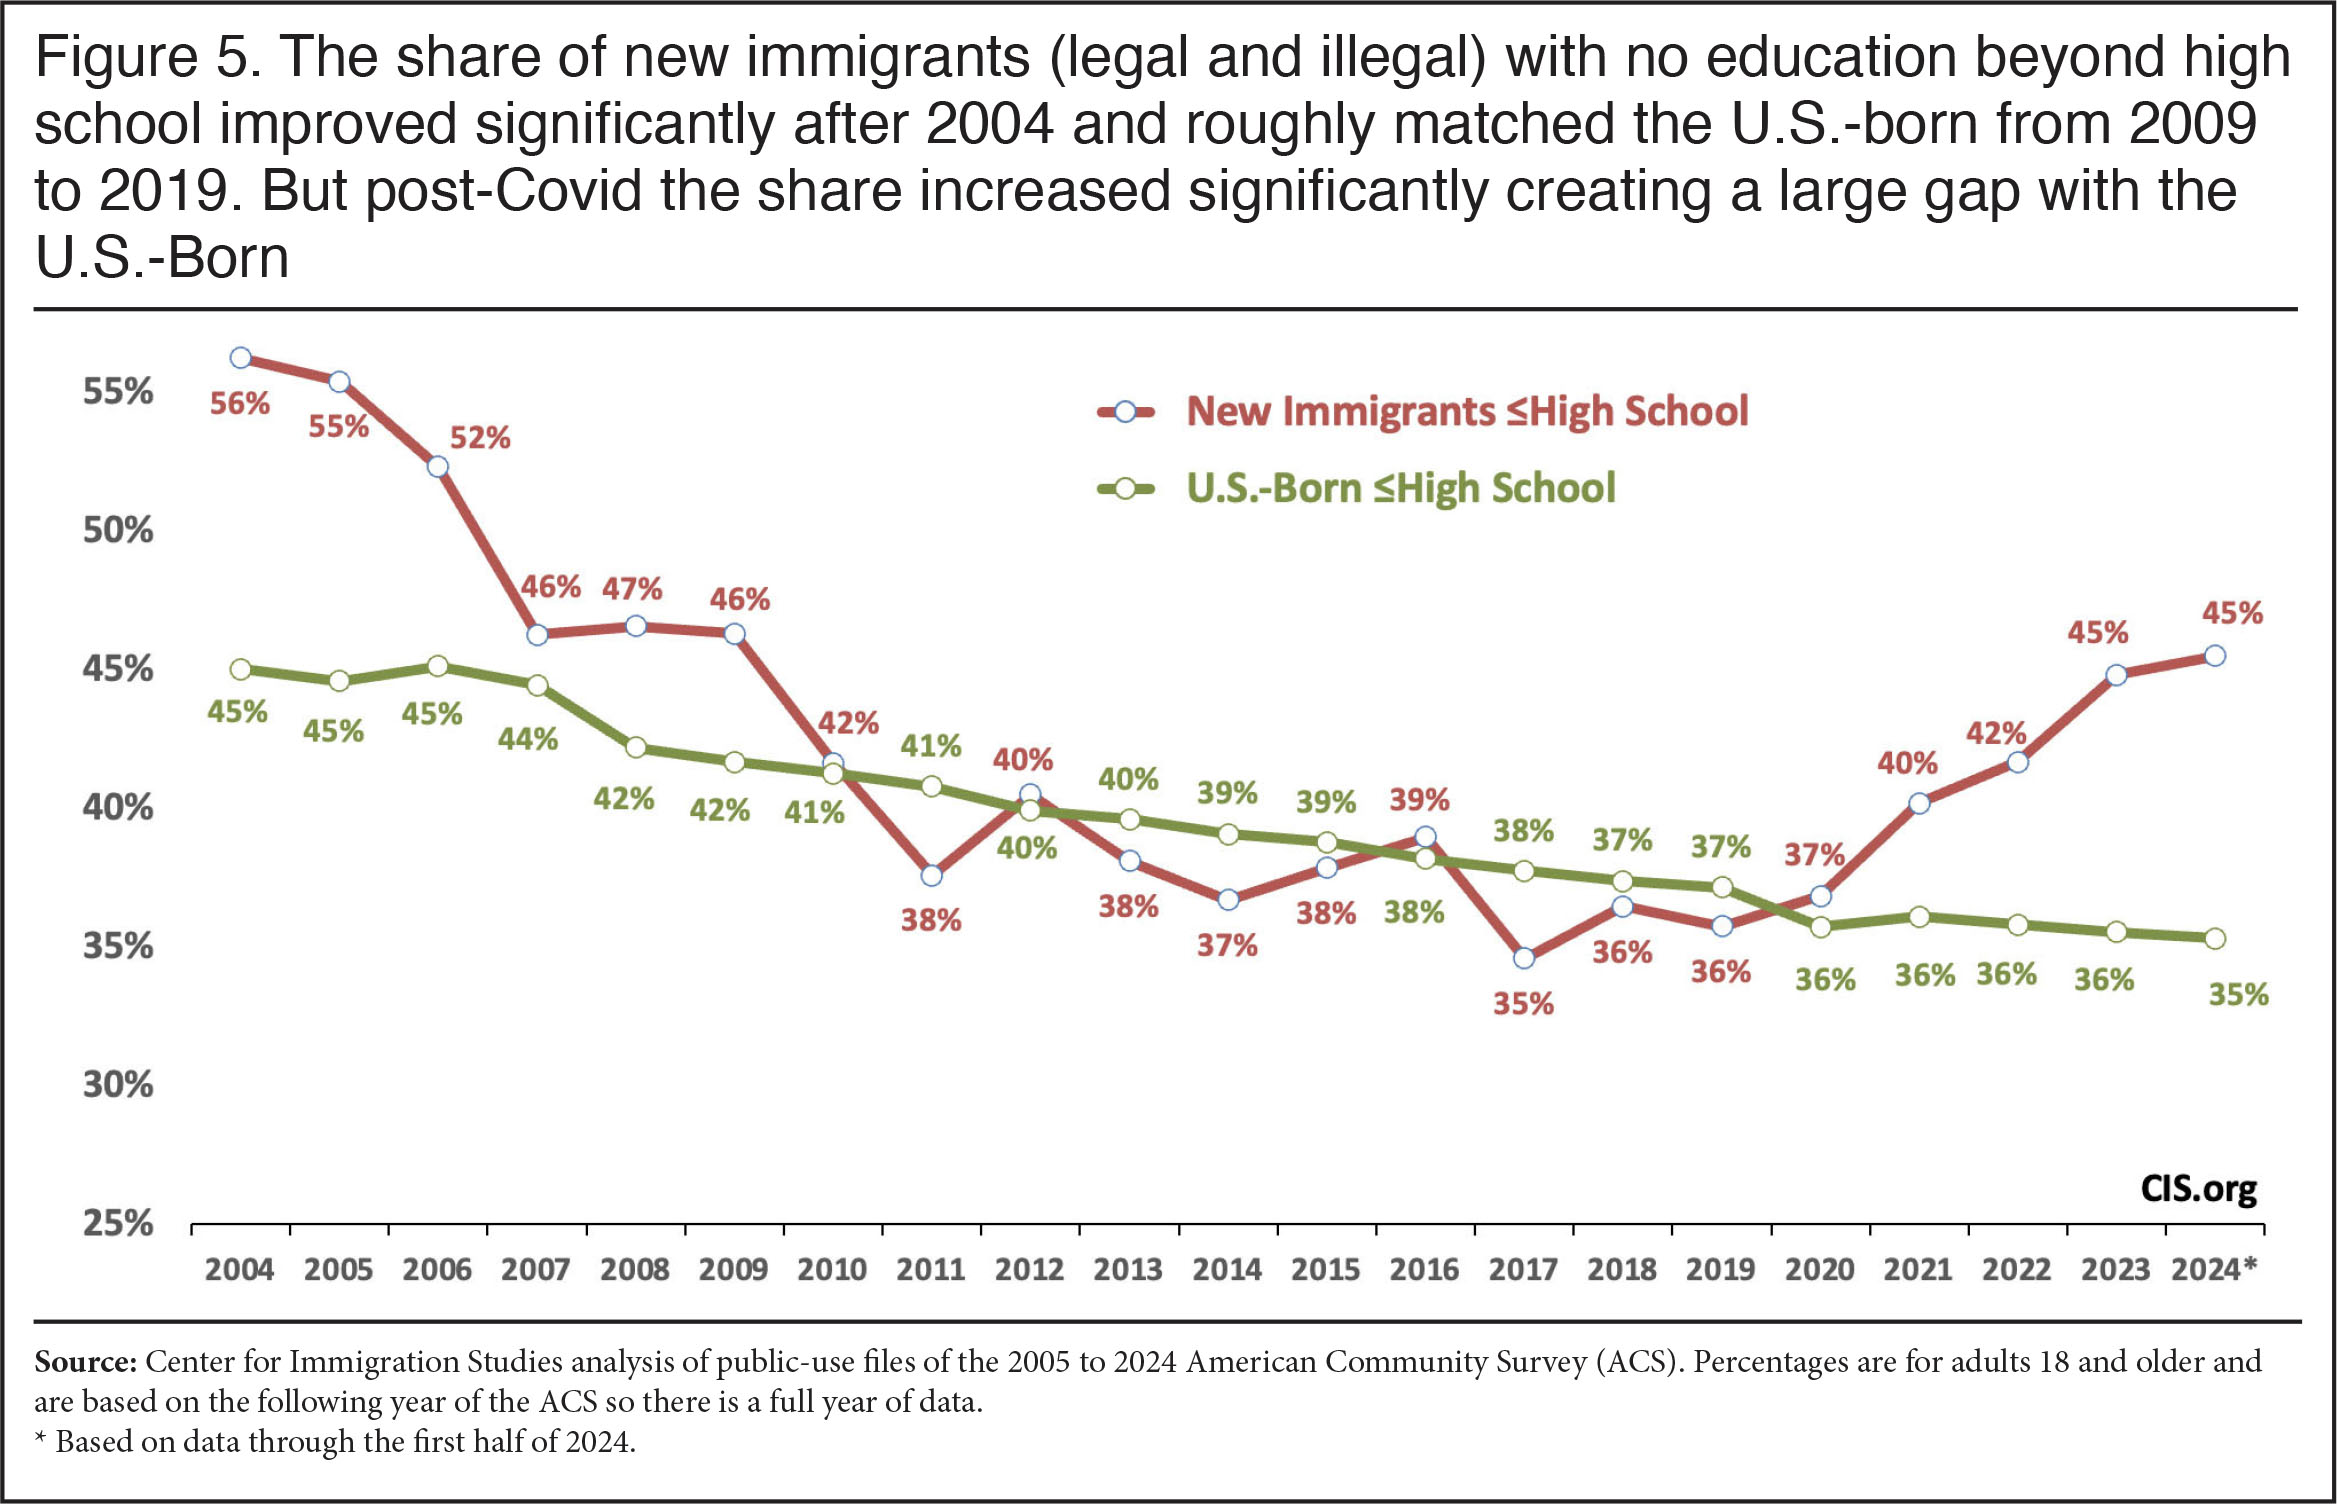
Immigrant Education Compared to the U.S.-Born. Figure 4 shows that, after 2004, the share of new immigrants with a bachelor’s degree generally increased faster than the share among the U.S.-born. By 2019 there was an 18 percentage-point gap between the two groups. But by 2024, the immigrant advantage over the U.S.-born had fallen to just five percentage points. (See Table 1 for more detailed information.) Figure 5 shows that from 2012 to 2019 the share of new immigrants and the U.S.-born with no education beyond high school was roughly equal, but by 2024 newly arrived immigrants had fallen below the U.S.-born by 10 percentage points. In sum, the large advantage new immigrants once had over the U.S.-born in terms of the share with a bachelor’s has narrowed by two-thirds in recent years, while the share of newcomers who have modest levels of education has increased dramatically both in absolute terms and relative to the U.S.-born.
 |
 |
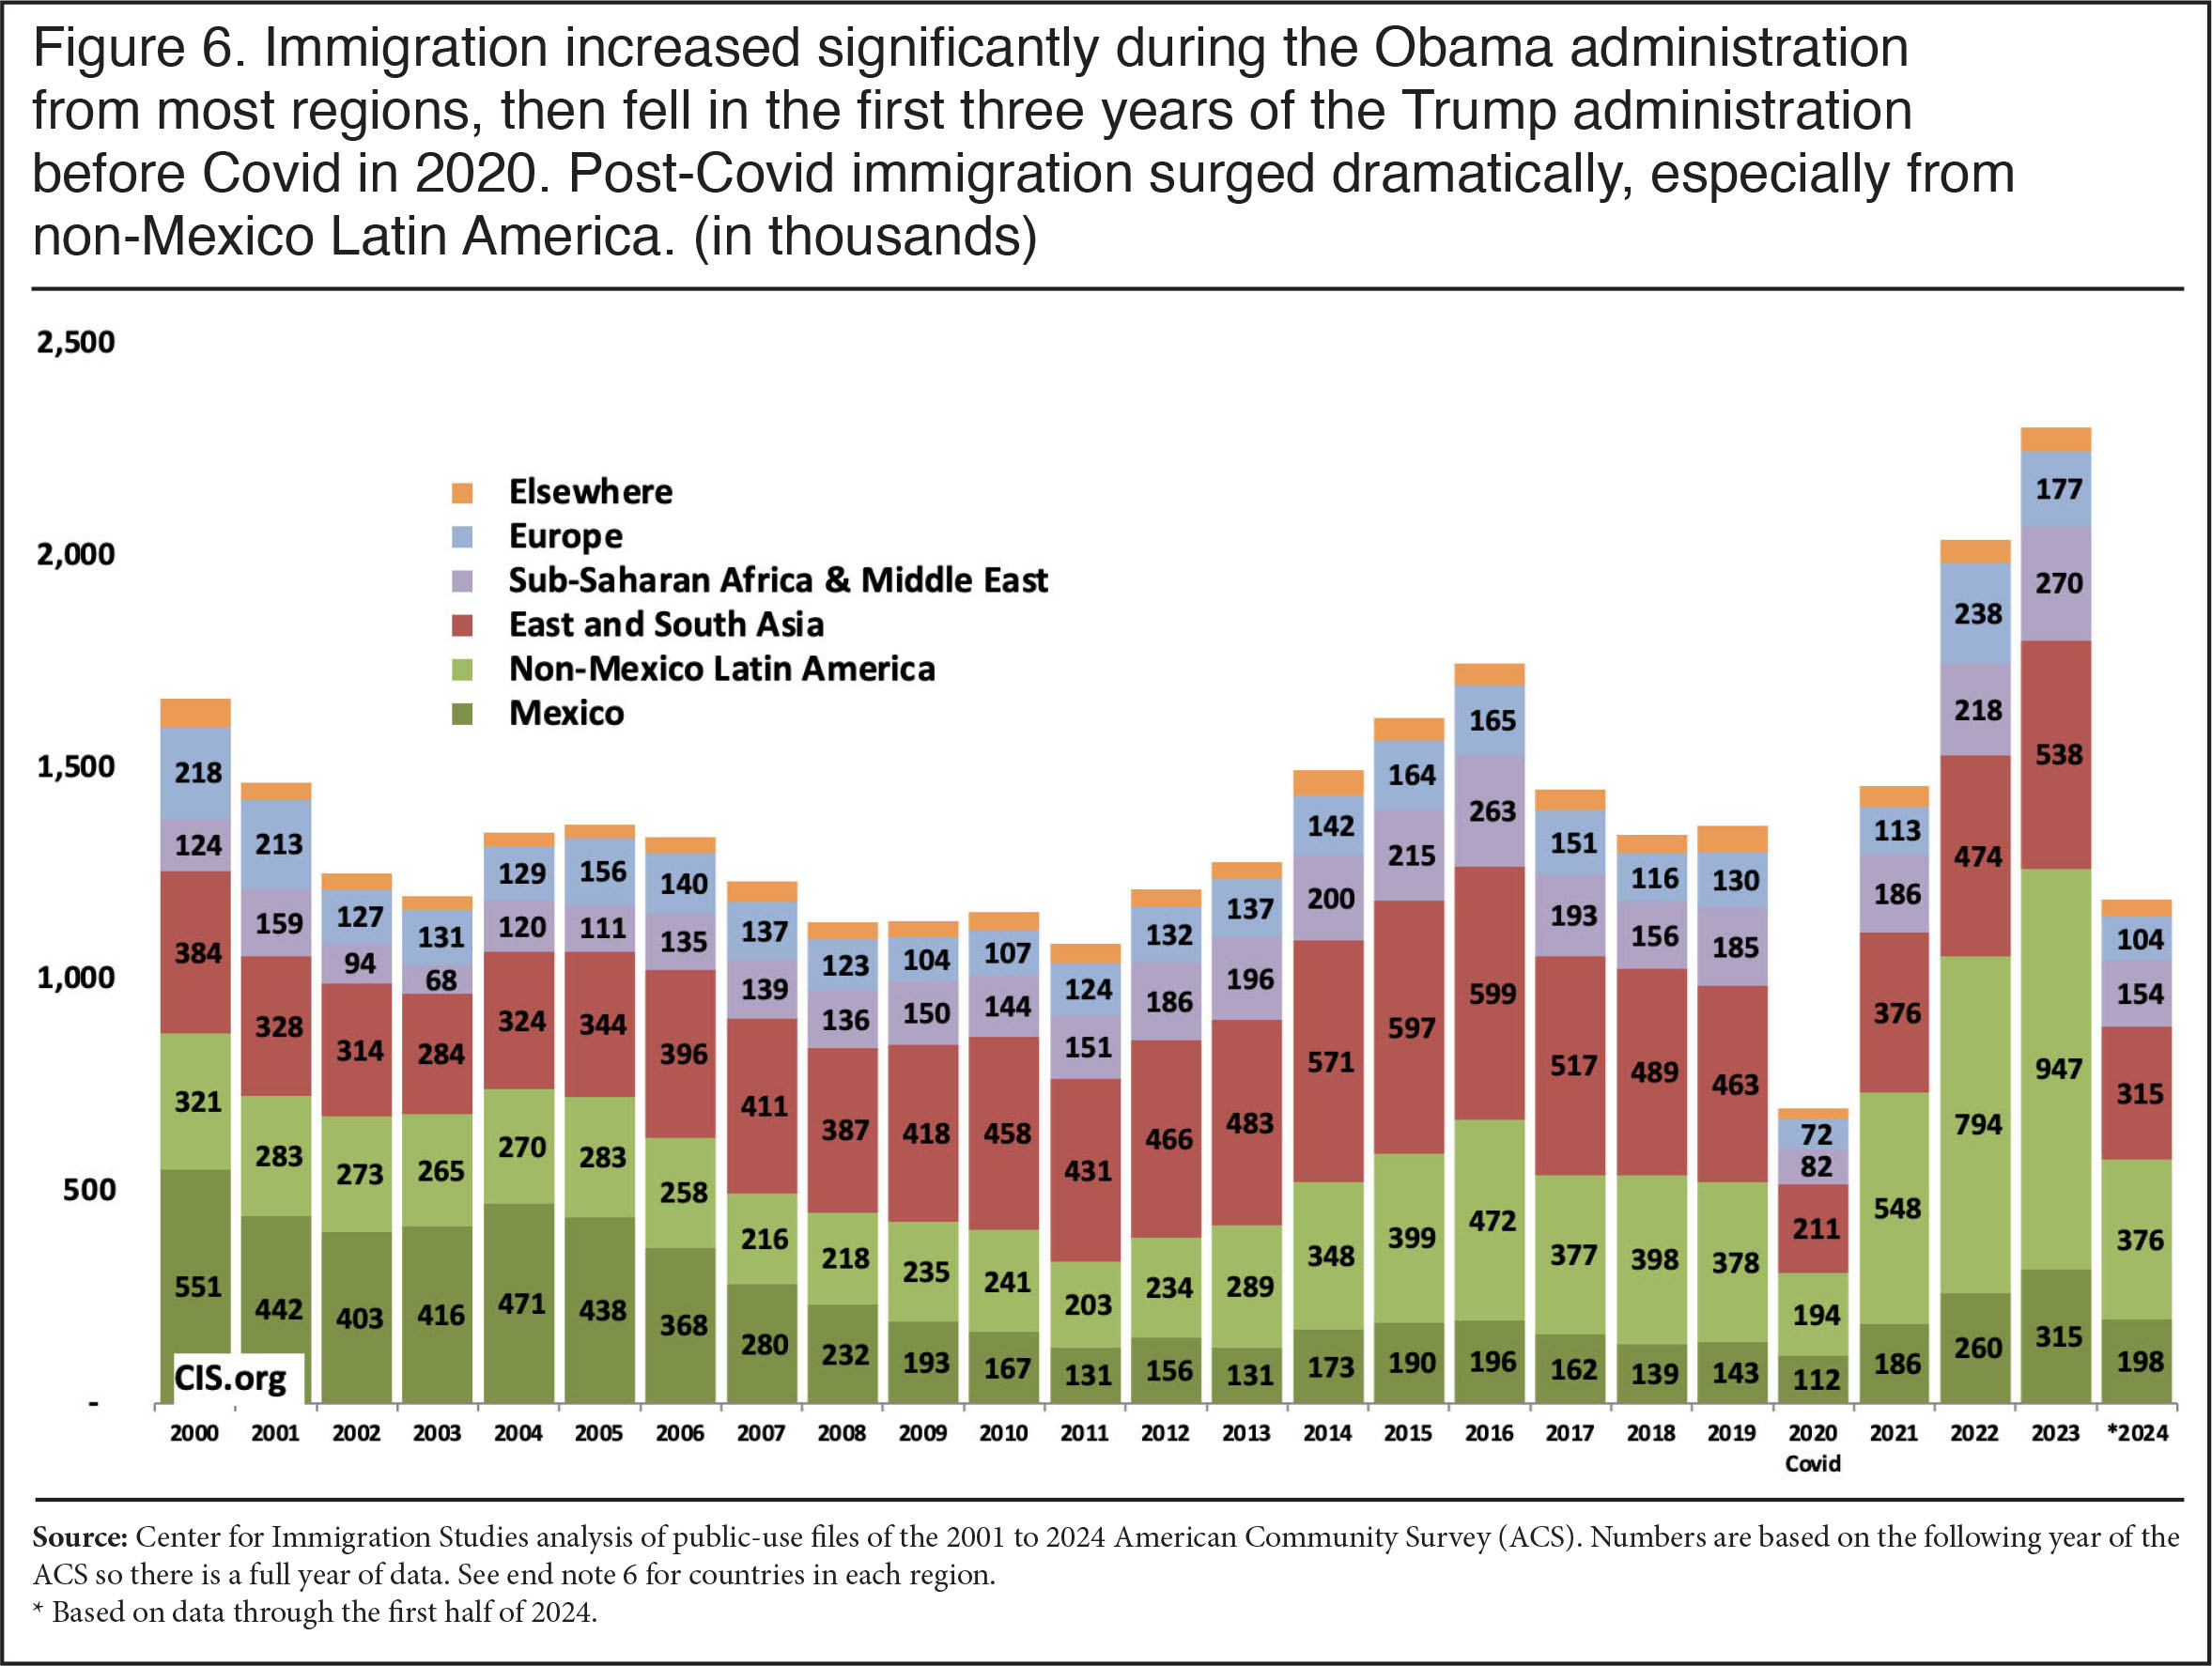
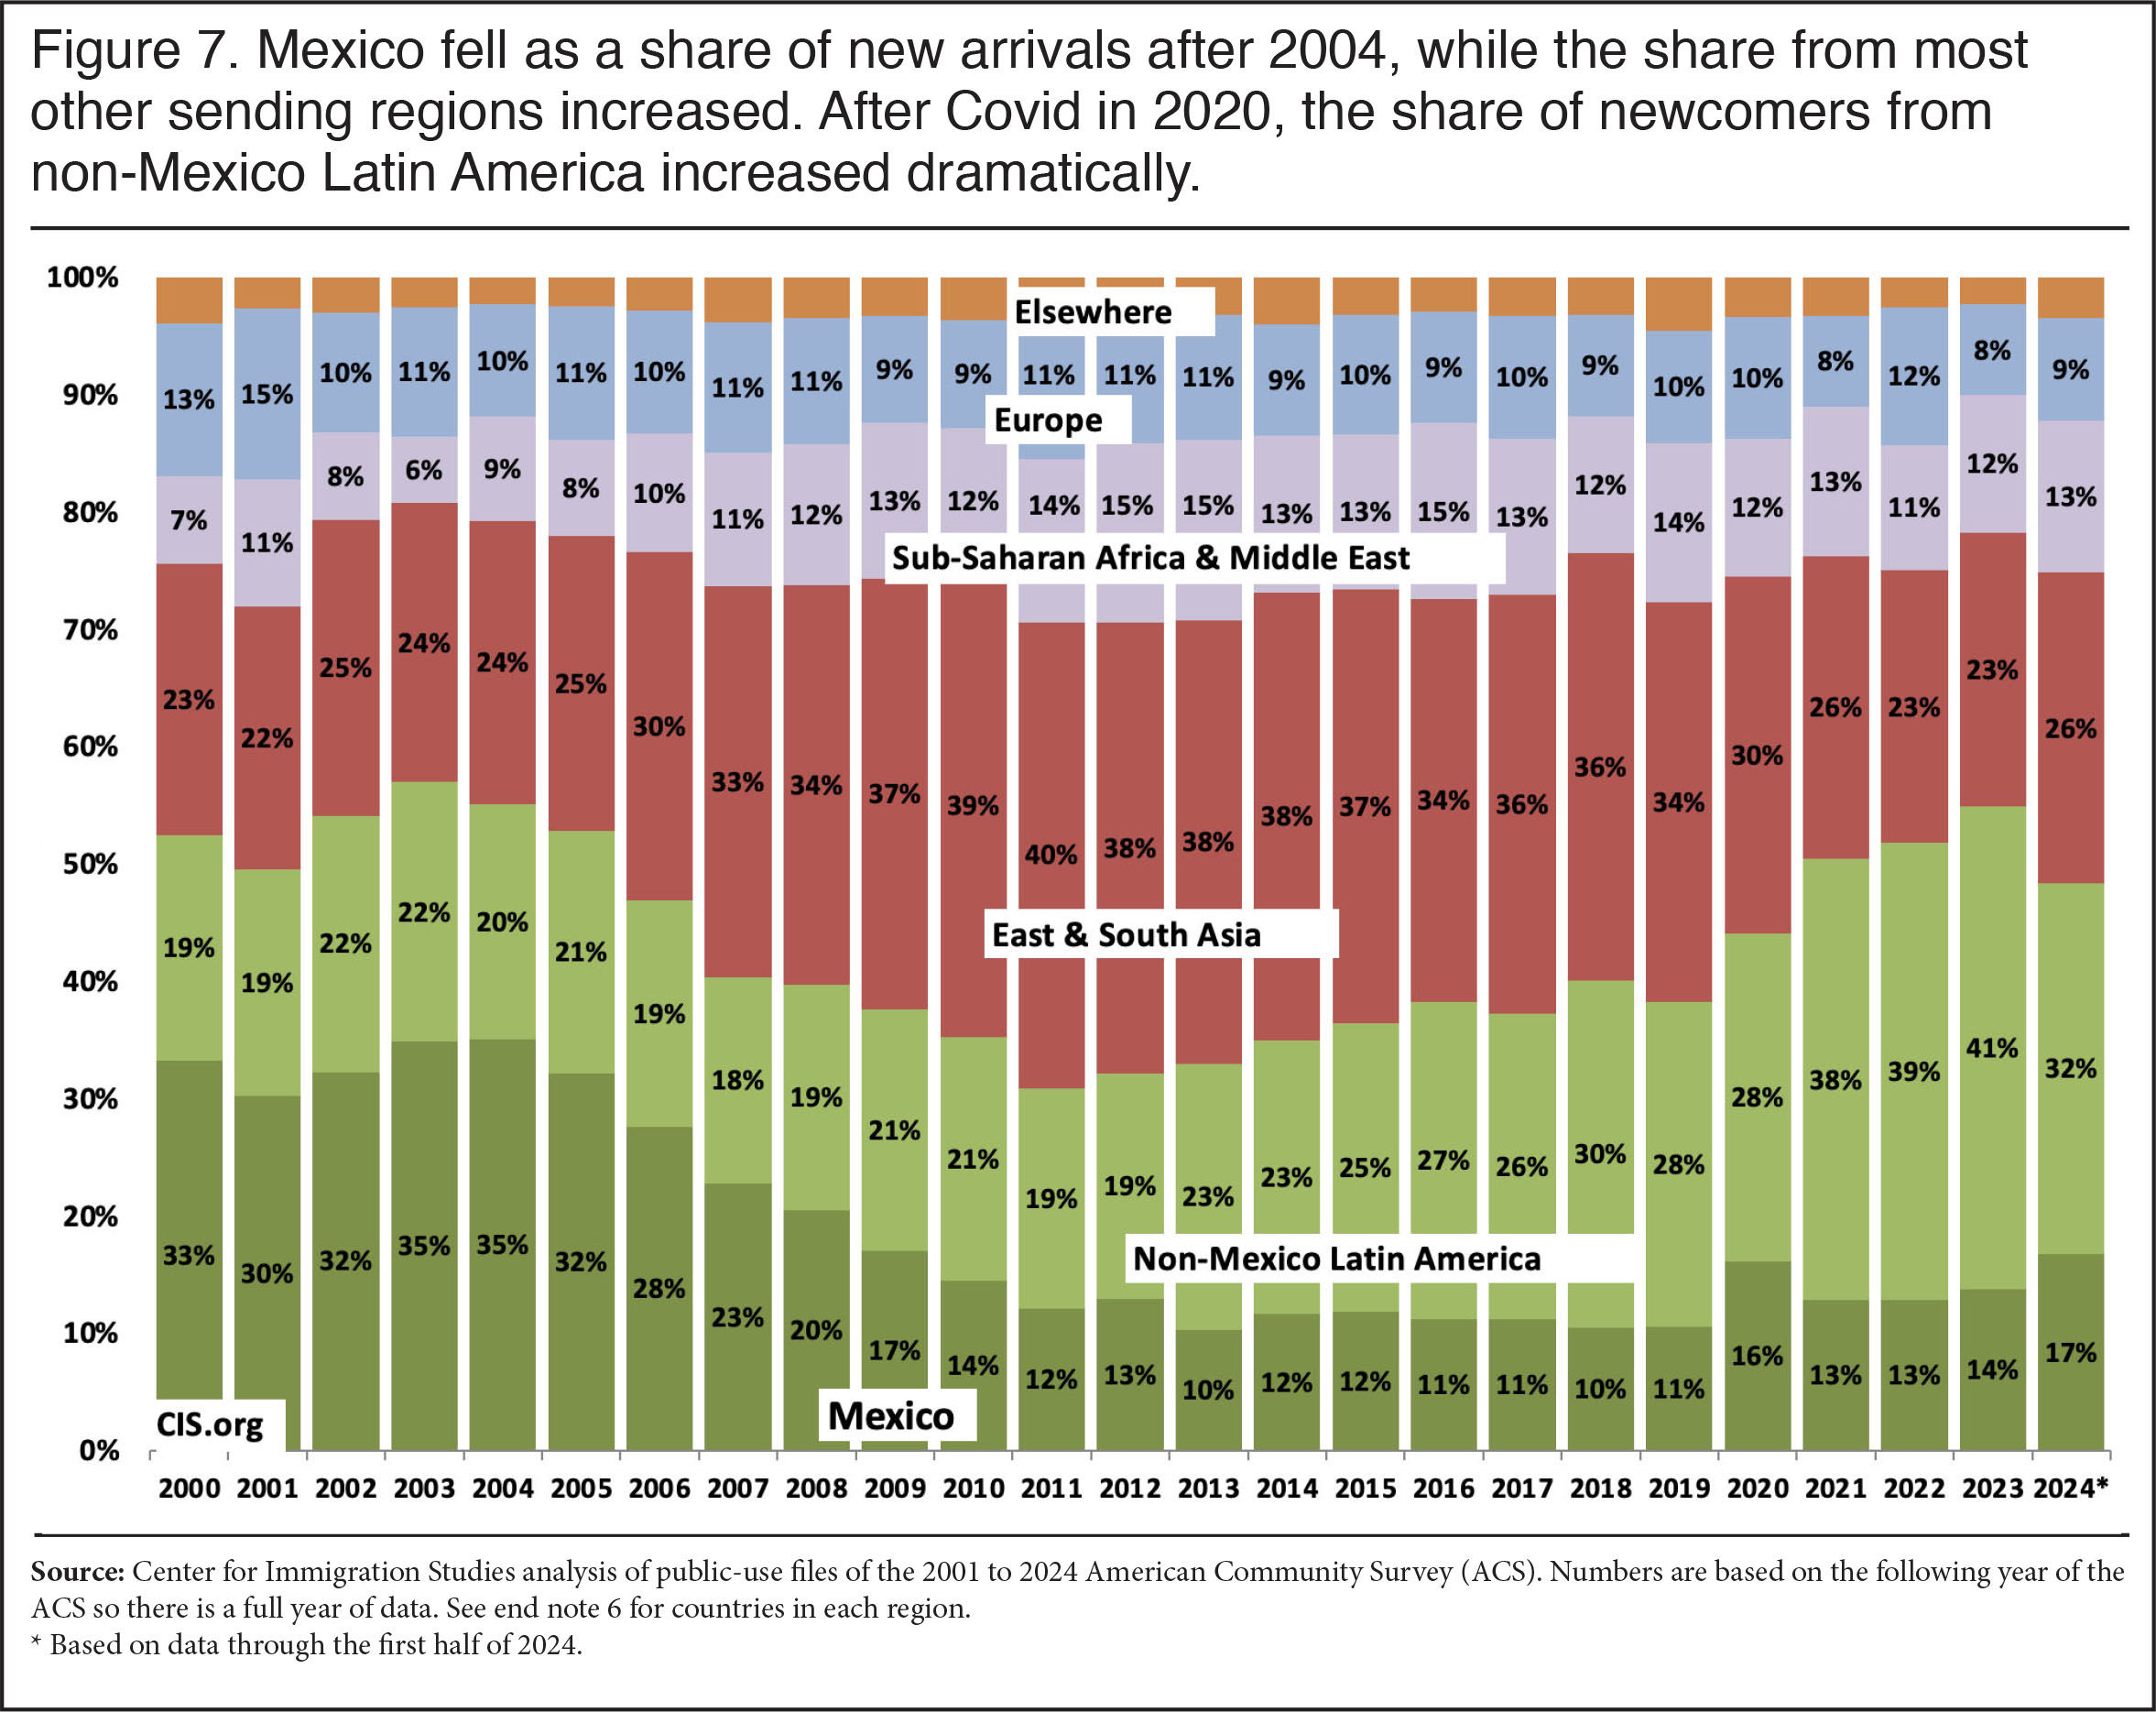
Dramatic Increase in Latin American Immigration. Figure 6 shows the number of newly arrived immigrants by region based on the ACS. The 2.3 million immigrants who came in all of 2023 shown in the ACS is much higher than at any point since the survey became a national survey in 2000 and is almost certainly the highest number in American history. The increase was driven primarily by a huge surge in immigration from Latin American countries other than Mexico, though Mexican immigration also increased post-Covid as well.6 In fact, the number of newcomers from most regions increased, but the increase from countries in Latin America was far more dramatic. Table 2 provides more detailed information by region. Because the number from Mexico and the rest of Latin America has increased so much, Figure 7 shows that, combined, they account for 55 percent of all newcomers in 2023, at the height of the border surge, compared to 38 percent in 2019, prior to Covid-19.
 |
 |
This dramatic increase post-Covid in Latin Americans reflects the border crisis that began in 2021 and the accompanying surge in illegal immigration. Prior research by the Pew Research Center, the Center for Migration Studies, and the Migration Policy Institute all indicate that roughly three-fourths of all illegal immigrants are from Latin America. We also know that 86 percent of all border encounters from January 2021 to October of 2024 were from Latin American countries. While we do not attempt to estimate the illegal share of new arrivals in the ACS in this report or adjust for undercount, based on our prior analysis of other Census Bureau data we find that from the start of 2021 to the beginning of 2025 the illegal population grew from 10.2 million to 15.8 million, though we also found that it fell after January 2025. 7 In terms of those who arrived during the surge from 2021 to 2024, more than half of new arrivals were illegal immigrants.8
Educational Attainment by Region. Figure 8 reports the educational attainment of new adult foreign-born residents who arrived in 2023 and 2024 by sending region. There is enormous variation in the educational level of the foreign-born based on where they came from. As the figure shows, those from Mexico and Latin America tend to be the least educated. Because immigration from Latin America increased so much in recent years relative to other regions, it is the primary reason the overall education level of new arrivals declined significantly.
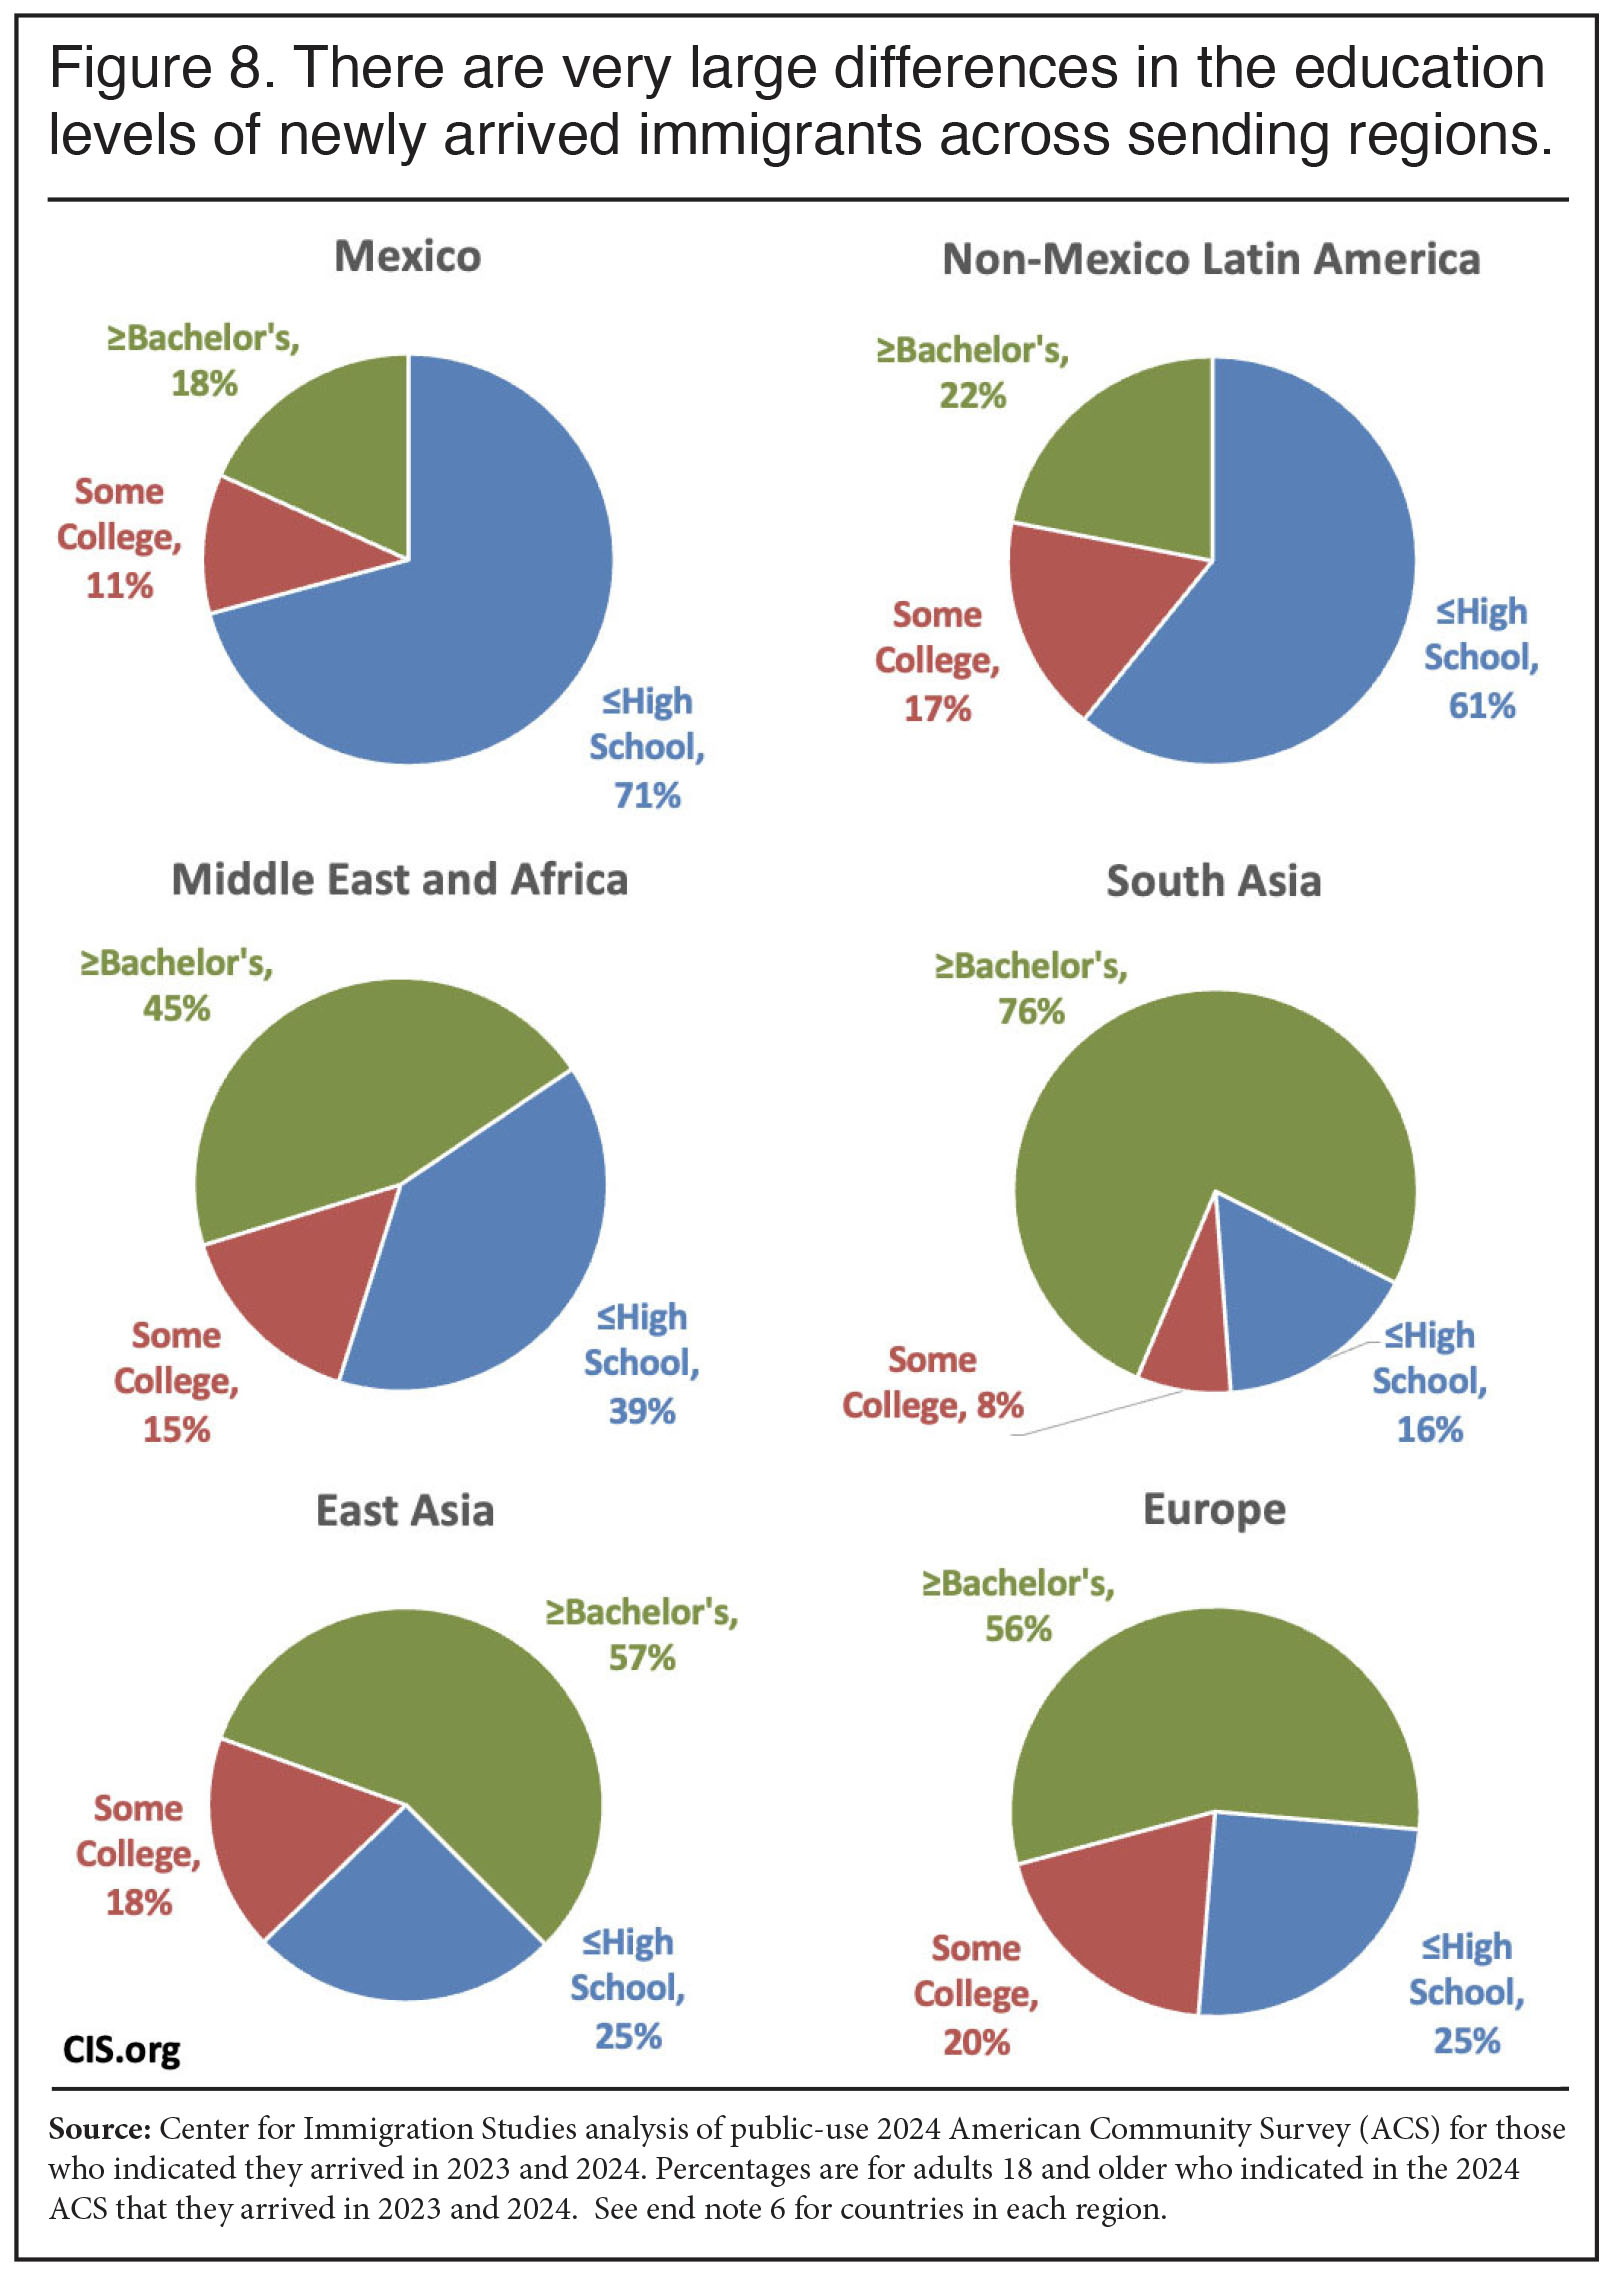 |
Table 3 reports more detailed information by country and education level. After falling for most regions prior to Covid, the share of new immigrants with no more than a high school degree increased for some regions after Covid, especially non-Mexico Latin America. In a similar vein, Table 3 shows an increase in the share of new arrivals with at least a bachelor’s before Covid and then a decline for some regions during the surge, especially Europe, Mexico, and the rest of Latin America. Illegal immigrants arriving at the border came from every part of the world, though Latin America predominated. As a result, illegal immigrants increased their share of newcomers from most sending regions and this likely explained the decline in education within sending regions, even if only modestly.
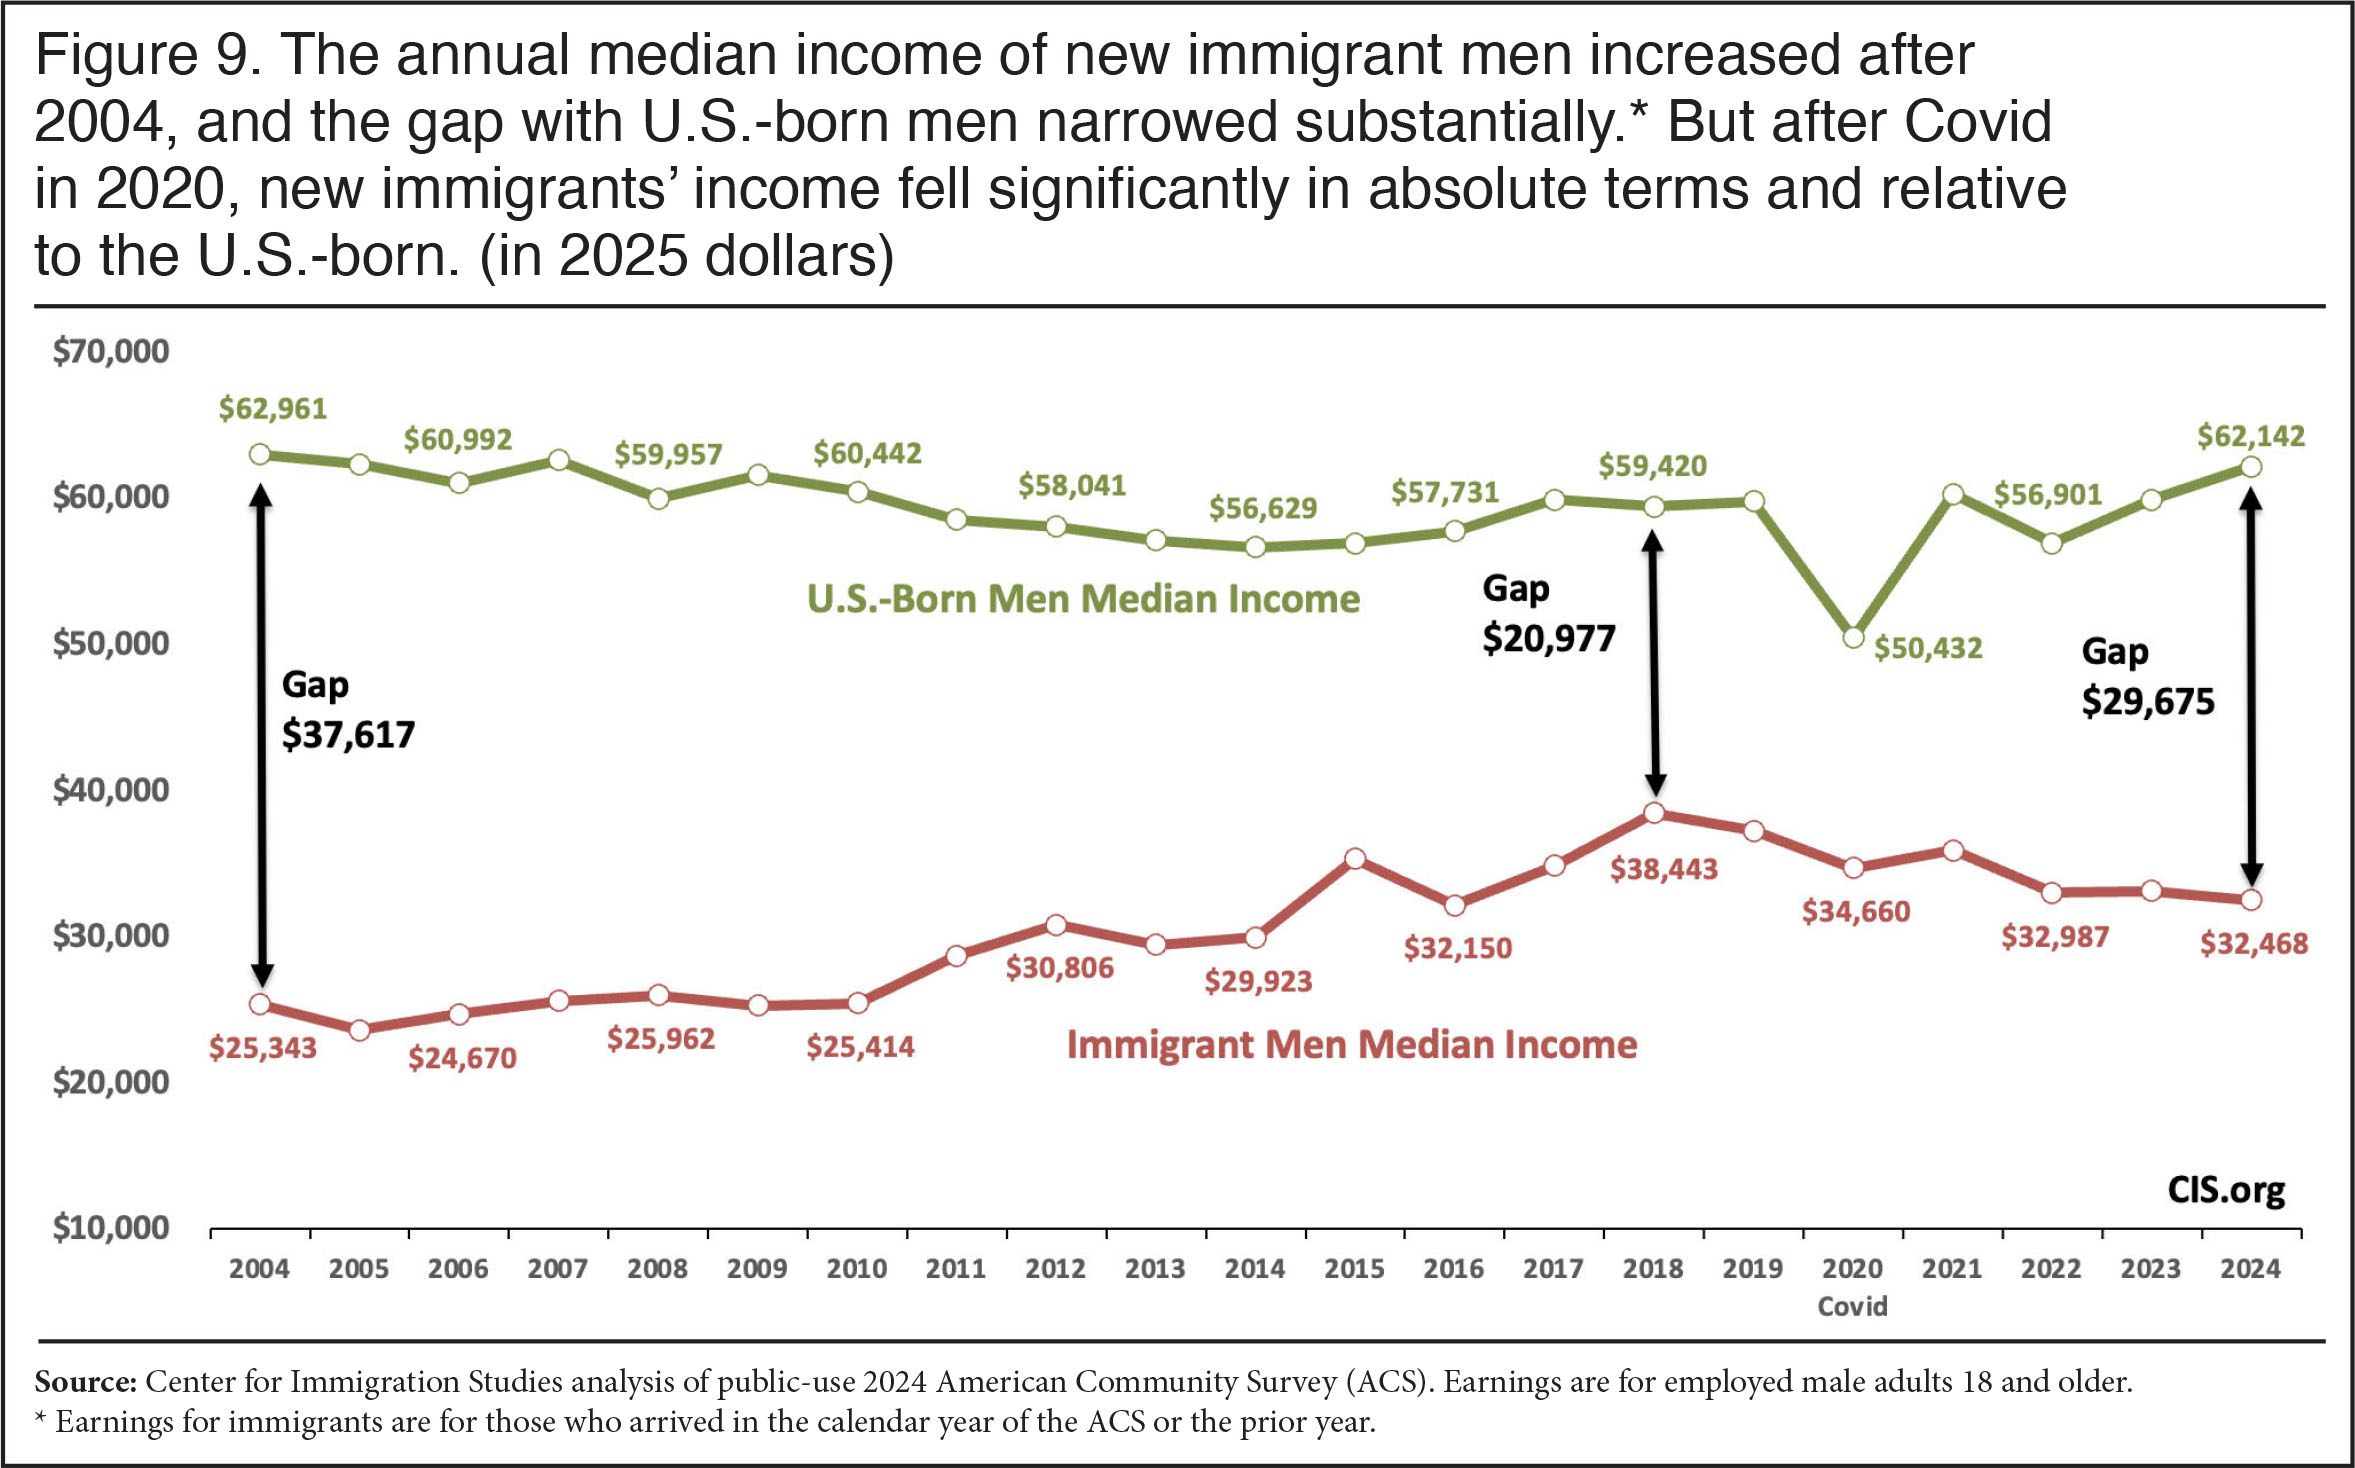
Median Earnings. Figure 9 reports median earnings for newly arrived adult foreign-born men who have lived in the country for 1.5 years.9 Tables 4a and 4b provide more detailed information by sex and single year of arrival.10 Figure 9 shows that, adjusted for inflation, new immigrant men’s median earnings peaked at $38,443 a year in 2018.11 By 2024, the median earnings of new immigrant men had fallen by $5,976 (nearly 16 percent) despite the fact that newcomers were arriving in a very strong economy. In contrast, the earnings for adult U.S.-born men were somewhat higher by 2024 than they had been pre-Covid, again likely reflecting the strength of the economy. As a result, the median earnings of newly arrived immigrant men were only 52 percent that of their U.S.-born counterparts in 2024, compared to 65 percent as much in 2018 and 62 percent in 2019. It seems almost certain that the lower education level of new immigrants has translated into lower median earnings for immigrants, at least initially.
 |
Conclusion
The findings of this analysis show that the steady improvement in the educational level of new adult immigrants, which began around 2004, reversed during the Biden administration. Although some share are missed by the Census Bureau data used in this analysis, the huge influx of immigrants at the border from 2021 to 2024 coincided with a dramatic deterioration in the education level of new arrivals. This increase has been primarily driven by an increase in new arrivals from Latin America, particularly countries other than Mexico. At least half or more of those who settled in the United States in 2021 to 2024 were new illegal immigrants. A substantial increase compared to the years before Covid in 2020.
Prior government and non-government estimates, as well as administrative data on border encounters, show that the overwhelming majority of illegal immigrants are from Latin America. Immigrants from Latin America to the United States tend to be the least educated compared to immigrants from other sending regions. As the share of newcomers who are from Latin America increased, the percentage of new arrivals with a bachelor’s fell from 48 percent in 2019 before Covid, to 39 percent in 2024. The share with no education beyond high school increased from 36 percent to 45 percent over the same time period. The years 2022, 2023, and 2024 are the first time in more than a decade that the share of new immigrants with no education beyond high school outnumbered those with at least a college degree.
The deterioration in the education level of new foreign-born residents was caused entirely by a large numerical increase in the arrival of immigrants with very modest levels of education. The number of adult newcomers with a high school diploma or less increased by 109 percent from 2019 to 2023, the last full year for which there is data. The number with at least a bachelor’s or more also increased, but by only 37 percent during the same time period. In short, the number of adult immigrants of every education level increased during the surge, but the number of new less-educated immigrants increased proportionally much more than that of better-educated immigrants.
The significant falloff in the education level of the new foreign-born residents is profoundly important because there is no single better predictor of how they are likely to do in the modern American economy than their educational level at arrival. This includes income, use of social services, tax contributions, and many other measures of socio-economic status. Of course, many new immigrants are very skilled and can be expected to prosper in the United States. Moreover, the earnings of the foreign-born with modest levels of education should still increase over time. That said, in 2024 newly arrived immigrant men earned only 52 percent of what U.S.-born men earned compared to 62 percent in 2019 and 65 percent in 2018. The much lower income of these newcomers is a clear indication that they are starting out significantly poorer than their counterparts in years past, with implications for them and the broader American society.
Finally, adding so many less-educated immigrants to the country cannot help but to increase job competition for less-educated U.S.-born workers and legal immigrants already here. The less-educated already have the lowest wages, so adding so many immigrants to the labor force with modest levels of skills is very likely to keep down wages for the poorest workers. The Biden administration’s decision to allow very large numbers of less-educated immigrants to settle in the country will almost certainly have profound consequences for the United States for years to come.
End Notes
1 The ACS reflects the population in the middle of each year, so new arrivals in 2024 using the 2024 data have only lived in the country for half a year, which means they have not had enough time to have a year’s worth of earnings. To make a consistent comparison over time, we define new arrivals here as having lived in the country for 1.5 years so that in 2024 we are comparing immigrants who arrived in 2023 and the first part of 2024 in the 2024 data. The figures for 2023 are for those who arrived in 2022 and the first part of 2023 based on the 2023 data. We do this for all years back to 2000.
2 Figures are from the 2024 ACS, with new arrivals defined as having lived in the country for 1.5 years, excluding those in institutions.
3 This is based on the public-use Current Population Survey Annual Social and Economic Supplement for 2024.
4 The term “immigrant” has a specific meaning in U.S. immigration law, which is all those inspected and admitted as lawful permanent residents. In this analysis, we use the term “immigrant” in the non-technical sense of the word to mean all those who were not U.S. citizens at birth. Typically, the government refers to these individuals in surveys such as the CPS and ACS as the “foreign-born”. While it may surprise some, the Census Bureau is clear that illegal immigrants are included in its surveys such as the ACS and CPS. Although there is some undercount, immigrants, or the foreign-born, in the ACS include legal immigrants (including those who have become naturalized citizens), long-term temporary visitors (e.g. guestworkers), and illegal immigrants.
5 This improvement took place after a long and well-documented deterioration in the education level of new immigrants relative to the U.S.-born.
6 Countries included in each sending region using the ACS in 2023 are: Mexico; Non-Mexico Latin America: Belize, Costa Rica, El Salvador, Guatemala, Honduras, Nicaragua, Panama, Cuba, Dominican Republic, Haiti, Jamaica, Bermuda, Bahamas, Barbados, Dominica, Grenada, Trinidad and Tobago, St. Kitts-Nevis, Caribbean n.s., West Indies n.s., Argentina, Bolivia, Brazil, Chile, Colombia, Ecuador, Guyana/British Guiana, Peru, Uruguay, Venezuela, Paraguay, South America n.s., Americas n.s.; East Asia: China, Japan, Korea, Mongolia, Cambodia, Indonesia, Laos, Malaysia, Philippines, Singapore, Thailand, Vietnam, Burma, Asia n.e.c./n.s.; South Asia: India, Bangladesh, Bhutan, Pakistan, Sri Lanka, Nepal; Middle East and Africa: Azerbaijan, Kazakhstan, Kirghizia, Uzbekistan, Afghanistan, Iran, Iraq, Israel/Palestine, Jordan, Kuwait, Lebanon, Saudi Arabia, Syria, Turkey, United Arab Emirates, Yemen Arab Republic (North), Algeria, Egypt/United Arab Rep., Libya, Morocco, Sudan, North Africa n.s., Gambia, Ghana, Guinea, Liberia, Nigeria, Senegal, Sierra Leone, Togo, Western Africa n.s., Ethiopia, Kenya, Rwanda, Somalia, Tanzania, Uganda, Zambia, Zimbabwe, Eastern Africa n.e.c./n.s., Eritrea, Cameroon, Congo, Zaire, South Africa (Union of), Cape Verde, Africa n.e.c./n.s; Europe: Denmark, Finland, Iceland, Norway, Sweden, United Kingdom, Ireland, Belgium, France, Netherlands, Switzerland, Greece, Italy, Portugal, Spain, Austria, Czechoslovakia, Slovakia, Czech Republic, Germany, Hungary, Poland, Romania, Bulgaria, Bosnia and Herzegovina, Kosovo, Croatia, Macedonia, Serbia, Latvia, Lithuania, Other USSR/Russia, Byelorussia, Ukraine, Belarus, Moldova, USSR n.s., Europe n.s., Armenia, Georgia; Canada and Elsewhere: Australia, New Zealand, Fiji, Tonga, Micronesia, Samoa.
7 These figures reflect adjustments for undercount and are not directly comparable to the data from the ACS.
8 Our definition of illegal immigrants includes newcomers with pending defensive asylum applications and parolees. All of the above individuals are inadmissible aliens under the Immigration and Nationality Act (INA), and the vast majority are subject to removal. However, some researchers might not count most of those with pending asylum claims and parolees as illegal immigrants.
9 Looking at 1.5 years provides time for the new immigrants to have annual income over the course of a year.
10 Table 4a provides earnings for those who have lived in the country for 1.5 years while Table 4b reports earnings for those who have lived in the country for a single year with 2024 being based on data for only the first half of the year.
11 Economists often look at trends in male incomes because they should be less impacted by changing social expectations than women and have traditionally worked more and been paid more. See Tables 4a and 4b for information for foreign-born and native-born women.