Census Bureau surveys show newly arrived immigrants (legal and illegal together) are much larger in number, less educated, and poorer than newcomers before Covid. Although some immigrants (also referred as the foreign-born) are missed by the surveys, the primary reason for the decline is the enormous increase in illegal immigrants from Latin America, who tend to be significantly less educated than legal immigrants. The recent decline in the education level of newcomers is in stark contrast to the improvement in their education levels in the years prior to the border surge. This deterioration in education levels has profound implications for new immigrants’ social mobility and impact on the United States.
Among the findings:
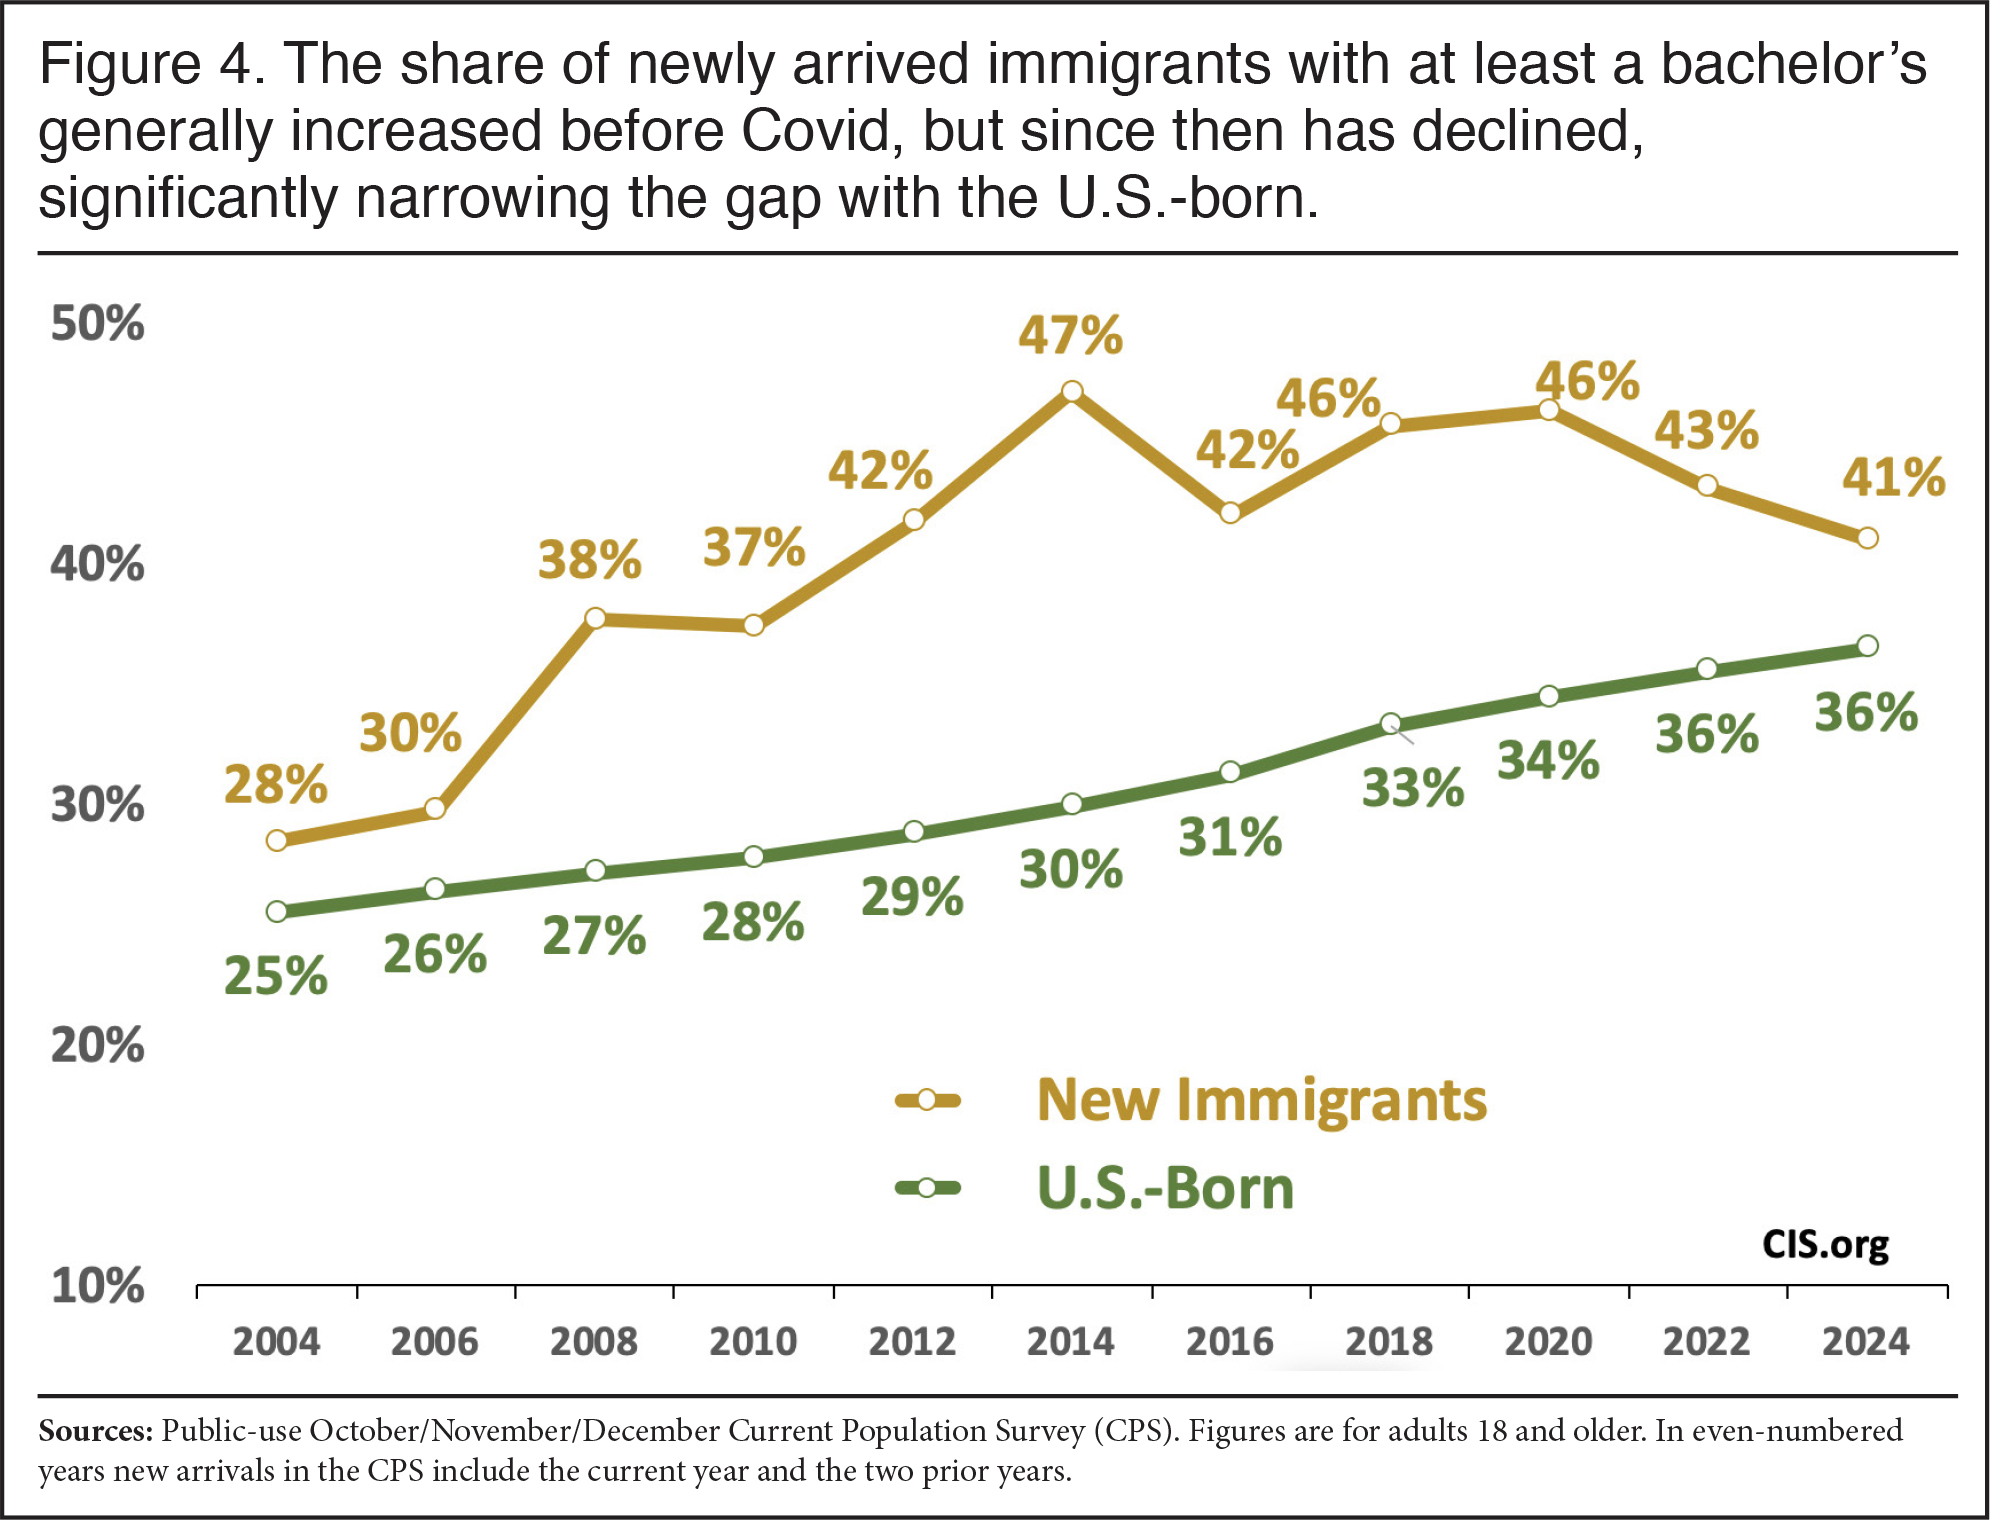
- The Current Population Survey (CPS) in the fourth quarter of 2024 showed that 41 percent of adult immigrants who had lived in the country for less than three years had at least a bachelor’s, compared to 46 percent of new arrivals in 2018 before the border surge.
- The CPS also showed that the share of new arrivals with no education beyond high school increased from 36 percent in 2018 to 46 percent in 2024.
- This was the first time in more than a decade that new adult immigrants with no education beyond high school outnumbered those with a bachelor’s. The education level of new immigrants increased significantly in the decade and a half prior to Covid.
- The decline in educational attainment is more pronounced when measured against the U.S.-born, whose education levels have improved. In 2018 the share of new adult immigrants with no education beyond high school roughly matched the U.S.-born. But by 2024 it was 46 percent for new immigrants and 35 percent for the U.S.-born.
- The decline in the overall education of newcomers is due to a huge numerical increase in the number of less-educated immigrants. The number of new adult immigrants with no education beyond high school is up 103 percent since 2018, while the number with at least a bachelor’s is up 44 percent.
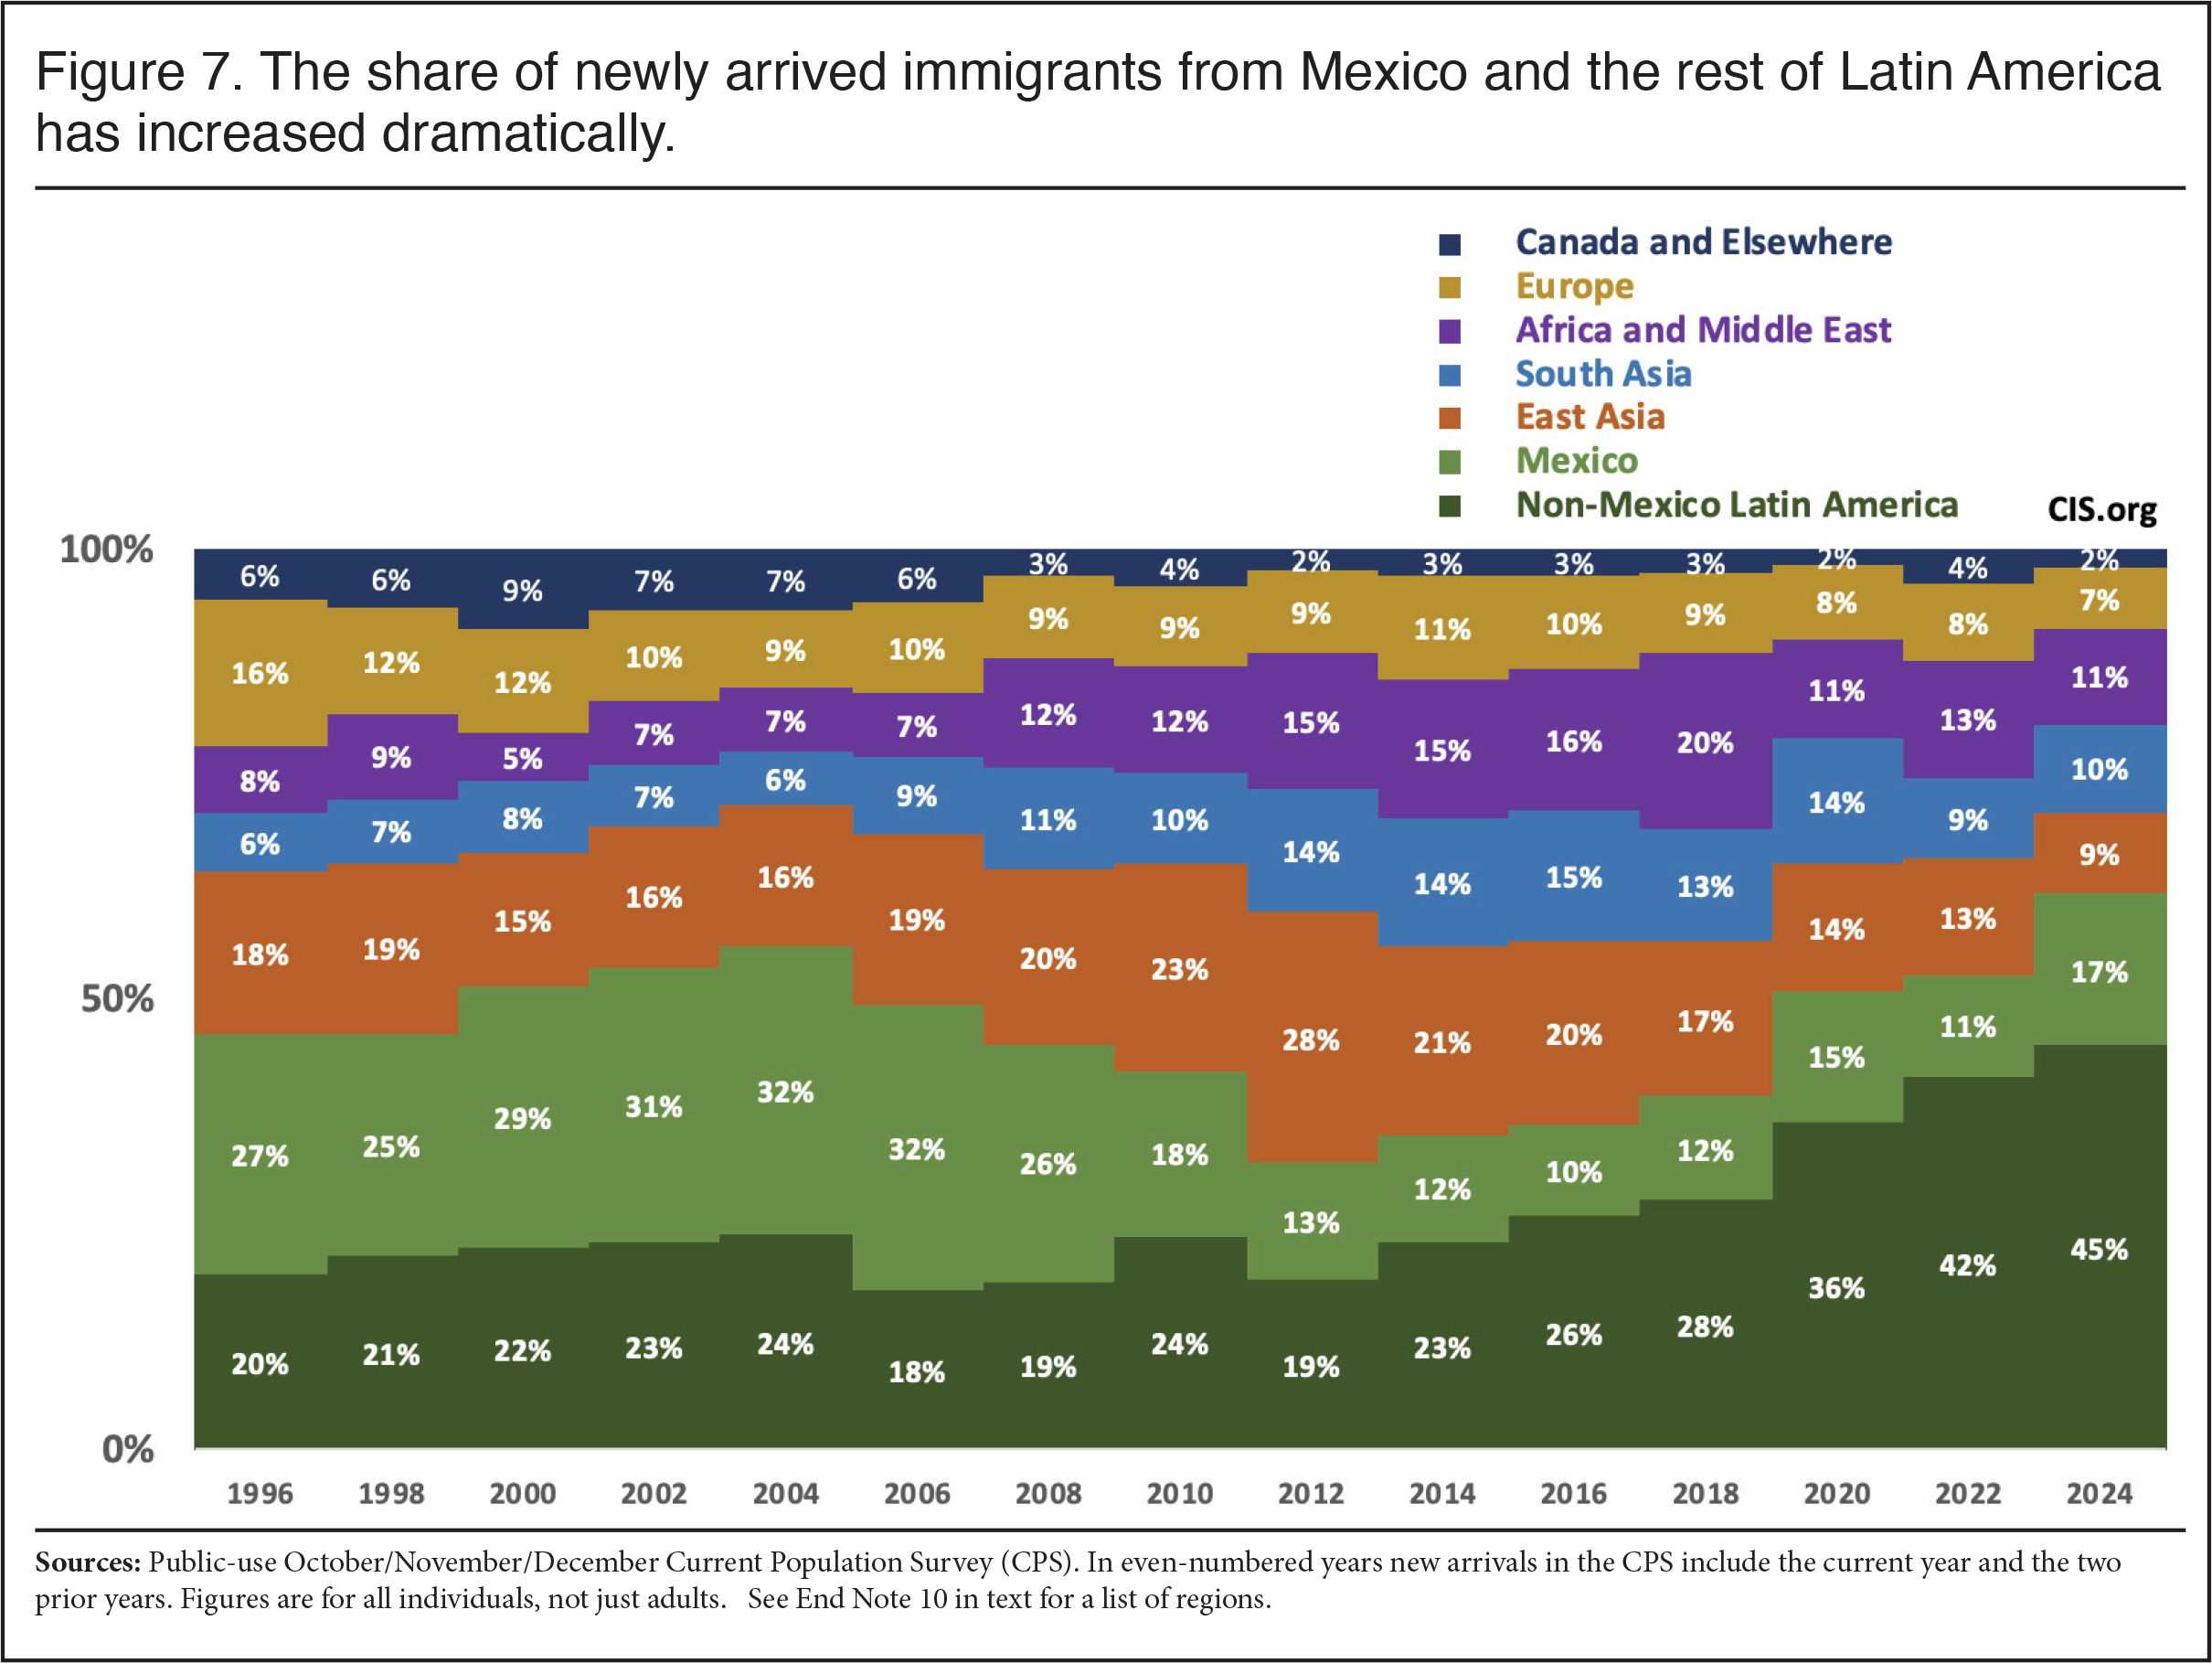
- The surge in illegal immigration is reflected in a dramatic increase in new arrivals from Latin America, who tend to have the lowest education levels of any sending region. Latin Americans increased from 39 percent of new arrivals in 2018 to 62 percent by 2024.
- The decline in education levels has increased the share of new immigrants with low incomes (<200 percent of the poverty threshold). Despite a strong economy, the share of newcomers with low incomes was higher in 2024 (54 percent) than in 2018 (49 percent). Among the U.S.-born, the share fell from 28 to 25 percent, significantly widening the gap with newcomers.
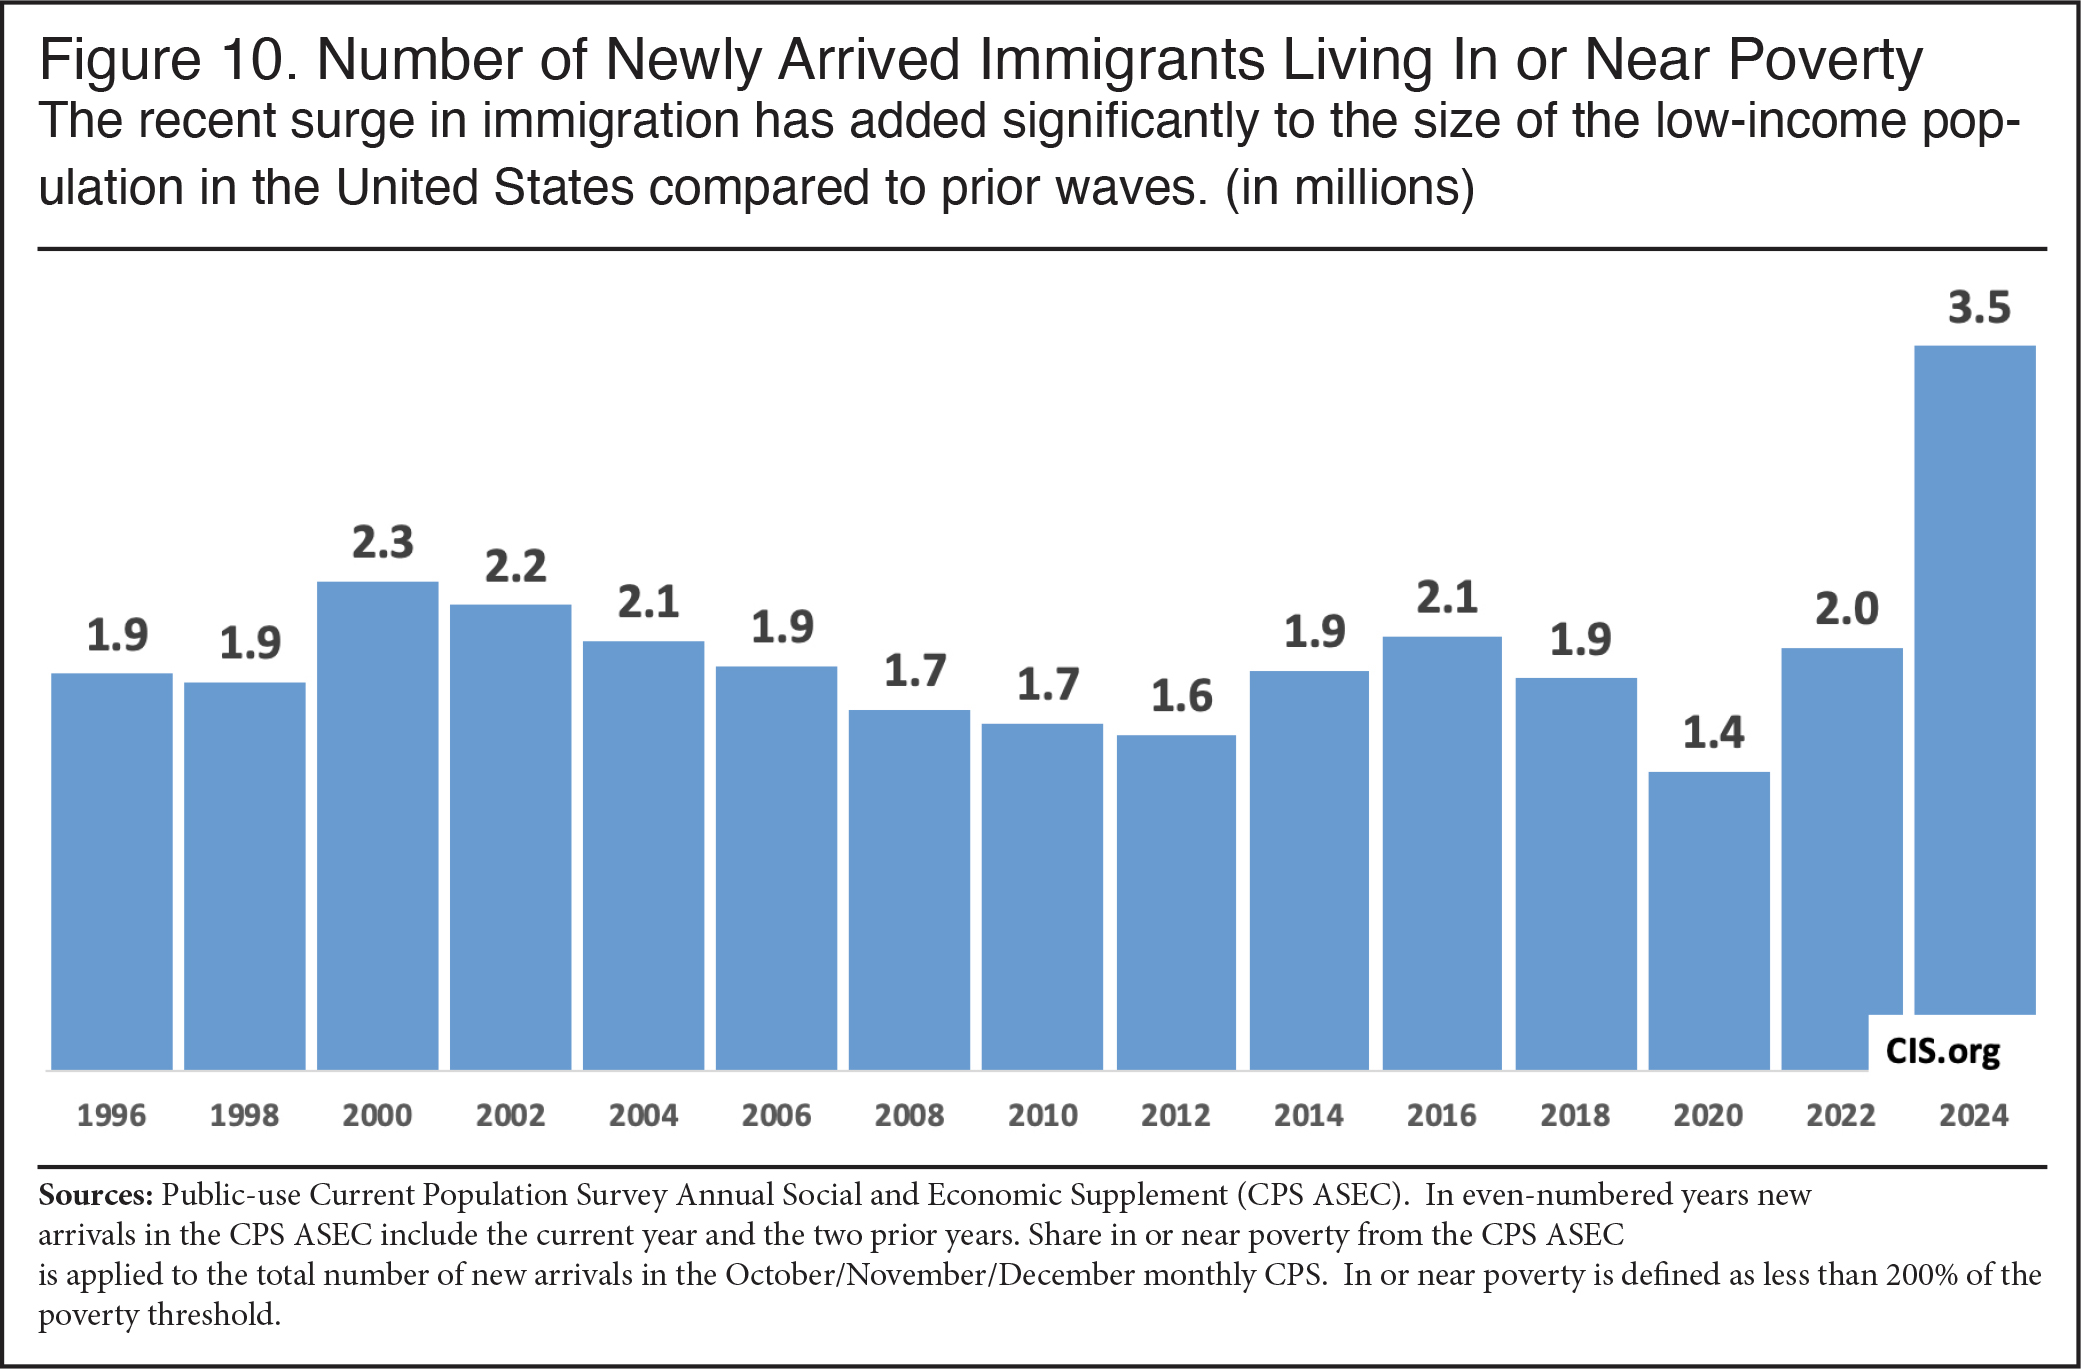
- The surge in new arrivals with less education means that immigration has added enormously (3.5 million) to the nation’s low-income population in just the last three years.
- Looking only at workers shows that the median earnings of new adult immigrant men fell from 80 percent of the median for U.S.-born men in 2018 to only 52 percent in 2024.
- The Census Bureau’s other large survey, the American Community Survey (ACS), also shows a decline in the education and income of newcomers. The deterioration is not as pronounced as shown in the CPS because the ACS data only goes through mid-2023, so it does not fully reflect the impact of the surge in illegal immigration.
Excel tables providing additional information based on the CPS and ACS can be found here.
Introduction
The importance of education level to success in the modern American economy is well established. This is not simply true for immigrants but applies to the U.S.-born as well. Occupation, earnings, poverty rate, productivity, use of welfare programs, tax payments, and many other measures of economic and social well-being are strongly correlated with educational attainment. For example, in 2024 employed adult new immigrants (men and women) with at least a bachelor’s degree had median earnings of $46,327, compared to $26,975 for those with no education beyond high school. Also, 48 percent of households headed by a new immigrant with no education beyond high school in 2024 used at least one major welfare program, compared to 29 percent for households headed by a nearly arrived immigrant with at least a bachelor’s. The average federal income tax liability of households headed by a new immigrant with no education beyond high school is only $3,025 compared to newcomers with at least a bachelor’s ($10,720).1 The list of socio-economic outcomes that vary by educational attainment is nearly endless.
The reasons for this are relatively straightforward: Education provides skills, making one more productive, employable, and marketable in the job market. Education is also seen by employers as an indication that a person has the persistence or grit to complete a degree. Education increases social status and may make one a more thoughtful and discerning citizen as well. In addition to increasing the size of the low-income population, adding large numbers of less-educated workers may reduce the productivity of the U.S. labor force, to say nothing of increasing job competition for less-educated Americans who already earn the lowest wages.
We use the term “immigrant” in this report synonymously with “foreign-born”. The foreign-born are all individuals who were not U.S. citizens at birth, including illegal immigrants.2 To examine trends in the education of newly arrived immigrants, we use a combined three-month sample (October, November, and December) of the Current Population Survey (CPS) from 1994 to 2024 in even-numbered years. The survey is collected by the Census Bureau for the Bureau of Labor Statistics (BLS).3 In even-numbered years, such as 2024, the most recent cohort that can be identified in the public-use CPS-based survey responses are those who arrived in the year of the survey and the two prior years.4 Defined in this way, newly arrived immigrants have lived in the United States for less than three years.5
We also use the American Community Survey (ACS) to examine trends in the education of new arrivals. Though larger than the CPS, the ACS only reflects the population through July 2023 and was a year and a half out of date by the fourth quarter of 2024.6 For this reason, we focus on the results of the CPS.7 It should be noted that the Census Bureau reports that due to pandemic-related disruptions, the ACS, "did not meet our statistical quality standards” in 2020. As for the CPS, the BLS states that despite a decline in response rates in 2020, they were “able to obtain estimates that met our standards for accuracy and reliability”. Still, comparing the unusual year of 2020 to other years in either survey should be done with caution. For this reason, we generally compare 2024 to the years prior to 2020 to discern how immigration has changed. Also, it must be emphasized that we do not attempt to adjust the data for the undercount of illegal immigrants or legal immigrants. We simply report the data as is, without any modifications.
Findings
Education of New Arrivals in the CPS. It is important to remember that this analysis is focused on new arrivals, not the existing stock of all immigrants. Figure 1 reports the share of adult immigrants in the CPS who have lived in the United States for less than three years who have no education beyond high school and the share that have at least a bachelor’s degree. (Those with some college are not included in the figure.) Table 1 shows more detailed information on the education level of newly arrived foreign-born adults back to 1994 based on the CPS. The figure shows that the share of new immigrants with at least a bachelor’s degree increased substantially after 2004.8 But the share of newcomers with a bachelor’s has declined substantially relative to before the border surge — from 46 percent in 2018 to 41 percent in 2024. The CPS also shows that the share of newcomers with no education beyond high school increased from 36 percent in 2018 to 46 percent in 2024. In short, after improving for more than a decade, the education level of new arrivals has significantly deteriorated.
 |
Education of New Arrivals in the ACS. Figure 2 shows the same trends using the ACS. Though the deterioration is less pronounced, it still shows that 41 percent of new adult immigrants in 2023 had no education beyond high school compared to 44 percent in 2019. Figure 2 also shows that the share of newcomers with no education beyond high school based on the ACS increased from 37 in 2018 to 43 percent in 2024. (Table 2 shows more detailed information from the ACS.) Like the CPS, this is the first time in a decade that the ACS has shown that those with no education beyond high school outnumber those with at least a bachelor’s. In addition to sampling variability, the likely reason the ACS does not show as large a decline in education as the CPS is that the most recent ACS only reflects the population through July 2023. In contrast, the CPS data used here represents the population through the fourth quarter of 2024 and therefore, includes more of the surge population.9
 |
Increase in the Less-Educated. While Figures 1 and 2 show the share of newcomers for different levels of education, Figure 3 reports the number of immigrants who have lived in the country for less than three years by education level in the CPS in even numbered years. The deterioration in the education of newly arrived immigrants is due to a numerical increase in less-educated newcomers. The number of better-educated immigrants has also increased, but nowhere near as much. Compared to 2018, the number of new adult immigrants with at least a bachelor’s degree is up 44 percent. However, the number with less than a high school education is up 66 percent and the number with only a high school education is up 130 percent. In fact, the 771,000 new adult immigrants without a high school education is the largest number of these least-educated immigrants since 2006; and the nearly 1.5 million newcomers with only a high school education is the largest number of new immigrants in this educational category going back to 1994.
 |
Immigrant Education Compared to the U.S.-Born. Figure 4 shows that after 2004, the share of new immigrants with a bachelor’s generally increased much faster than the share among the U.S.-born. By 2018 there was a 12 percentage-point gap between the two groups. But by 2024 the immigrant advantage over the U.S.-born had fallen to just five percentage points. (Table 1 shows more detailed information.) Figure 5 also shows that from 2012 to 2018 the share of new immigrants and the U.S.-born with no education beyond high school was roughly equal, but by 2024 newly arrived immigrants had fallen below the U.S.-born by 11 percentage points. In sum, the large advantage new immigrants once had over the U.S.-born in terms of the share with a bachelor’s has narrowed by more than half in recent years, while the share of newcomers who have modest levels of education has increased dramatically both in absolute terms and relative to the U.S.-born.
 |
 |
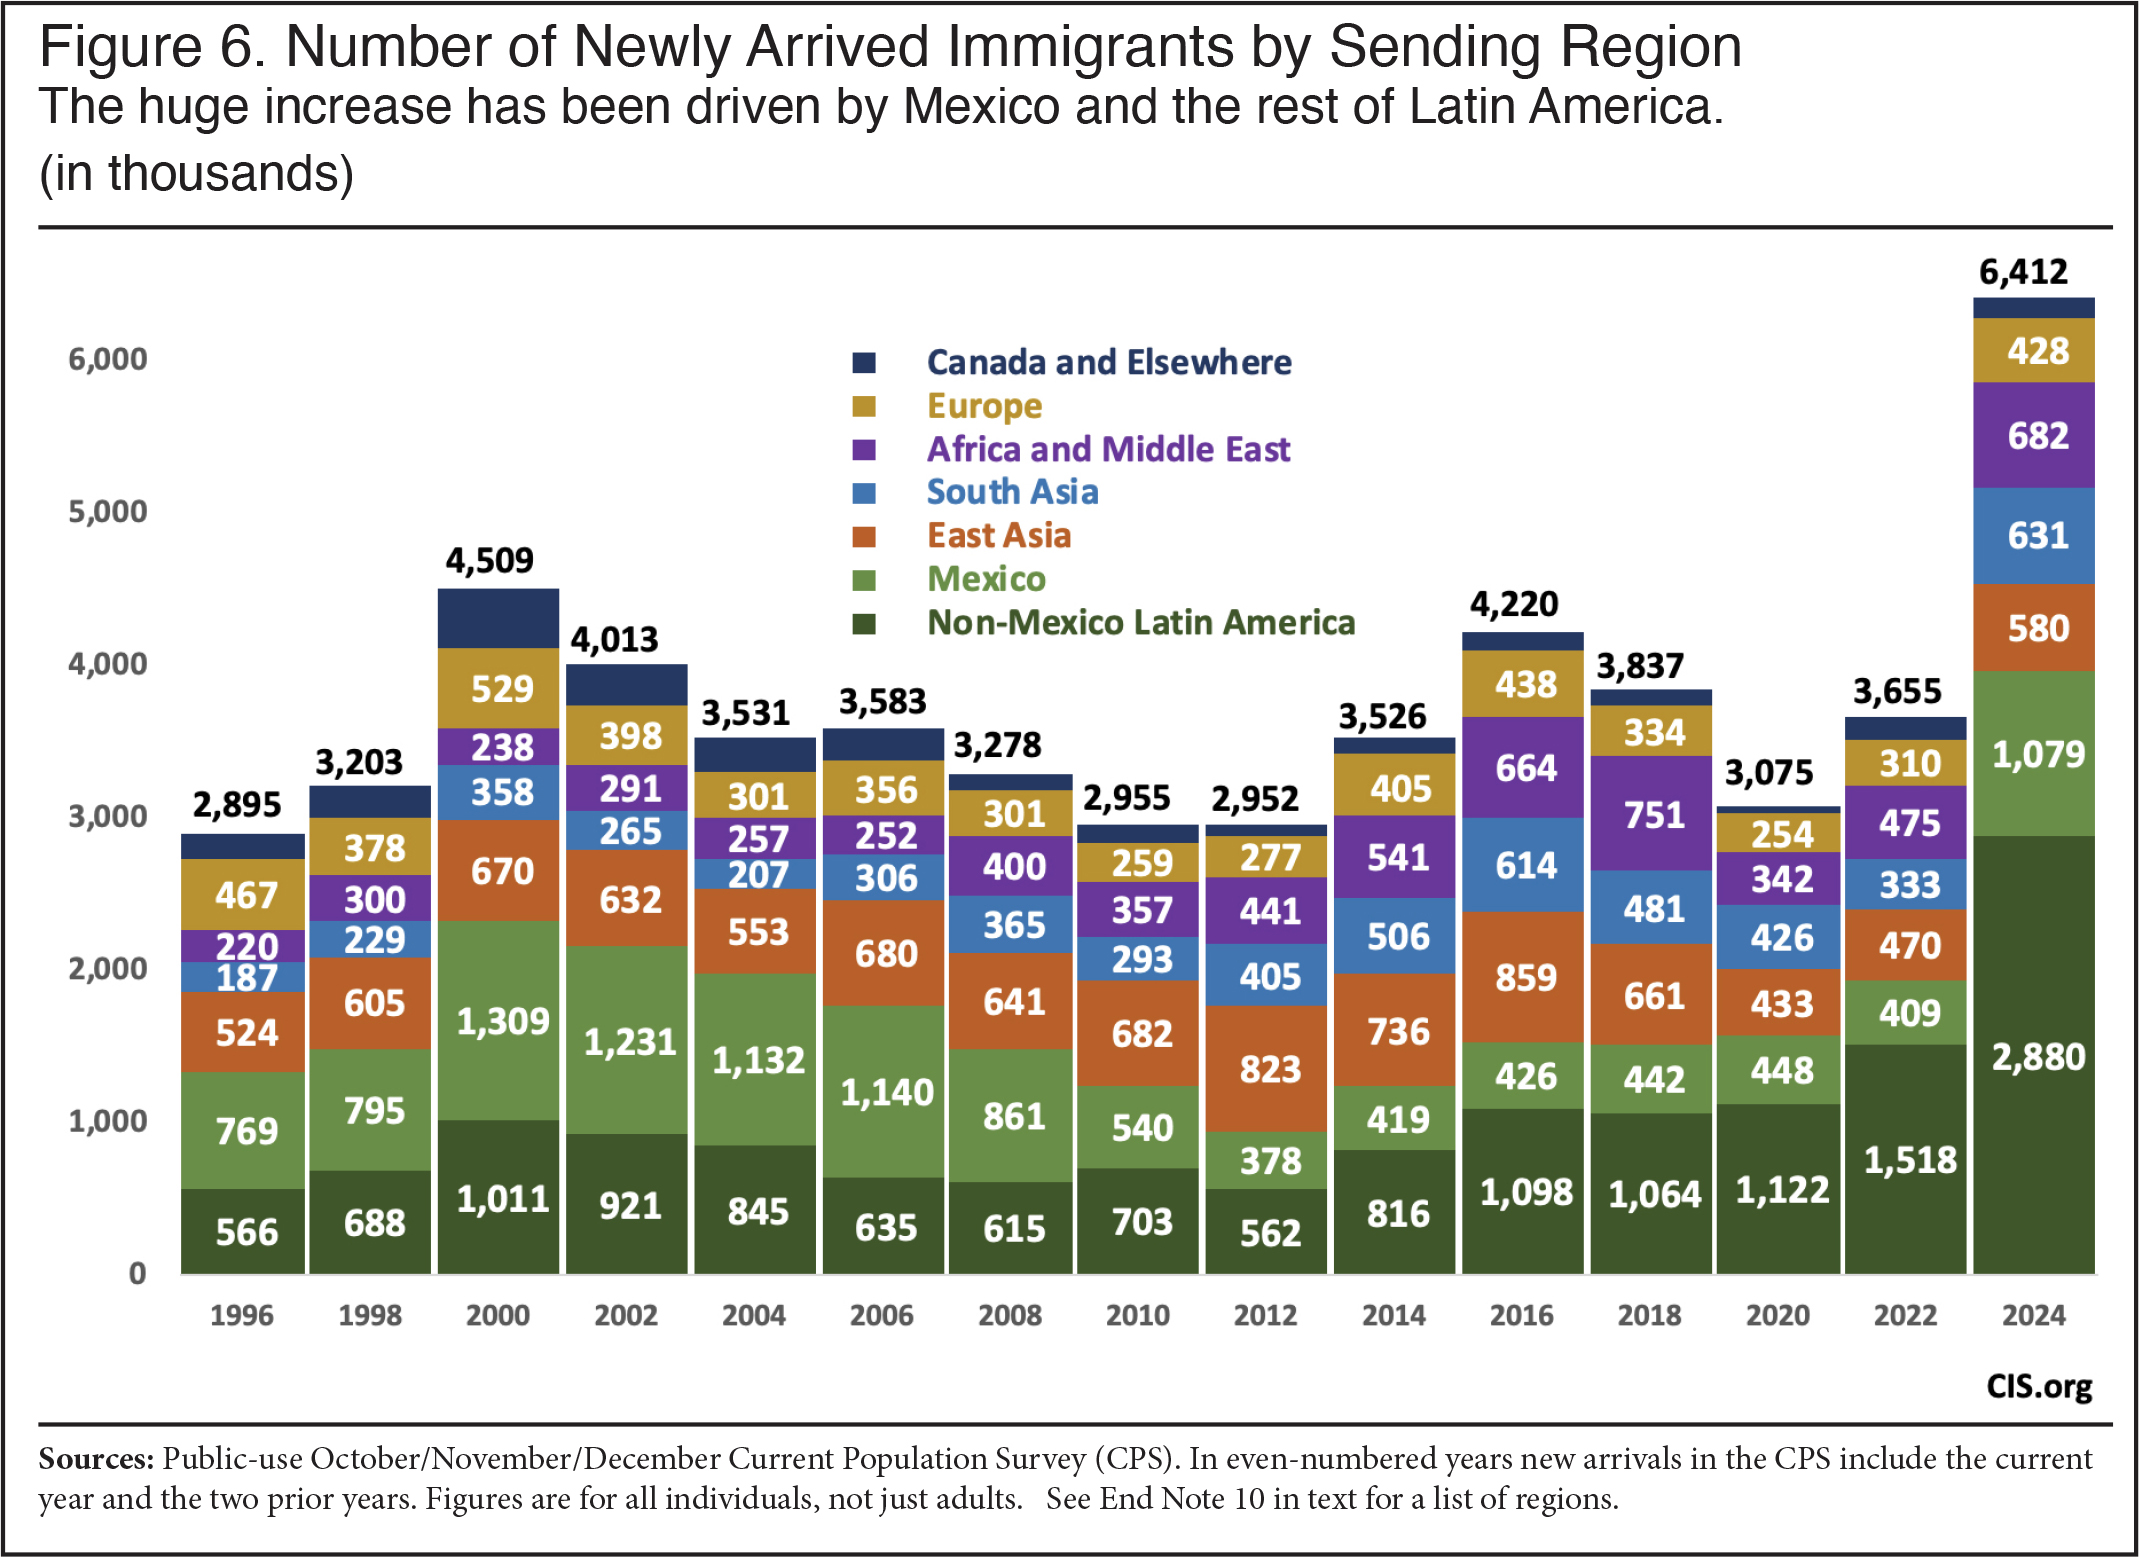
Dramatic Increase in Latin America Immigration. Figure 6 shows the number of newly arrived immigrants by region. The CPS shows a huge surge in new immigration in the last three years. The 6.4 million immigrants who said in 2024 that they had lived in the country for less than three years is much higher than at any point in the last three decades. The increase was driven primarily by a huge surge in immigration from Latin American countries other than Mexico, though Mexican immigration has also increased substantially post-Covid.10 In fact, the number of newcomers from most regions has increased, but the increase from countries in Latin America has been far more dramatic. Because numbers from Mexico and the rest of Latin America have increased so much, Figure 7 shows that combined they account for 62 percent of all newcomers in 2024, up from 36 percent in 2016 and 39 percent in 2018.11 Table 3 uses ACS data and also shows a substantial increase in Latin American immigration through mid-2023.12
 |
 |
This dramatic increase post-Covid in new immigration from Latin America almost certainly reflects the border crisis that began with President Joe Biden's inauguration in 2021 and the accompanying surge in illegal immigration. Prior research by DHS, the Pew Research Center, the Center for Migration Studies, and the Migration Policy Institute all indicate that roughly three-fourths of all illegal immigrants are from Latin America. We also know that 86 percent of all border encounters from January 2021 to October of 2024 are from Latin American countries. While we do not attempt to estimate the illegal share of new arrivals in this report or adjust for undercount, based on our prior analysis of the CPS and the characteristics of newcomers in the fourth quarter of 2024, it is almost certain that well more than half of the 6.4 million new arrivals in the most recent entering cohort are illegal immigrants, the overwhelming majority of whom are from Latin America.
Educational Attainment by Region. Figure 8 reports the educational attainment of new adult immigrants in 2024 by sending regions. There is enormous variation in the educational level of newcomers based on where they came from. As the figure shows, those from Mexico and Latin America tend to be the least educated. Because immigration from Latin America increased so much in recent years, it caused the overall education level of new arrivals to decline significantly. Looking at Table 3, which looks at the same region over time, there does not seem to be a clear decline in education level within the same sending region, with the possible exception of Latin American countries other than Mexico. Overall, the reason for the decline in educational levels of new arrivals seems to be due almost entirely to the increasing share of newcomers from Latin America. However, the sample size of new arrivals in the CPS, even using three months of data, is not ideal for looking at the declining education level of recently arrived adults within specific regions, especially those that send relatively fewer immigrants.13
 |
The Share of Low-Income Immigrants. We would expect that a fall-off in the education levels of new immigrants would result in a deterioration in their income. Figure 9 shows the share of new immigrants who have incomes below 200 percent of the official poverty threshold, which we also refer to as in or near poverty.14 This is a reasonable definition of being low-income, as those with income below this level generally pay no federal income tax and are often eligible for means-tested welfare programs. Figure 9 shows that the share of newcomers with low incomes improved after 2014. But between 2018 and 2024 the share in or near poverty increased from 49 percent to 54 percent. Of course, the poverty and near poverty rates are partly dependent on the state of the economy. But recent arrivals in 2024 are arriving in a country with a strong economy. In fact, the percentage of U.S.-born Americans in or near poverty was 25 percent in 2024, compared to 28 percent in 2018. The increase in the share of new immigrants who are low-income, coupled with the decline for the U.S.-born, means that the gap between newcomers and the U.S.-born widened significantly between 2018 and 2024.15
 |
Figure 10 shows that the surge in immigration post-Covid, along with the deterioration in their income, caused the number of newly arrived immigrants in or near poverty to increase from 1.9 million in 2018 to 3.5 million in 2024.16 This is the case even though we are not adjusting the data for those missed by the survey.17 Recent immigration has clearly added significantly to the size of the low-income population in the United States.
 |
Median Earnings. Figure 11 reports median earnings for newly arrived adult immigrant men who have lived in the country for less than three years and for U.S.-born male adults. Adjusted for inflation, new immigrant men earned slightly more than $50,177 a year in 2018.18 By 2024, the median earnings of new adult immigrant men had fallen by $18,107, or 36 percent, despite the fact the newcomers arrived during a very strong economy. Earnings for U.S.-born men were also lower in 2024 than 2018, but only by 1 percent. As a result, newly arrived immigrants earned only 52 percent as much as their U.S.-born counterparts on average, compared to 80 percent as much in 2018. Tables 6 and 7 provide additional earnings data from the CPS and ACS respectively. The earnings figures are consistent with the poverty figures showing a significant deterioration in the economic well-being of new immigrants in absolute terms and relative to the U.S.-born.
 |
Conclusion
The findings of this analysis show that the steady improvement in the educational level of new adult immigrants, which began around 2004, reversed during the Biden administration. Although some share is missed in the Census Bureau data used in this analysis, the huge influx of illegal immigrants in recent years dramatically increased the overall number of newcomers and the share who are illegal immigrants. The CPS shows that in the fourth quarter of 2024 there were 6.4 million immigrants (legal and illegal) living in the country who indicated that they had lived in the country for less than three years. This is almost certainly the highest three-year period of immigration in American history. This increase has been almost entirely driven by an increase in new arrivals from Latin America. Prior government and non-government estimates, as well as administrative data on border encounters, show that the overwhelming majority of illegal immigrants are from this region. Immigrants from Latin America to the United States tend to be the least-educated compared to immigrants from other sending-regions. As the share of newcomers who are from Latin America increased, the percentage of new arrivals with a bachelor’s fell from 46 to 41 percent from 2018 to 2024, while the share with no education beyond high school increased from 36 percent to 46 percent over the same time period.
The deterioration in the education level of new immigrants was caused entirely by the dramatic increase in the arrival of immigrants with very modest levels of education. Compared to 2018, the number of adult newcomers with a high school diploma or less increased by 103 percent, while the number with at least a bachelor’s increased by “only” 44 percent. In 2024, for the first time in more than a decade, new adult immigrants with no education beyond high school outnumbered those with at least a bachelor’s. We find these trends in both the Current Population Survey (CPS) and the American Community Survey (ACS), though the trends are more pronounced in the CPS. The CPS has data through the end of 2024, while the ACS only reflects the population through mid-2023, so the CPS better reflects the influx associated with the border crisis.
The significant falloff in the education level of immigrants is profoundly important because there is no single better predictor of how immigrants will do in the modern American economy than their educational level at arrival. This includes income, poverty rates, use of social services, tax contributions, and many other measures of socio-economic status. Of course, many new immigrants are very skilled and can be expected to prosper in the United States. Moreover, the earnings of immigrants with modest levels of education should still increase over time. That said, in 2024 new arrivals were much more numerous, less educated, and poorer than prior entering cohorts. In just the last three years, 3.5 million low-income immigrants have settled in the country. Adding so many low-income residents will create significant challenges for the United States. Further, allowing in so many less-educated immigrants significantly increases job competition for less-educated U.S.-born workers and legal immigrants already here. Halting this trend should be an important goal of the Trump administration. Sending illegal immigrants back to their home countries would also avoid the challenges a much larger low-income population would create for the country.
End Notes
1 All of the above figures are based on an analysis of the public-use CPS Annual Social and Economic Supplement for 2024, which unlike monthly CPS data has detailed information on income, earnings, welfare use, and tax liability. As defined throughout this analysis, newly arrived immigrants in 2024 are those who came in 2022, 2023, and 2024. Earnings are for adults with positive earnings. Major welfare programs include SSI, TANF, SNAP, WIC, free/subsidized school lunch, Medicaid, and public/subsidized housing.
2 The term “immigrant” has a specific meaning in U.S. immigration law, which is all those inspected and admitted as lawful permanent residents. In this analysis, we use the term “immigrant” in the non-technical sense of the word to mean all those who were not U.S. citizens at birth. Typically, the government refers to these individuals in surveys such as the CPS or ACS as the “foreign-born”. While it may surprise some, the BLS, for whom the Census Bureau collects the CPS, is clear that illegal immigrants are included in the survey, and the Census Bureau is equally clear that illegal immigrants are included in its surveys such as the ACS and CPS. Although there is some undercount, immigrants, or the foreign-born, in the CPS include legal immigrants (including those who have become naturalized citizens), long-term temporary visitors (e.g. guestworkers), and illegal immigrants. The same is true in the ACS.
3 Using three months of data allows for more statistically robust estimates. This is a common practice for the government, for example when it reports median weekly wages.
4 The Census Bureau groups responses to the year-of-entry question in the public-use files of the CPS into multi-year arrival cohorts to preserve anonymity. In odd-numbered years, the most recent cohort available includes the survey year and the prior three years, so it is not directly comparable with even-numbered years. Comparing consecutive even-numbered years as we do here means there is a small amount of overlap in new entrants in even-numbered years. For example, the fourth quarter CPS data from 2024 includes those who responded that they came in that year, plus 2023 and 2022. The fourth quarter 2022 CPS data includes 2020 and 2021, but also 2022.
5 By using a three-month average we are effectively measuring the population in the middle month of November. Further, because the survey reflects the population at the beginning of each month, it does not really include those who came in December. As such, we describe new arrivals as having lived in the country for less than three years.
6 The public-use ACS reports year of entry by individual year, but we define new arrivals in that survey as having arrived in the current year and the two prior years so that it matches our analysis of the CPS in even numbered years. This creates more overlap in our analysis when looking at consecutive years in the ACS. However, we have also looked at individual year-of-entry data in the ACS and the same pattern of declining education levels of newcomers still holds.
7 It should be noted that a small number of new arrivals, as defined here, in the CPS and ACS say they are U.S. citizens, even though with a few exceptions it normally requires three to five years of residence to become a citizen. It is possible that some of these individuals are returning to the United States after having obtained citizenship during an earlier stay, or it might simply be a coding error. It is also possible respondents misunderstood the question, such as confusing citizenship with legal status. We do not attempt to resolve this question as we are simply interested in people who are newly arrived in the United States, whether they are coming for the first time or are returning after some time away. The impact on the data is small; in the 2024 data for the October/November/December CPS, 7 percent of new arrivals reported they were U.S. citizens and in the 2023 ACS, 2.5 percent said they were citizens.
8 This improvement took place after a long and well-documented deterioration in the education level of new immigrants relative to the U.S.-born.
9 The most recently entered cohort in Figure 2 (for 2023) only includes 2021, 2022, and the first half of 2023, whereas the most recent cohort in the October/November/December CPS in Figure 1 is for 2022, all of 2023, and almost all of 2024. (Since November is the middle month of the fourth quarter, the data can be seen as representing arrivals though November 2024.) This means the most recent ACS cohort in Figure 2 captures only half of the time period of the most recent CPS cohort shown in Figure 1.
10 Countries included in each sending region using the CPS in 2024 are: Mexico; Non-Mexico Latin America: Belize, Costa Rica, El Salvador, Guatemala, Honduras, Nicaragua, Panama, Cuba, Dominican Republic, Haiti, Jamaica, Bahamas, Barbados, Dominica, Grenada, Trinidad and Tobago, Antigua and Barbuda, St. Kitts-Nevis, St. Lucia, St. Vincent and the Grenadines, Caribbean n.s., Argentina, Bolivia, Brazil, Chile, Colombia, Ecuador, Guyana/British Guiana, Peru, Uruguay, Venezuela, Paraguay, South America n.s., Americas n.s.; East Asia: China, Japan, Korea, Mongolia, Cambodia, Indonesia, Laos, Malaysia, Philippines, Singapore, Thailand, Vietnam, Burma, Asia n.e.c./n.s.; South Asia: India, Bangladesh, Bhutan, Pakistan, Sri Lanka, Nepal; Middle East and Africa: Afghanistan, Iran, Iraq, Israel, Jordan, Lebanon, Saudi Arabia, Syria, Turkey, Kuwait, Yemen, United Arab Emirates, Uzbekistan, Kazakhstan, Egypt/United Arab Rep., Morocco, Algeria, Sudan, Libya, Ghana, Nigeria, Cameroon, Cape Verde, Liberia, Senegal, Sierra Leone, Guinea, Ivory Coast, Togo, Eritrea, Ethiopia, Kenya, Somalia, Tanzania, Uganda, Zimbabwe, South Africa (Union of), Zaire, Congo, Zambia, Africa n.e.c./n.s; Europe: Denmark, Finland, Iceland, Norway, Sweden, United Kingdom, Ireland, Belgium, France, Netherlands, Switzerland, Greece, Italy, Portugal, Azores, Spain, Austria, Czechoslovakia, Slovakia, Czech Republic, Germany, Hungary, Poland, Romania, Bulgaria, Albania, Yugoslavia, Bosnia and Herzegovina, Croatia, Macedonia, Serbia, Montenegro, Estonia, Latvia, Lithuania, Other USSR/Russia, Ukraine, Belarus, Moldova, USSR n.s., Europe n.s., Armenia, Azerbaijan, Georgia; Canada and Elsewhere: Bermuda, Australia, New Zealand, Fiji, Tonga, Samoa, Marshall Islands, Micronesia, Other n.e.c. and unknown.
11 The CPS began to ask respondents their country of birth and year of entry in 1994 on a regular basis. However, relatively few countries were specifically identified back then so it is not really not possible to create the detailed regions that we report from 1994 onward. By 1996 more countries were identified, making comparisons in sending region more consistent.
12 Countries included in each sending region using the ACS in 2023 are: Mexico; Non-Mexico Latin America: Belize, Costa Rica, El Salvador, Guatemala, Honduras, Nicaragua, Panama, Cuba, Dominican Republic, Haiti, Jamaica, Bahamas, Barbados, Dominica, Grenada, Trinidad and Tobago, St. Kitts-Nevis, Caribbean n.s., West Indies n.s., Argentina, Bolivia, Brazil, Chile, Colombia, Ecuador, Guyana/British Guiana, Peru, Uruguay, Venezuela, Paraguay, South America n.s., Americas n.s.; East Asia: China, Japan, Korea, Mongolia, Cambodia, Indonesia, Laos, Malaysia, Philippines, Singapore, Thailand, Vietnam, Burma, Asia n.e.c./n.s.; South Asia: India, Bangladesh, Bhutan, Pakistan, Sri Lanka, Nepal; Middle East and Africa: Azerbaijan, Kazakhstan, Kirghizia, Uzbekistan, Afghanistan, Iran, Iraq, Israel/Palestine, Jordan, Kuwait, Lebanon, Saudi Arabia, Syria, Turkey, United Arab Emirates, Yemen Arab Republic (North), Algeria, Egypt/United Arab Rep., Libya, Morocco, Sudan, North Africa n.s., Gambia, Ghana, Guinea, Liberia, Nigeria, Senegal, Sierra Leone, Togo, Western Africa n.s., Ethiopia, Kenya, Rwanda, Somalia, Tanzania, Uganda, Zambia, Zimbabwe, Eastern Africa n.e.c./n.s., Eritrea, Cameroon, Congo, Zaire, South Africa (Union of), Cape Verde, Africa n.e.c./n.s; Europe: Denmark, Finland, Iceland, Norway, Sweden, United Kingdom, Ireland, Belgium, France, Netherlands, Switzerland, Greece, Italy, Portugal, Spain, Austria, Czechoslovakia, Slovakia, Czech Republic, Germany, Hungary, Poland, Romania, Bulgaria, Bosnia and Herzegovina, Kosovo, Croatia, Macedonia, Serbia, Latvia, Lithuania, Other USSR/Russia, Byelorussia, Ukraine, Belarus, Moldova, USSR n.s., Europe n.s., Armenia, Georgia; Canada and Elsewhere: Bermuda, Australia, New Zealand, Fiji, Tonga, Micronesia, Samoa.
13 Table 4 shows the education level of new arrivals using the CPS and it also does not show clear evidence of a fall-off in educational attainment among immigrants from the same region.
14 Figure 9 is based on the CPS Annual Social and Economic Supplement (CPS ASEC), which is collected in March each year and asks detailed questions about income and earnings in the year prior to the survey. Because the most recent CPS ASEC reflects the population in March 2024, it is not as up to date as the monthly CPS from the fourth quarter of that year. By combining the rate of poverty/near poverty with the total number of new arrivals using the most recent monthly CPS, we are able to get a more up-to-date estimate of how much the recent surge in immigration through the end of 2024 has added to the low-income population.
15 Some of the decline is caused by immigrants in the last year being more numerous than in other years. For example, in 2024 the poorest immigrants are likely those who came in 2024 and they may represent a larger share of newcomers than those who came in the most recent year back in 2018. We have no clear evidence of this, but the possibility exists.
16 Figure 10 uses the percentage in or near poverty from the CPS ASEC and combines that percentage with the total number of new arrivals from the fourth quarter. As already noted, in End Notes 1 and 9, the CPS ASEC reflects the population in March of each year and asks about income in the prior year.
17 Low-income people and illegal immigrants are among the most likely to be undercounted.
18 Following the Census Bureau’s example, all median figures in this report are calculated using linear interpolation and $2,500 intervals based on grouped data. Figures for each year ask about income in the prior calendar year in which the data was collected.