Using the 2024 Survey of Income and Program Participation (SIPP), this analysis follows the Census Bureau’s standard definition of welfare and reports use of means-tested anti-poverty programs by households headed by immigrants and the U.S.-born. We exclude social insurance programs like Social Security and Medicare, which individuals pay in to and are not means-tested. The findings show that households headed by immigrants, also called the “foreign-born”, are significantly more likely to receive benefits than households headed by the U.S.-born. The ability of low-income immigrants, including illegal immigrants, to receive benefits on behalf of U.S.-born citizen children is a key reason restrictions on welfare use for new legal immigrants, and illegal immigrants, are relatively ineffective. If we want immigrants to use less welfare in the future, then reducing illegal immigration and changing the selection criteria for legal immigrants to emphasize skills should be considered.
Among the findings:
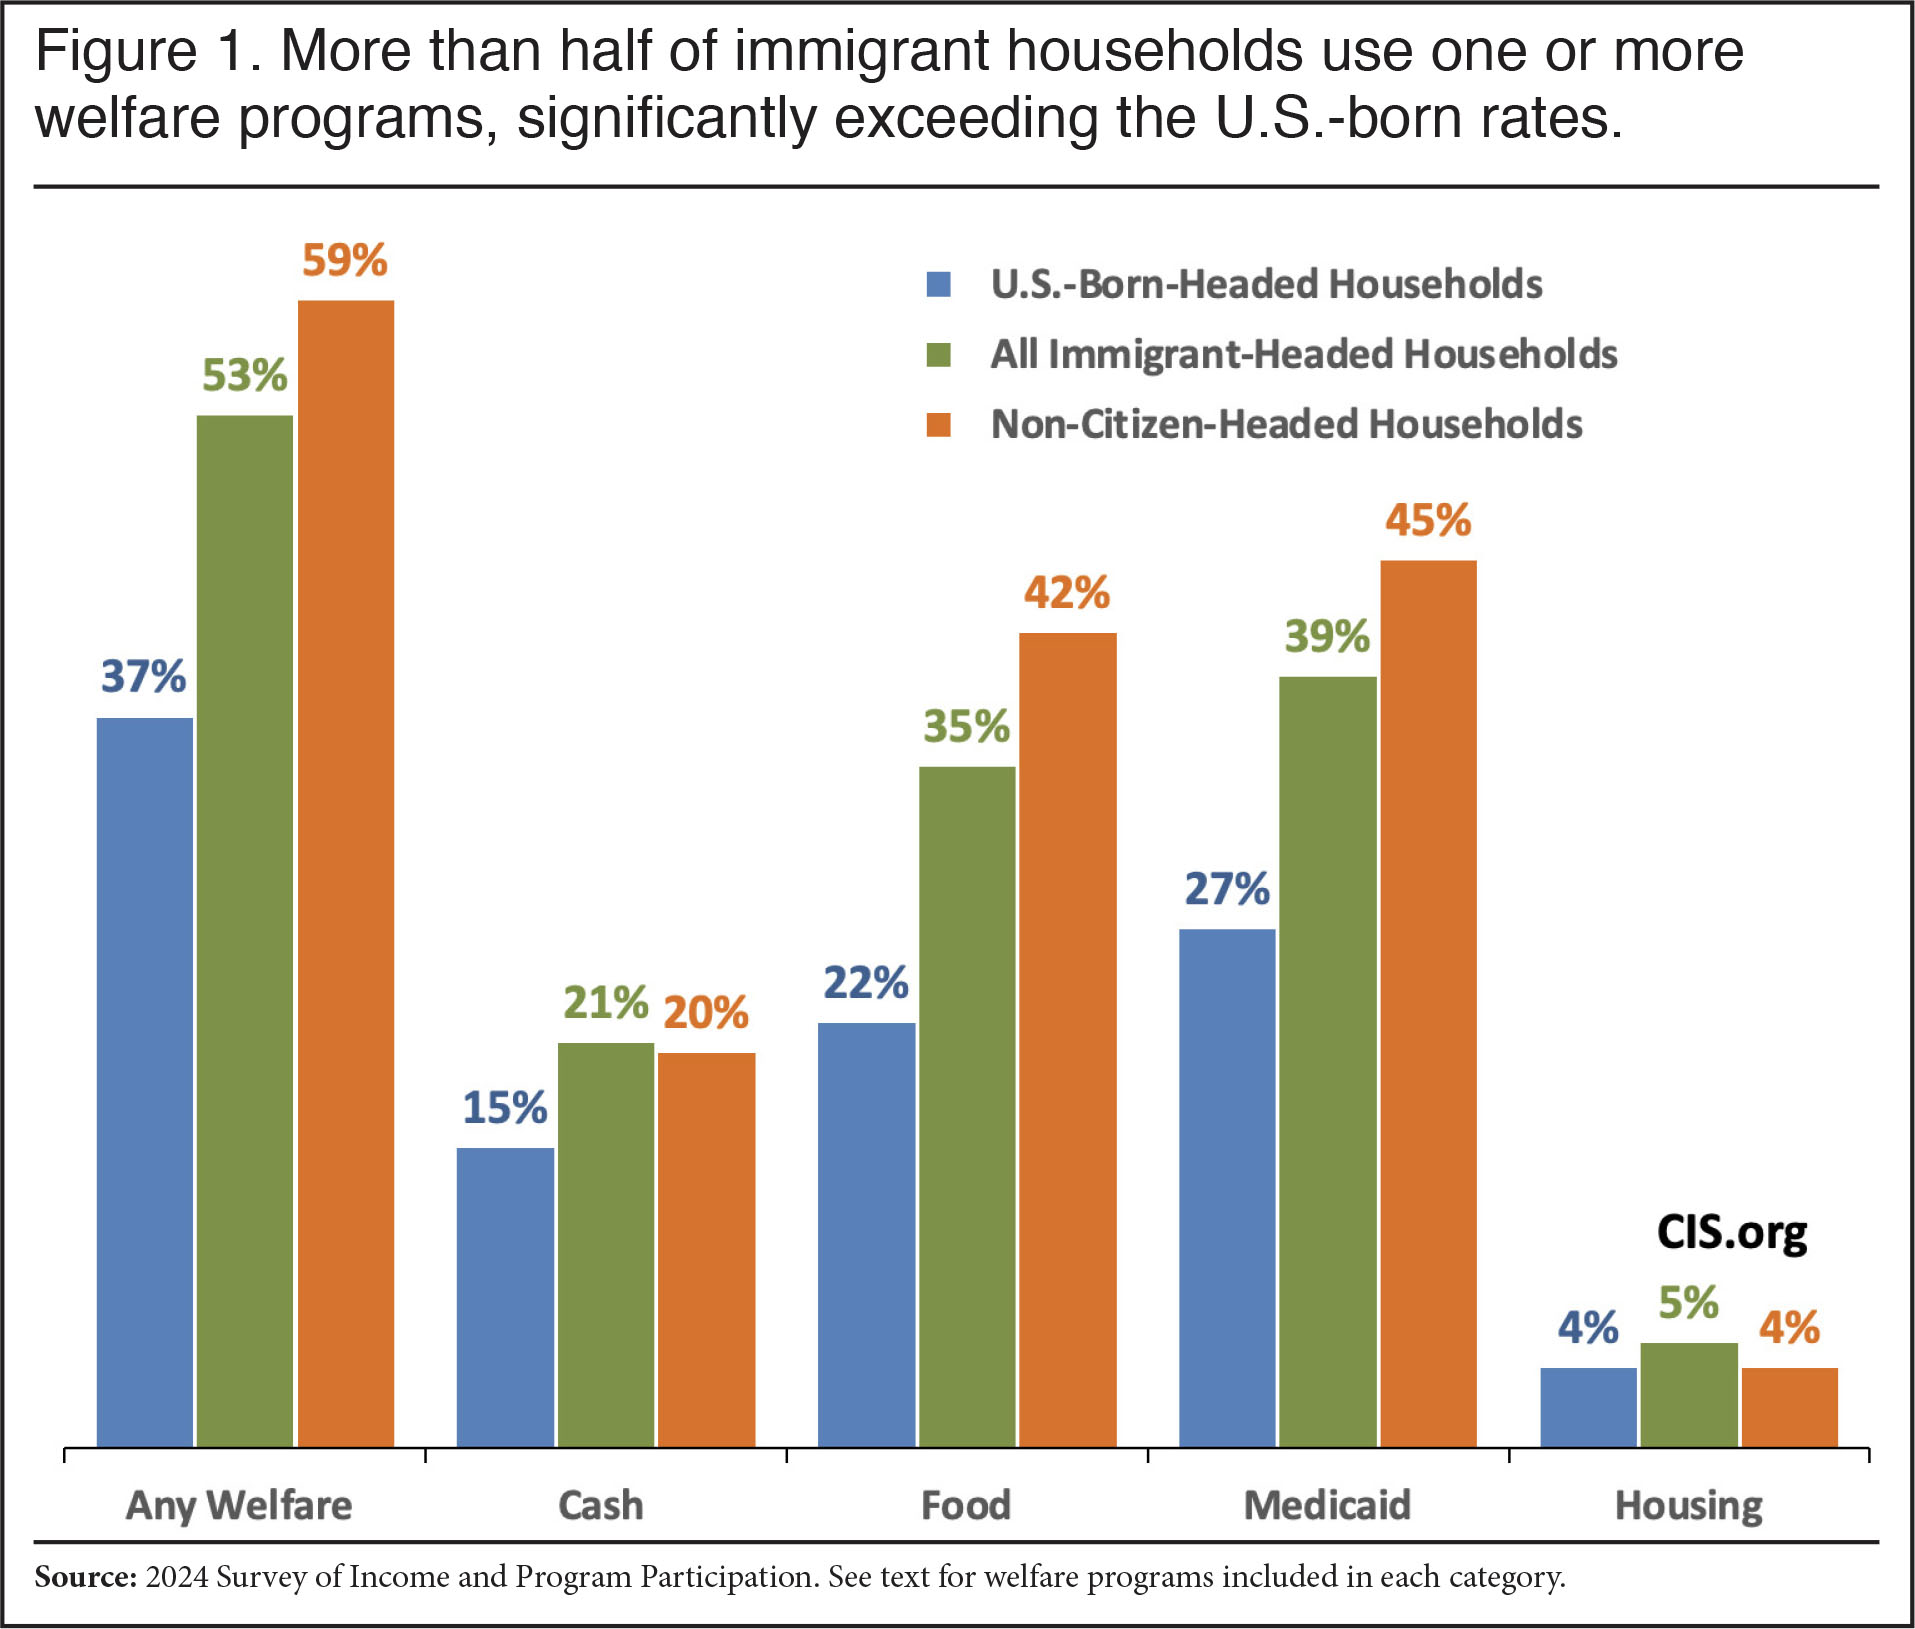
- The 2024 SIPP indicates that 53 percent of households headed by immigrants — naturalized citizens, legal residents, and illegal immigrants — used one or more major welfare programs. This compares to 37 percent for U.S.-born households.
- The rate is 59 percent for non-citizen households (e.g. green card holders and illegal immigrants).
- Compared to households headed by the U.S.-born, immigrant-headed households have especially high use of food programs (35 percent vs. 22 percent for the U.S.-born), Medicaid (39 percent vs. 27 percent for the U.S.-born), and the Earned Income Tax Credit (15 percent vs. 10 percent for the U.S.-born).
- Our best estimate is that 51 percent of households headed by legal immigrants use at least one major welfare program. Among illegal immigrants, also called the undocumented, we estimate the rate is 61 percent. We have no evidence that this is due to fraud.
- Illegal immigrants can receive welfare on behalf of their U.S.-born children, and illegal-immigrant children can receive free/reduced price school lunch/breakfast and WIC directly. A number of states provide Medicaid to some illegal-alien adults and children, and a few provide SNAP. Several million illegal immigrants also have work authorization (e.g. DACA, TPS, and many parolees) allowing receipt of the Earned Income Tax Credit (EITC).
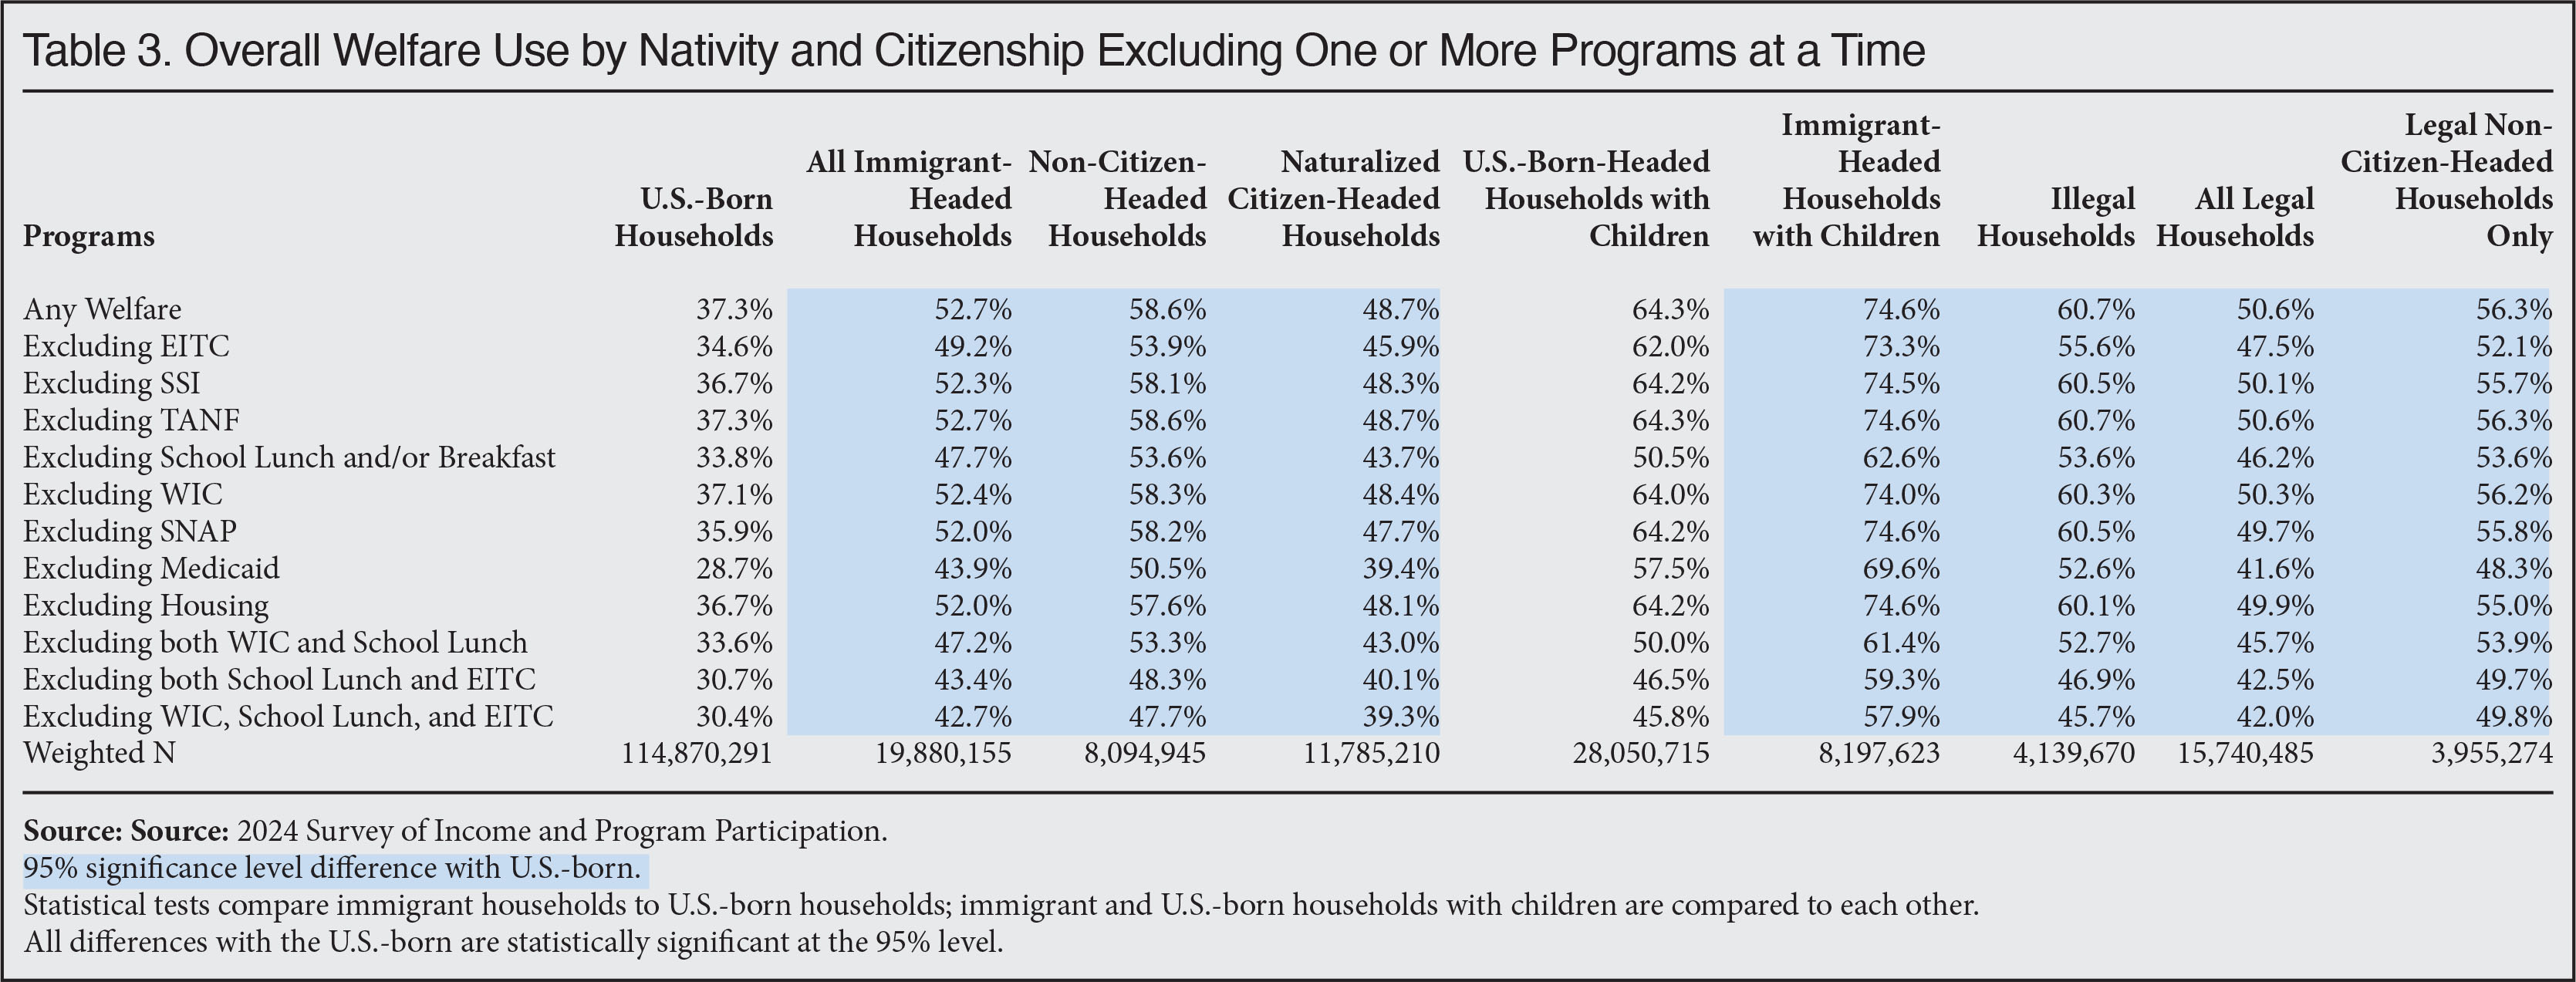
- No one program explains the higher overall use of welfare by immigrants. For example, excluding the extensively used but less costly school lunch/breakfast program, along with the WIC nutrition program, still shows that 47 percent of all immigrant households and 34 percent of U.S.-born households use at least one of the remaining programs.
- The presence of extended family or unrelated individuals does not explain immigrants’ higher welfare use, as the vast majority of immigrant households are nuclear families. Of immigrant households comprised of only a nuclear family, 48 percent use the welfare system compared to 33 percent of nuclear-family-only U.S.-born households.
- Immigrant welfare use is common among both newer arrivals and established immigrants. Of households headed by an immigrant in the U.S. for less than 10 years, 48 percent access one or more programs as do 54 percent with a head in the U.S. for 10 or more years.
- The high welfare use of immigrant households is not explained by an unwillingness to work. In fact, 86 percent of all immigrant households have at least one worker, compared to just 74 percent of U.S.-born households. Income determines welfare eligibility, so many low-wage workers access welfare.
- Immigrants’ higher welfare use relative to the U.S.-born is partly, but only partly, explained by the larger share with modest education levels, their resulting lower incomes, and the greater percentage of immigrant households with children.
- However, immigrant households without children, those with higher incomes, and those headed by well-educated immigrants tend to be more likely to use welfare than their U.S.-born counterparts.
- Most new legal immigrants are barred from most programs, as are illegal immigrants, but this has a modest impact on overall use rates, primarily because: 1) immigrants can receive benefits on behalf of U.S.-born children; 2) the bar does not apply to all programs, nor does it apply to non-citizen children in some cases; 3) most legal immigrants have lived here long enough to qualify for welfare; 4) some states provide welfare to otherwise ineligible immigrants on their own; 5) by naturalizing, immigrants gain full welfare eligibility.
Download Excel Tables Here
Introduction
The burden immigrants may create through their use of public benefits has long been a concern. There were restrictions on immigrants entering the country who could not support themselves going back to colonial times. The Immigration Act of 1882 was the first law that attempted to prevent the entry of immigrants "unable to take care of himself or herself without becoming a public charge". Later laws and regulations affirmed this idea, though in practice it is not clear how much difference such provisions actually made. In 1996, the Personal Responsibility and Work Opportunity Reconciliation Act overhauled the welfare system, barring most new legal immigrants and illegal immigrants from receiving many federally funded means-tested programs. On its face, heavy use of welfare programs by immigrants and their dependent children can be seen as an indication that immigration is creating significant fiscal challenges for the country. Looking at welfare programs is a good indication of immigrants’ net fiscal impact (taxes paid minus costs created), but by itself it does not fully answer the question of whether immigration on balance has a positive or negative impact on public coffers.
Terminology and Data. We use the terms “immigrant” and “foreign-born” synonymously. The foreign-born includes all individuals who were not U.S. citizens at birth — naturalized citizens, green card holders, illegal immigrants, and those with long-term temporary visas such as guestworkers captured in the government survey used here.1 In contrast, the U.S.-born, also called “natives” or the “native-born”, are all those who were U.S. citizens at birth. We also use the terms “immigrant household” and “U.S.-born household” based on the nativity of the head of the household, which the government generally refers to as the “householder”. Our primary data source is the 2024 Survey of Income and Program Participation (SIPP), which measures welfare use in 2023, and is the most recent data available. The survey is collected by the Census Bureau, which describes the SIPP as “the premier source of information” on “program participation”. The bureau is clear that illegal immigrants are included in its surveys, though as we discuss in the appendix of this report, there is likely a significant undercount of illegal immigrants in the SIPP.2 We use this data to examine use of the major welfare programs by immigrant and U.S.-born households.
Defining Welfare. The definition of welfare can be debated. However, the Census Bureau states that benefits from “social welfare programs” are generally “based on a low income means-tested eligibility criteria”. Such programs are by definition specifically designed to uplift those with low incomes. The bureau specifically gives Supplemental Security Income (SSI), Temporary Assistance for Needy Families (TANF), Supplemental Nutrition Assistance Program (SNAP), and the Women, Infants, and Children (WIC) nutrition program as examples of “social welfare”. In arguing that immigrant use of “welfare and entitlement benefits” is similar to that of the U.S.-born, the Cato Institute includes Medicare and Social Security. This is a rather unusual grouping of programs, as Social Security and Medicare are certainly distinct from welfare. Cato’s own “Poverty and Welfare Handbook” from 2022 explicitly excludes these two programs from their estimated total costs of welfare because they are “more universal” programs that are “social insurance”. The Census Bureau also considers Social Security and Medicaid “social insurance programs” as distinct from welfare because they are not means-tested, and instead “are usually based on eligibility criteria such as age, employment status, or being a veteran”. In addition, recipients of social insurance typically must have paid into programs like Social Security and Medicare before receiving benefits.
We follow the Census Bureau definition of welfare and limit our analysis to means-tested anti-poverty programs that can be measured in the SIPP. The major programs examined in this report are those that provide cash assistance: the Earned Income Tax Credit (EITC); Supplemental Security Income (SSI); Temporary Aid to Needy Families (TANF); Food Assistance, including free and reduced-price school lunch and breakfast (school meals), the Women, Infants, and Children (WIC) nutrition program, the Supplemental Nutrition Assistance Program (SNAP, also called food stamps); Medicaid; and subsidized and public housing.3
Why Welfare Use Matters. The federal government spends roughly one trillion dollars each year collectively on the above programs, which represents a substantial share of the federal budget. State governments also spent over $300 billion a year on Medicaid. Looking at welfare use provides insight into whether immigrants or the U.S.-born are a net fiscal burden. This is not simply due to the direct costs they create, but also because those accessing means-tested programs typically pay little to no federal or state income tax, which is by far the largest source of federal revenue.4 Further, use of welfare is also an indication that immigration may be adding to the low-income population struggling to support itself. By their consumption of scarce public resources, immigrants may also make it more difficult to assist the poor already here. Finally, use of welfare is a key measure of self-sufficiency and therefore is an important measure of how immigrants are adapting to life in America.
How to Think About Welfare. What constitutes “high” or “low” use is an open question. At least traditionally, one of the most important arguments for immigration is that it benefits the United States — that is, the existing population of Americans. From this perspective, it is certainly reasonable to argue that with the exception of the roughly 6 percent of the total immigrant population who were admitted for humanitarian reasons (e.g. refugees and asylees), immigrant welfare use should be very low.5 The relatively high welfare use rates reported here can be seen as surprising not simply because of the various restrictions on new legal immigrants’ use of some programs, but also because the bar on illegal immigrants should have some impact on overall welfare use rates. Further, the large “non-immigrant” population in the country (mainly guestworkers, foreign students, and cultural exchange visitors) estimated by DHS in 2024 should use virtually no welfare, adding only to the denominator but not the numerator when calculating use rates.6 And yet, as we will see, all of these factors do not prevent foreign-born households from making very extensive use of the welfare system.
To be sure, the extent to which immigrants use welfare does not settle the immigration debate. There are many other things to consider when deciding on immigration policy. Further, immigrants’ use of welfare should not be seen as their necessarily “gaming” the system, nor should it be understood as reflecting a moral failing on their part. Although recent stories in the media have reported on massive welfare fraud on the part of some immigrants, there is no evidence in this data that immigrants are using fraudulent means to access these programs. Rather, they are simply using programs for which they or their U.S.-born children are eligible at a time when the social stigma surrounding these programs has largely disappeared.
Findings
Overall Use of Programs. Figure 1 and Table 1 report our estimates of welfare use from the SIPP based on the nativity of the household head. The figure shows that welfare use is common for both immigrant and native households. Based on the 2024 SIPP, 52.7 percent of all immigrant-headed households and 37.3 percent of households headed by the U.S.-born used at least one major program. The 15.4 percentage points higher rate for all immigrants relative to the U.S.-born is statistically significant. If we excluded naturalized American citizens and look only at households headed by a non-citizen, it shows a welfare use rate of 58.6 percent — more than 21 percentage points higher than the U.S.-born. This is also a statistically significant difference.
 |
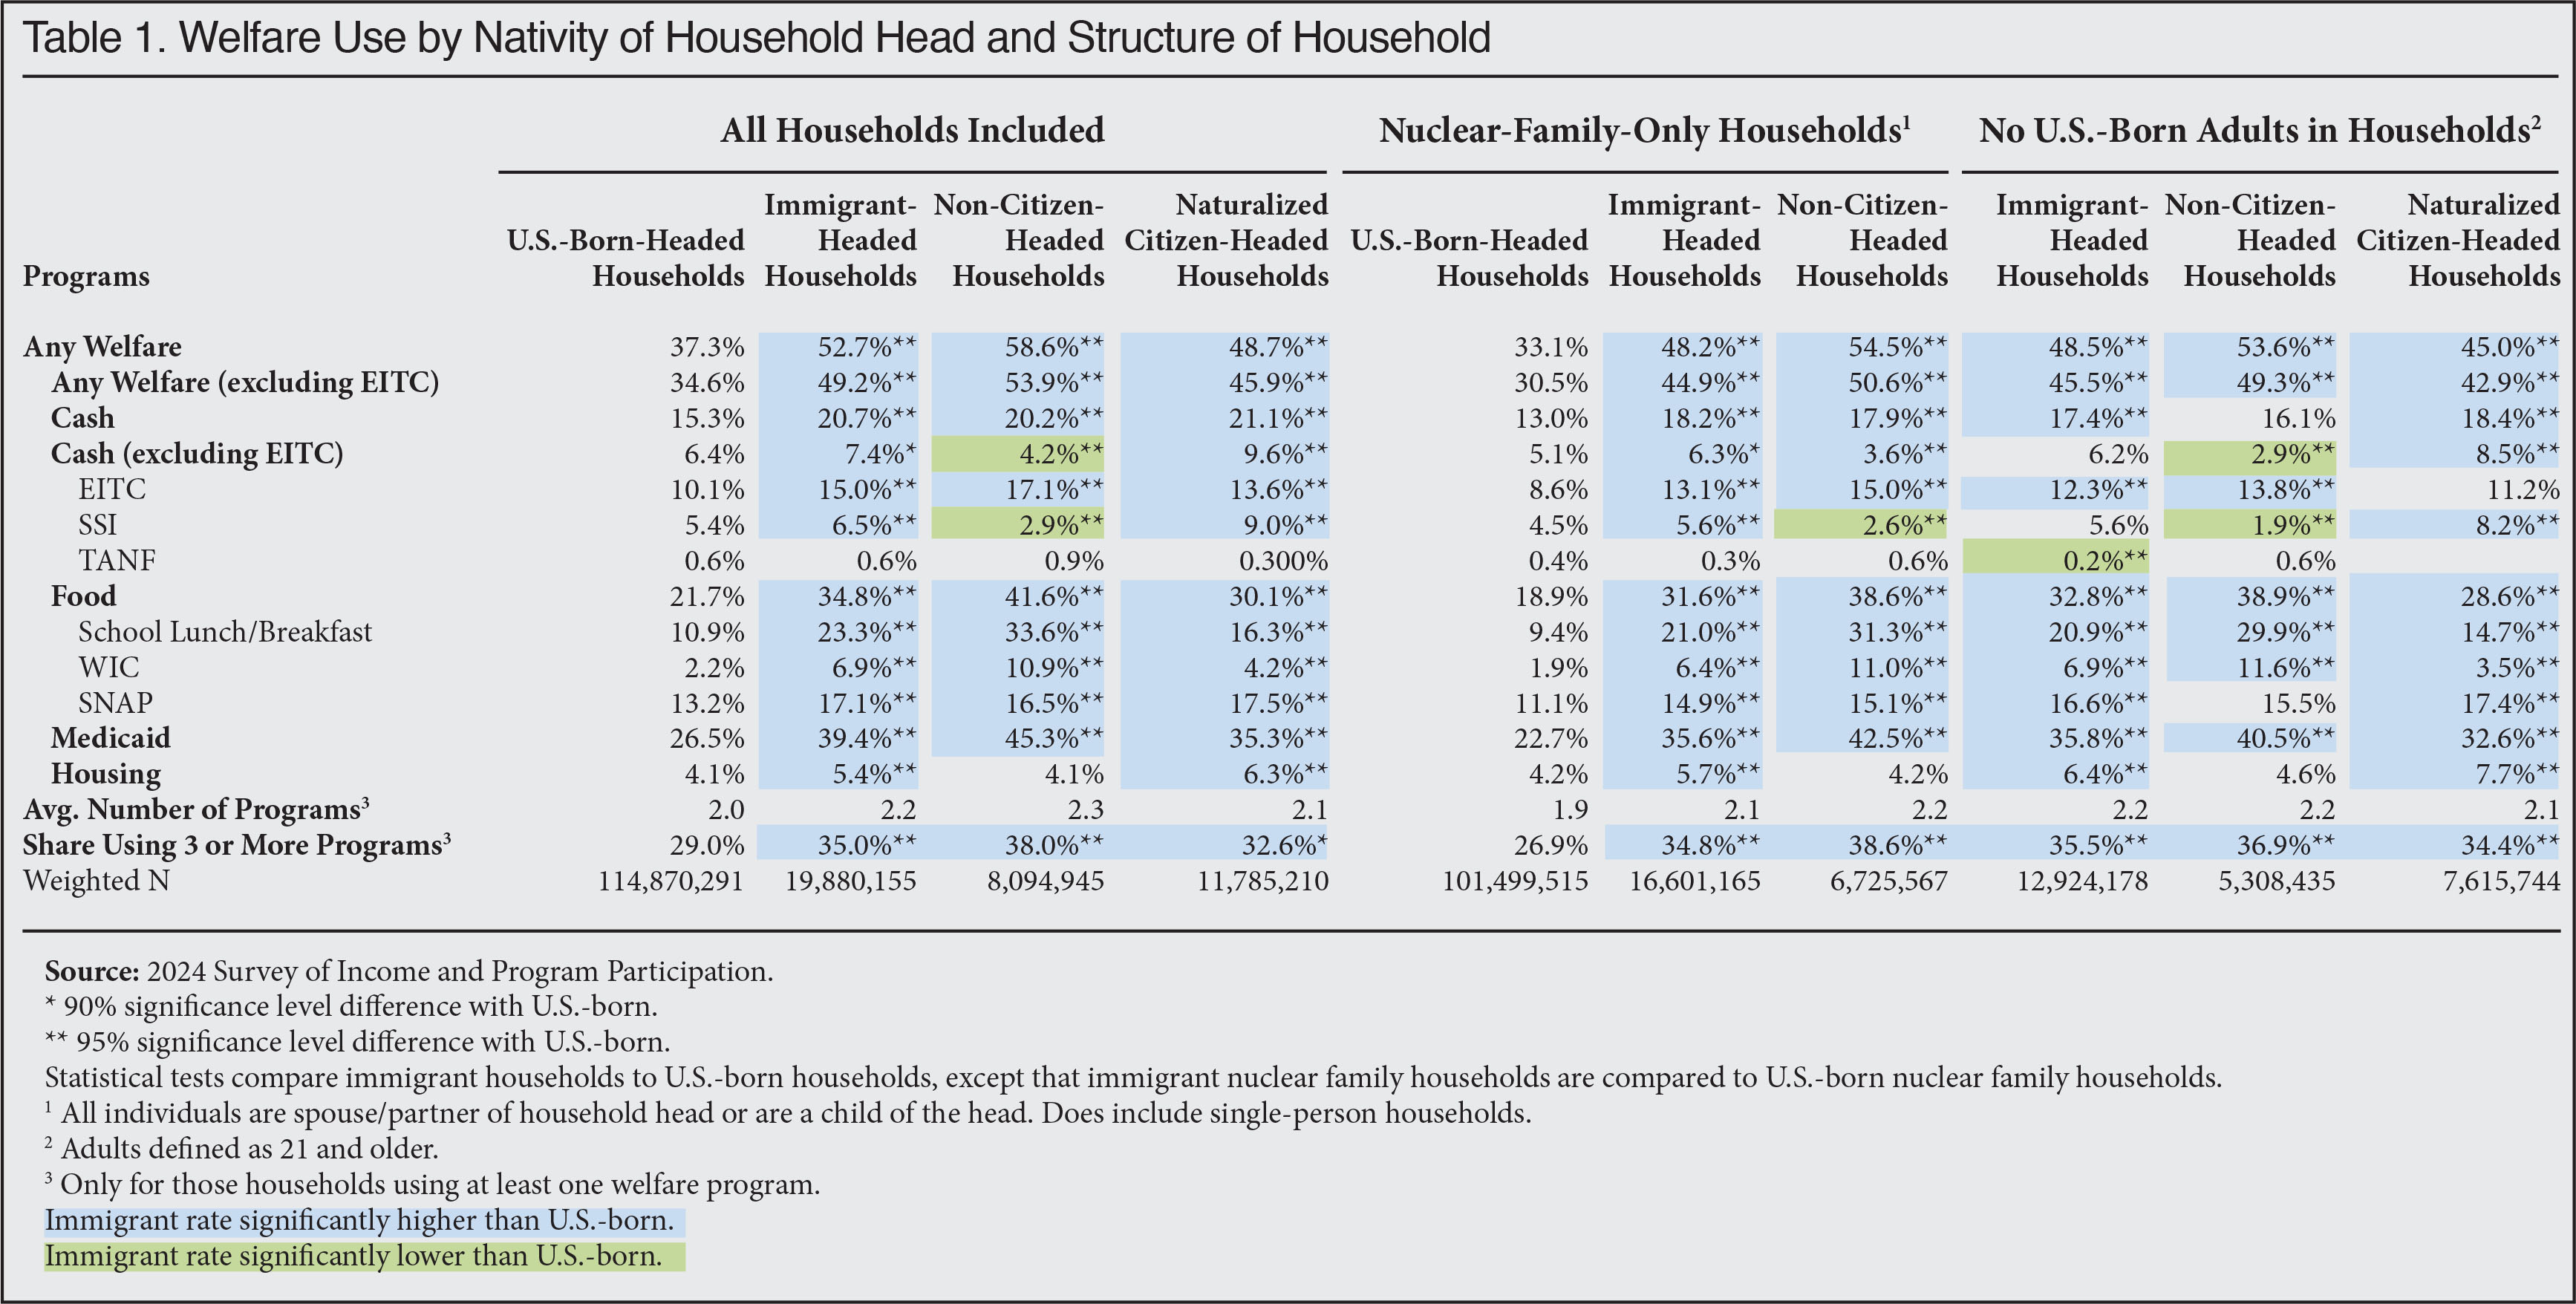 |
The overall rates include the Earned Income Tax Credit (EITC). In our view, this program is unambiguously a cash welfare program, as it is a means-tested anti-poverty program.7 However, it is different from the other programs because recipients must have earned income to receive it.8 That is, they have to work. For this reason, we report overall welfare use with and without the EITC in Table 1.9 If the EITC is excluded, Table 1 shows that the difference in overall welfare use between the foreign-born and the U.S.-born is still 14.6 percentage points, which is statistically significant.
Specific Programs. Looking at broad categories of welfare programs in Figure 1 shows that immigrant-headed households compared to U.S.-born households have especially high use of Medicaid (39 percent vs. 27 percent for natives) and food programs (35 percent vs. 22 percent for natives). Table 1 provides more specific information for individual programs and significance tests for each. The difference for cash programs when the EITC is included — 21 percent vs. 15 percent — is also statistically significant. The table also shows that compared to households headed by the U.S.-born, immigrant-headed households have statistically significant higher use for every program except TANF. It should be noted that the SIPP is not very good at measuring use of the seldom-used TANF. This is particularly the case for sub-populations such as immigrants or non-citizens because such a small share of all U.S. residents — immigrant or U.S.-born — avail themselves of what is now a relatively small program.
Household as a as Unit of Analysis. A household according to the Census Bureau is all of the people living in the same housing unit. Households can have more than one family. A family is defined by the Census Bureau as any two or more related individuals (by blood, marriage, or adoption) living in the same household. Much of the prior research has used households as the unit of analysis when examining welfare for a number of reasons.10 By looking at households, we are primarily measuring welfare received by immigrants and their dependent children. The Cato study discussed earlier significantly understates welfare associated with immigrants in our view because it assigns benefits received for the U.S.-born dependent children of immigrants to the U.S.-born totals. This is based on the rather odd idea that when immigrant parents receive welfare because they are unable to support their own children it has nothing to do with the immigrant parents. Yet the welfare costs would not even exist in such cases if the immigrant parents were not in the country. Further, when the government provides food, cash, housing, or medical care to children it is a clear benefit to their parents who are legally obligated to care for them.
Nonetheless, there is a stereotype of immigrant households as very large, containing multiple generations, more than one family, distant relatives, or unrelated individuals. It might be supposed such households, with so many disparate people, are more likely to have someone on welfare. Of course, more people also mean more potential workers, raising the income and reducing the need to access welfare. In fact, at 86 percent, immigrant households are more likely to have at least one worker present than U.S.-born households at 74 percent. Moreover, households headed by the foreign-born with at least one worker have 1.46 workers on average compared to 1.16 workers in U.S.-born households with at least one worker.
Household Size. Despite the stereotype of very large households, on average immigrant households have only about three people in the SIPP. While certainly larger than the 2.3 individuals in the average U.S.-born household, most immigrant households are not very large. In fact, only 9 percent of immigrant households have more than five people. Furthermore, the overwhelming majority (84 percent) of immigrants can be described as “nuclear households” — comprised of either a one-person household or a household with a head, his or her spouse/partner, and the head’s children.11 In short, in more than four out of five foreign-born-headed households there are no individuals unrelated to the head, nor are there any in-laws, grandchildren, or any other non-nuclear relatives. Some 88 percent of U.S.-born households fit this definition as well.
Welfare Use by Household Type. The middle of Table 1 reports welfare for only what we henceforth will call “nuclear family households". At 48.2 percent, the overall welfare use rate for immigrant households of this kind is not very different from the 52.7 percent for all immigrant households. At 33.1 percent, the welfare use rate for nuclear-family U.S.-born households is also similar to all native households. The gap in overall welfare use between immigrants and the U.S.-born at 15.1 percentage points when only nuclear households are compared is about the same as 15.4 percent when all households are considered. This difference is statistically significant. The same is generally true for most individual programs. For nuclear-family households headed by a non-citizen, the gap overall with the U.S.-born is also the same as it is when all non-citizens are compared to all U.S.-born headed households. The bottom line is that the presence of unrelated individuals and non-nuclear relatives does not explain immigrant households’ higher use of welfare.
The Presence of U.S.-Born Adults. The right side of Table 1 looks at households headed by the foreign-born excluding U.S.-born adults. These are typically the spouse, partner, or U.S.-born adult children of the household head. These individuals have full welfare eligibility, making it possible that their presence explains some of the welfare use of immigrant households. While these individuals are certainly common in immigrant-headed households, when they are not included, Table 1 shows welfare use of immigrant households only drops to 48.5 percent overall. Again, this is not very different from the 52.7 percent for all immigrant households. This difference is still 11.2 percentage points higher than for U.S.-born households overall and it is statistically significant. For individual programs, the gap between immigrant-headed and U.S.-born households also narrows a bit in most cases when households with U.S.-born adults are excluded. For non-citizen households, the welfare use rate overall is also somewhat lower when U.S.-born adults are excluded, but it is still 53.6 percent and the difference with the U.S.-born is still statistically significant. The presence of U.S.-born adults in immigrant households is common. But their presence only increases welfare use rates for foreign-born households modestly. As Table 1 shows, the gap with the U.S.-born remains and is statistically significant for the most part when these individuals are excluded.
Legal Immigrants. Determining the legal status of immigrants in the Census Bureau data is always difficult and comes with significant uncertainty. The appendix at the end of this report explains how we do this. In short, we use the self-reported characteristics of immigrants to assign weighted probabilities to the foreign-born to create a representative population of illegal immigrants, which we subtract from the total immigrant population to estimate the legal-immigrant population (mainly naturalized citizens and green card holders).12 Some may wonder why we look at legal-immigrant welfare use since they are already here and presumably are going to stay. This is certainly true, but the reason to look at legal immigrant use of these programs is to shed light on whether our current system is admitting large numbers of people who are unable to support themselves or their dependent children. The extent to which legal immigrants use the welfare system can reasonably be seen as an indication that there may be a problem with the vetting or selection criteria used for those admitted legally. This is certainly the case if one believes that immigrants are supposed to be self-sufficient.
Figure 2 and Table 2 show that legal immigrants, which includes naturalized citizens, have high welfare use overall at 50.6 percent. With the exception of TANF, legal immigrants have higher use rates than the U.S.-born for every program. Turning to households headed by non-citizens, legal immigrants (mainly green card holders), shows even higher overall welfare use at 56.3 percent. Looking at specific programs, legal, non-citizen households have statistically significant higher welfare use than the U.S.-born for the EITC, school lunch/breakfast, WIC, SNAP, Medicaid, and housing.
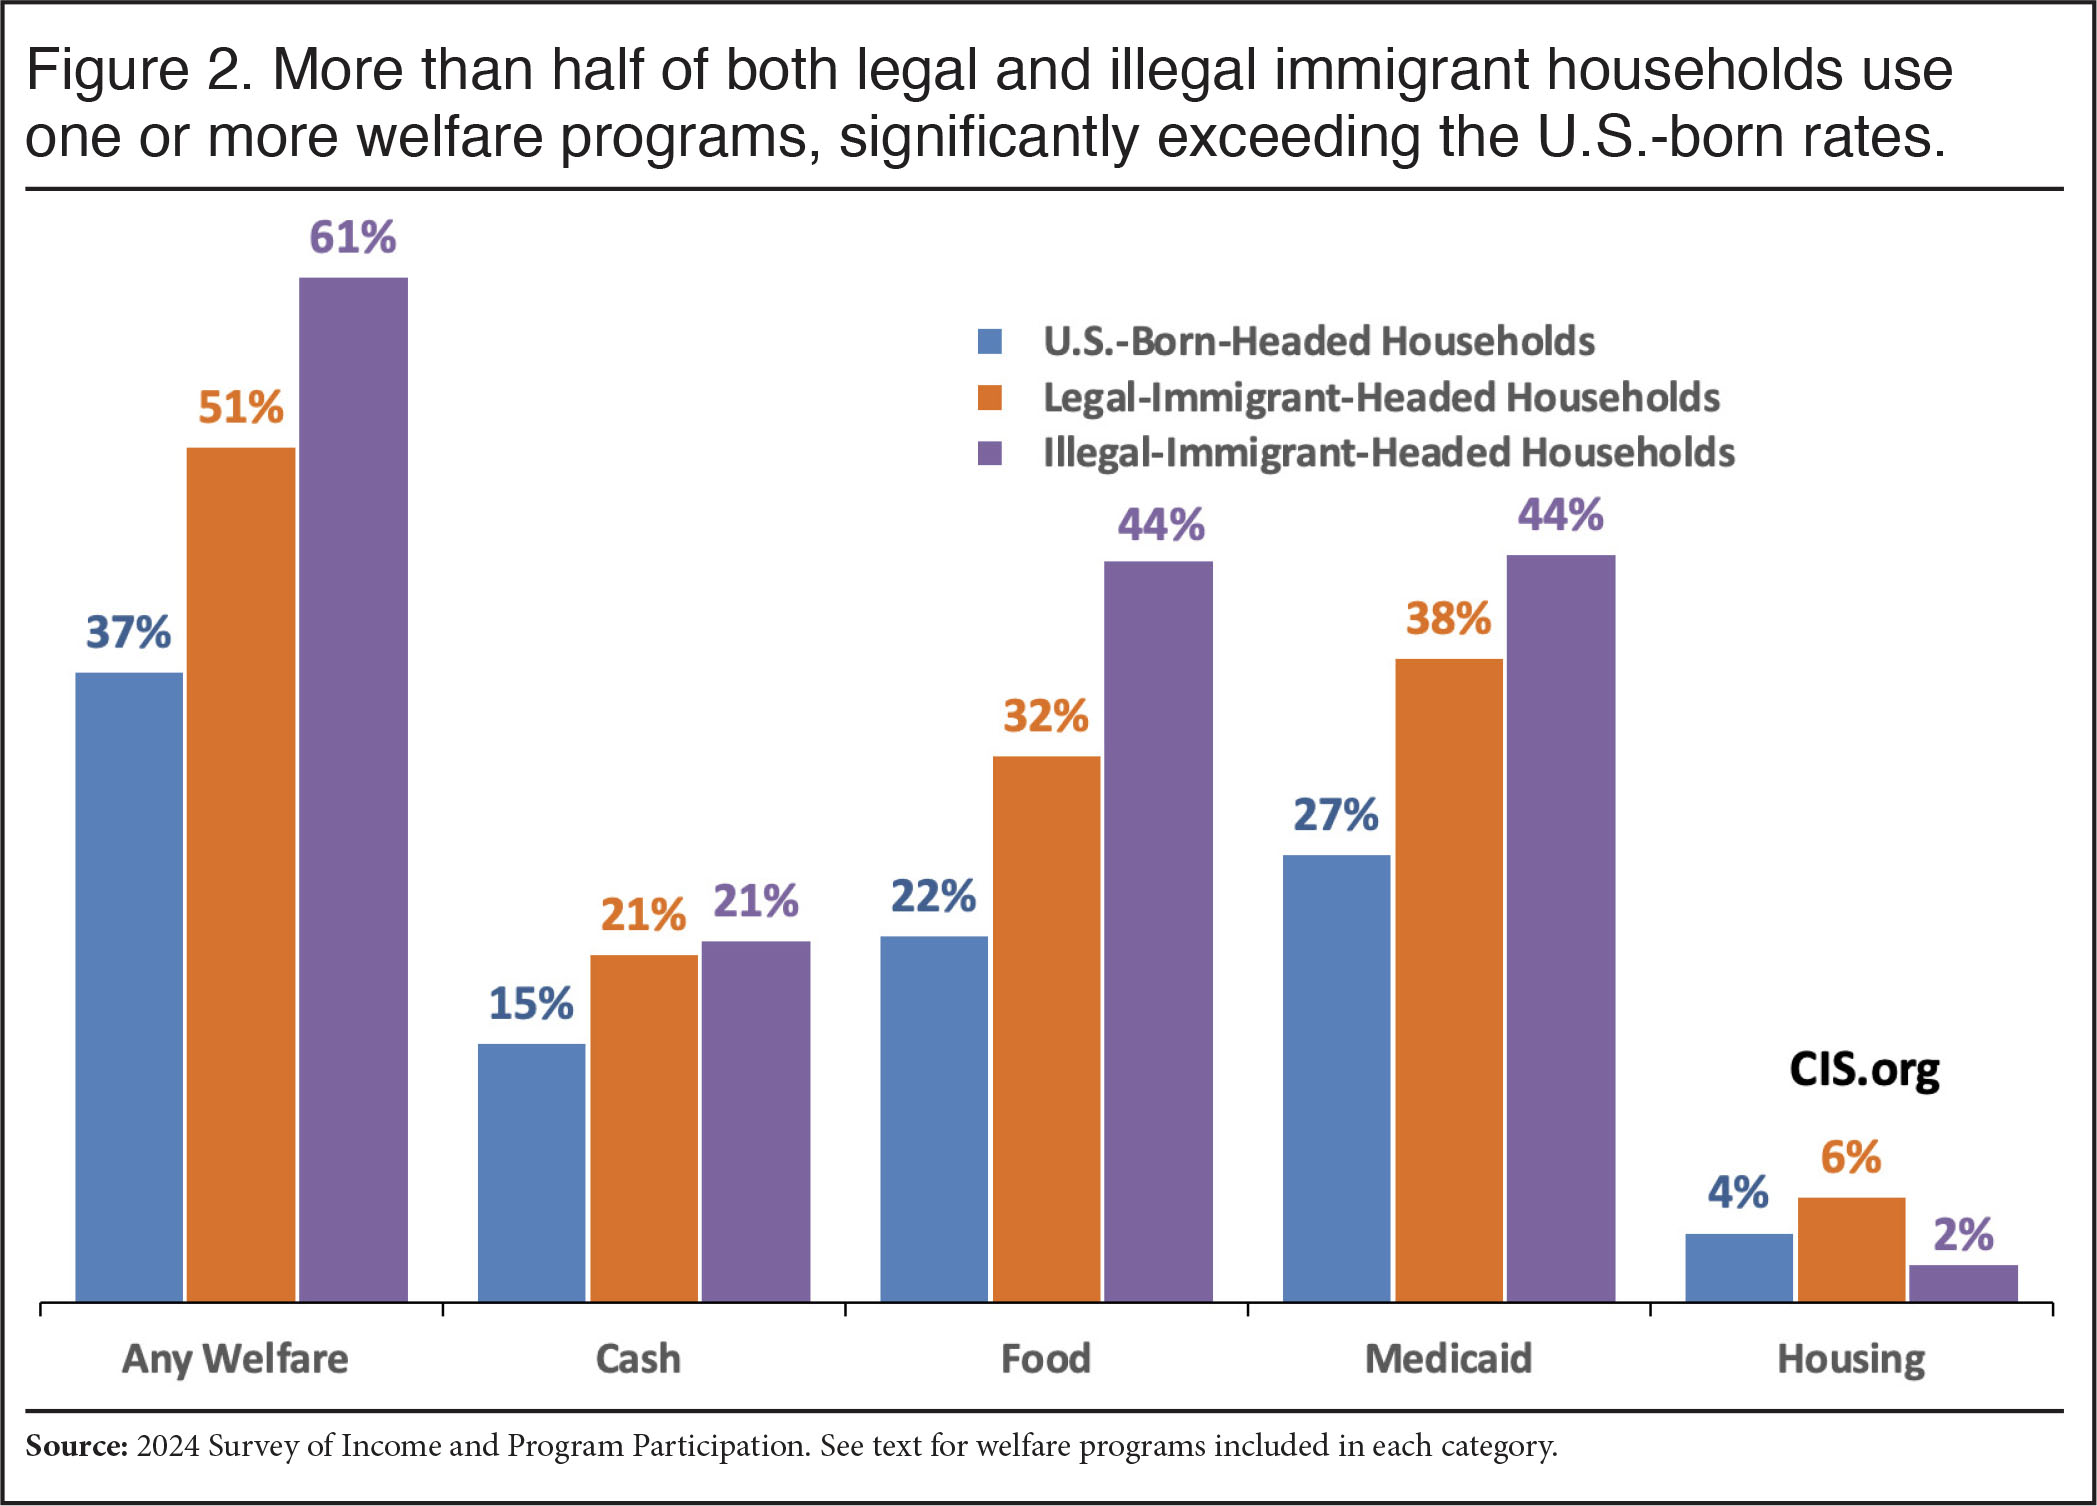 |
Illegal Immigrants. Figure 2 and Table 2 indicate that households headed by illegal immigrants, also called the undocumented or unauthorized, have higher overall welfare use rates than the U.S.-born and the difference is statistically significant.13 We estimate that 60.7 percent of illegal immigrant households use one or more welfare programs, a large and statistically significant higher rate than the U.S.-born households. Turning to specific programs, we find that, relative to native-headed households, illegal-immigrant-headed households use the EITC, School Lunch/Breakfast, WIC, and Medicaid at statistically significant higher rates than the U.S.-born. However, their use of SSI and housing is at a statistically significant lower level. Assuming our estimates are correct, the SIPP data indicates that use of the welfare system by illegal-immigrant households is extremely common. It is also important to note that we have no evidence that their use rates reflect widespread cheating or fraud. Their high rates of welfare use primarily reflect their generally lower education levels and their resulting low incomes, coupled with the large share who have U.S.-born children who are eligible for all welfare programs from birth.
Why Is Illegal Immigrant Welfare Use So High? The high use of welfare by illegal immigrant-headed households may seem implausible. However, there are several things to consider: First, more than half of all illegal-immigrant households have one or more U.S.-born children. These children have the same welfare eligibility as any other U.S. citizen, including even public housing.14 Second, many states offer Medicaid directly to illegal immigrants. For example, 14 states currently offer Medicaid to all low-income children, regardless of immigration status, and even more states provide it to all low-income pregnant women, again without regard to legal status. A few states go beyond this and offer Medicaid to other adult illegal immigrants.15 Third, illegal-immigrant children and pregnant women have the same eligibility for WIC as U.S. citizens under federal law; and all children are eligible for free subsidized school lunch/breakfast as well.
Fourth, there are six states that offer SNAP benefits to illegal immigrants under limited circumstances.16 Fifth, several million illegal immigrants have work authorization, which provides a Social Security number and with it EITC eligibility. 17 This includes those with DACA, TPS, many applicants for asylum, a large share of parolees, and those granted suspension of deportation and withholding of removal. The Department of Homeland Security, Pew Research, the Center for Migration Studies, and the Migration Policy Institute all counted these individuals as illegal immigrants in their estimates and we do here as well.18 Sixth, prior research indicates that the overwhelming majority of illegal immigrants have no education beyond high school and, as a result, a very large share of illegal immigrants have incomes low enough to qualify for welfare.19 Finally, it should be remembered that the job of those in the welfare bureaucracy is to help low-income residents receive the welfare for which they are eligible.
What if Illegal Immigrants Don’t Use Welfare? Some may remain convinced that illegal immigrants are unaware of welfare or are too fearful to use it. But if we are mistaken and somehow illegal immigrants do not use welfare as we show, then mathematically it must mean that the number of legal immigrant households using welfare must be correspondingly much higher because immigrant-headed households in the SIPP can only be headed by legal or illegal immigrants. If we assume that illegal aliens are in the survey, which they must be, but use no welfare, then all of the households receiving welfare would have to be legal-immigrant households. If that is the case, then the welfare use rate for legal immigrants would have to be above 57 percent, compared to the 50.6 percent we actually estimate.20 Use of individual programs would increase correspondingly as well. The reality is that illegal immigrants are included in the SIPP, a large share of them are poor, and they or their U.S.-born children have welfare eligibility. Many take advantage of this eligibility.
Illegal Immigrant Welfare Use Matters. Beyond just the direct impact on public coffers of illegal immigrants’ use of welfare, their use of these programs shows that many illegal immigrants are struggling in the United States. Moreover, if illegal-immigrant-headed households have high welfare use, then it shows that efforts to restrict immigrants from programs once they are in the country is politically and practically difficult and not likely to be very effective. It also means that the influx of illegal immigrants that caused this population to increase dramatically during the Biden administration has profound implications for public coffers. This is especially true because a large share of those released into the country were granted parole. Parolees are “qualified aliens”, which means they generally have the same welfare eligibility as new permanent legal immigrants. After five years, this becomes full welfare eligibility with the exception of SSI, which requires 10 years of work.
Excluding Programs. One might think that the higher overall rate of welfare use by immigrants is caused by just one or two particular programs. But, as we have already seen, when we look at individual programs in Tables 1 and 2, immigrant rates are higher than those of the U.S.-born for most individual programs. Equally important, the top of Table 3 looks at this question by excluding one program at a time, while the bottom of the table excludes multiple programs at once. The most important finding in Table 3 is that the rate for all types of foreign-born households remains at a statistically significant higher level for immigrants than the U.S.-born no matter what program or programs we exclude. Clearly, no single program explains the higher overall welfare use of immigrants.
 |
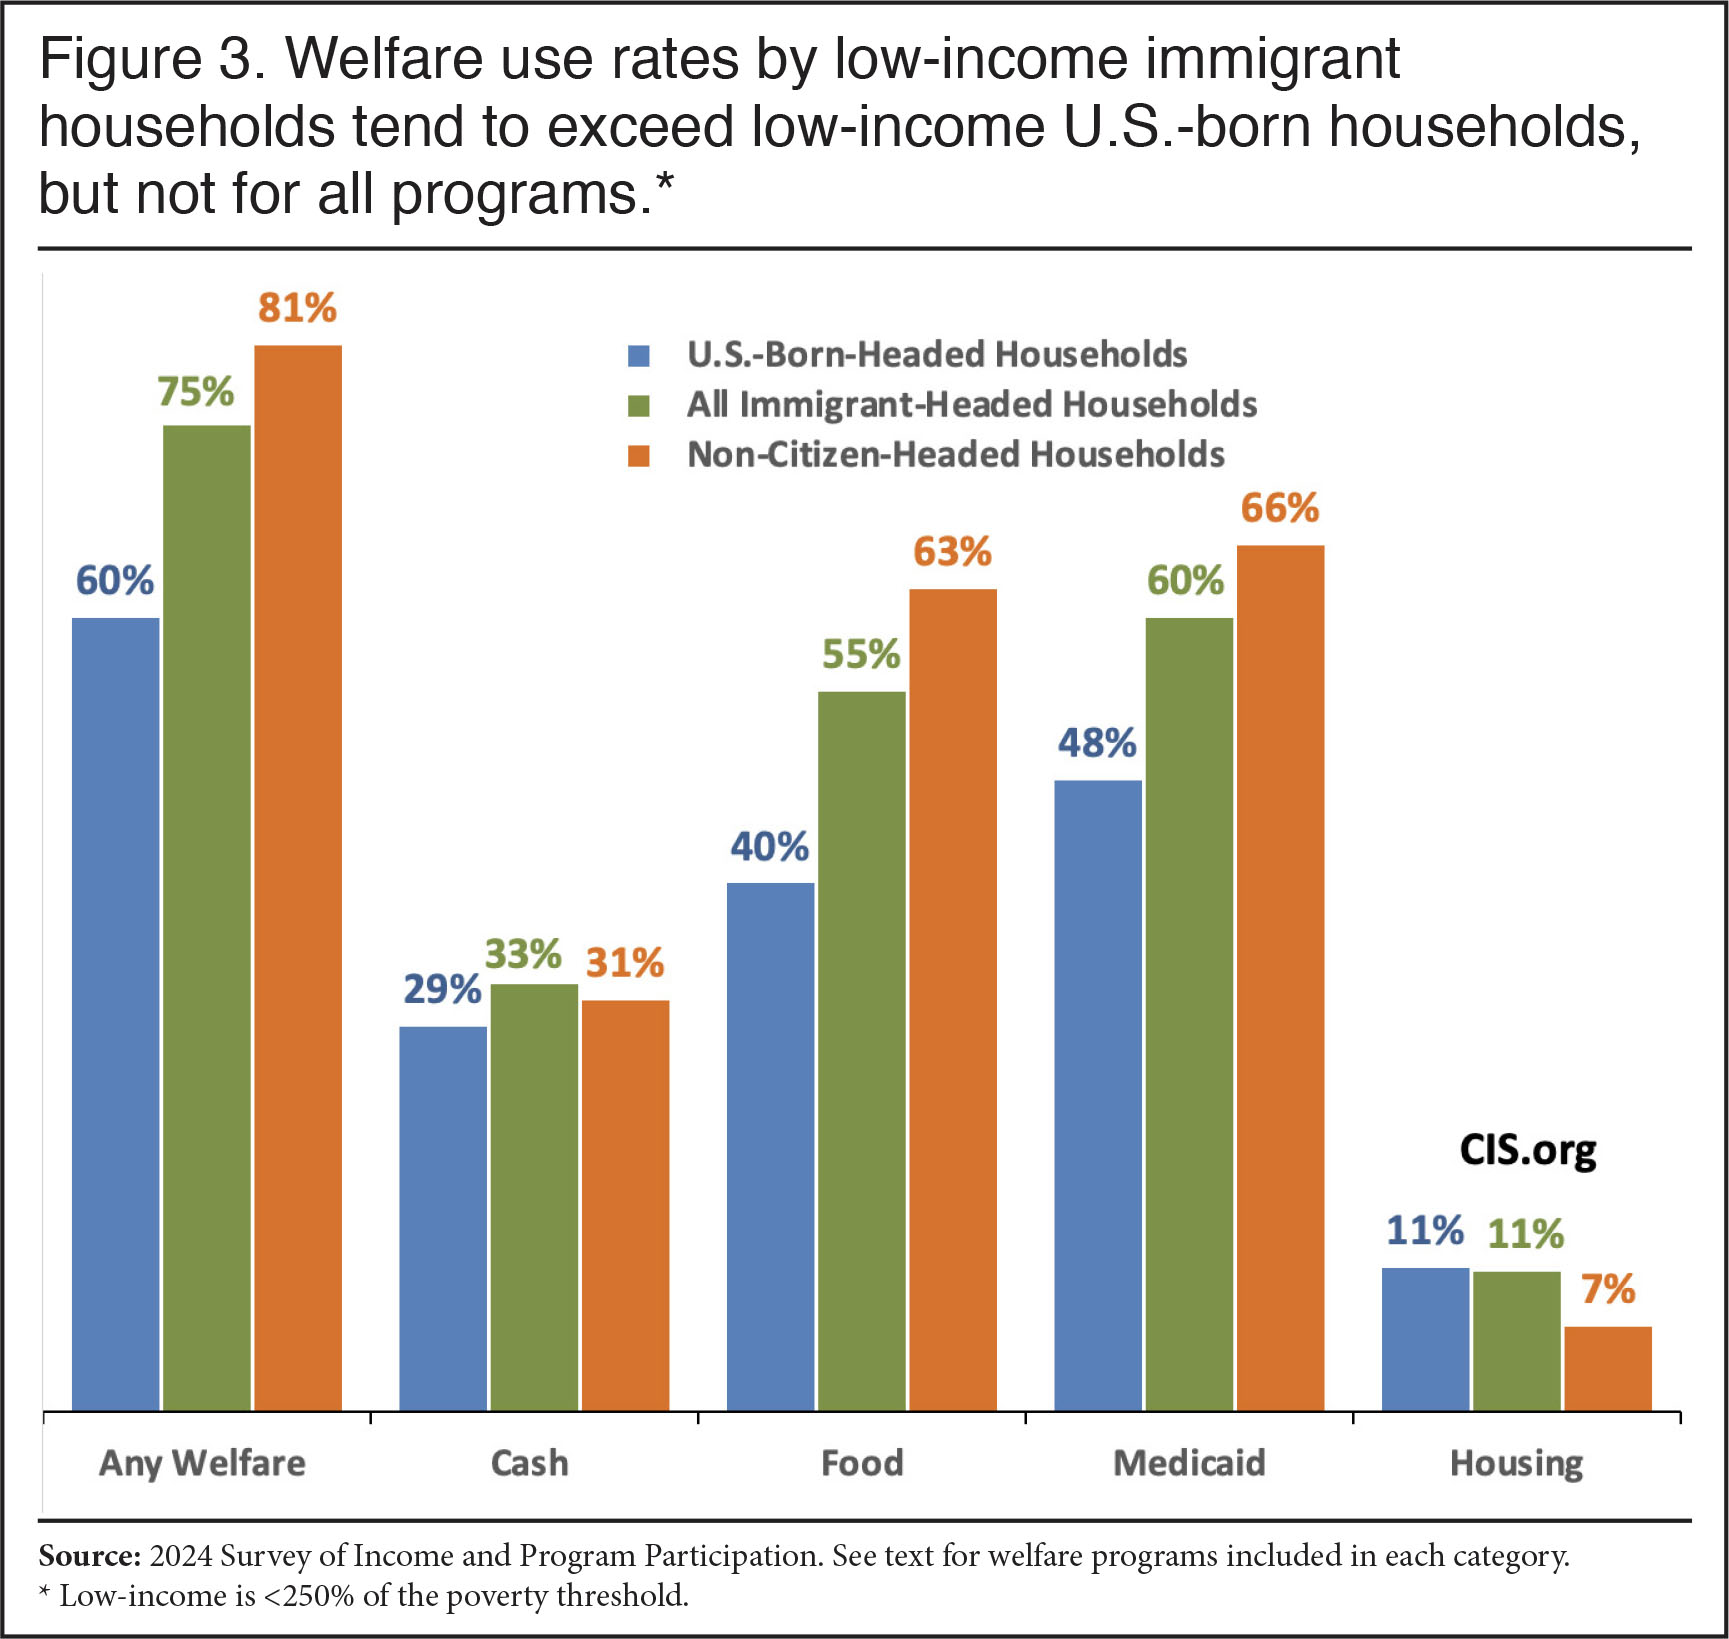
Low-Income Immigrants and Welfare Use. Though there are numerous exceptions, welfare is linked to income, with many programs phasing out around 250 percent of the poverty threshold. Because poverty controls for family size, it is a good way to think about the relationship between income and welfare use. In 2024, based on the SIPP, 15.1 percent of immigrant-headed households were in poverty compared to 10.7 percent of U.S.-born households.21 Equally important, 39.6 percent of immigrant households vs. 32.4 percent of U.S.-born households have incomes below 250 percent of poverty ($62,150 for a typical family of three in 2023).22
The higher rates of poverty or near-poverty among households headed by the foreign-born helps to explain their higher overall use of welfare. Figure 3 shows that, as expected, both low-income immigrant and U.S.-born households make very extensive use of welfare. Low-income immigrants in the figure (<250 percent of poverty) have higher use of cash, food, and Medicaid, but not housing. Looking at the top portion of Table 4, we see that immigrants in poverty have a similar rate of welfare use to U.S.-born-headed households in poverty. However, immigrant households overall and non-citizen households with income less than 250 percent of poverty tend to have higher welfare use for most programs compared to the U.S.-born, but this is not true for all programs. The lower part of Table 4 looks at income for nuclear-family households only. The results are similar to the top of the table when all households are considered. The finding that low-income immigrant households have higher welfare use overall and for some programs in particular contradicts the argument made by some that low-income immigrants use welfare less than the low-income U.S.-born. Of course, focusing on low-income immigrants and natives overlooks the more important issue mentioned at the outset of this discussion — the larger share of foreign-born households with low incomes in the first place, which contributes to their higher welfare use.
 |
High-Income Households. One striking finding in Table 4 is that households with income above 400 percent of poverty ($99,440 for a family of three in 2023) use welfare at surprisingly high rates — 29.5 percent for immigrants and 20.1 percent for the U.S.-born. One thing to keep in mind is that we are calculating poverty based on the poverty status of the household head. If other families or unrelated individual(s) are present, then they could have incomes low enough to qualify for welfare. But their income and expenses would generally have to be considered separately for them to qualify for social welfare programs. Moreover, when we look at only nuclear family households — all members of the households are either the spouse/partner or child of the of the head — we still find that high-income immigrant households use welfare at higher rates than high-income U.S.-born households. The bottom of Table 4 shows that 24.4 percent of immigrant-headed households with income four times the poverty threshold use one or more welfare programs, as do 16.5 percent of high-income nuclear U.S.-born households. The welfare use of high-income households is not explained by the presence of extended family or unrelated individuals living with the high-income household head. The relatively high use of welfare even of high-income nuclear family households may seem strange, but there are actually a number of ways this can happen.23
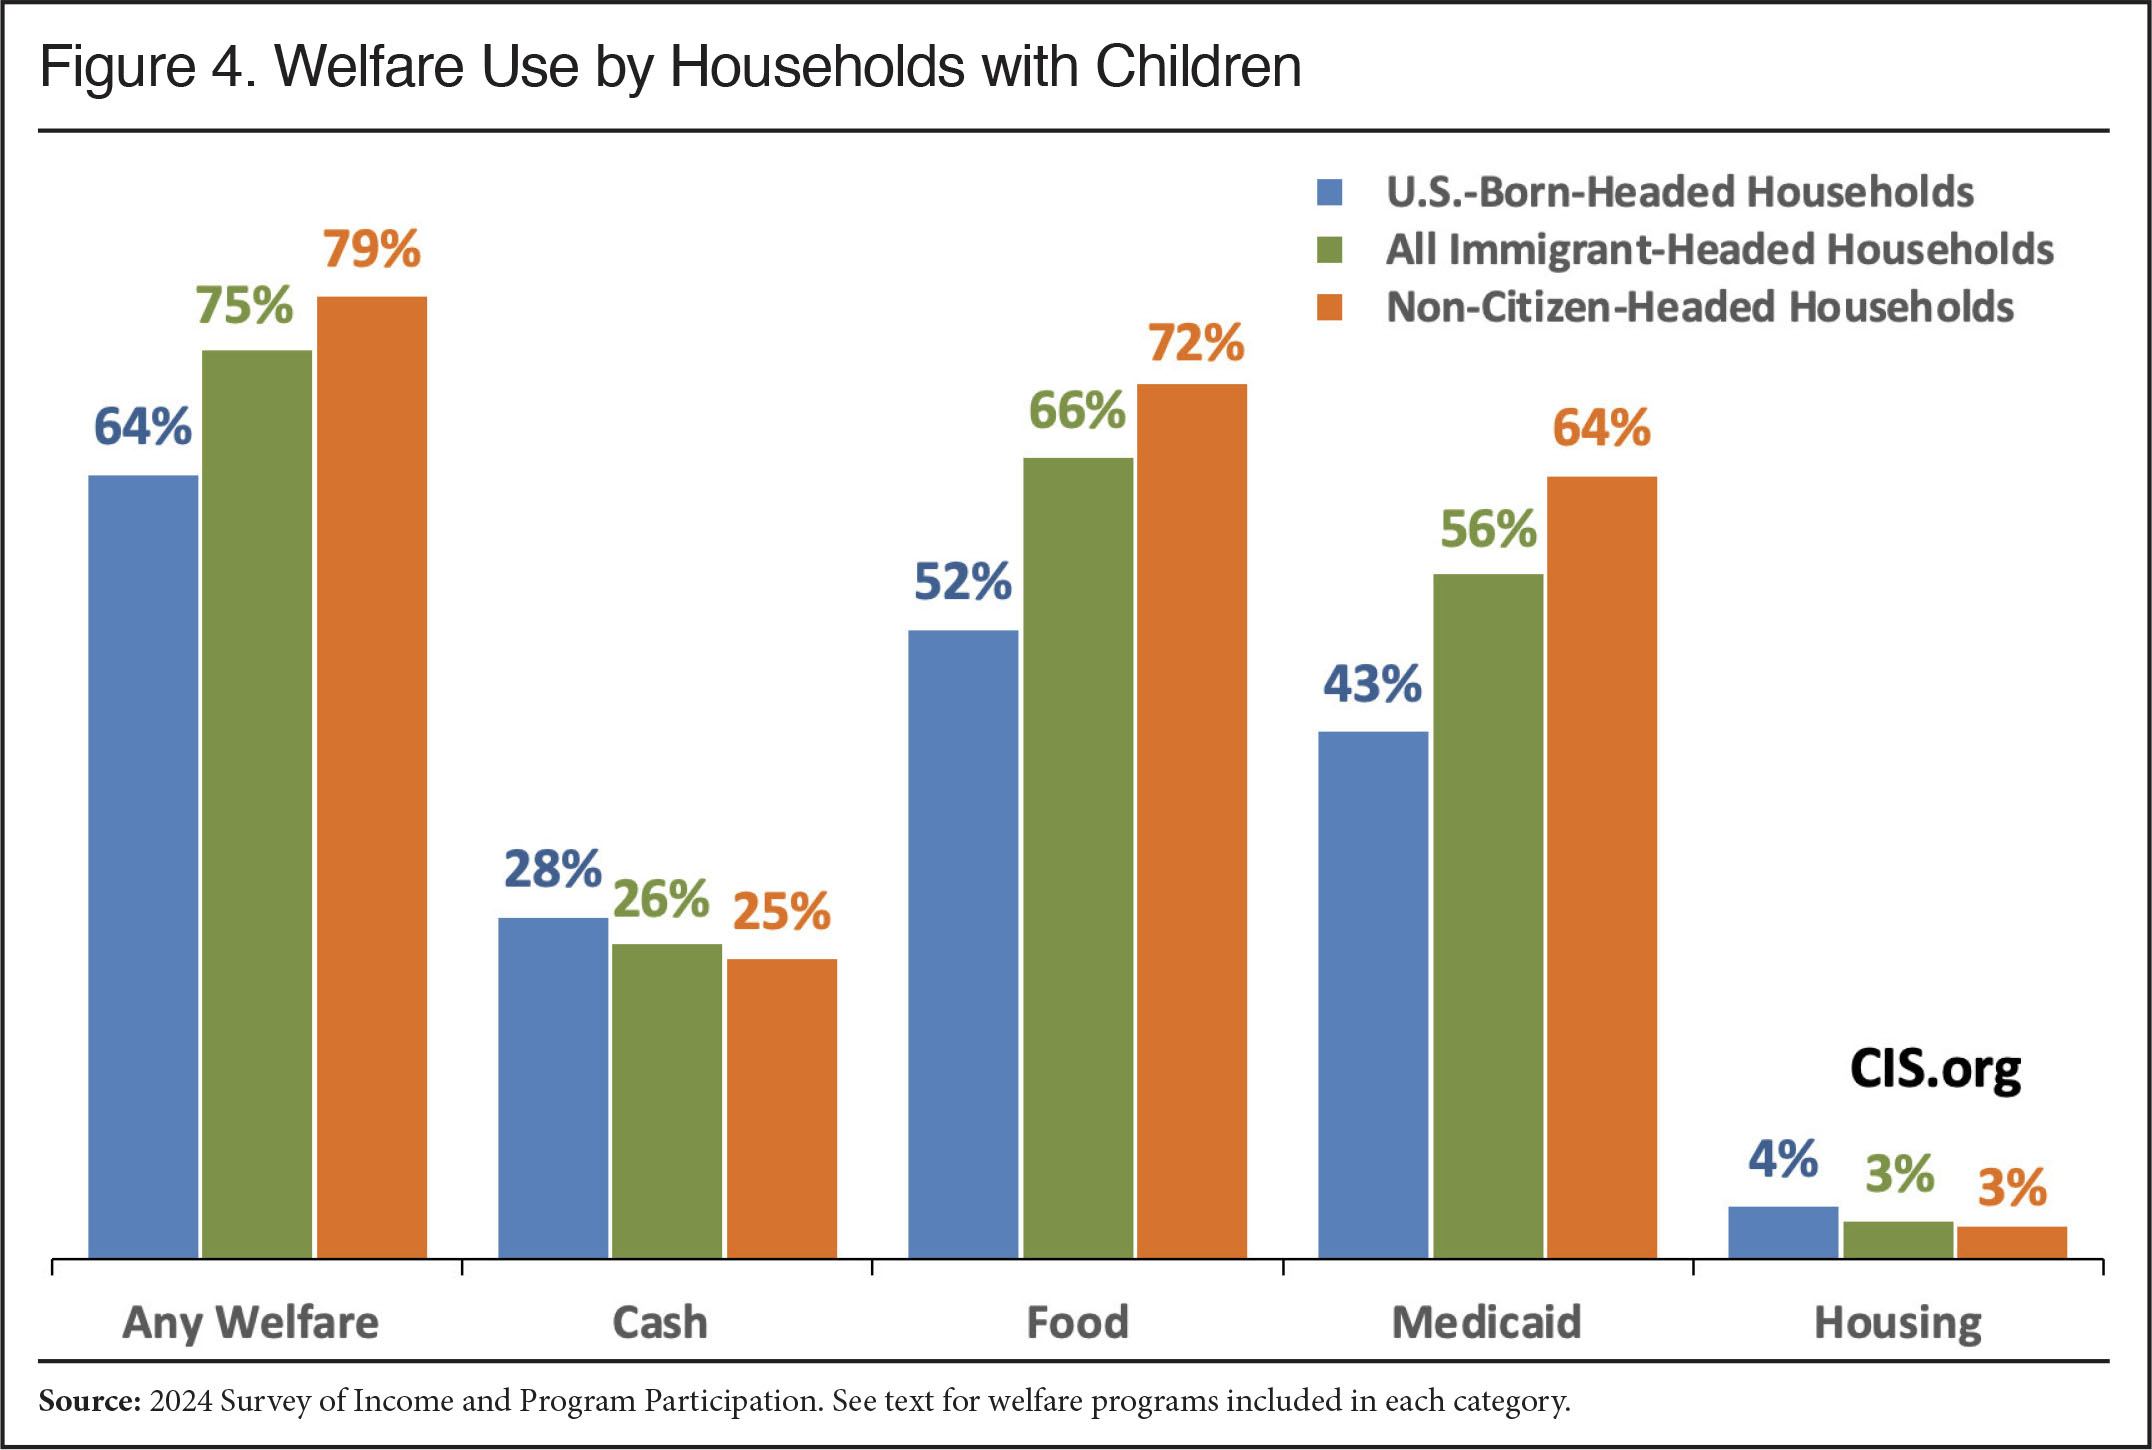
Households with Children. Much of the nation's welfare system is specifically designed to help low-income parents with children. Programs like TANF (formerly called Aid to Families with Dependent Children), the Women, Infants, and Children nutrition program, free/subsidized lunch/breakfast for students, and Medicaid for children (referred to as the Children's Health Insurance Program, CHIP) were explicitly created for minors. Immigrant households are more likely to have children — 41.2 percent vs. 24.4 percent of the U.S.-born. This fact contributes to immigrants’ higher use of welfare. Immigrant households are not only more likely to have children, but when they do, they are also more likely to be low-income. In the 2024 SIPP, 43.5 percent of all immigrant households with children and 53.7 percent of non-citizen households had incomes below 250 percent of poverty, compared to 34.2 percent of U.S.-born-headed households.
Figure 4 shows that immigrant households with children are more likely to use welfare overall than are U.S.-born households with children, with higher rates for food assistance programs and Medicaid, but not cash programs or housing. Table 5 shows that 74.6 percent of immigrant-headed households with children use one or more welfare programs and for non-citizens it is 79 percent, compared to 64.3 percent for U.S.-born households with children. While the overall rate of welfare use for households with children seems extraordinarily high for both immigrants and natives, it should be remembered that Table 3 showed that, for households with children, excluding the school lunch/breakfast program reduces the use rate to 62.6 percent for immigrant households with children and to 50.5 percent for U.S.-born households with children. That said, Table 3 showed that the difference is actually larger when school meals are excluded. Table 5 shows that foreign-born households with children have significantly higher use of WIC, school meals, SNAP, and Medicaid, while immigrant use is significantly lower for TANF and housing. It seems fair to say based on this data that a very large share of immigrants come to America, have children, struggle to provide for them, and so turn to taxpayers for support. This can be seen as especially problematic given that there are already a large number of Americans who are also struggling to provide for their children.
 |
Households with Children by Legal Status. As already discussed, the presence of U.S.-born children is one of the main ways illegal immigrants can access welfare. Of minor children in legal and illegal immigrant households, we estimate that nearly nine out of 10 are U.S.-born. Furthermore, even illegal immigrant children are eligible for some programs nationally, and some states add to this eligibility. Equally important, of households with children headed by illegal immigrants, 62.4 percent have incomes below 250 percent of poverty. This is the case for 36.8 percent of households headed by legal immigrants with children. The presence of children coupled with the large share with low incomes means that the welfare use rates of immigrants will be high as well.
Table 6 reports use of welfare for households with children based on the legal status of the household head. At 86.6 percent, the share of illegal-immigrant households with children accessing one or more welfare programs is very high, as is the 70.4 percent for legal immigrants. Both are significantly higher than the 64.3 percent for U.S.-born households, though the rate for the U.S.-born is certainly very high as well. Table 6 also shows that illegal-immigrant households with children use school meals, WIC, and Medicaid at statistically significant higher rates than the U.S.-born, while their use of SSI, TANF, and housing is lower. As for legal-immigrant households, their use of school meals, WIC, SNAP, and Medicaid is significantly higher, while there are no programs they use at lower rates.
Households Without Children. Figure 5 reports welfare use for households without children. Table 7 provides more detailed information. Since a primary goal of the welfare system is to help low-income households with children, it is not surprising that use of welfare by childless households is much lower than for households with children. Yet Figure 5 shows that 37.4 percent of childless foreign-born households use the welfare system as do 28.5 percent of U.S.-born households without children. The 8.9 percentage-point higher use of any welfare program by households headed by immigrants without children shown in Table 7 is statistically significant. Childless immigrant households have significantly higher use rates than U.S.-born households for EITC, SSI, Medicaid, and housing.24
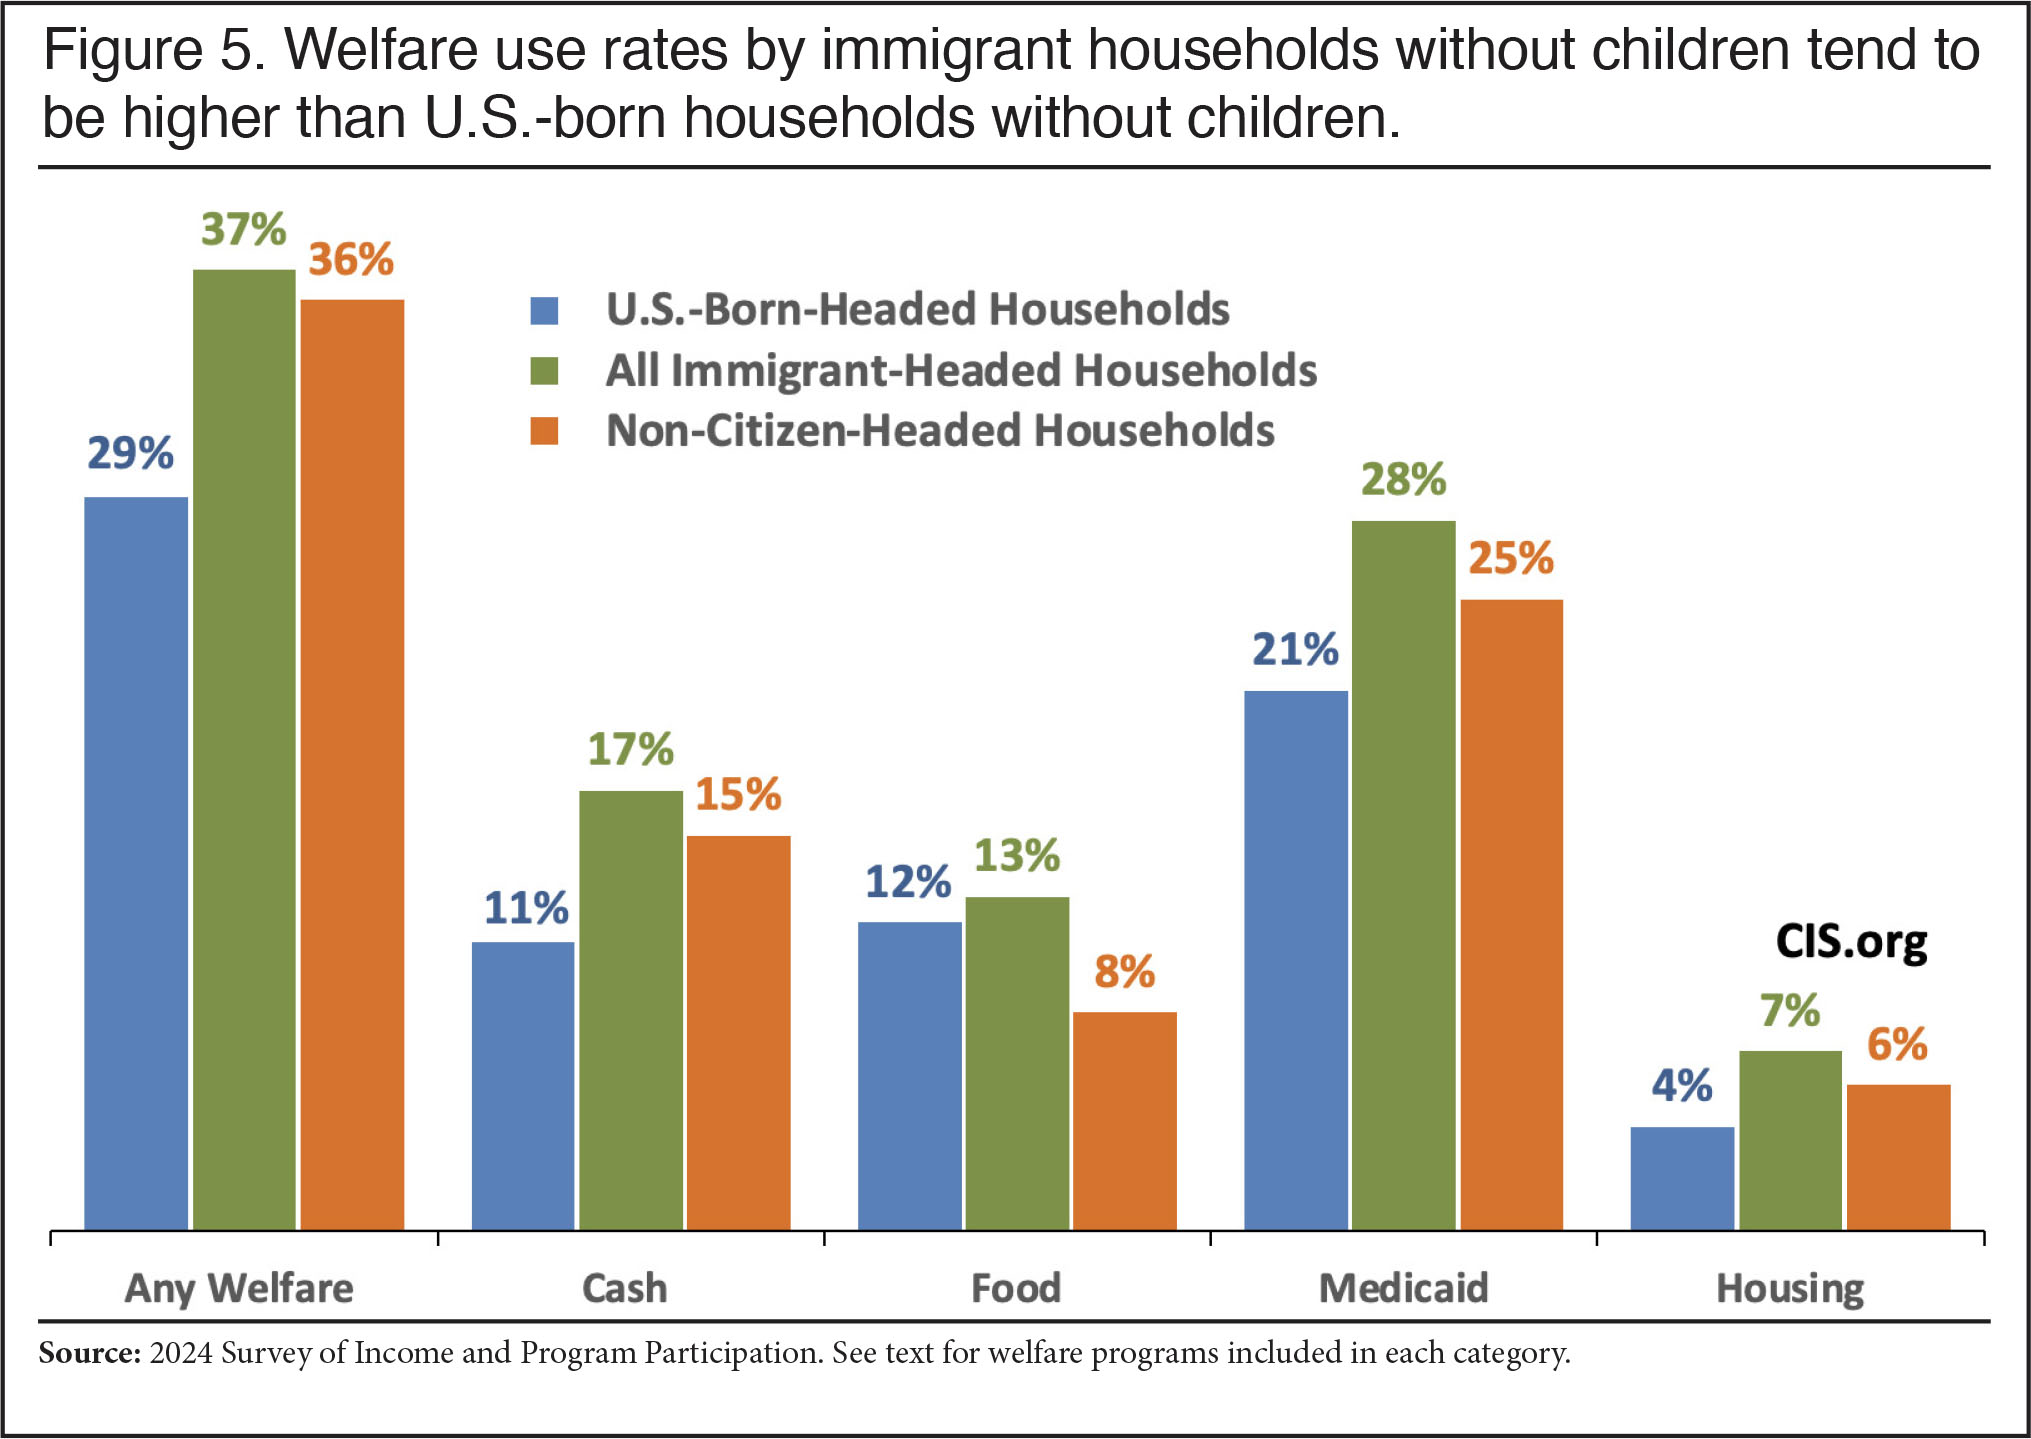 |
In interpreting the findings in Figure 5 and Table 7 it should be kept in mind that most immigrant and U.S.-born households do not have children. This means that childless households have a very large impact on the welfare use rates for all immigrant and all U.S.-born households. As already discussed, one of the reasons immigrant households have higher use of welfare overall is that they are more likely to have children, and such households are more likely to access welfare. However, another factor contributing to immigrants’ overall higher welfare use is that immigrant households without any children are also significantly more likely to use some welfare than childless U.S.-born households. But this is not true for illegal-immigrant households without children, which have lower welfare use than childless U.S.-born households for most programs. This is to be expected since so much of illegal immigrant welfare use is due to the presence of their U.S.-born children.
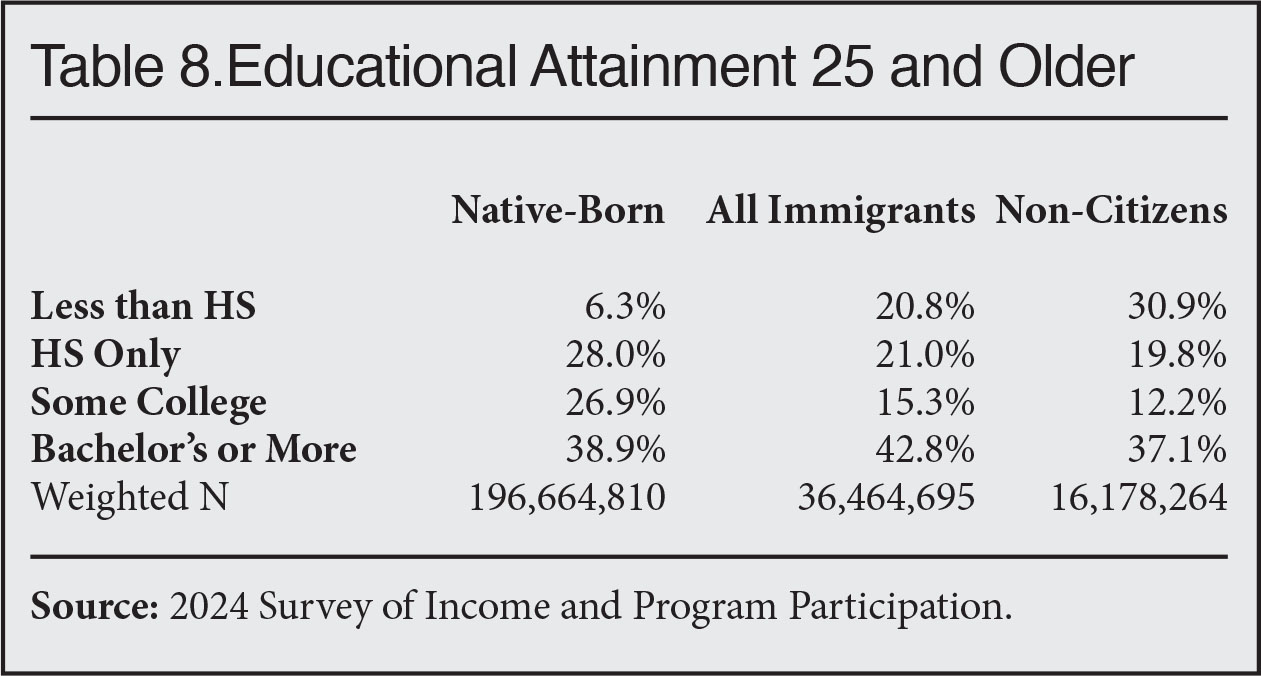
Immigrant Education Levels. It is well established that educational attainment is one of the best predictors of income in the modern American economy and, as a result, welfare use. Table 8 reports the educational attainment of immigrants 25 and older based on the SIPP. It shows that 41.8 percent of immigrants have no education beyond high school, compared to 34.3 percent of the U.S.-born. At the higher end of the educational distribution, the share of immigrants and the U.S.-born with at least a bachelor’s degree is similar at 42.8 percent for immigrants and 38.9 percent for the U.S.-born.25 Further, analysis of standardized tests shows that immigrants with the same nominal education level as a U.S.-born person score significantly lower on literacy, math, and computer skills and tend to earn less as a result.26 This is the case even for immigrants with a bachelor’s degree if it was earned overseas. As we have seen, a significantly larger share of households headed by the foreign-born are in poverty or have low income more broadly defined. Given the larger share of immigrants with modest levels of education and their lower average skills when they are educated abroad, it is not surprising that a larger share of households headed by immigrants have incomes low enough to qualify for welfare.
 |
Welfare Use by Education Level. Figure 6 shows welfare use by types of programs based on the education level of the household head. Table 9 provides more detailed information on program use and significance tests. As expected, educational attainment has a huge impact on welfare use for immigrants and the U.S.-born. For example, 77.6 percent of immigrant households headed by someone without a high school diploma access one or more welfare programs. For U.S.-born households with a head with this level of education it is 67.1 percent. In contrast, 34.3 percent of immigrant households headed by someone with at least a bachelor’s use welfare as do 23.3 percent of U.S.-born households headed by someone with at least a bachelor’s. Educational attainment is a very good predictor of income and, not surprisingly, welfare use. The fact that a much larger share of immigrant households are headed by someone with a modest level of education is one of the reasons immigrant households generally have high welfare use.
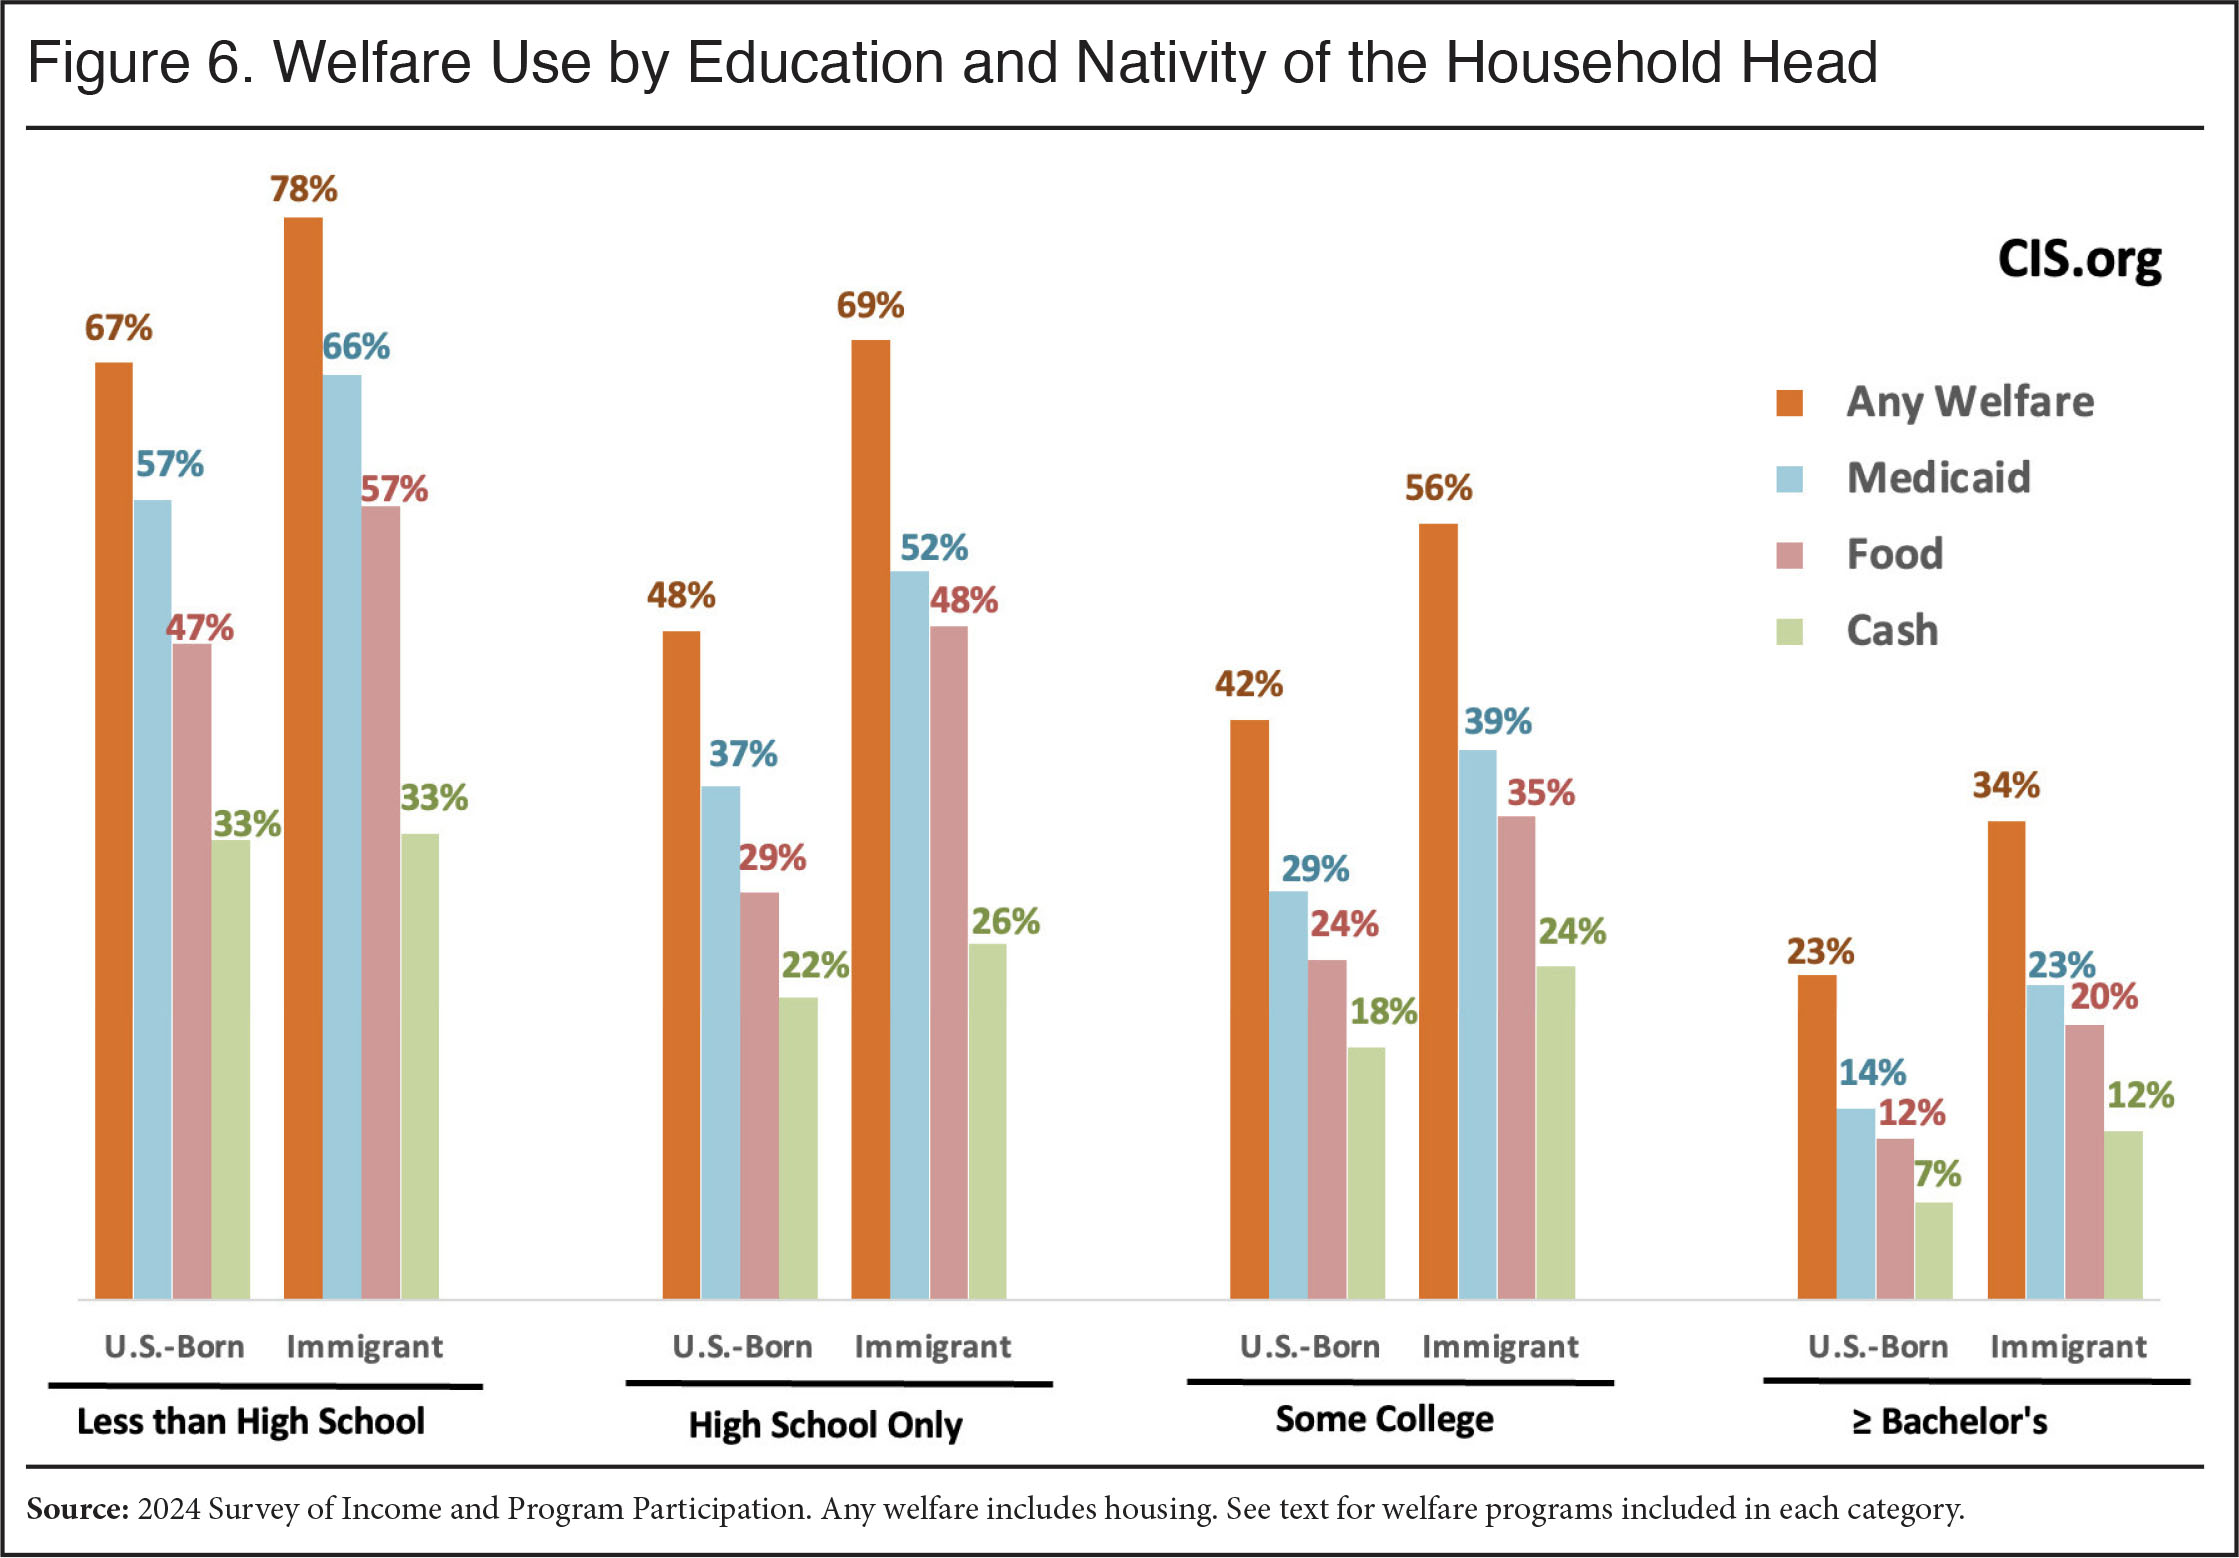 |
The second important finding in Figure 6 and Table 9 is that the share of immigrant households using at least one welfare program is higher at every level of education than for the U.S.-born with the same education. However, this is not true for all individual programs. Looking at Table 9, we see that households headed by less-educated immigrants — less than high school and high-school-only — use of welfare is higher than the U.S.-born for some programs, but lower for others, while there is no statistically significant difference for others. What is perhaps more striking, well-educated immigrant households tend to have higher welfare use overall and for almost every program than their U.S.-born counterparts. This parallels our finding that higher-income immigrant households have higher welfare use than higher-income U.S.-born households. This pattern exists for all immigrants, both naturalized citizens and non-citizen households.
Welfare Use for Working Households. Figure 7 and Table 10 report welfare use for households with one or more workers.27 The idea that work precludes welfare use is simply wrong. In fact, it is not too much to say that one of the primary goals of the American welfare system is to assist low-wage workers, particularly those with children.
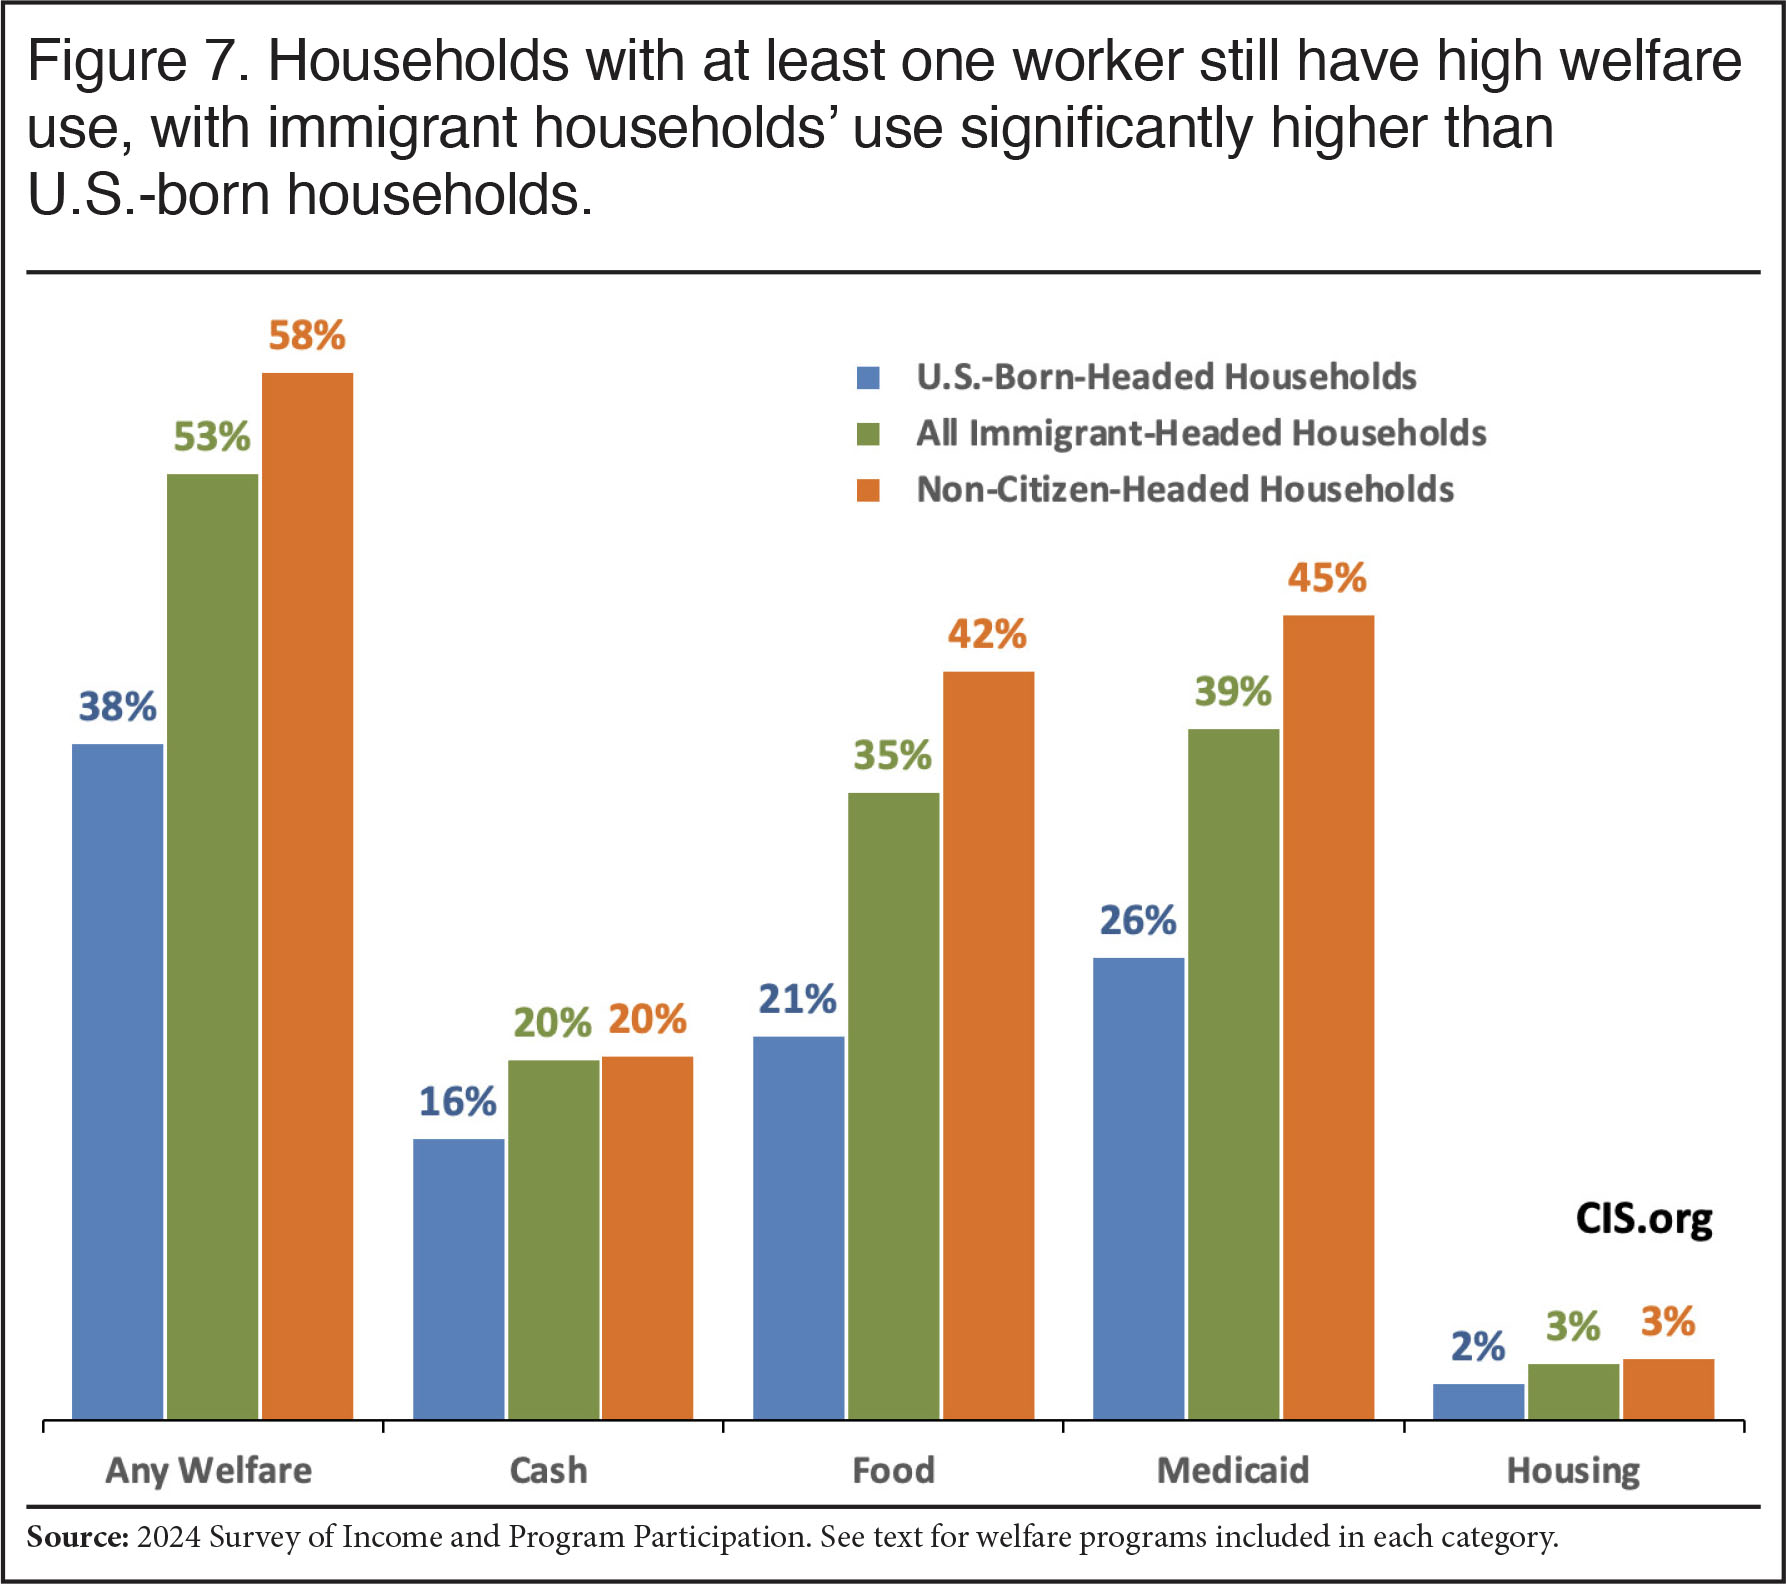 |
Table 10 shows that 52.7 percent of immigrant households with at least one worker access the welfare system, as do 37.6 percent of working U.S.-born households. In the 2024 SIPP, there was someone present who worked for at least part of the year in most households accessing the welfare system. This is the case for three-fourths of all U.S.-born households using one or more welfare programs and nearly nine out of ten immigrant households using welfare. That said, immigrant households with a worker are more likely to use welfare than working U.S.-born households for most individual programs. This is true even though immigrant households with at least one worker have 1.46 workers on average compared to 1.16 workers in U.S.-born households with at least one worker.28 The larger share of immigrant workers with lower levels of skills and education helps to explain this result.
Why Welfare Use by Working Households Matters. The fact that welfare use is so high for working households is a reminder that immigrants are not simply workers. In the 2024 SIPP, 86 percent of all immigrant households have at least one worker, compared to just 74 percent of U.S.-born households. So, immigrant-headed households are significantly more likely to be “working households”. But this fact has not prevented immigrant households from having higher welfare use rates than the U.S.-born overall. Arguing, as former President George W. Bush once did, that all that really matters is matching employers with “willing workers” is an extremely simplistic way of thinking about immigration. Immigrants are people with families and children. They have their own cultures, values, and perspectives. Their presence in the United States impacts many aspects of American society, including the welfare system.
Welfare Use by Age. Figure 8 reports the share of immigrant and U.S.-born households using one or more welfare programs based on the age of the household head. It shows that the youngest households, those with heads under age 25, have the lowest overall use of welfare. However, very few households fall into that age category, with only 3.9 percent of U.S.-born households and just 2.3 percent of foreign-born households having a head under 25. This is because most immigrants arrive after age 24 and relatively few young people (immigrant or native) have set up their own households. In general, immigrant-headed households have higher welfare use than the U.S. household at every age.
Furthermore, Figure 8 shows that, with the exception of non-citizens, welfare use tends to peak when the household head is 35 to 44 and then declines to some extent thereafter. Because use of welfare falls off more steeply for the U.S.-born as they age, immigrant-headed households have higher welfare use rates in all of the older age cohorts than the U.S.-born of the same age. Moreover, the largest gap between immigrants and the U.S.-born in overall use of welfare tends to be among households headed by those 65 and older.
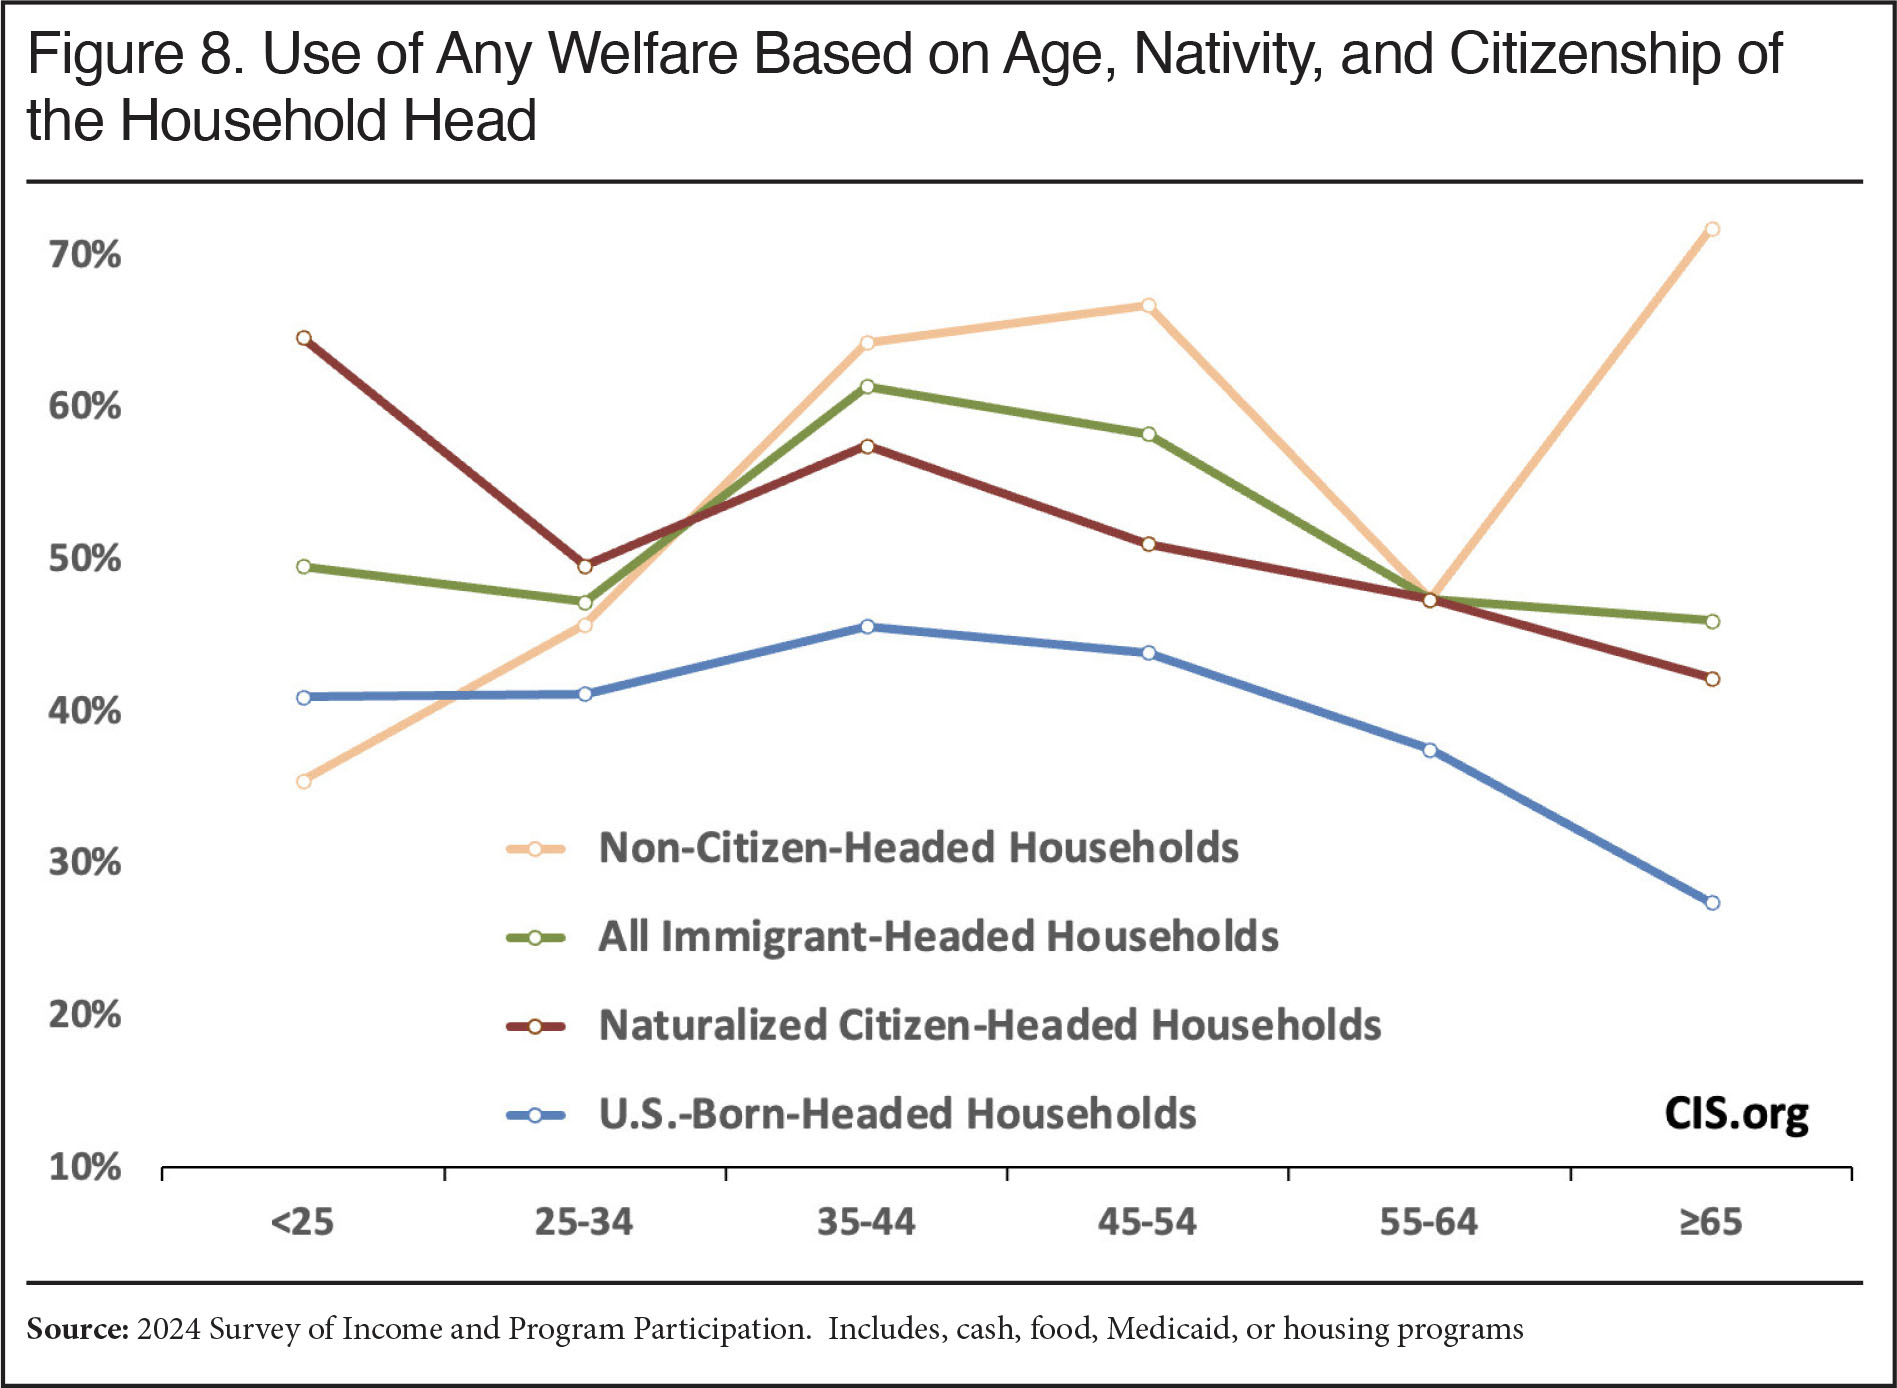 |
Table 11 reports detailed program use and significance tests by nativity, citizenship, and age of the household head. It shows that, for a few programs, non-citizen households headed by younger immigrants tend to use less welfare than the households headed by younger natives. In contrast, in the households headed by people in the older age cohorts, immigrants’ use tends to be significantly higher for most programs. In fact, when all immigrants are considered in the four age groups 35 and older, only SSI and housing are used significantly less by immigrants in some cases. Young immigrants tend to be newer arrivals for the simple reason that immigrants age over time. It seems older and more established immigrants make the most extensive use of welfare relative to older U.S.-born Americans. This is not surprising since, as immigrants age, they generally are allowed to access more welfare programs and they are more likely to have children. If those children are U.S.-born, which is true in the vast majority of cases, then they will have full welfare eligibility.
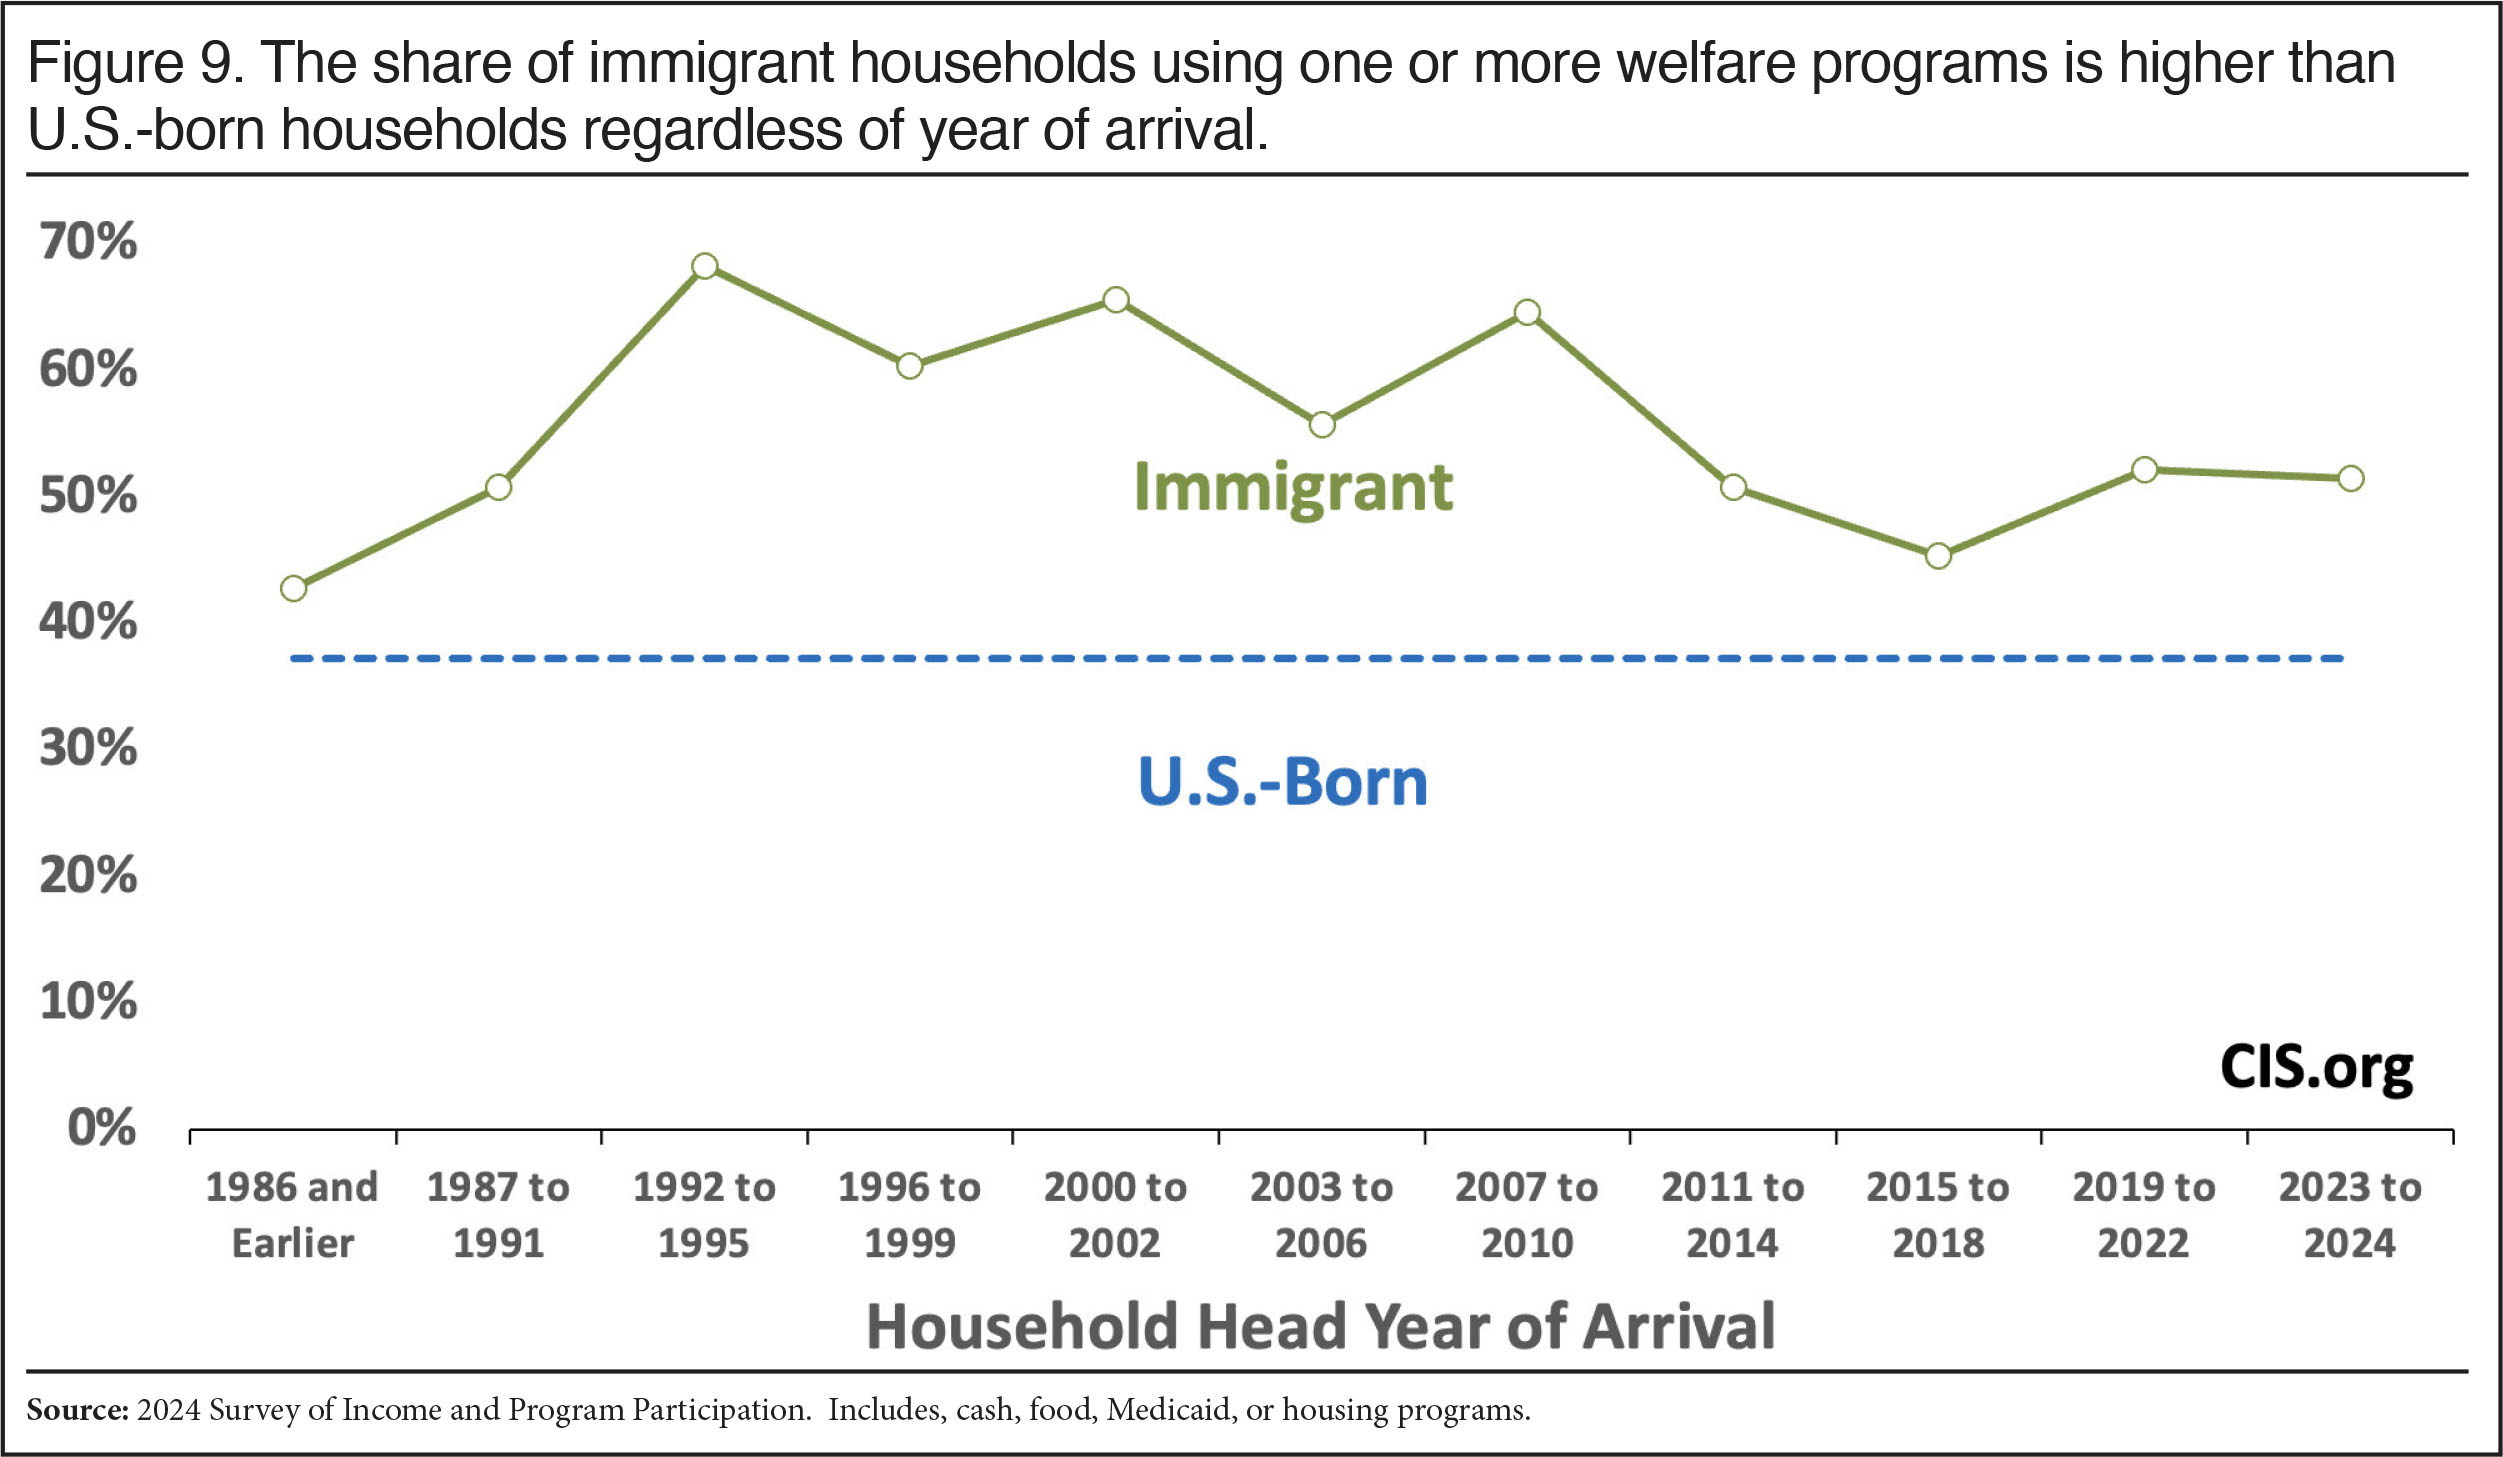
Welfare Use Based on Year of Arrival. The SIPP asks respondents the year they came to the United States to live. We can use responses to this question to explore how immigrant welfare use changes the longer they are in the country. Figure 9 shows that, in general, welfare use is surprisingly high for households headed by new arrivals. It then rises and stays higher than the U.S.-born for decades. Based on the 2024 data, it seems clear that welfare is not simply something only newcomers use, but that once immigrants adapt to life here their use still does not decline.
 |
Given the sample size of the immigrant population in the SIPP, it is not possible to divide the population by year of entry and individual programs.29 However, we are able to report in Table 12 the types of welfare programs and significance tests by year of arrival. In general, after the first few years in the country, immigrant households tend to have higher welfare use than U.S.-born households for most types of programs.
Table 13 reports detailed welfare use and significance tests for immigrant households broken out by how long the head has lived in the country: less than 10 years or 10 or more years. The first thing to note is that the vast majority of immigrant-headed households are headed by someone who has been in the country for 10 or more years — 16 million immigrant households, or 81 percent. This means that most legal immigrant households are unlikely to be impacted by the 10-year deeming requirement, which considers their sponsor's income, if they have one, when determining eligibility for some programs. The same goes for the five-year ban on some welfare programs that applies to most new non-humanitarian green card holders. Table 13 also shows that immigrant households headed by someone in the U.S. for 10 or more years have a higher welfare use rate than the U.S.-born overall for all programs except TANF. Households headed by a non-citizen in the country for less than 10 years have lower welfare use for some programs than the U.S.-born. But only about 14 percent of all immigrant households are headed by non-citizens who have been in the country for less than 10 years. These newly arrived non-citizens do not impact the overall numbers that much.
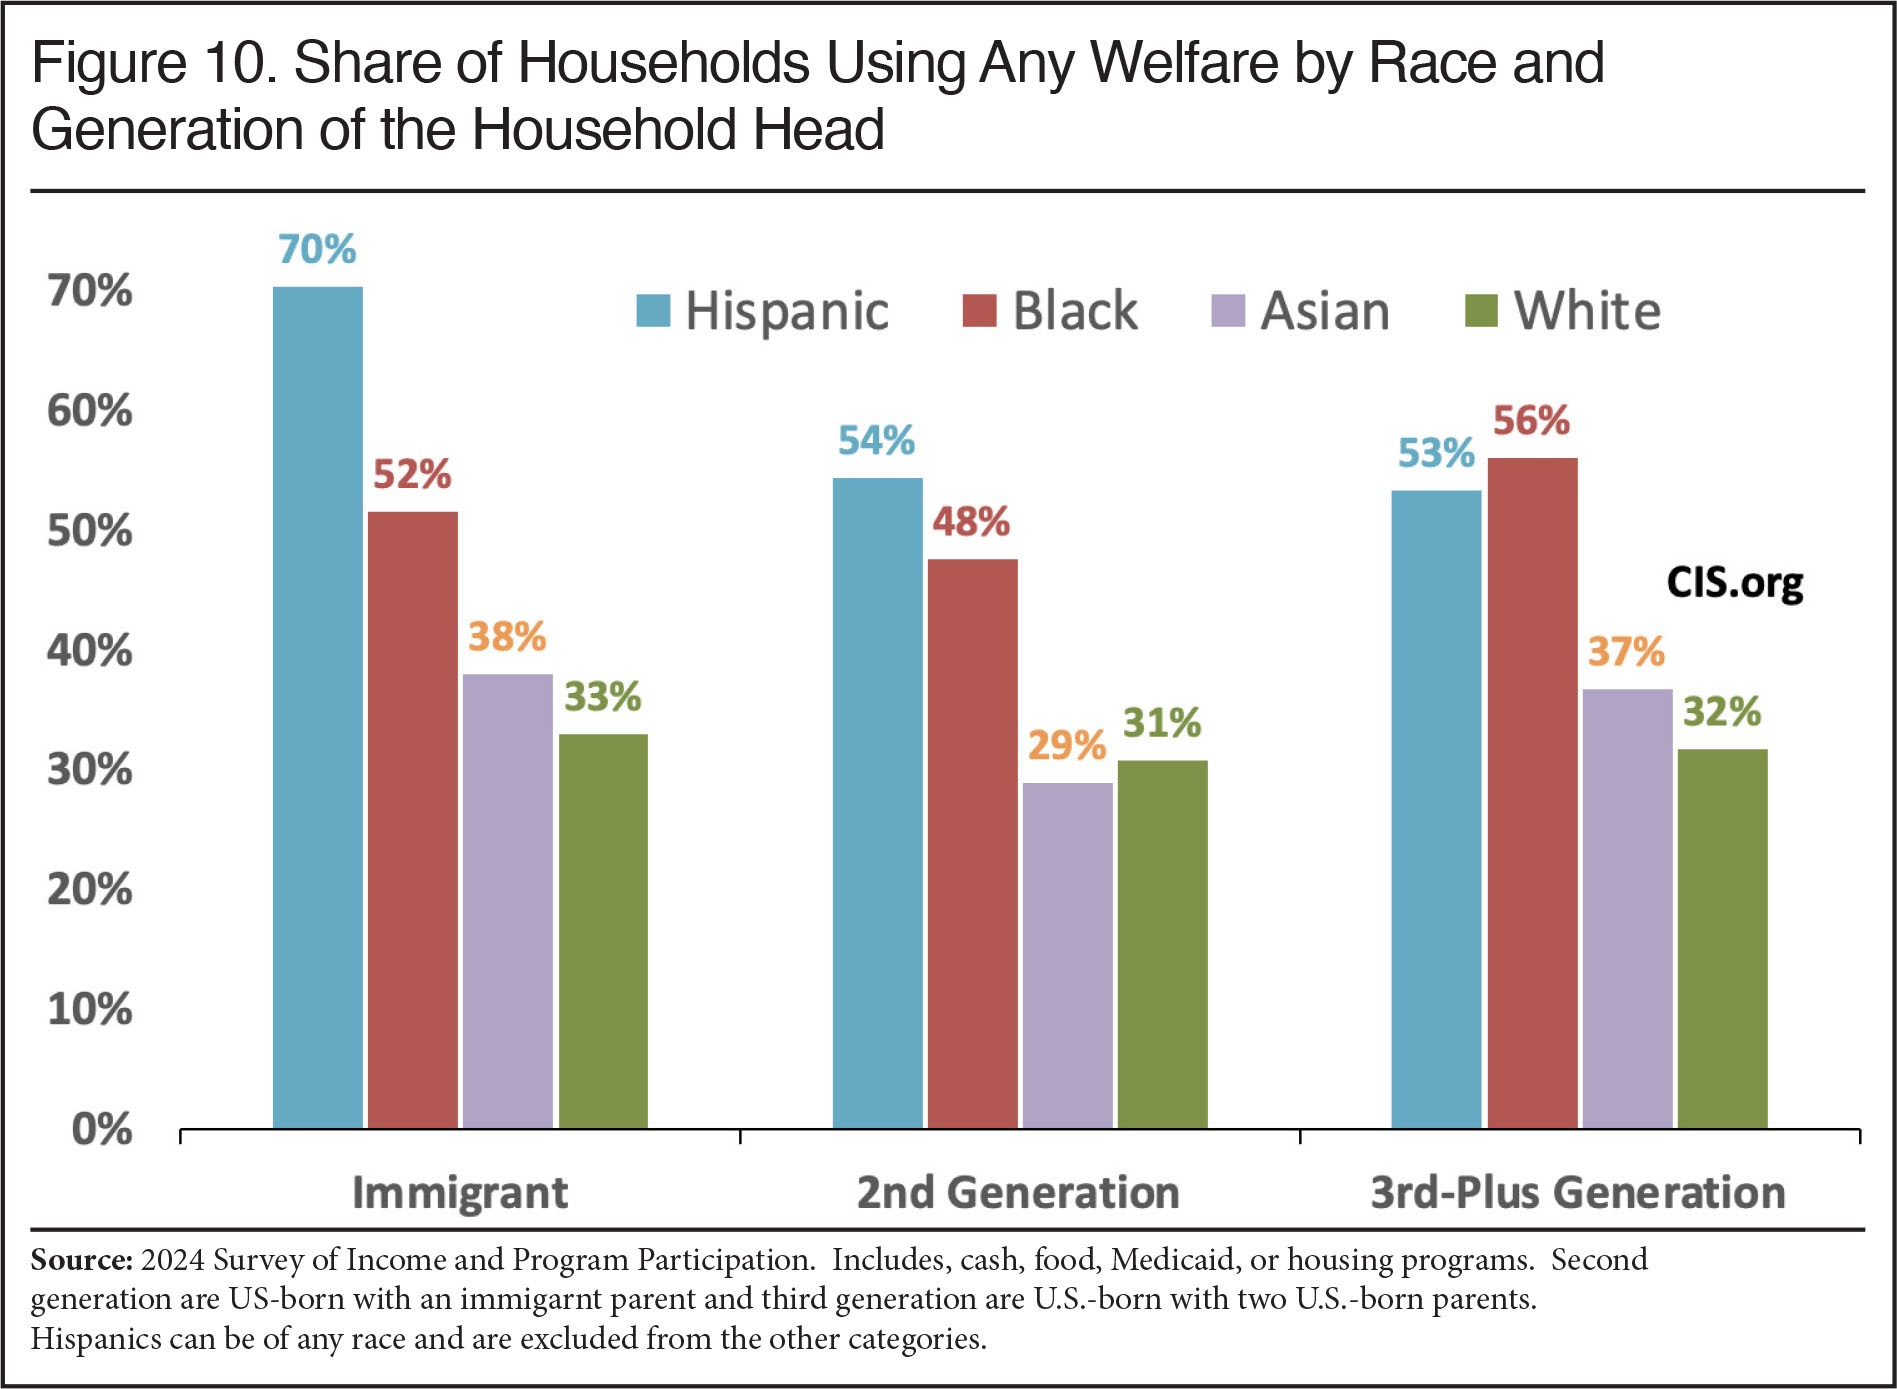
Sending Region and Race. The public-use SIPP does not release detailed information on the country of birth for immigrants. It only provides the immigrants’ home “region”, which is defined very broadly. Table 14 reports welfare use by the regions available in the SIPP. The table shows that households headed by immigrants from the Western Hemisphere and to some extent Africa tend to have the highest rates of welfare use; and those from Asia and Europe the lowest. Asian and European immigrants tend to be more educated, so it is not surprising that they have lower welfare use. Table 15 reports welfare use by race for all immigrants, non-citizens, and naturalized citizens. Figure 10 and Table 16 report welfare use by race and generation. The groups that tend to have the highest use of the welfare system as immigrants also tend to have higher rates in the second and third generation.30 However, it is important to note that the racial groups shown for the U.S.-born in Figure 10 and Table 16 are generally not the offspring of today’s immigrants, who very often are still children or too young to have set up their own households. Rather, in the vast majority of cases the parents and ancestors of the U.S.-born generations are the progeny of people who arrived decades or in some cases a century ago or longer.
 |
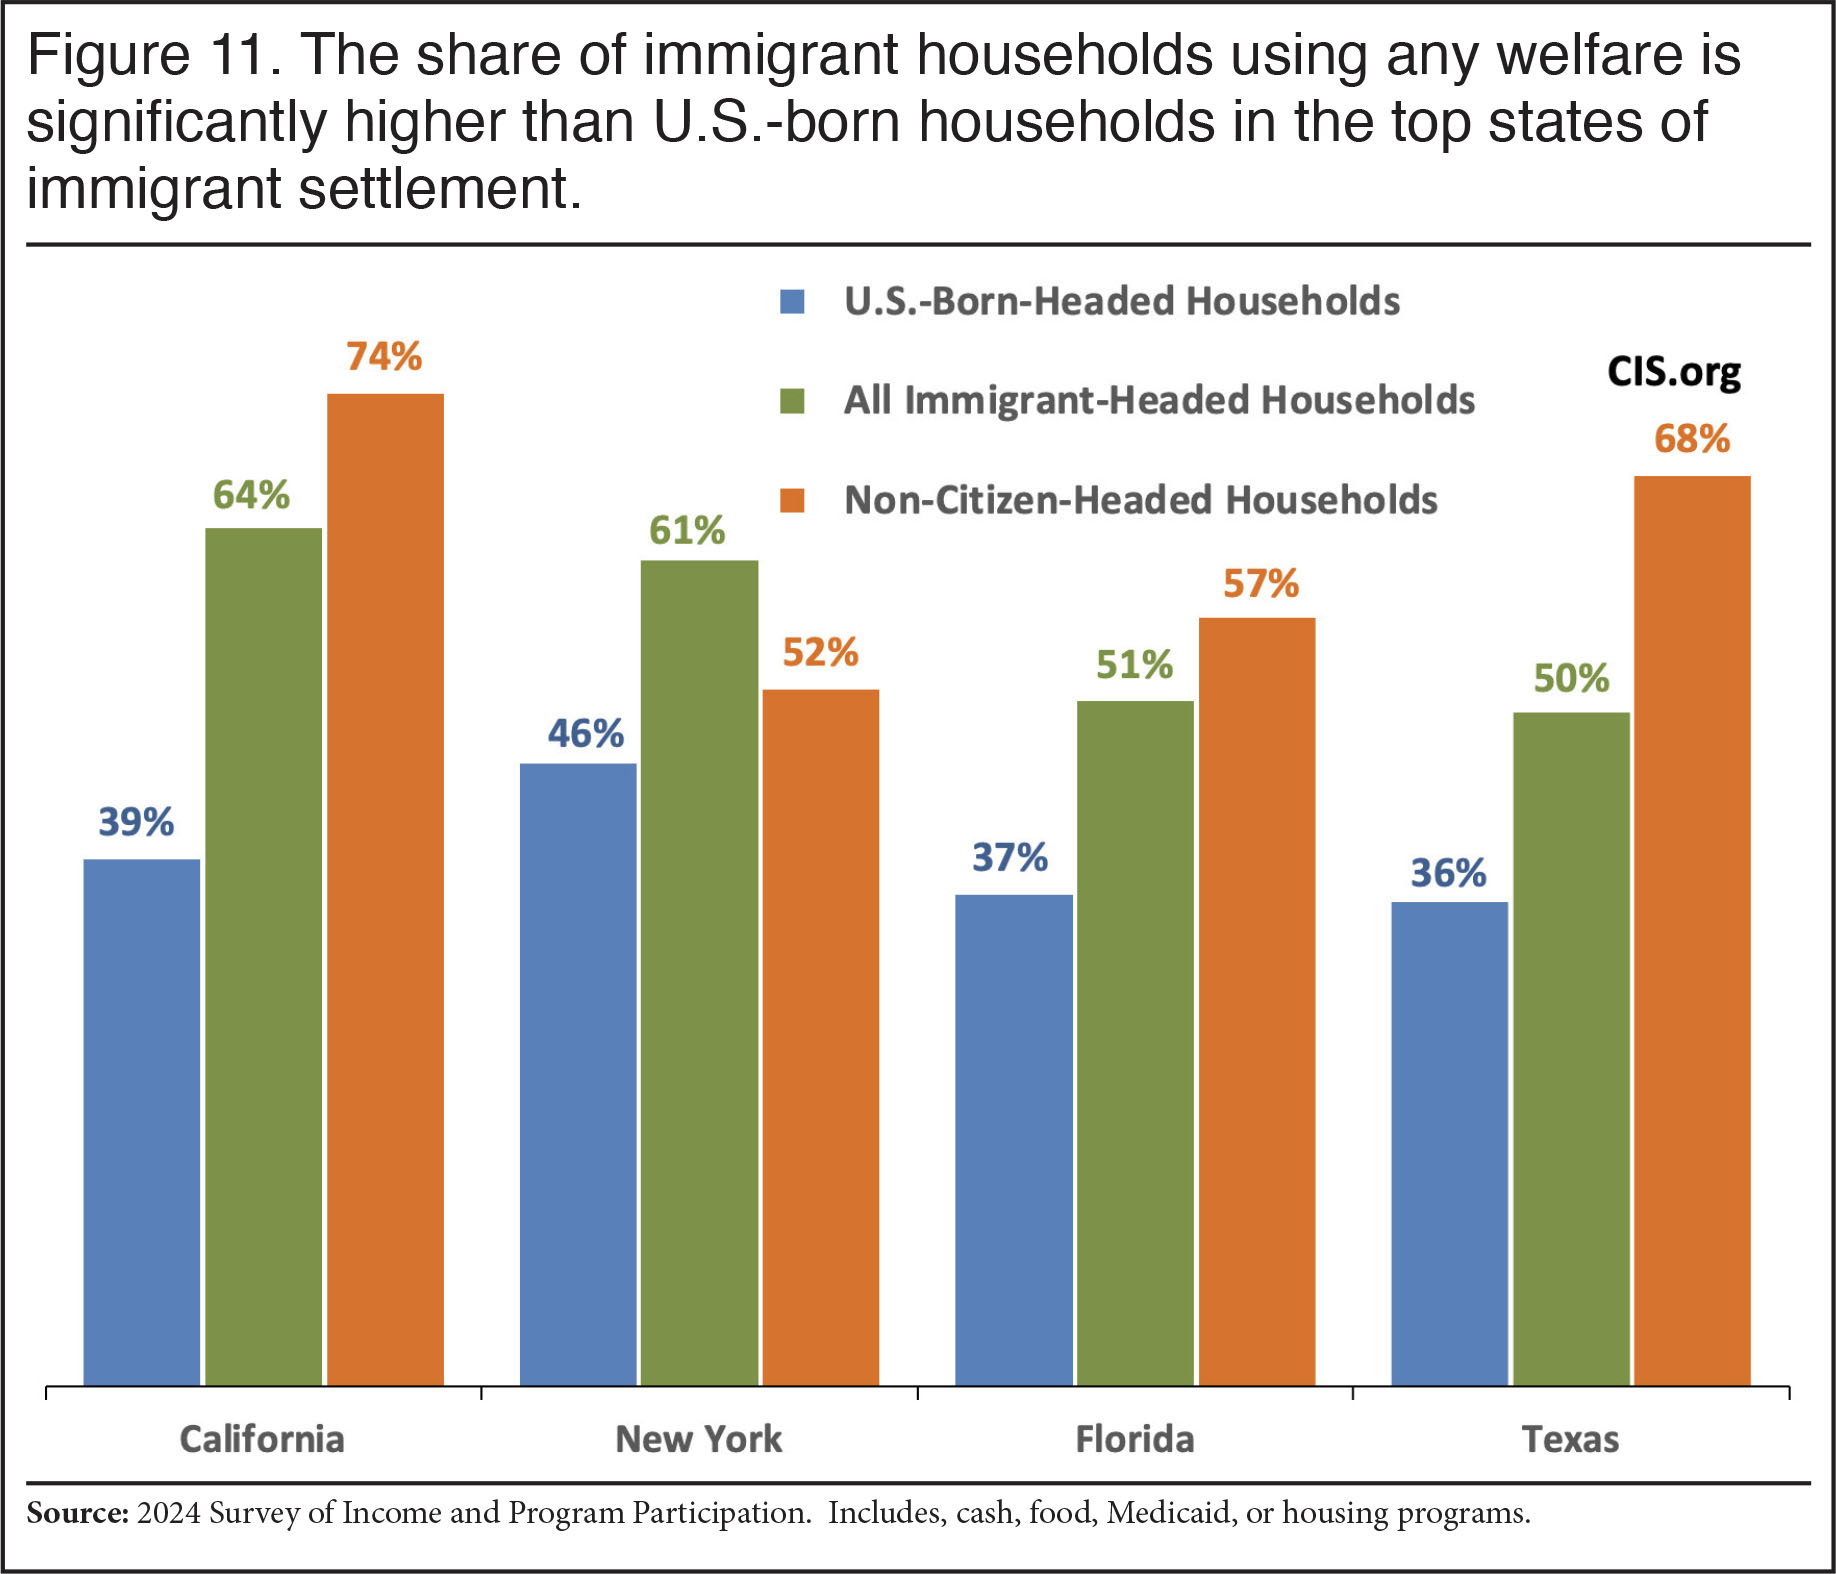
Welfare Use at the State Level. The sample size of immigrants in the SIPP makes it difficult to find statistically significant differences at the state level outside of California, particularly for individual programs. Figure 11 and Excel Tables 17 through 20 show welfare use by nativity in the four largest states. We can say that the differences with the U.S.-born and all immigrants in overall use of welfare in these four states are statistically significant. California and New York tend to have the more generous welfare systems and more permissive policies toward immigrants when it comes to program eligibility. Figure 11 shows that the U.S.-born and all immigrants in these two states tend to have higher use rates than Florida and Texas, though the overall use rate for non-citizens in Texas is quite high at 68 percent.
 |
Looking at Table 17 for California, where we can report estimates by citizenship and legal status, we see that immigrants, including legal and illegal immigrants, tend to have statistically significant higher use overall and for most programs. Table 18 for New York shows that immigrants have statistically significant higher overall welfare use and for all non-cash programs. Table 19 for Florida shows that immigrants have statistically significant higher welfare use overall and for the EITC, school meals, WIC, and Medicaid. Table 20 shows the same pattern in Texas. Variation in welfare use between states is explained in part by the different education and income profiles of immigrants across states and, as already mentioned, the relatively generosity of welfare systems, particularly for immigrants.31
Conclusion
This report uses the standard definition of welfare and examines use rates for cash, food, housing programs, and Medicaid, all of which are means-tested. We follow the common practice of reporting welfare use by household. It is sometimes asserted that immigrant welfare use must be low because most new legal immigrants as well as illegal immigrants are barred from using most welfare programs. But this analysis based on the 2024 Survey of Income and Program Participation (SIPP), which is specifically designed to measure use of government programs, shows that more than half of immigrant households use one or more major welfare programs, compared to 37 percent of households headed by the U.S.-born. We also estimate that about 61 percent of households headed by illegal immigrants access welfare, as do 51 percent of households headed by legal immigrants.
Many immigrants come to America and work, then have children, and then struggle to support them and turn to taxpayers and the welfare system for assistance.
Immigrant households can access welfare in a number of different ways. First, immigrants are able to receive benefits on behalf of U.S.-born children and the restrictions on new legal arrivals do not apply to all programs, nor do the restrictions apply to non-citizen children for some types of benefits. Furthermore, most legal immigrants have lived here long enough to qualify for welfare. A number of states also provide welfare to otherwise ineligible immigrants on their own. Finally, by naturalizing, immigrants gain full welfare eligibility. As a result of all of these factors, the restriction on immigrant use of welfare does not prevent them from making significant use of many programs.
High immigrant use of welfare is due in part to the larger share with modest levels of education and resulting low incomes. Another factor contributing to higher immigrant use of welfare is that they are more likely to have children than U.S.-born households. The vast majority of these children are U.S.-born with full welfare eligibility. Many immigrants come to America and work, then have children, and then struggle to support them and turn to taxpayers and the welfare system for assistance. Somewhat surprisingly, we also find that higher-income, better-educated, and childless immigrant households are all more likely to use welfare than their U.S.-born counterparts. It is not entirely clear why this is the case. There is research showing that foreign-educated immigrants tend to be significantly less skilled as measured by standardized tests and typically earn less than immigrants educated in the United States or natives with the same education level. This could help explain why households headed by better-educated immigrants have higher welfare use than households headed by natives with the same education level. But it would not explain why childless or higher-income immigrant households use more welfare than their U.S.-born counterparts.
One factor that does not explain immigrant households’ higher use of welfare is an unwillingness to work. In fact, immigrant households are more likely to have a worker present than households headed by the U.S.-born. But all eight major programs (SSI, TANF, EITC, school meals, WIC, SNAP, Medicaid, and housing) examined in the report can be received by workers or members of their households if incomes are low enough. By itself work does not preclude use of the welfare system. The 2024 SIPP shows that 53 percent of immigrant households with at least one worker use one or more welfare programs as do 38 percent of working U.S.-born households.
It is also the case that the presence of extended family or unrelated individuals does not explain immigrant households’ heavy use of welfare. When we look at only households comprised of nuclear families, which constitute the overwhelming majority of immigrant and U.S.-born households, the gap between the two groups remains about the same.
The high use of welfare by immigrants is important for a number of reasons. First, it shows that past efforts to prevent immigrants, including illegal immigrants, from using the welfare system have not been very effective when the totality of the welfare system is considered, though it could make some difference for specific programs. Second, immigrant welfare dependence means that current immigration is unlikely to improve the fiscal picture of the government. This is not simply because of the direct costs of the programs; it is also because those receiving welfare typically pay little to no federal income tax. All of this means that the current family-based legal immigration system, and widespread toleration of illegal immigration, is very unlikely to shore up public coffers, even though immigrants have relatively high rates of work.
If we wish to avoid high use of welfare by the foreign-born in the future, then moving to a system that selects immigrants based on their education or skills makes it much more likely they will earn higher incomes and not need welfare. Since more than one-fifth of all immigrant households using at least one welfare program are headed by an illegal immigrant, enforcing immigration laws and reducing the size of the illegal immigrant population would also be helpful in lowering future immigrant welfare use.
There is an unfortunate tendency for many to think of immigrants one-dimensionally. This is especially true in the business community, where they are seen simply as workers. But this ignores the enormous impact immigrants have on American society, including the welfare system. Given their welfare use rates, knowledge of government programs is clearly extensive in immigrant communities. Further, the social stigma surrounding these programs has largely disappeared in American society, so it should not be too surprising if that is the case also in immigrant communities. Moreover, as we have shown, use of welfare is certainly not low among households headed by the U.S.-born. Of course, if we think welfare use is too high among the U.S.-born, then it certainly creates even more urgency for having an immigration policy that does not add to this problem by allowing in people who have an even higher need for means-tested programs. To be sure, use of welfare is only one facet of immigration. But the impact immigrants are having on the welfare system and public coffers at least needs to be part of the immigration debate.
Appendix: Estimating Illegal Immigrants in the SIPP
Based on our estimates of illegal immigrants in the monthly Current Population Survey (CPS), we believe that the total illegal immigrant population in mid-2024 in the monthly CPS was 13.8 million. This figure is unadjusted for undercount. We use this number to estimate illegal immigrants in the 2024 SIPP. The SIPP and CPS use similar weighting schemes, but the surveys cover different population universes. Since there is no body of research on the SIPP vs. the CPS coverage of illegal immigrants, we assume that the ratio of illegal immigrants in the two surveys is the same as the ratio of non-citizen, post-1980 Hispanics, a population that significantly overlaps with illegal immigrants. The ratio is .75 when the 2024 mid-year CPS data is compared to the 2024 SIPP. Our analysis therefore assumes that there is a weighted count of 10.35 million illegal immigrants in the 2024 SIPP (13.8 million times 0.75). It is not clear why the foreign-born population is smaller in the SIPP than other Census Bureau Surveys such as the CPS.32
To determine which SIPP respondents are most likely to be illegal aliens, we first exclude immigrant respondents who are almost certainly not illegal aliens — for example, spouses of native-born citizens; veterans; adults who receive direct welfare payments from SSI and TANF; people who have government jobs; Cubans (because of special rules for that country); immigrants who arrived before 1981 (because the 1986 amnesty should have already covered them) or they arrived after age 59; people in certain occupations requiring licensing, screening, or a government background check (e.g., doctors, pharmacists, and law enforcement); people likely to be on student visas, and workers who earned more than $150,000 in the past year.
The remaining candidates are weighted to replicate known characteristics of the illegal population (age, gender, continent of origin, certain states of residence, and length of residence in the United States). CIS has previously used the Department of Homeland Security (DHS) as the source of those known characteristics; however, DHS’s most recent estimates are only through January 2022. The Center for Migration Studies (CMS) has the most detailed socio-demographic profile estimates of the illegal population, which represents this population through 2023. The resulting illegal population, which consists of a weighted set of SIPP respondents, is designed to match CMS on the known characteristics listed above, as well as education. The total size of the population, however, is controlled to our 10.35 million estimate of illegal immigrants in the SIPP.
End Notes
1 The term “immigrant” has a specific meaning in U.S. immigration law, which is all those inspected and admitted as lawful permanent residents (green card holders). In this analysis, we use the term “immigrant” in the non-technical sense to mean all those who were not U.S. citizens at birth.
2 The Census Bureau website states that “unauthorized migrants are implicitly included in the Census Bureau estimates of the total foreign-born population”. For the SIPP in particular, the bureau states in its Source and Accuracy statement for the survey that the sample used to weight the SIPP specifically includes unauthorized migration.
3 State-sponsored general assistance (GA) cash programs are relatively small and are also included in our analysis under cash programs, though figures are not reported separately for GA, which only a very small share of immigrant or U.S.-born households use.
4 The public-use Current Population Survey Annual Social and Economic Supplement (CPS ASEC) shows that, of immigrant households that receive at least one of these welfare programs, 65 percent paid no federal income tax in 2024. Further, the average federal tax liability for households using a welfare program is just 5 percent of those not using one of these programs. We use the CPS ASEC because it includes estimated federal income tax payments, though it does not measure welfare as well as the SIPP, which does not include tax payment estimates. Also, because there are some schools where all children receive free school lunch, even if they come from higher-income households, we exclude the free and reduced priced school lunch/breakfast program from the above estimate.
5 To the best of our knowledge, there are no up-to-date estimates of the total population of refugees, those formally granted asylum, and other smaller categories admitted for “humanitarian” reasons living in the United States. However, some 3.6 million refugees have been settled in the United States since 1975. Adding those formally granted asylum and other categories brings that number closer to four million over the last five decades. Making reasonable assumptions about mortality and emigration, it is likely the total number of immigrants who had been admitted for humanitarian reasons living in the country is somewhat more than three million in 2024. Assuming a total immigrant population of 51.6 million in the middle of 2024 would mean about 6 percent of the total foreign-born population were humanitarian immigrants. Of course this is only a rough estimate, but it seems certain that this population could not be dramatically larger or smaller than 6 percent of all immigrants. (This estimate does not include those with pending asylum claims, parolees, or others with TPS or DACA). There is good evidence that humanitarian immigrants, especially recent arrivals, make extensive use of the welfare system. It is therefore certainly reasonable to argue that non-humanitarian immigrants should have very low rates of welfare use to offset costs created by refugees, asylees, and the like.
6 We have not attempted to estimate the non-immigrant population in the SIPP; however, like other Census Bureau surveys, some number must be captured by the SIPP.
7 Unlike other programs reported in the SIPP, respondents are asked about use of the EITC “for the tax year preceding the reference period”. In the 2024 SIPP, the reference period is 2023 (January to December); however, for the EITC, the survey is measuring use in 2022. This is done because people typically need to file their income tax return to know if they are eligible for the program. This has the effect that a few households in the SIPP that have no workers during the reference period can still be reported as having received the EITC.
8 While technically there is a work requirement for TANF, numerous exceptions exist, which differ from state to state. The exceptions can include, but are not limited to, the following: the child is under one year of age; the child is under age six and the parent(s) are unable to obtain child care; the parent(s) are disabled; the parent(s) need to care for someone else in the household; the child’s guardian is over 60; the parent(s) need treatment for drug or alcohol use; or the child’s mother is pregnant. None of this applies to the EITC, which simply requires income from earnings without exception.
9 It is worth pointing out that, as we will discuss later in this report, most households that access welfare programs — immigrant and U.S.-born — have at least one worker. So, the idea that working and use of welfare are separate is itself incorrect.
10 The Census Bureau reports use of many welfare programs by household. The National Research Council 1997 study also included a household-level analysis in its fiscal estimates because "the household is the primary unit through which public services are consumed". The Census Bureau in more than one study, also reported use of social services by household. The Heritage Foundation used households as the unit of analysis in their study as well. The late Julian Simon of the Cato Institute, himself a strong immigration advocate, also argued that it did not make sense to examine individuals when looking at the fiscal impact of immigrants. He observed that, "One important reason for not focusing on individuals is that it is on the basis of family needs that public welfare, Aid to Families with Dependent Children (AFDC), and similar transfers are received." For this reason, Simon examined families, not individuals. While not exactly the same as households, as Simon also observed, the household "in most cases" is "identical with the family". Another reason to look at households is that some of the welfare variables in the SIPP are reported at the household level.
11 On average, nuclear family immigrant households have 2.7 members, compared to 2.2 members in U.S.-born nuclear-family households. This larger size reflects in part the fact that immigrants tend to have more children on average.
12 The SIPP attempts to capture the entire civilian non-institutionalized U.S. population, and some long-term temporary visa holders should also be among the legal immigrant population — mainly guestworkers and foreign students.
13 Tests of statistical significance are only based on the weighted sample size and the other properties of the SIPP. It must be remembered that legal status, unlike being foreign-born in general or a non-citizen, is an imputed value by CIS, which means it has added uncertainty. The significance tests do not account for the added uncertainty of our imputed value.
14 The eligibility of the U.S.-born children of illegal immigrants extends even to housing. HUD’s handbook covering regulations states that if at least one member of a family is eligible (e.g., a U.S.-born child), then the family can live in federally subsidized housing, though they may receive prorated assistance. New York City has a similar rule for its own housing programs.
15 A good recent example of this is California’s expansion of Medicaid access to low-income illegal immigrants 50 and older. The state also covers all income-eligible young adults as well. In New York State, illegal immigrant adults with DACA can also be enrolled in Medicaid.
16 These states generally administer the program using the same bureaucracy as that used for SNAP, though the benefit itself is technically not SNAP, but rather a state-funded equivalent program.
17 Based on administrative data, we estimated in 2021 that there were roughly two million illegal immigrants with work authorization and valid Social Security numbers (SSNs), which allows receipt of the EITC. Since 2021, the administration has further expanded work authorizations to illegal immigrants with the recent influx of asylum applicants. Reviewing quarterly application and petition data from USCIS, it seems likely that the total number of illegal immigrants with work authorization has risen to three million. However, more analysis would be necessary to confirm this figure. Prior research by the Social Security Administration also estimated that some 700,000 illegal immigrants use stolen SSNs. It is simply unclear if such individuals would be detected and prevented from receiving the EITC by the IRS.
18 For more discussion of which individuals are included in all prior estimates of illegal immigrants, see this 2025 publication by the Center for Immigration Studies.
19 The Center for Migration Studies estimates that in 2023 just under two-thirds of illegal immigrants had no education beyond high school.
20 We can do this calculation rather simply by assuming that the roughly 2.5 million illegal-immigrant-headed households using at least one welfare program are all actually legal-immigrant-headed households so that there are a total of about 18.3 million legal-immigrant-headed households with nearly 10.5 million of them using one or more welfare programs.
21 These figures are based on the poverty status of the household head.
22 It should be noted that there are differences depending on the presence of children, if the household head is 65 and older, or if the family resides in Alaska or Hawaii.
23 One of the more common ways a person could be on welfare in the higher-income households, even a nuclear-family-only household, is if the household head has an unmarried partner or adult child whose income and expenses were reported separately when they applied for benefits. This could allow them to receive Medicaid, SSI, EITC, and even WIC if they are pregnant. This should not happen for programs such as SNAP or housing because eligibility for these programs is generally based on household income, not family or individual income. Among the less common ways a higher-income household can have a person or persons on welfare include the following: In the SIPP person(s) can join a household during the year. If that person used welfare prior to joining the household, it would still count as welfare use by someone in the household during that year. Further, the poverty status in the SIPP we use for our analysis reflects annual income. If a household’s income was much lower for part of the year, then it is possible that individuals in a household could have qualified for welfare at that time, even though the household’s total income by the end of the year was much higher. Moreover, while the free and subsidized school lunch and breakfast program is normally linked to income, there are some schools where all students receive free meals and this probably explains much of the use of this particular program for high-income households. Additionally, foster children can sometimes retain their welfare eligibility for Medicaid, and other programs without regard to their parents’ income, though households with foster children are not included in our nuclear family households as these children are unrelated to the head. In some circumstances, even after adoption special-needs children can continue to receive Medicaid under an adoption assistance agreement (Title IV-E), without regard to the adoptive parents’ income. Adopted children would be included in our nuclear-family-only households. In addition, premature babies can be enrolled for Medicaid in many states, often as secondary insurance, without their parents meeting strict income requirements. Finally, it is possible the SIPP is picking up some fraudulent use of welfare, but we have no evidence for this. It is more likely that there could be some coding errors in the data.
24 Table 7 does show a few childless households with use of TANF, WIC, or school meals, which should not be possible. Assuming there are no coding errors in the data, this rare circumstance arises in the SIPP if a child lived in the household at some point during the year and received these programs but was not living there at the beginning of the year, which is when we measure if there is a child present. Also, a pregnant woman on WIC, who has no other children, would constitute a household without children using the WIC program. But use of TANF, WIC, and school meals combined totals less than 1 percent in the table and has no meaningful impact on the overall results.
25 Calculating educational attainment by legal status is not really possible given that we use education as one of our parameters to determine legal status. See the appendix for a discussion of our methods for determining the legal status of SIPP respondents.
26 Among immigrants with only a high school education, the research shows that, 51 percent are foreign-educated and for those with a bachelor’s it is 47 percent.
27 This is defined in the SIPP as someone in the household working at least one month during the year who had that job for the entire month and worked all weeks.
28 It should be pointed out that, overall and for a few programs, working households actually have higher welfare use than households without a worker. While this may seem strange, one reason for this is that non-working households tend to be comprised of retirees and as such have access to Social Security, retirement accounts, and pensions, which can give them income that is too high to qualify for welfare. Moreover, such households typically have no children, which also makes a large difference in welfare use. The EITC is also a program that requires earned income.
29 The SIPP asks individuals the year they came to the U.S., but then recodes the responses in multi-year cohorts, primarily to preserve anonymity. So, for example, the most recent cohort in the 2024 data is those who came in 2023 and 2024, then 2019 and 2022, and so on, back to the mid-1980s when they are grouped into larger arriving cohorts by the Census Bureau. However, the number of immigrant households that fall into these groups is not very large. For this reason, in Figure 9 and Table 12 we group them into larger multi-year arrival cohorts to obtain more statistically robust results.
30 It should be noted that the third generation represents all those who have two U.S.-born parents, and not only includes the third generation (who have immigrant grandparents) but all those in the third generation and beyond.
31 If we look at the education level of immigrants at the state level using the SIPP it shows that California has the largest gap between immigrants and the U.S.-born. Of persons 25 and older, 43.2 percent of immigrants in the Golden State have no education beyond high school, compared to 21.1 percent of the U.S.-born — a 22 percentage-point difference. But in the other three states the gap is between 8 percent and 15 percent, so California is somewhat of an outlier in this regard. New York immigrants, with their relatively high welfare use, are not dramatically less educated than immigrants in other states. Nor are they particularly less educated relative to natives. Differences in education levels, and other measures of social capital across states, likely do explain some of the differences in welfare use. However, the way welfare is administered in each state, specifically immigrant eligibility, almost certainly accounts for a good deal of the variation in program use by immigrants, both in absolute terms and relative to the U.S.-born.
32 There appears to be some coding error or other problem in the SIPP relative to the CPS and the American Community Survey (ACS) when it comes to estimating the number of people born abroad to American parents. The total foreign-born population is 9.4 million smaller in the SIPP relative to the July 2024 CPS and 8.6 million smaller than in the 2024 ACS, which also reflects the population of the country on July 1. This issue also exists in prior years of the SIPP. The reason for this is almost certainly related to an overcount in the SIPP of persons born aboard to American parents, who are considered part of the U.S.-born population. The 2024 SIPP shows 12.8 million of these individuals, while the July 2024 CPS shows 2.7 million and the 2024 ACS shows 3.8 million. It seems likely that some number of foreign-born individuals are being miscoded in the SIPP as U.S.-born persons born to American parents who were living abroad. We did reweight the foreign-born population and attempt to re-distribute those born abroad to American parents in the SIPP so that the count lines up with the CPS and ACS based on race and Hispanic origin. But we did not find that it made any meaningful difference to the welfare-use rate for the foreign- or U.S.-born, so we left the SIPP data unchanged and simply report welfare use for immigrants and the U.S.-born as it appears in the survey. Reassigning those born abroad to the foreign-born population did, however, increase the number of immigrant households significantly and as a result it also significantly adds to the number of immigrant households using welfare, just not the percentage. The implausibly large size of the population born abroad to American parents in the SIPP is clearly an area in need of further investigation.