The foreign-born or immigrant population (legal and illegal) hit new record highs in March 2024 of 51.6 million and 15.6 percent of the total U.S. population. Since March 2022 the foreign-born population has increased 5.1 million, the largest two-year increase in American history. The foreign-born population has never grown this much this fast. Although many think of immigrants only as workers, less than half of those who arrived since 2022 are employed. This analysis is based on the government’s monthly Current Population Survey (CPS), which like any survey has a margin of error, so there are fluctuations in the data. But the increase in the last two years is unlike anything seen before and is statistically significant.
Among the findings:
- In March 2024 the foreign-born population reached 51.6 million, 5.1 million more than in March 2022 — the largest two-year increase ever recorded in American History.
- The 51.6 million foreign-born residents in March of this year were 15.6 percent of the total U.S. population, also record highs in American history.
- Since President Biden took office in January 2021 the foreign-born population has increased by 6.6 million in just 39 months.
- We have previously estimated that nearly 58 percent of the increase under President Biden is due to illegal immigration.
- If present trends continue, the foreign-born population will reach 62.5 million in 2030 and 82.2 million by 2040 — larger than the current combined populations of 30 states plus the District of Columbia.
- Many observers think of immigrants solely as workers, but only 46 percent of the foreign-born who arrived in 2022 or later were employed in the first part of 2024 — similar to the share of new arrivals employed during previous economic expansions.
- As in any human population, many newly arrived immigrants are children, elderly, disabled, caregivers, or others with no ability to work or interest in doing so.
- Only about 8 percent of the 2.5 million new arrivals who are not working say they are actively looking for work.
- The dramatic recent increases in the size of the foreign-born population represent net growth. The number of new arrivals was much higher but was offset by outmigration and natural mortality among the foreign-born already here.
- There also is some undercount in this data, so the actual number of foreign residents in the United States is larger.
Introduction
This report is part of a series of recent reports from the Center looking at the size and growth of the foreign-born population in the monthly Current Population Survey (CPS), sometimes referred to as the “household survey”. The CPS is collected each month by the Census Bureau for the Bureau of Labor Statistics (BLS).1 While the larger American Community Survey (ACS) is often used to study the foreign-born, the most recent version of the ACS reflects only the population through July 2022 and is now 20 months out of date. It does not fully reflect the ongoing border crisis and resulting surge in immigration. The monthly CPS allows for a much more up-to-date picture of what is happening. In the Appendix of a prior analysis we discuss the ACS compared to the CPS.
We use the terms “immigrant” and “foreign-born” interchangeably in this report.2 The foreign-born as defined by the Census Bureau includes all persons who were not U.S. citizens at birth — mainly naturalized citizens, lawful permanent residents, long-term temporary visitors, and illegal immigrants. While the monthly CPS is a very large survey of about 130,000 individuals, the total foreign-born population in the data still has a margin of error of ±573,000 in March 2024 using a 90 percent confidence level. This means there is fluctuation from month to month in the size of this population, making it necessary to compare longer periods of time when trying to determine trends.3
Growth in the Foreign-Born Population
Recent Increase. Figure 1 reports the total number of foreign-born residents in the United States from March 2019 to March 2024. The figure shows that even though the economy was expanding in the months before the pandemic, the foreign-born population was trending down in the latter part of 2019. Once travel restrictions were imposed and Title 42 was implemented at the border, the immigrant population declined through the middle of 2020, hitting a low of 43.8 million in August and September of that year. While immigrants still arrived in 2020, out-migration and natural mortality seem to have been enough to cause a decline in the total immigrant population. However, some of the decline may be due to the difficulty of collecting data on a hard-to-capture population like the foreign-born.4 For this reason, in the discussion that follows we focus on comparing growth from 2021 to 2024 and the years in between. We do not use 2020 as a point of reference.
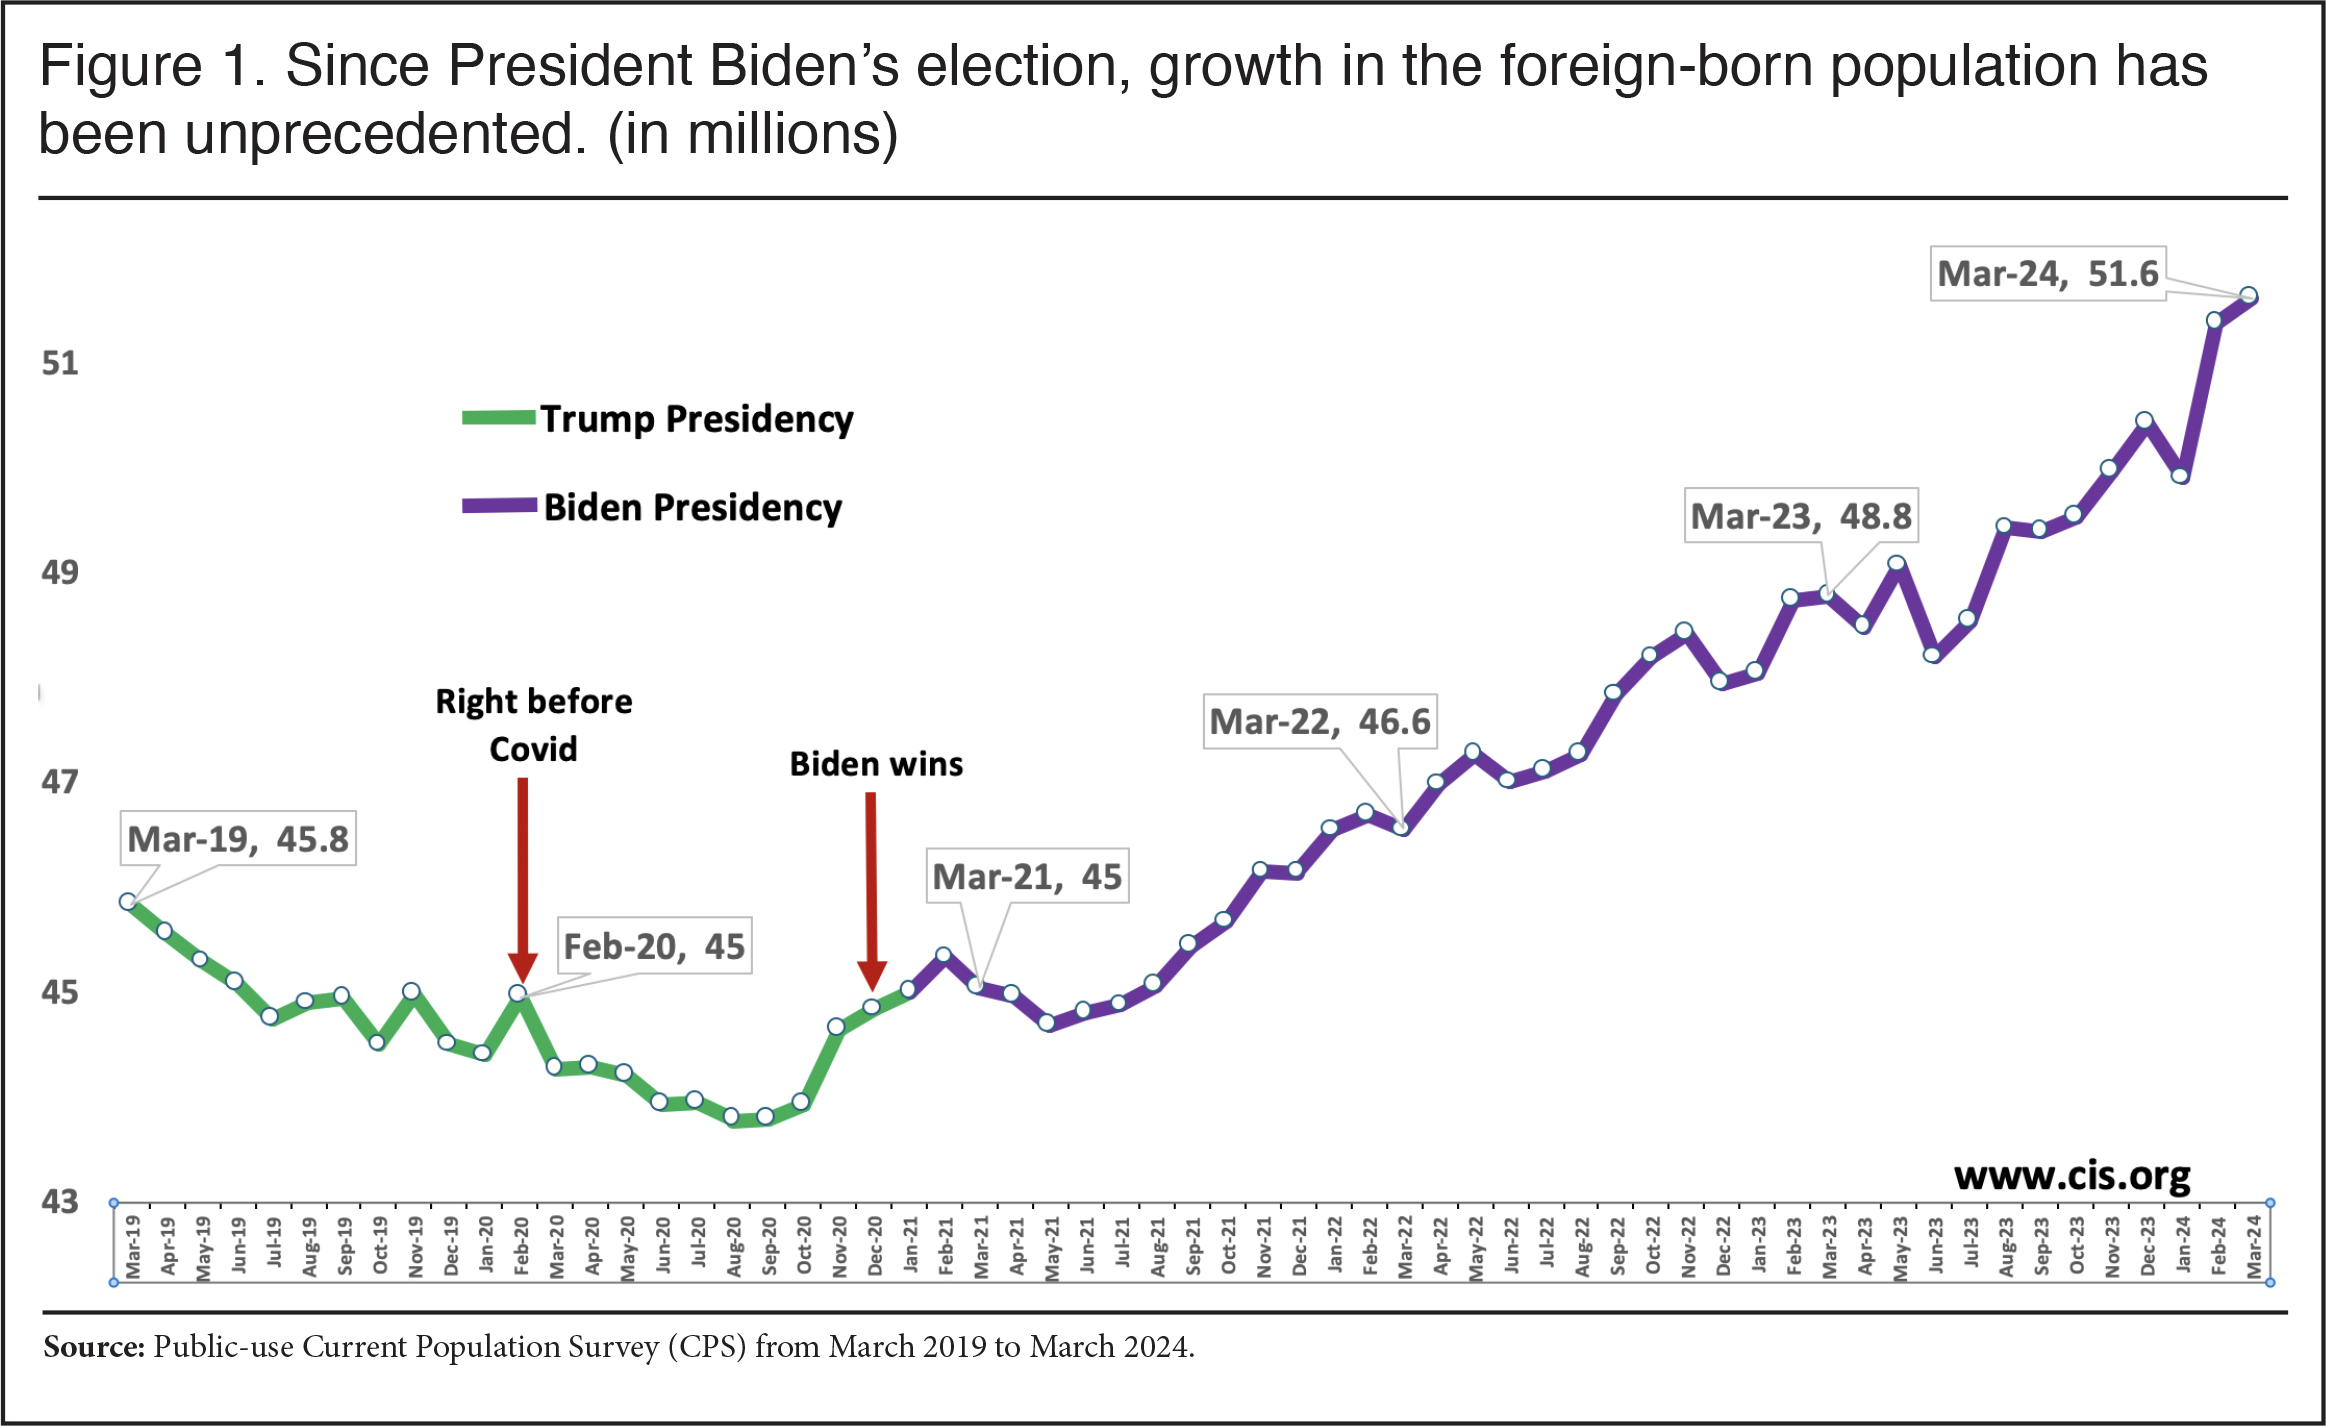 |
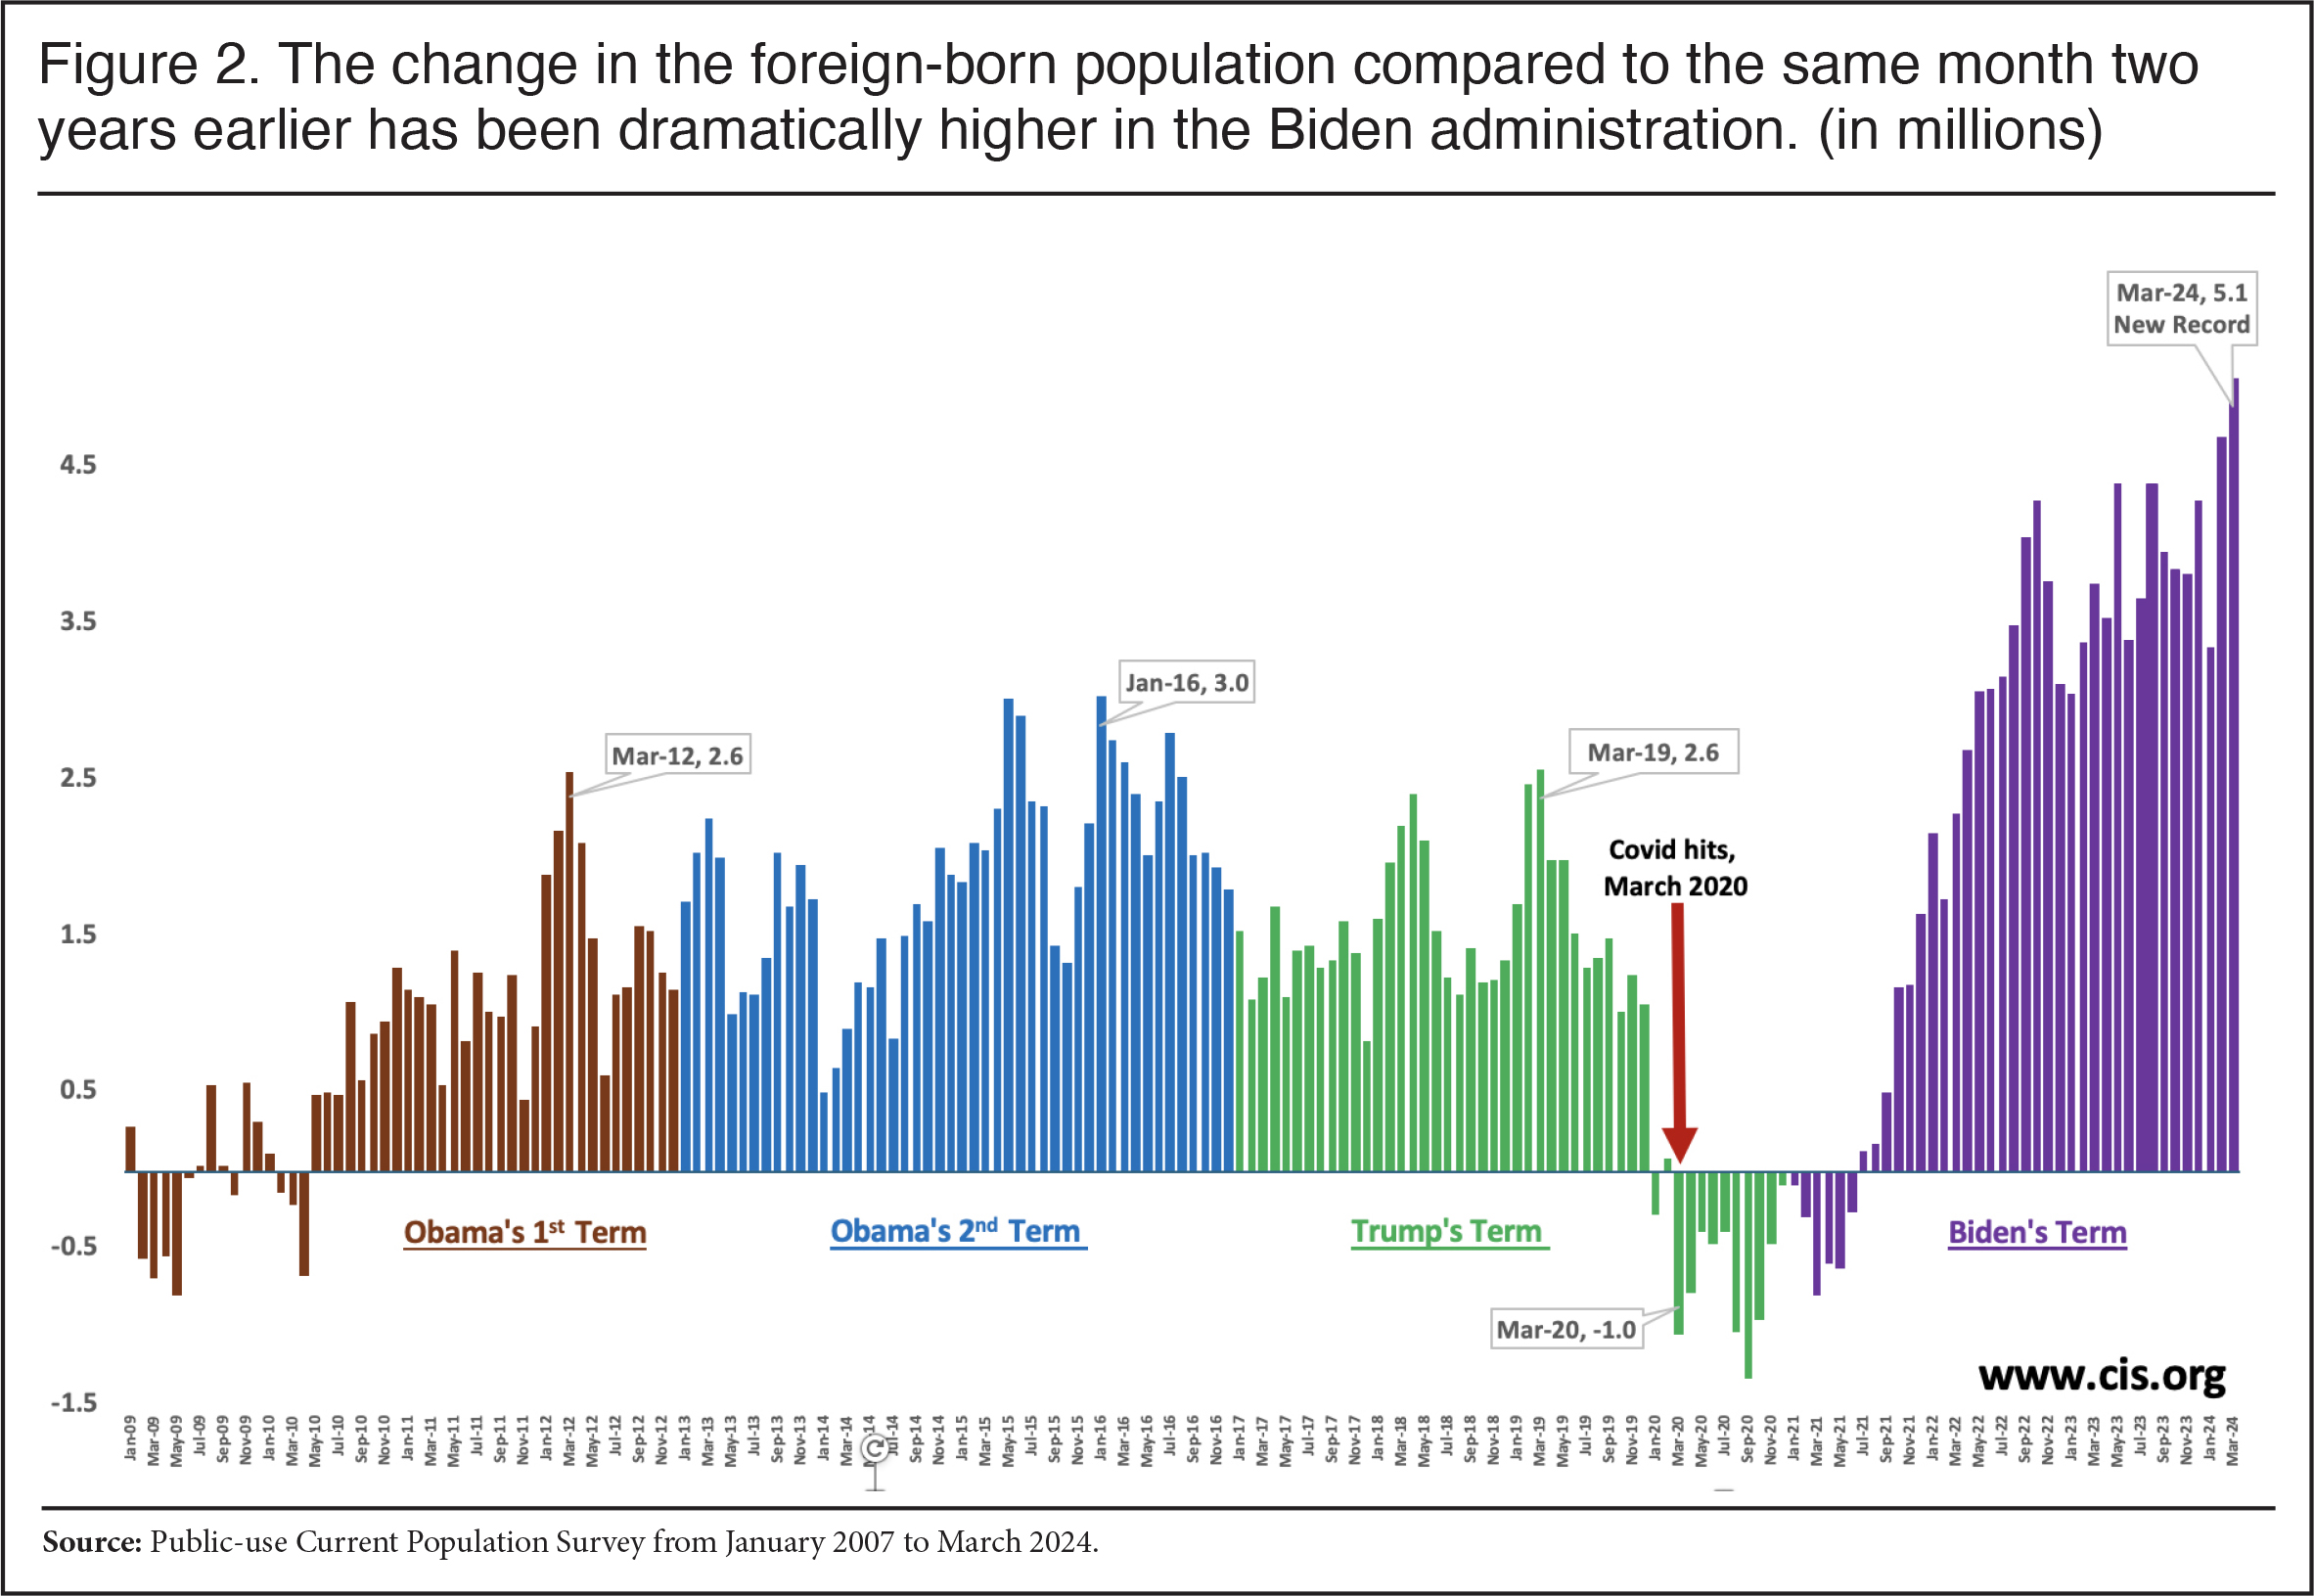
Growth in the Foreign-Born Population under Biden. By January 2021 the foreign-born population had roughly returned to the size it was in February 2020, right before Covid. Comparing President Biden’s first month in office, January 2021, to March 2024, the most recent data available, shows an increase of 6.6 million. This increase in just 39 months is unprecedented.5 It is roughly equal to the growth in the foreign-born population in the nine years prior to Covid. Figure 2 shows the increase in the foreign-born population, comparing each month to the same month two years earlier. The foreign-born population increased 5.1 million from March 2022 to March 2024. Although the CPS did not identify immigrants until 1994, information in prior censuses and administrative data make clear the numerical increase in the last two years is larger than in any two-year period in American history.6 It is also the case that the 2.8 million increase in just the last year is the largest increase in 25 years and may also be the largest one-year increase in the foreign-born population ever.7
 |
What is so striking about all the recent increases is that they represent net changes, not merely a new inflow. New immigrants add to the total foreign-born population but are offset by emigration and mortality among the existing immigrant population. All births to immigrants in the United States add only to the native-born population by definition. This means the number of new arrivals must be even higher for the foreign-born population to grow this much. In our prior analysis we discuss at length the factors that have led to this extraordinary increase. They include public statements and policy changes by the Biden administration, such as the decision to end the Migrant Protection Protocols, Title 42, the Asylum Cooperative Agreements with Central American countries, and in particular the decision to release several million people encountered at the border. Legal immigration has also rebounded after Covid.
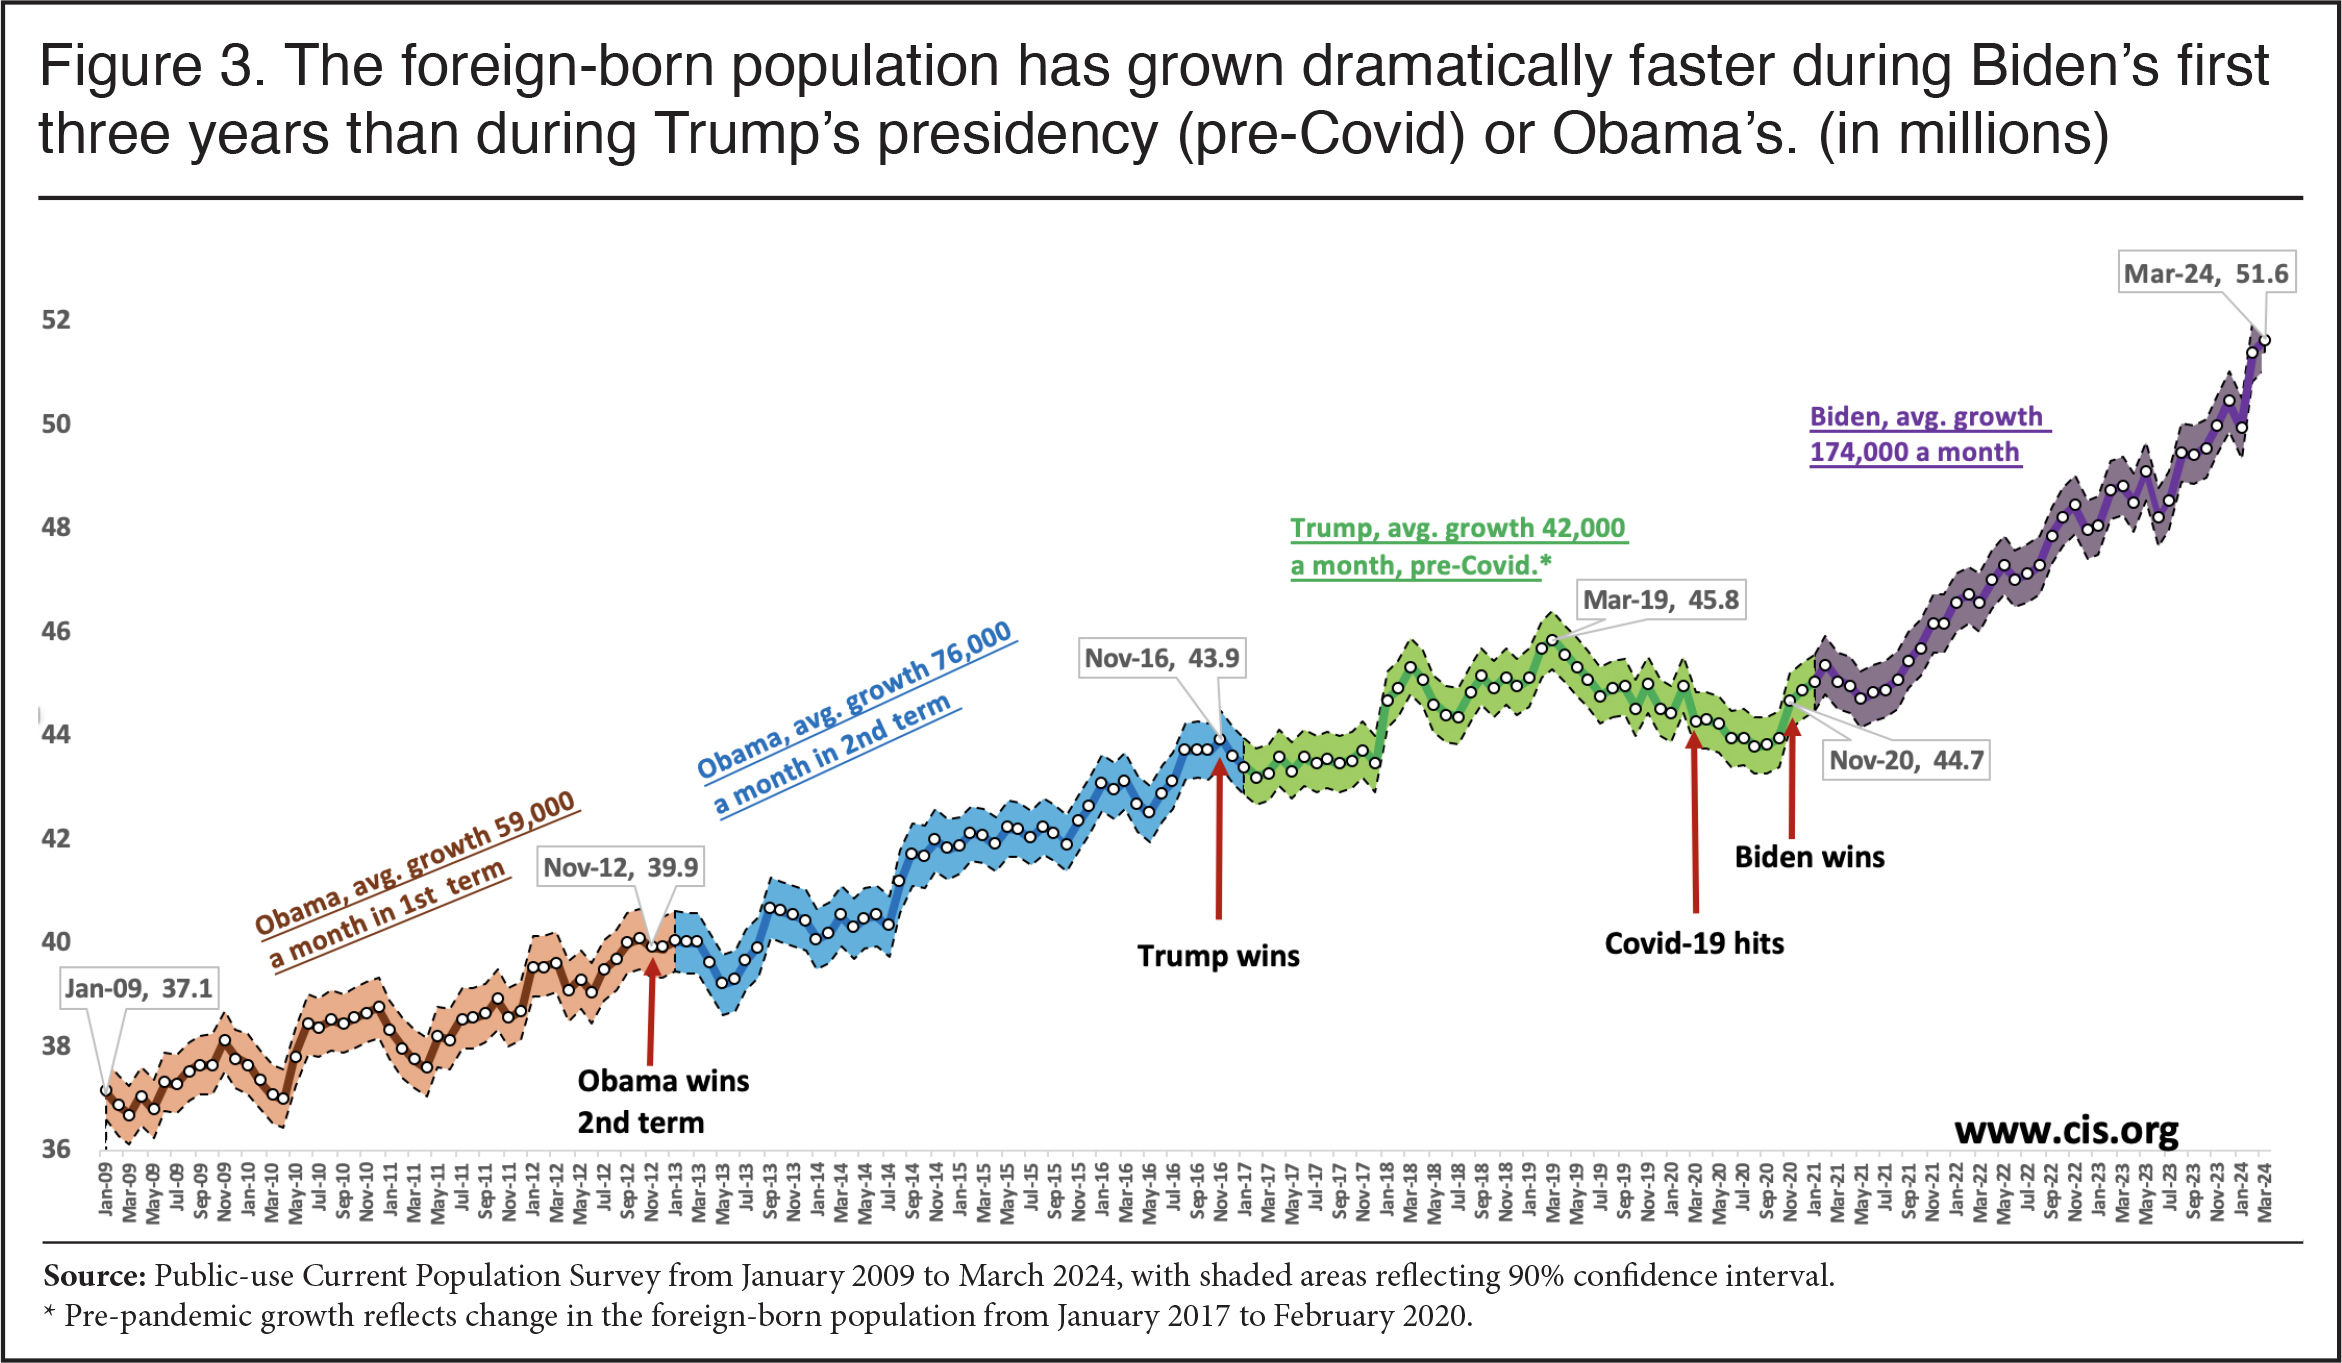
Biden Compared to His Immediate Predecessors. Figure 3 shows the size of the foreign-born population from the start of President Obama’s first term in January 2009 to March of this year, along with margins of error. Short-term fluctuations almost certainly reflect the natural variability of the survey. But growth so far during the Biden administration has averaged 174,000 a month, compared to 42,000 a month during Trump’s presidency before Covid-19 hit — January 2017 to February 2020. The average increase during Biden’s presidency is also more than double the 76,000 a month average during Obama’s second term and nearly triple the average increase of 59,000 in Obama’s first term.8 If Obama’s presidency is taken as a whole, growth averaged about 68,000 per month. Averaging many months together reduces month-to-month fluctuation and shows that the pace of growth during the Biden administration has been spectacularly higher than his immediate predecessors.
 |
Illegal Immigration. In our prior analysis we estimated that 58 percent of the increase in the total foreign-born population since President Biden took office was due to illegal immigration. There is nothing in the most recent data to change that perspective. If correct, then since January 2021 the illegal immigrant population has increased by 3.8 million. Further, of the 51.6 million immigrants living in the country in the March 2024 CPS, some 13.8 million are illegal immigrants. If adjusted for undercount, the total illegal immigrant population would be over 14 million in March 2024.
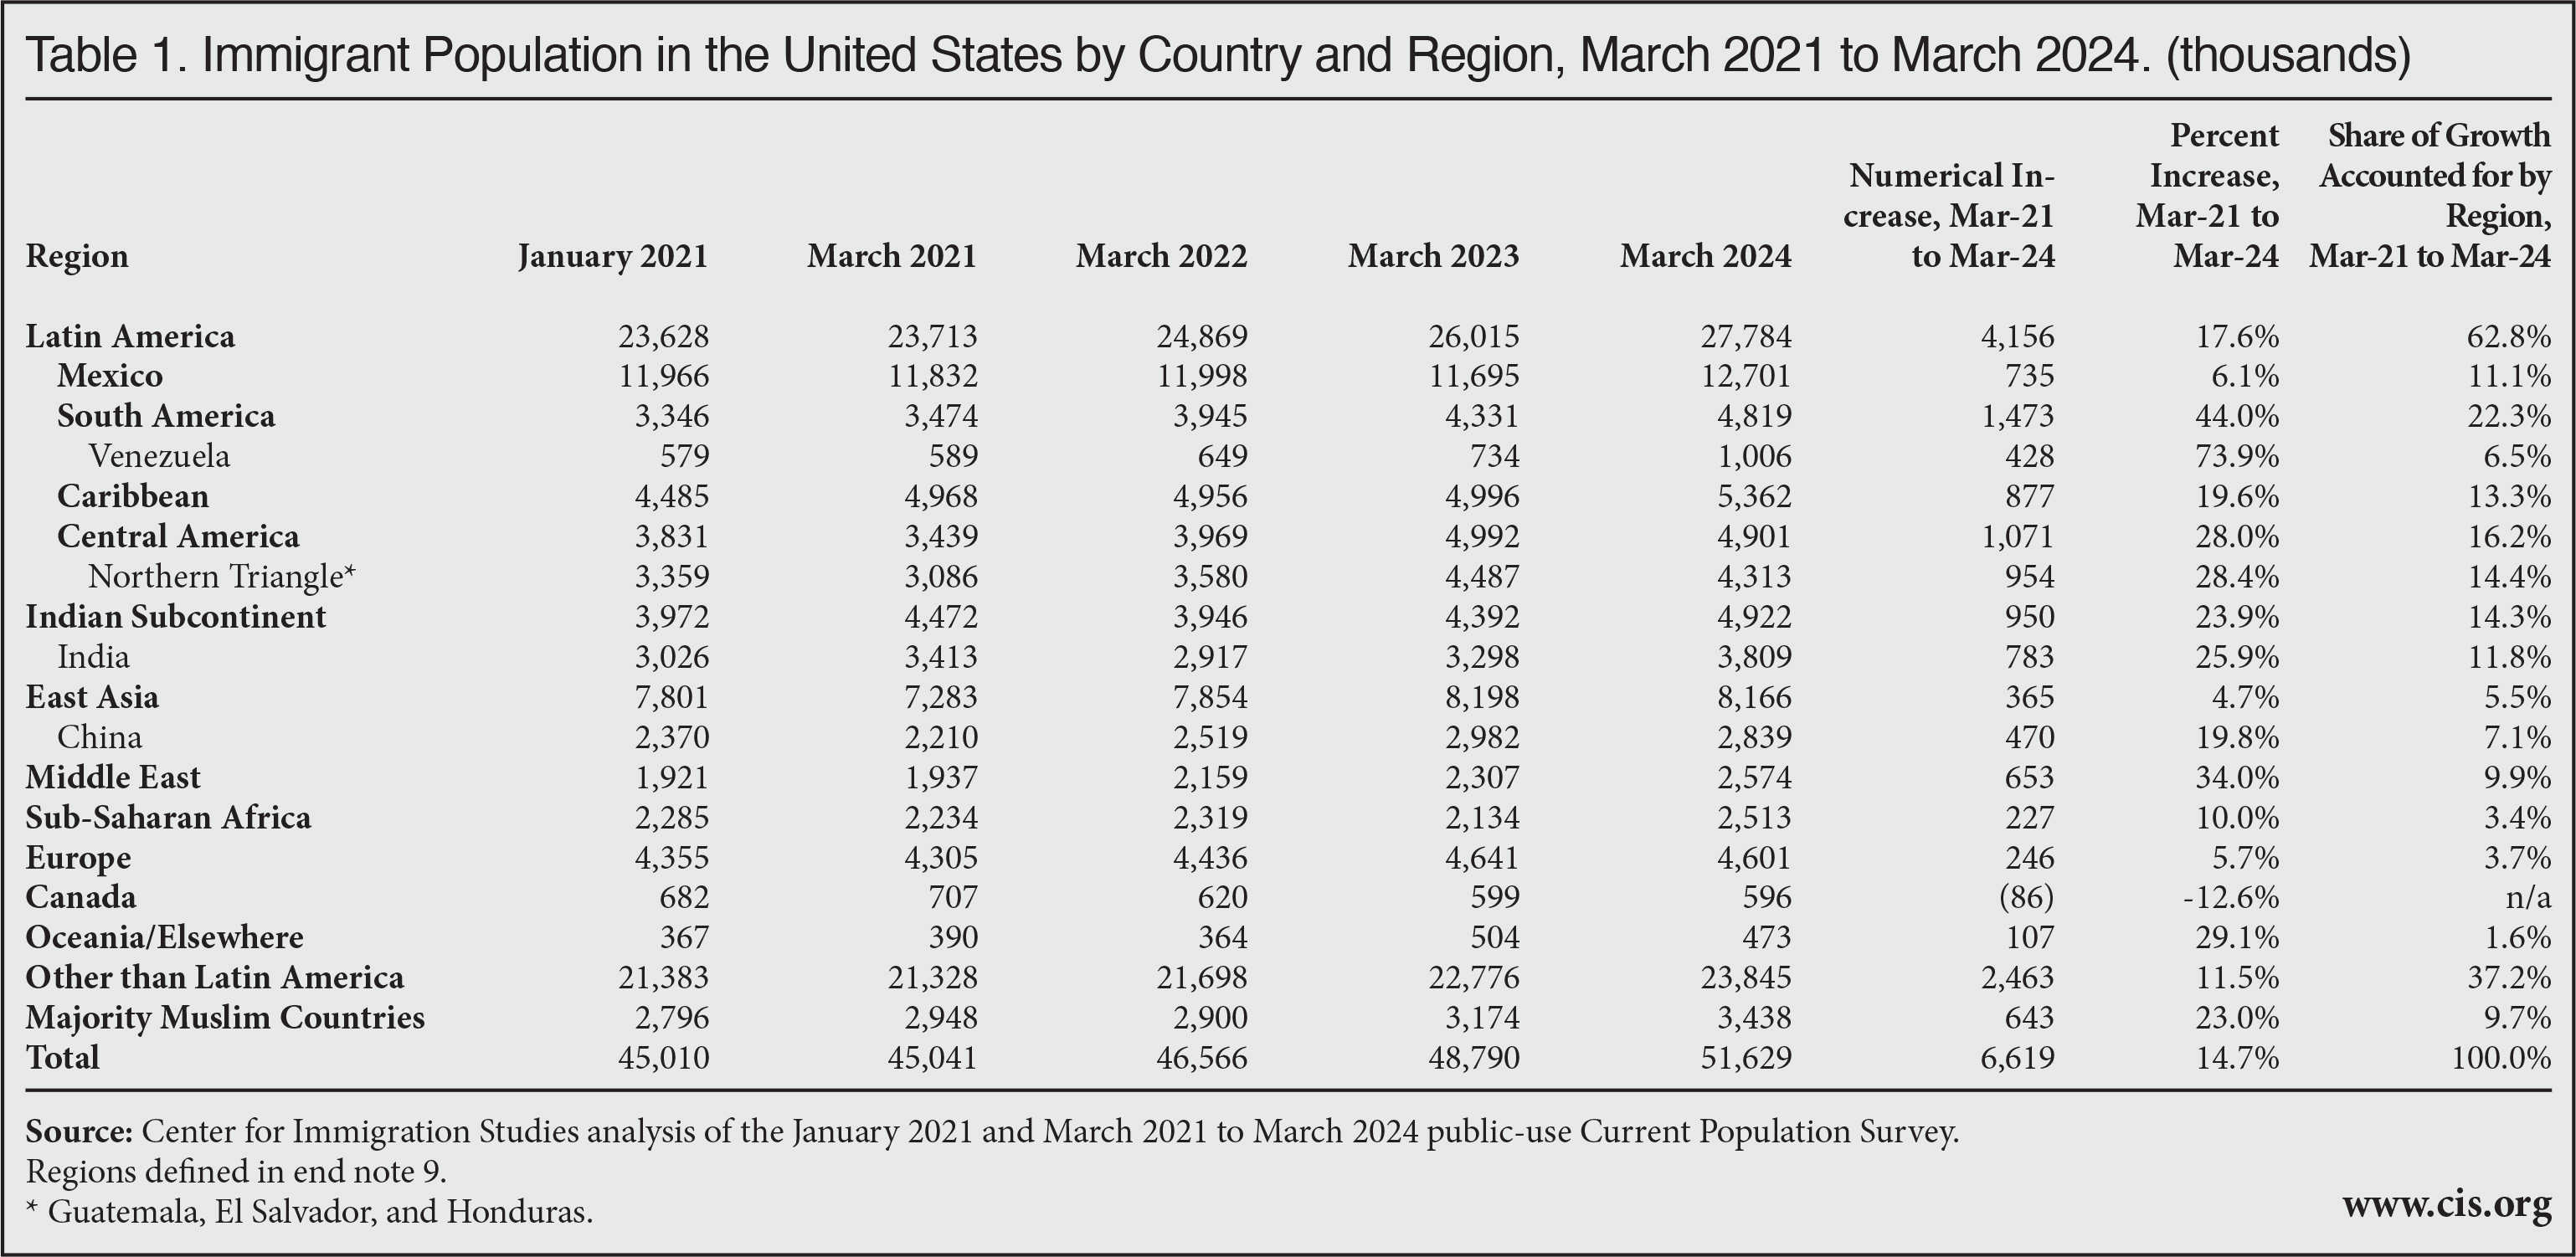
Immigrants by Sending Region. Table 1 shows the foreign-born population by region in January 2021, the month President Biden took office, and each March from 2021 to 2024.9 Growth in the foreign-born population is being driven by immigrants from Latin America, whose number has grown by 4.2 million since January 2021, with South America up 1.5 million, Central America up 1.1 million, and the Caribbean up nearly 900,000. The number of Mexican immigrants grew by 735,000, all of which was in the last year. Immigrants from the Indian Subcontinent and Middle Eastern immigrants have also grown by 950,000 and 653,000, respectively. Government and non-government researchers have long found that roughly three-fourths of illegal immigrants come from Latin America.10 The recent increase in the foreign-born population from Latin America is an indication of the large role illegal immigration has played in the dramatic increase in the overall size of the foreign-born population since January 2021. While immigration from Latin America has clearly contributed disproportionately to the increase in the foreign-born, the number of immigrants from other regions has also increased substantially.
 |
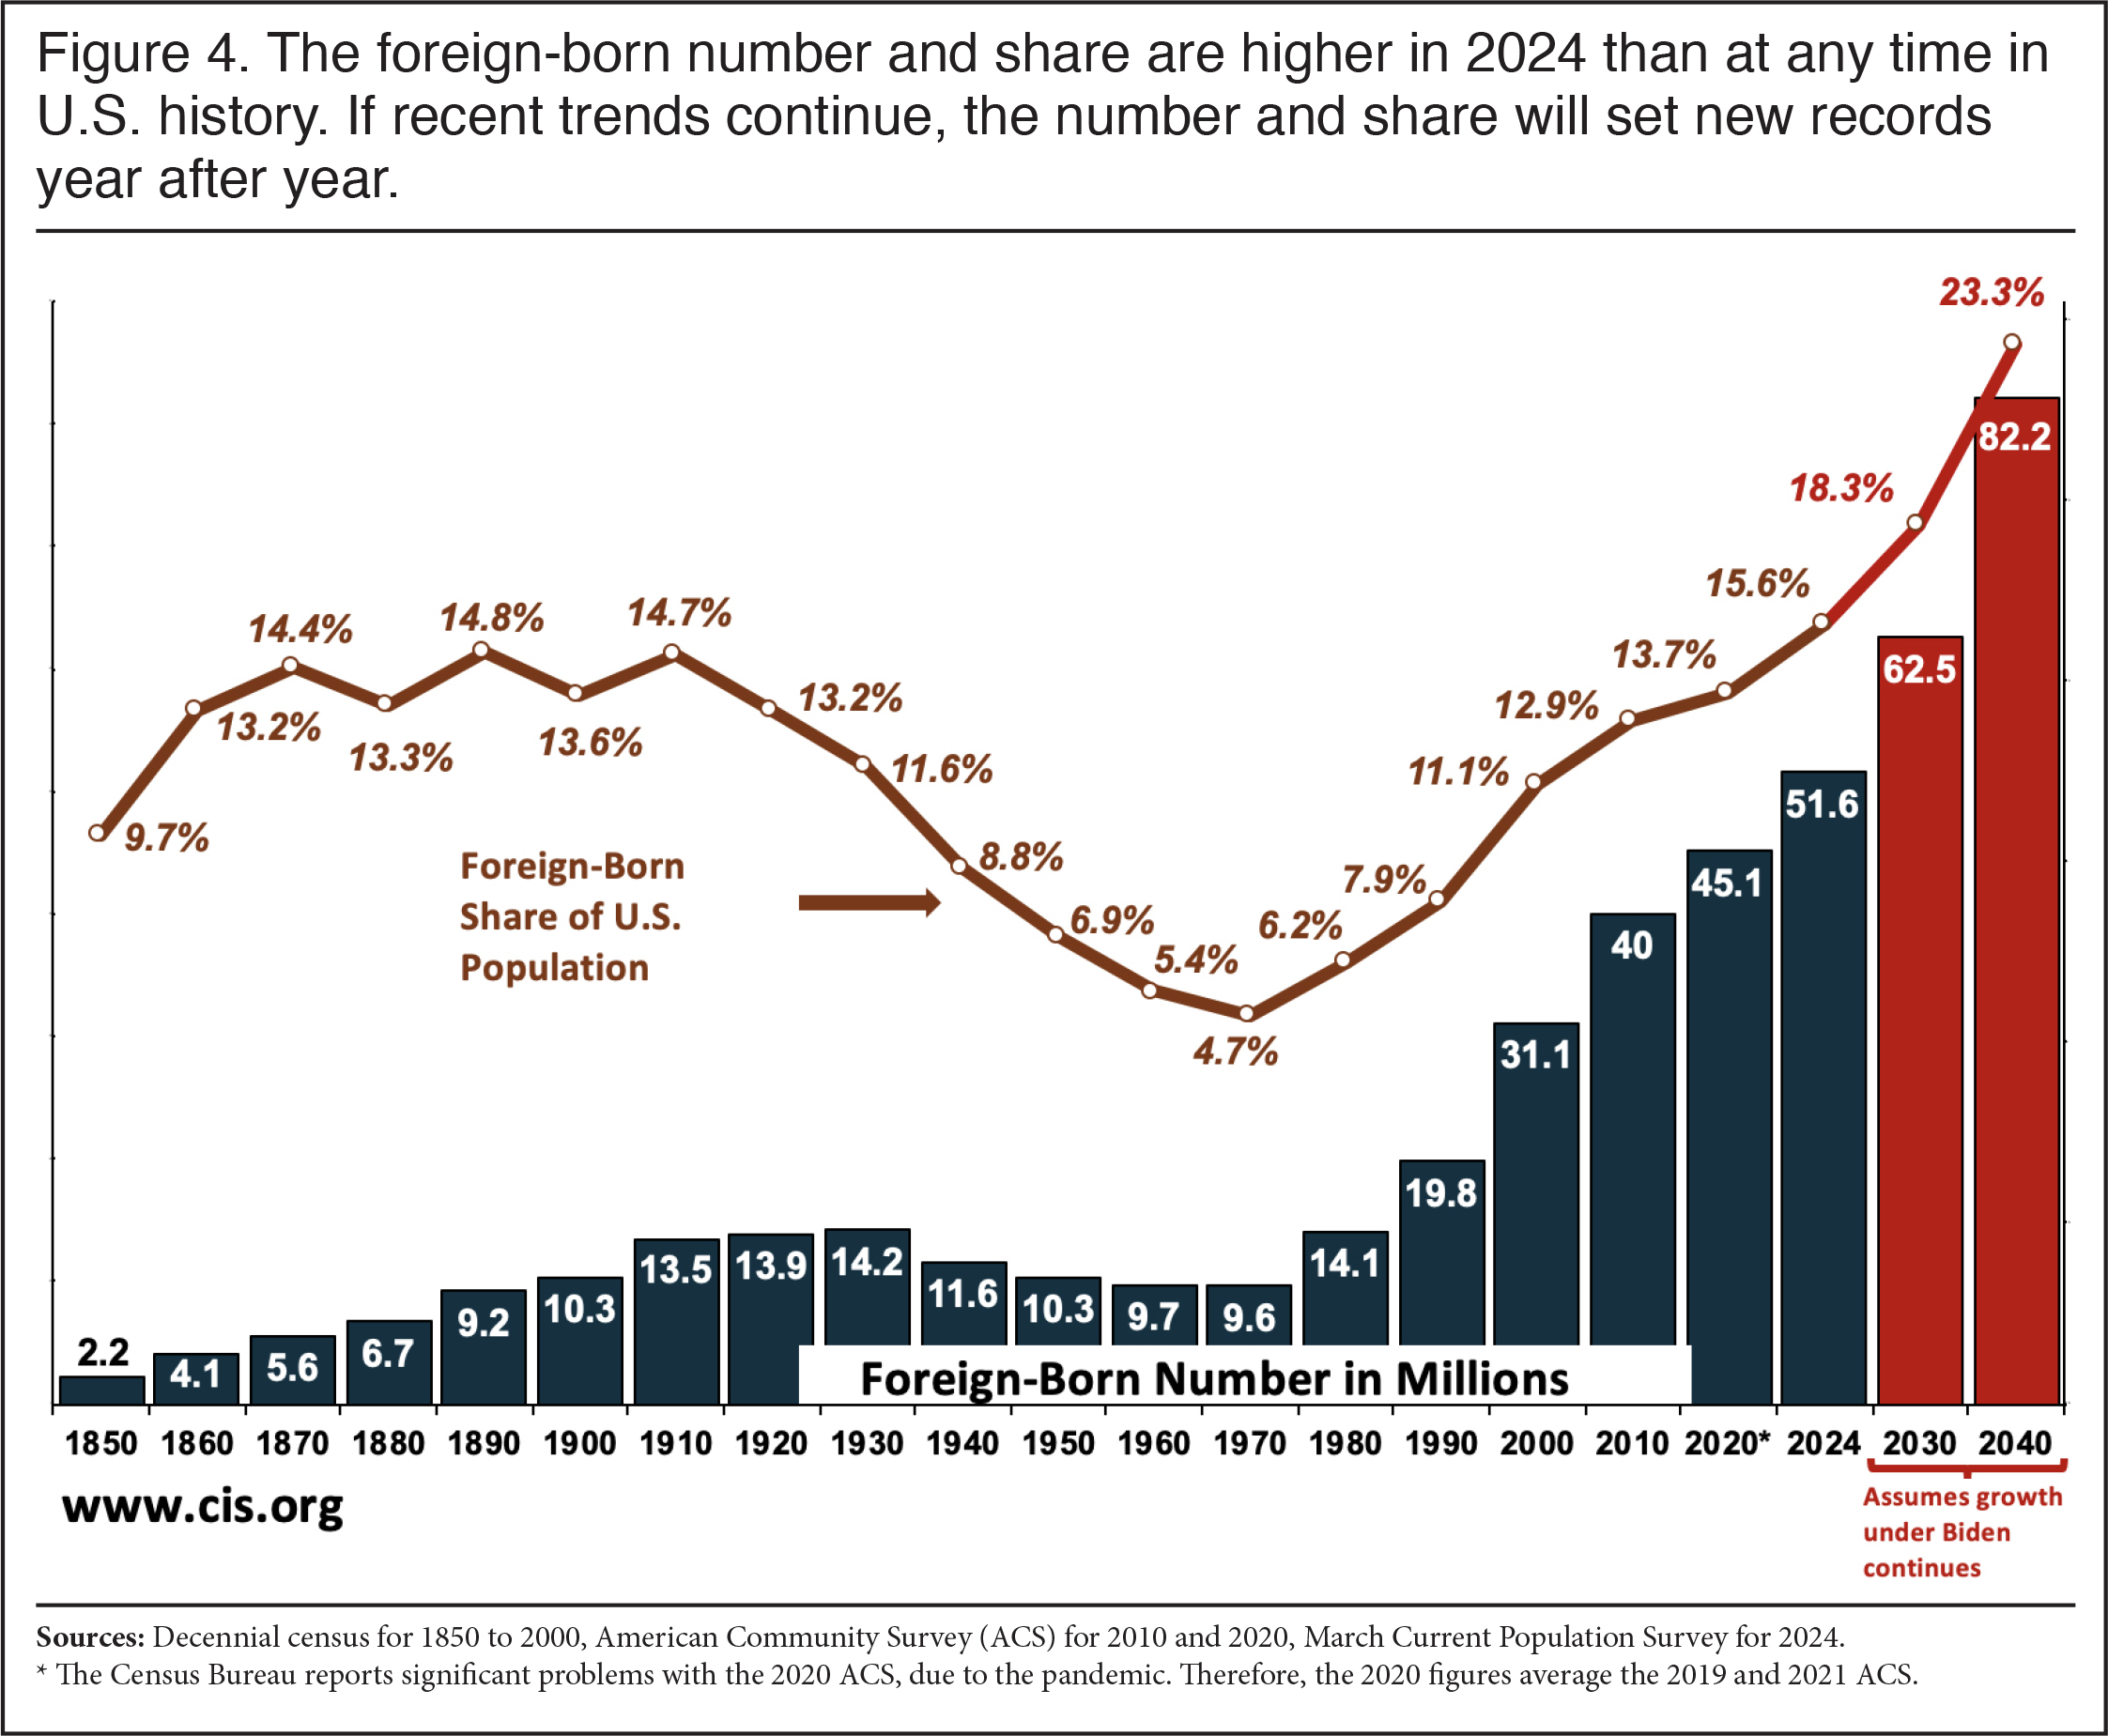
Historical Perspective. Figure 4 shows the number of foreign-born residents and their share of the U.S. population since 1850, which was the first time they were identified in the census. As already noted, at 51.6 million and 15.6 percent of the population, the foreign-born population is higher now than at any time in American history. The number of immigrants has increased five-fold since 1970, 2.6-fold since 1990, and by more than two-thirds since 2000. As a share of the population, even in 1890 (14.8 percent) and 1910 (14.7 percent) during what is often called the “Great Wave” of immigration, the foreign-born were a smaller share of the population than they are today.11 The scale of recent immigration is so high that it appears to have made the Census Bureau population projections, published in November of last year, obsolete. The bureau projected that the foreign-born share would not reach 15.6 percent until 2040. When thinking about the impact on American society, it seems fair to assume that both the size of the foreign-born population and its share of the overall population matter.12
 |
If Present Trends Continue
Where We Are Headed. In addition to showing the size of the foreign-born population and its share of the U.S. population, Figure 4 also projects what the foreign-born numbers will be in 2030 and 2040 if the trend that began in January 2021 is allowed to continue. At 62.5 million in 2030 and 82.2 million in 2040, the projections show the scale of immigration would be transformative. If the immigrant population reached 82.2 million in 2040 it would be larger than the current combined populations of 30 states plus the District of Columbia. It would also be larger than the current total populations of the Northeast (57 million), the Midwest (69 million), or the West (79 million). While immigration on this scale may seem unlikely, it must be remembered that before it happened, the 5.1 million increase in the foreign-born population in just the last two years would also have been seen as unlikely.
It is worth pointing out that the above projections consider only the immigrant component of the population, not the rest of the population. If, for example, the U.S.-born population grows slower or faster due to a rise or fall in birth or death rates, then the immigrant share of the population in 2030 and 2040 would change. Equally important, the projections for 2030 and 2040 are not predictions. They simply employ a linear model to show what will happen if current trends are allowed to continue.
New Arrivals
Newcomers in the Data. Responses to the year-of-entry question in the public-use CPS can also provide some insight into the scale and composition of recent immigration. In even-numbered years like 2024, the most recent arrival cohort that can be identified in the data is for the current year and the two prior years. (Responses to the year-of-entry question are grouped by the bureau into multi-year cohorts to preserve anonymity.) In order to get more statistically robust estimates, Figure 5 averages responses to the year-of-entry question from January, February, and March in the CPS in even numbered years going back to 1994. It shows a total of 4.6 million immigrants indicated they arrived in 2022, 2023, and the first part of 2024.13 This is the highest level of new immigration in a two-year period measured in the monthly CPS based on the first quarter of each year.
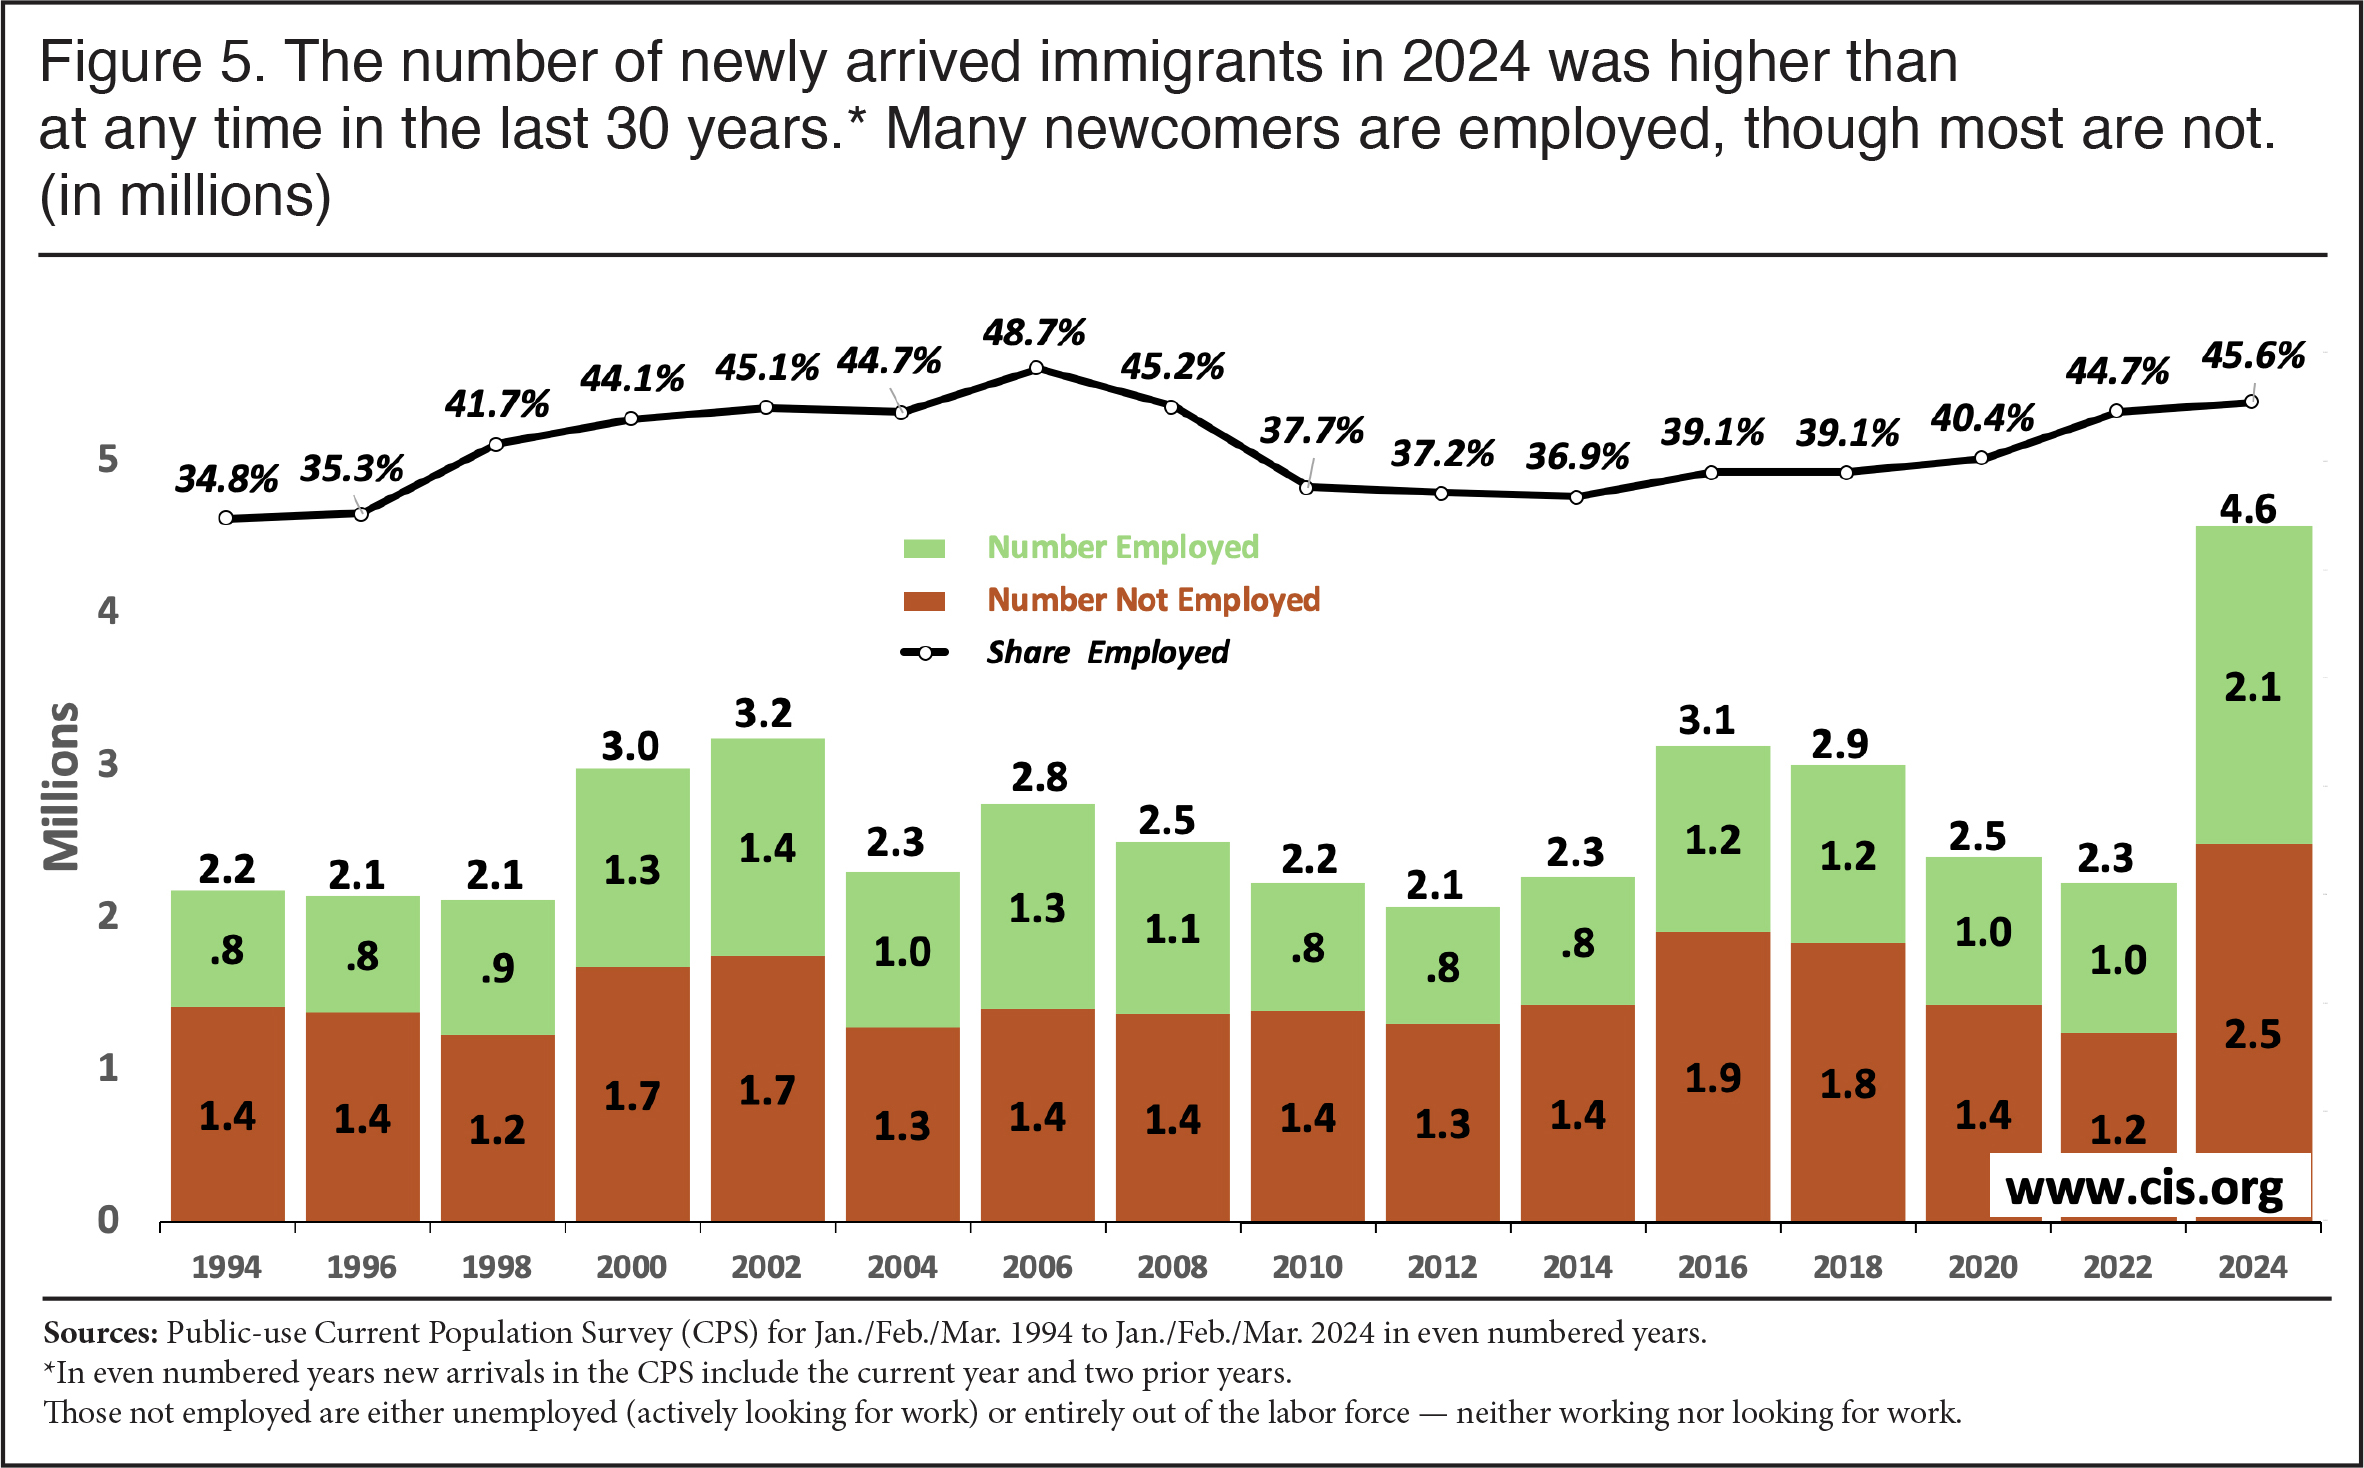 |
Employment Among New Arrivals. There is an unfortunate tendency to see immigrants solely as workers rather than as the full human beings that they are. As in any human population, some new immigrants do work, while others are unable or do not wish to work. Figure 5 reports the number and share of immigrants who are working and not working. The figures show that in the first quarter of 2024, 46 percent of those who arrived in 2022 or later were employed. Many new immigrants are children, elderly, disabled, caregivers, or others with no ability or interest in working. Immigration clearly adds workers to the country, but it just as clearly adds non-workers who need to be supported by the labor of others. This was the case in the past, it is true today, and it will surely be the case for immigrants who arrive in the future. Those who simply see immigration as a source of labor need to understand it is also a source of school children, retirees, and many other non-workers.
Are New Arrivals Struggling? Adapting to life in a new country is never easy. It is unreasonable to expect that all or even most new immigrants will find jobs right away, even if they are of working age. The findings in Figure 5 are relevant to the ongoing debate about whether illegal immigrants should be provided work authorization. Many advocates for the unauthorized argue they should be given work permits so they can support themselves while they await a court date. Of course, others worry that this would only incentivize more illegal immigration. In 2024, a larger share of new arrivals were unauthorized relative to prior years due to the ongoing border crisis. Nonetheless, Figure 5 shows the share of newcomers who are employed in 2024 is not very different from the share over the last three decades.
The Unemployment Rate of Newcomers. Table 2 provides more detailed information about the employment of new arrivals. The table shows that the unemployment rate, which measures the share of those 16 and older actively looking for work, was 8.5 percent for newcomers in 2024. This is higher than for the U.S.-born or for immigrants overall, but it is not very different from the rate for newcomers over the last three decades. Of the 2.5 million new arrivals not working in 2024, just 190,000 or about 8 percent said they were unemployed. The rest are out of the labor force entirely — neither working nor looking for work. There is no indication in the data that new arrivals, many of whom are illegal immigrants, are struggling to find employment relative to new arrivals in the past.
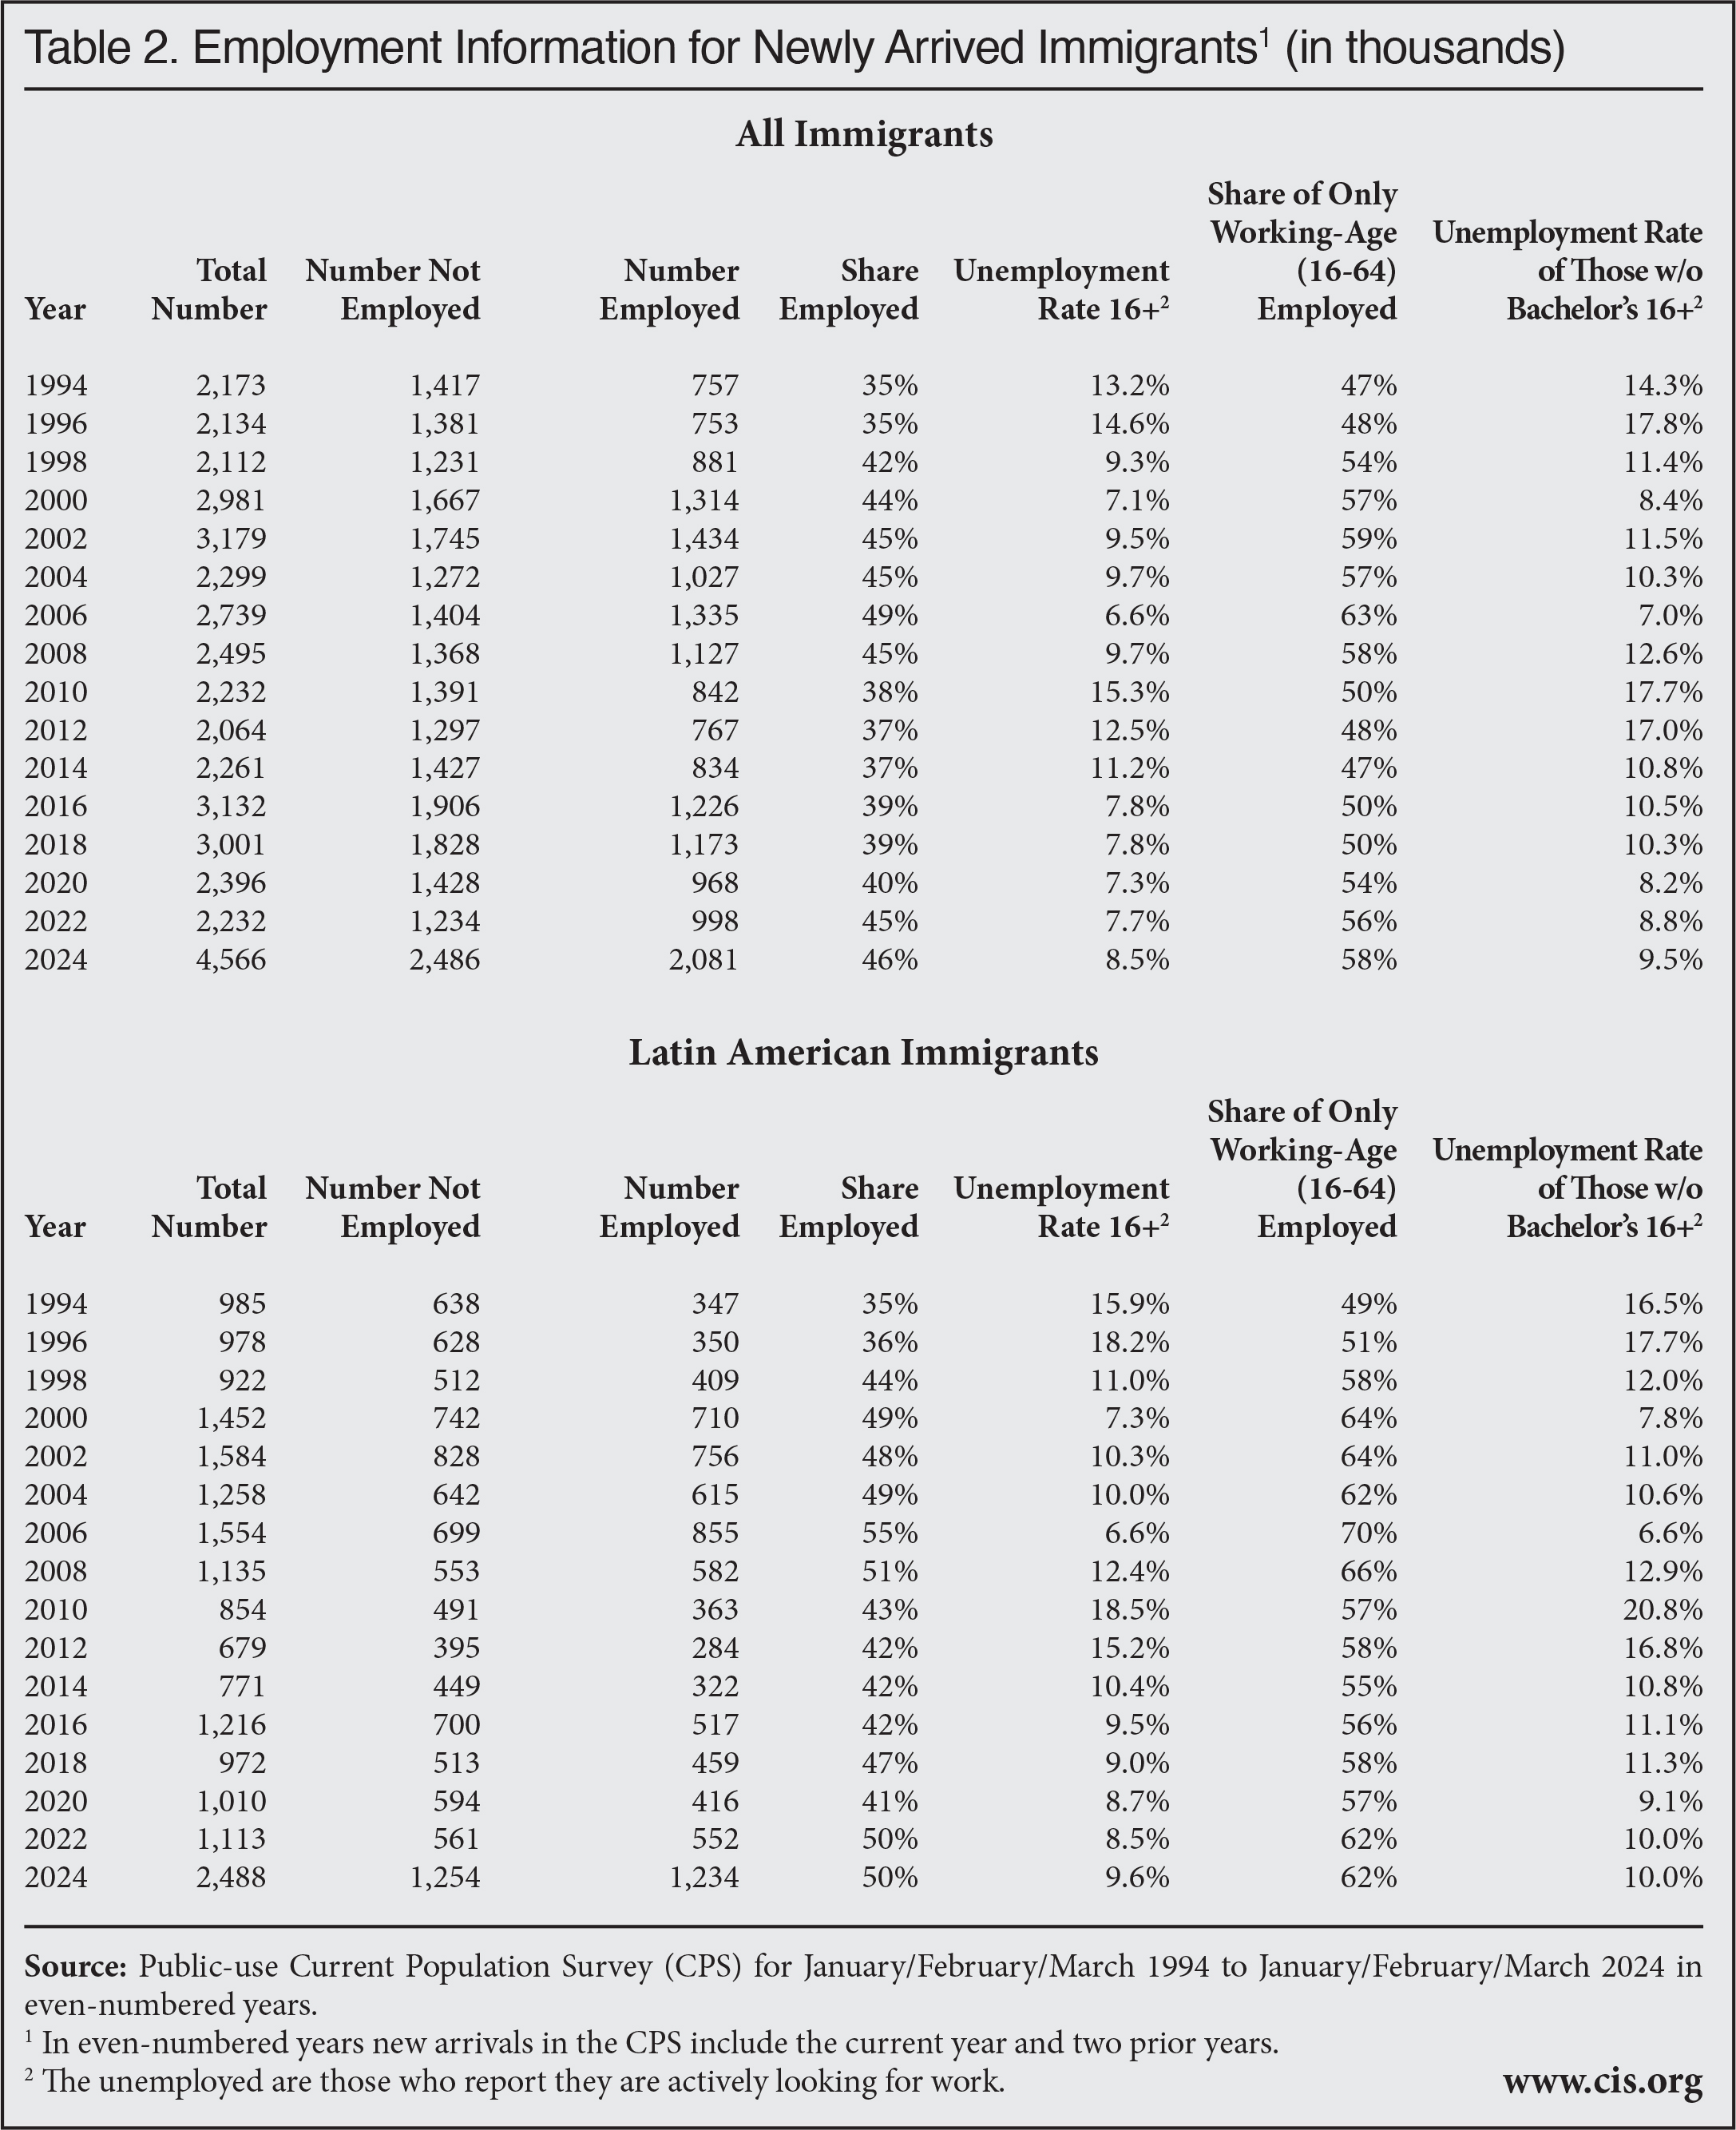 |
Employment of Illegal Immigrants. We can get a better idea of illegal immigrant employment by looking at newly arrived Latin American immigrants because more than half in 2024 are illegally in the country. Table 2 shows that 50 percent of new Latin American immigrants of all ages in the first part of 2024 were employed, which is similar to the share over the last 30 years. The share employed is also higher than the 46 percent for all new immigrants. Looking only at new working-age immigrants (16 to 64) from Latin America shows 62 percent are employed, which is higher than the 58 percent for all newly arrived working-age immigrants. Table 2 also shows that the unemployment rate for new Latin American immigrants 16 and older is 9.6 percent, only a little higher than the 8.5 percent for new immigrants overall.14 Among newly arrived non-college-educated Latin American immigrants, a population that overlaps even more with illegal immigrants than all Latin Americans, the unemployment rate is 10 percent, which is similar to the 9.5 percent for non-college-educated newcomers overall. The unemployment rate in 2024 for less educated Latin American newcomers is also not very different relative to the past three decades. At 10 percent, the rate is certainly not low, but since they just arrived and are not well educated it is not surprising. Worksite enforcement in the United States is quite lax. As best we can tell, lack of work authorization does not seem to be a significant hindrance to the employment of illegal immigrants relative to the past or compared to immigrants overall.
Conclusion
The current scale of immigration (legal and illegal) into the United States is without any precedent in the nation’s history. In March 2024 the foreign-born population reached 51.6 million, 5.1 million more than in March 2022 — the largest two-year increase ever recorded in American History. Moreover, 15.6 percent of the U.S. population is now foreign-born — the largest share on record. The prior record was 14.8 percent, 134 years ago in 1890. Since President Biden took office in January 2021 the foreign-born population has increased by 6.6 million. We have previously estimated that 58 percent of the increase under President Biden is due to illegal immigration. If the trends since President Biden took office continue, the foreign-born population would reach 62.5 million in 2030 and 82.2 million by 2040 — larger than the current combined populations of 30 states plus the District of Columbia. Perhaps the most fundamental question these numbers raise is whether America can successfully incorporate and assimilate all the immigrants already here, let alone millions more in the future.
Much of the news coverage on immigration has focused on the workers it provides employers. But the data shows that, of immigrants who said they arrived in 2022 or later, only 46 percent were actually employed. This is similar to the employment rate of new arrivals during prior economic expansions. Immigrants are not simply workers, they are human beings, and, as such, a large share of newcomers are children, elderly, disabled, caregivers, or others who cannot or who do not wish to work. Immigration clearly adds workers to the country but also adds non-workers who need to be supported by the labor of others. This is a reminder that policy-makers need to think about immigration’s broad impact on American society, not merely its usefulness to employers.
End Notes
1 The primary purpose of the survey is to collect information about the U.S. labor market, such as the unemployment rate, but starting in 1994 questions about citizenship, country of birth, and year of arrival were added.
2 The term “immigrant” has a specific meaning in U.S. immigration law, which is all those inspected and admitted as lawful permanent residents (green card holders). In this analysis, we use the term “immigrant” in the non-technical sense to mean all those who were not U.S. citizens at birth.
3 The margins of error shown in Figure 3 and reported elsewhere in the analysis are based on standard errors calculated using parameter estimates and an adjustment for foreign-born respondents, which reflects the survey’s complex design. To the best of our knowledge, neither the BLS nor the Census Bureau has provided parameter estimates or an adjustment specifically for the foreign-born that applies to the general population in the monthly CPS. For this reason, we use the parameter estimates and foreign-born adjustment provided by the government for the labor force.
4 The Census Bureau reports pandemic-related disruptions in data collection in 2020. As a result, the Bureau states that the ACS in that year, "did not meet our statistical quality standards. In contrast to the ACS, the BLS stated that, despite a decline in response rates for the CPS in 2020, they were “able to obtain estimates that met our standards for accuracy and reliability”. Nonetheless, comparing data from 2020 to the present in the CPS may still produce growth that is overstated.
5 Since the monthly CPS first asked about citizenship on a regular basis in 1994, there has never been a 39-month period that witnessed this kind of growth.
6 Looking at Figure 4, we see that historically, prior to 1994, the 5.7 million increase from 1980 to 1990 was the only decade where growth in the foreign-born population was larger than 5.1 million, making it theoretically possible that there was a two-year period in which growth was larger than the increase in the last two years. However, the average two-year increase in the 1980s was still only 1.14 million, roughly one-fifth the increase in the last two years. It is simply not possible for there to have been a two-year period during that decade in which the foreign-born population grew by 5.1 million. We know this in part because Table 1 of the Yearbook of Immigration Statistics shows nowhere near enough legal permanent immigrants on an annual basis for the foreign-born population to grow by 5.1 million in any two-year period. Responses to the year of entry question in the 1990 census also show that there was never a period in the 1980s when the foreign-born population could have come close to growing by 5.1 million in a two-year period. The 1990s was certainly a period of extraordinarily high immigration growth, but the two-year average during the 1990s was still 2.26 million. Moreover, there is monthly CPS data from 1994 onward. Comparing the 1990 census to the monthly CPS in 1994 shows the foreign-born population increased by only 1.71 million to 2.71 million in this four-year period, depending on the month in 1994 that is compared to the census. Although many illegal immigrants already here were legalized in the 1990s as a result of the IRCA amnesty passing in 1986, the statistical yearbook does not indicate new immigration was anything like 5.1 million over any two-year period. In sum, the foreign-born population could not have grown by 5.1 million ever before.
It is worth pointing out that the years 2000 to 2002 are very unusual in the CPS. The CPS was originally weighted in those years based on the results of the 1990 census carried forward. The 1998 and 1999 CPS also use the 1990-based weights. When these original 1990-based weights are used, growth from 1998 to 2000 or 1999 to 2001 is much less than 5.1 million. However, in 2003 the Census Bureau re-weighted the 2000 to 2002 CPS based on the results of the 2000 census. While the bureau is always updating and recalibrating the survey’s weights, it almost never re-weights prior years. Moreover, the impact of this re-weighting was very large, adding 3 million people to the total population in 2001 and 1.6 million on average to the foreign-born. (Note that the IPUMS website as well as the Census Bureau’s FTP site, where most researchers get their data, now have only the new 2000-based weights for these years.) If the 2001 CPS (using the 2000-based weights) is compared to the 1999 CPS (using 1999-based weights) then growth in the two months of February and March is larger than 5.1 million. However, it makes no sense to compare the 1999 CPS using old weights to the 2001 CPS using the new weights. As already noted, doing an apples-to-apples comparison for these years using the 1990-based weights shows much more modest growth. It is also possible to re-adjust the 1998 and 1999 CPS using the 2000-based weights, which we did in a 2004 CIS publication using the Annual Social and Economic Supplement of the CPS. That approach also showed growth of much less than 5.1 million in any two-year period. For these reasons we feel confident in stating that the increase in the foreign-born population from March 2022 to March 2024 is the largest two-year increase ever recorded.
7 Looking at all the prior censuses before the monthly CPS began to identify the foreign-born in 1994 indicates that annual growth in the intercensal periods never came close to 2.8 million. Responses to the year-of-entry question in the 2000 census also do not indicate that there was any year in the record-setting 1990s in which the foreign-born population grew by 2.8 million. However, there is a huge and sudden increase in the foreign-born population in the January 1996 CPS compared to December 1995. At the beginning of each year the bureau does re-weight the monthly CPS to reflect updated information. The documentation from 1996 states that this re-weighting was done in February, so it is not clear why there is a huge increase in January before the reweighting took place, unless the Census Bureau has subsequently re-weighted the January 1996 data as well. We have not been able to find any documentation to that effect. We do know that the 1996 re-weighting of the CPS caused a huge increase in the Hispanic population, and this is without question the reason the foreign-born population increased so much in 1996. As a result, the growth in the foreign-born population in June, July, and August in 1996 compared to the same months in 1995 is somewhat larger than 2.8 million in the last year. It seems certain that the increases in mid-1996 are implausibly large and are a statistical artifact stemming from the way the data was re-weighted. Nonetheless, at this time we do not have a way of re-adjusting the 1996 CPS to make it comparable to the 1995 CPS. Therefore, we cannot say that the increase from March 2023 to March 2024 is the largest single-year increase in the immigrant population ever recorded, although we can say it is the largest year-over-year increase in 25 years.
8 The average increase for Obama’s first term reflects growth in the foreign-born population between January 2009 and December 2012 of 2.76 million, divided by 47 months to reflect the changes that occurred after January 2009 when he took office. (Although each presidential term lasts 48 months, there are only 47 monthly changes in the data in a single term, unless we count the change from the December before an administration begins to January of the next year.) The average increase for Obama’s second term reflects growth in the foreign-born population between January 2013 and December 2016 of 3.56 million divided by 47 months. For Trump’s term before Covid, the average increase reflects growth in the foreign-born population between January 2017 and February 2020 (before Covid-19) of 1.57 million divided by 37 months. We chose February 2020 to reflect pre-Covid growth in the foreign-born population because Covid lockdowns did not begin until March of that year. For Biden, the average reflects growth in the foreign-born population between January 2021 and March 2024 of 6.62 million divided by 38 months. Of course, adding one additional month to each presidency would produce very similar results for each administration. So, for example, if we divided by 48 months for each of Obama’s terms it would show 57,000 for his first term and 74,000 for his second, which is very similar to the 59,000 and 76,000 when we divide by 47 months for each term. If we divide Trump’s pre-Covid time in office by 38 months we get average growth per month of 41,000 compared to 42,000 if we divided by 37 months. For President Biden, if we divide by 39 months we get an average monthly increase of 170,000 rather than 174,000 if we use 38 months.
9 We define regions in the following manner: Central America: Belize/British Honduras, Costa Rica, El Salvador, Guatemala, Honduras, Nicaragua, Panama, Central America NS. (not specified); Caribbean: Cuba, Dominican Republic, Haiti, Jamaica, The Bahamas, Barbados, Dominica, Grenada, Trinidad and Tobago, Antigua and Barbuda, St. Kitts-Nevis, St. Lucia, St. Vincent and the Grenadines, and the Caribbean NS; South America: Argentina, Bolivia, Brazil, Chile, Colombia, Ecuador, Guyana/British Guiana, Peru, Uruguay, Venezuela, Paraguay, and South America NS; East Asia: China, Japan, Korea, Mongolia, Cambodia, Indonesia, Laos, Malaysia, Philippines, Singapore, Thailand, Vietnam, Burma, Asia NEC/NS (not elsewhere classified or not specified); Indian Subcontinent: India, Bangladesh, Bhutan, Pakistan, Sri Lanka, Nepal; Middle East: Afghanistan, Iran, Iraq, Israel, Palestine, Jordan, Lebanon, Saudi Arabia, Syria, Turkey, Kuwait, Yemen, United Arab Emirates, Azerbaijan, Uzbekistan, Kazakhstan, Northern Africa, Egypt, Morocco, Algeria, Sudan, Libya, and Middle East NS; Sub-Saharan Africa: Ghana, Nigeria, Cameroon, Cape Verde, Liberia, Senegal, Sierra Leone, Guinea, Ivory Coast, Togo, Eritrea, Ethiopia, Kenya, Somalia, Tanzania, Uganda, Zimbabwe, South Africa, Zaire, Congo, Zambia, and Africa NS/NEC.; Europe: Denmark, Finland, Iceland, Norway, Sweden, United Kingdom, Ireland, Belgium, France, Netherlands, Switzerland, Greece, Italy, Portugal, Azores, Spain, Austria, Czechoslovakia, Slovakia, Czech Republic, Germany, Hungary, Poland, Romania, Bulgaria, Albania, Yugoslavia, Bosnia and Herzegovina, Croatia, Macedonia, Serbia, Kosovo, Montenegro, Estonia, Latvia, Lithuania, Other USSR/Russia, Ukraine, Belarus, Moldova, USSR NS, Cyprus, Armenia, Georgia, and Europe NS; Oceania/Elsewhere: Australia, New Zealand, Pacific Islands, Fiji, Tonga, Samoa, Marshall Islands, Micronesia, Other, NEC, North America NS, Americas NEC/NS and unknown; Majority Muslim: the Middle East (excluding Israel) as well as Bangladesh, Pakistan, Somalia, Indonesia, and Malaysia. Mexico is included in the Latin America total. Canada is not included in any other region.
10 The Migration Policy Institute’s estimates of illegal immigrants by country can be found here. Pew Research’s estimates by country can be found here. Estimates by the Department of Homeland Security can be found here. Those from the Center for Migration Studies by country can be found here.
11 The CPS does not include the institutionalized population, which is included in the decennial census and American Community Survey (ACS) used to measure the foreign-born population from 1850 to 2010 in Figure 4. The institutionalized are primarily those in nursing homes and prisons. We can gauge the impact of including the institutionalized when calculating the foreign-born percentage by looking at the public-use 2022 ACS, which shows that when those in institutions are included it lowers the foreign-born share of the population by less than one-tenth of 1 percent. This is because immigrants are a somewhat smaller share of the institutionalized than they are of the non-institutionalized. However, the institutionalized population is not very large relative to the overall population, so it makes very little difference to the foreign-born share of the total population. Also, the distribution of immigrants in the institutionalized and non-institutionalized population changes very little from year to year. The bottom line is that the inclusion of the institutionalized in March 2024 might have reduced the foreign-born share of the overall population by about one-tenth of 1 percent. A one-tenth of a percentage point reduction in the foreign-born share from 15.6 to 15.5 percent would still be a new record high. Also, the margin of error for the foreign-born share of the population in the monthly CPS is ± 0.2 percent assuming a 90 percent confidence level. But even the lower bound of the confidence interval would still place the foreign-born share well above the 14.77 percent in 1890, which also likely had some error that is lost to history. The bottom line is that we can say with confidence that at 15.6 percent in March 2024, the foreign-born share is the highest share ever recorded by any U.S. government census or survey.
12 When considering the impact of immigration on the country, the foreign-born share may seem like the only factor that matters. While percentages are important, the absolute size matters as well. For example, when thinking about the successful integration of immigrants, 500,000 foreign-language speakers may be enough to create linguistic and cultural enclaves, whether this 500,000 constitutes 10 percent of an urban area or 30 percent.
13 At 4.6 million, the number of newcomers in the first quarter of 2024 is not only higher than in any similar period in the CPS, it is also much higher than annual immigration measured by the ACS through 2022. However, as high as this number is, it does not line up with the enormous increase in the foreign-born population from January 2022 to March 2024, which was 5.1 million. As already discussed, new arrivals should exceed growth in the foreign-born population because newcomers are offset by outmigration and deaths, not the other way around. However, several factors likely account for this difference. First and foremost, there are margins of error around all of these numbers. The margin of error for the 4.6 million arrivals from 2022 to 2024 is ±197,000, using a 90 percent confidence level. Moreover, the margin of error around the total foreign-born population of 51.6 million in March 2024 is ±573,000, and it was ±554,000 for the 46.6 million in January 2022. Equally important, capturing newly arrived immigrants is difficult, so the undercount in the CPS is likely heavily concentrated among the newest immigrants. Finally, people who had lived in the United States previously and returned in 2022 to 2024 might have told the Census Bureau they came to the United States during their prior stay and not the most recent year they arrived. As a result, they add to the overall foreign-born population but do not show up as new arrivals. All these factors likely explain why the arrivals data for 2022 to 2024, though very high, seems low relative to growth in the immigrant population. The total foreign-born population in the CPS is a much more statistically robust number than new arrivals because it is based on a larger sample of all immigrants, not the smaller share who are newcomers.
14 In 2024 there were 131,000 newly arrived Latin Americans 16 and older unemployed. This is about 10 percent of the 1.25 million newcomers from Latin America not employed.
