The foreign-born population, which includes legal and illegal immigrants captured in Census Bureau data, has grown dramatically in the United States in the last three decades. Nowhere is this truer than in the American South. The dramatic increase in the South in recent decades is particularly striking because historically the region was largely bypassed during all other prior periods of mass immigration in the 18th and early 20th centuries. But since 1990 the foreign-born population in the South has grown more than twice as fast as it has in the rest of the country. Immigration policy is reshaping the American South more than any other part of the country.1
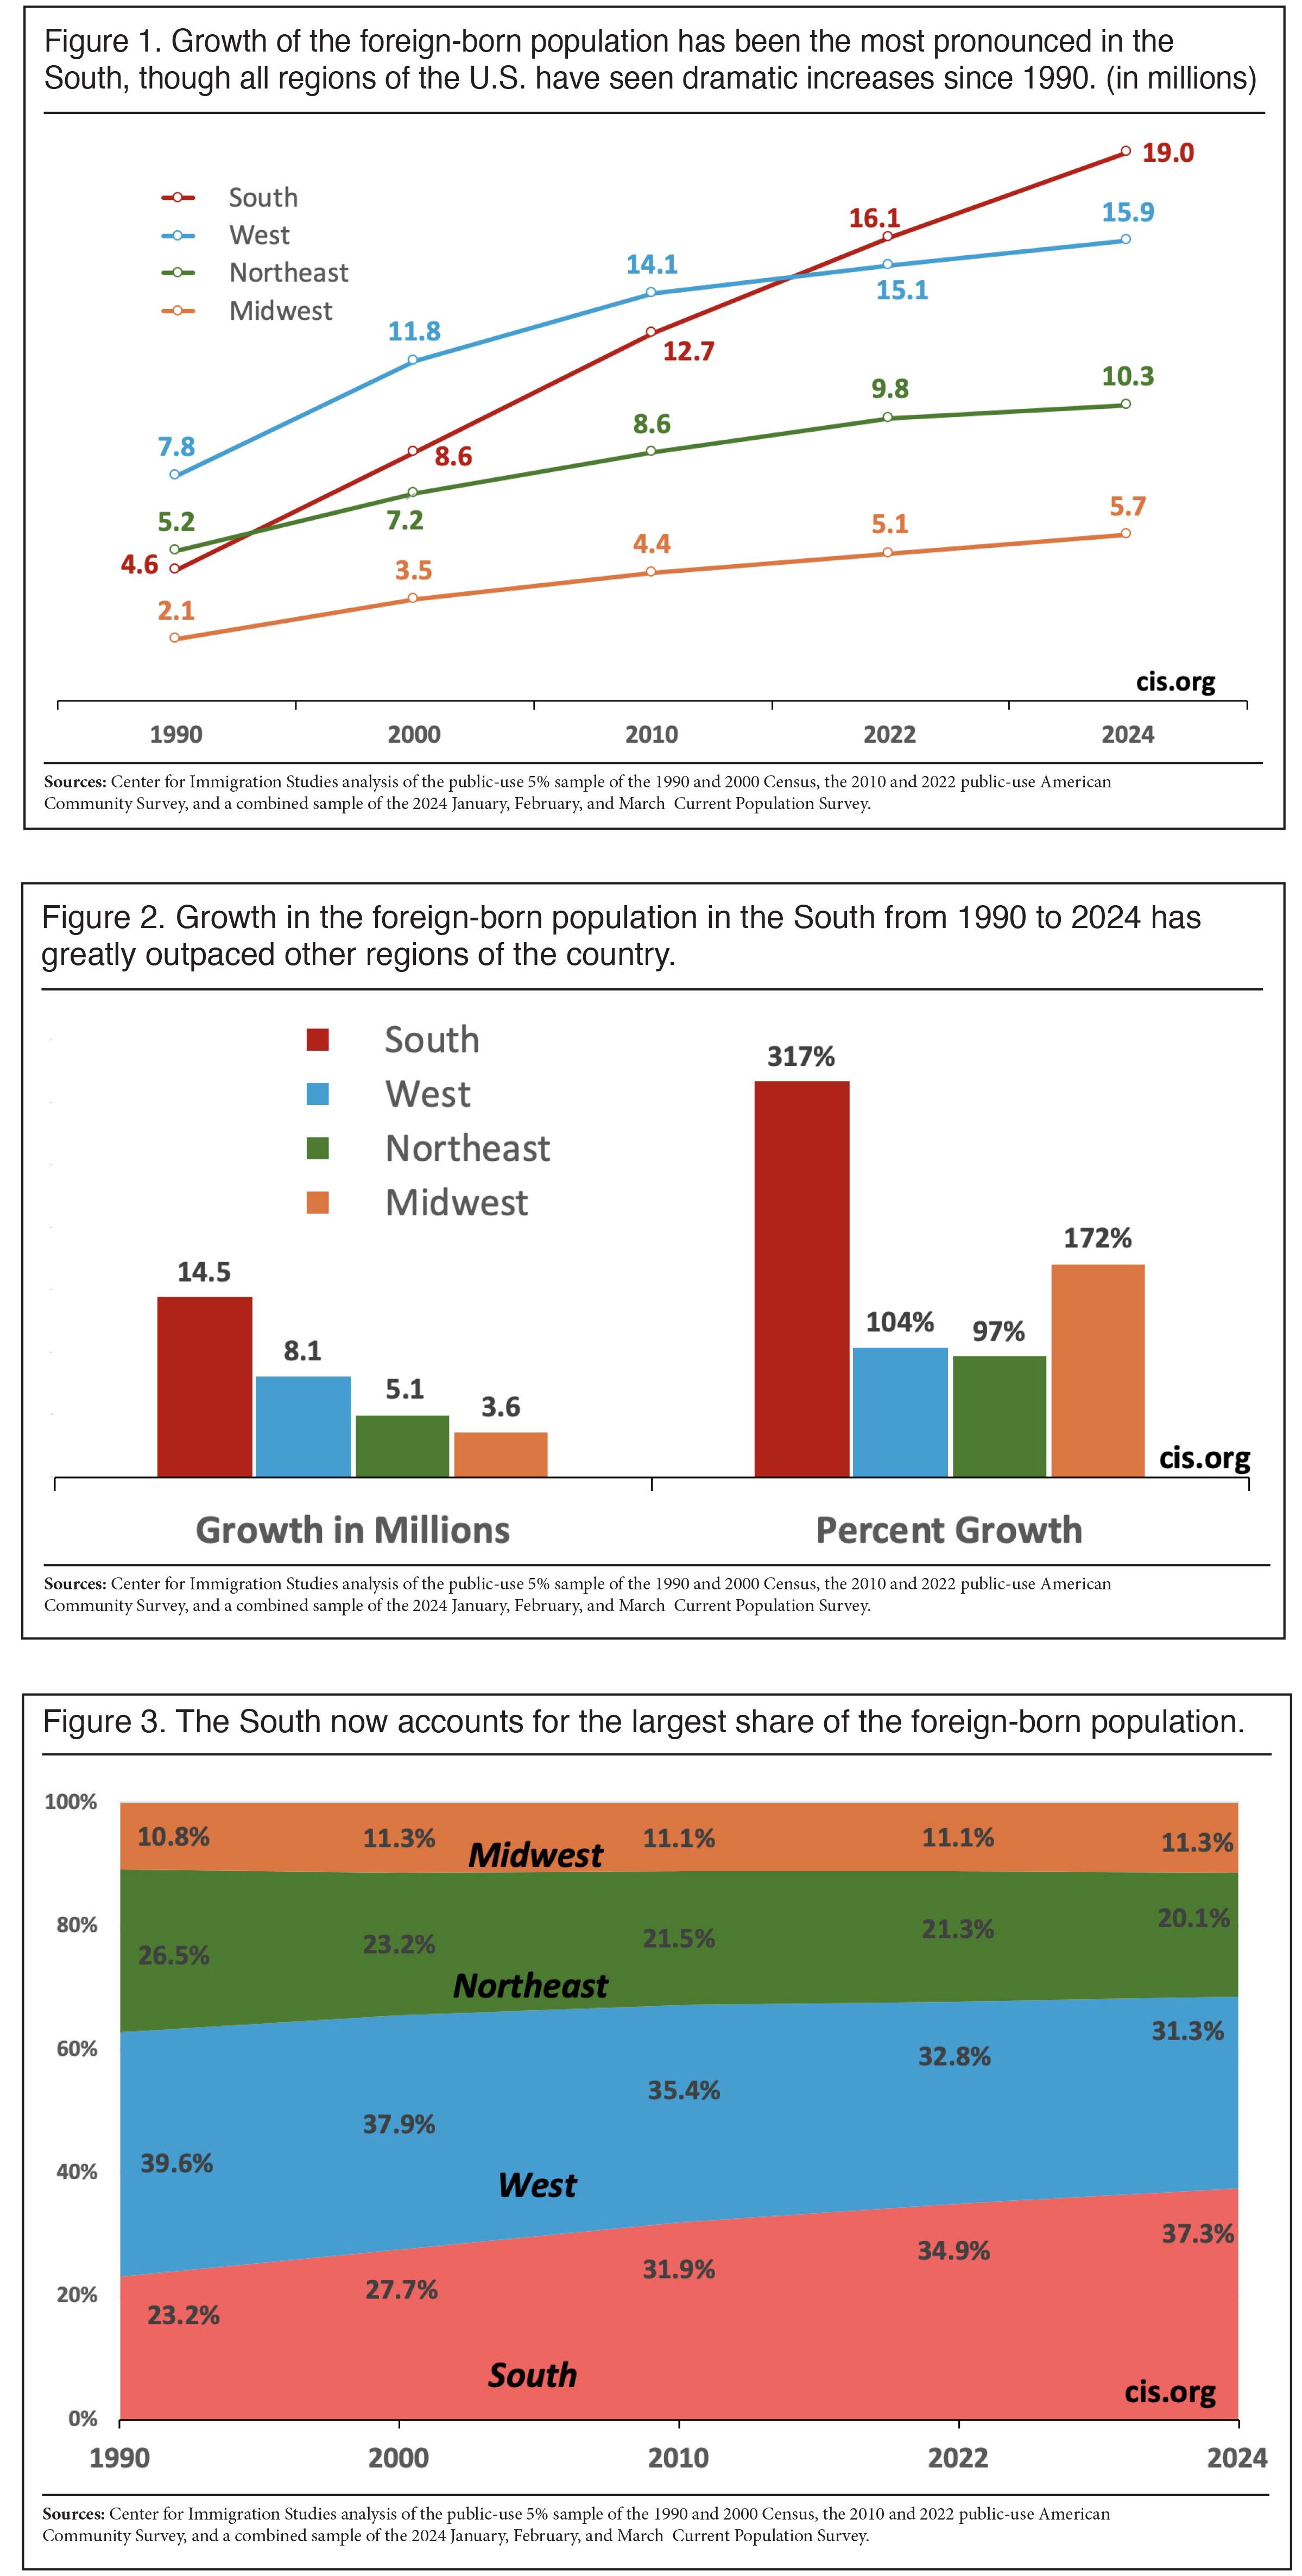
- In 2024, the total foreign-born population in the South was 19 million, by far the largest total in any of the nation’s four regions. The region’s foreign-born population almost equals the entire foreign-born population in the United States in 1990 of 19.7 million (Figure 1).2
- Since 1990, the foreign-born population in the South has increased by 317 percent, compared to 172 percent in the Midwest, 104 percent in the West, and 97 percent in the Northeast (Figure 2).
- Just since 2010, the foreign-born population in the South has increased by 49 percent, compared to 29 percent in the Midwest, 19 percent in the Northeast, and 13 percent in the West.
- By 2024, the South accounted for 37.3 percent of the total foreign-born population in the United States, compared to 23.2 percent in 1990 or 31.9 percent as recently as 2010 (Figure 3).
- In 1990, 5.4 percent of the South’s total population was foreign-born; this was the highest percent ever recorded up to that time for the region. At almost 15 percent today, the share has nearly tripled since 1990, which is unprecedented in southern history.3
- The percentage increase from 1990 to 2024 has been spectacular in many Southern states. Looking only at states where the foreign-born population was already at least 100,000 in 1990, the increase was 966 percent in North Carolina, 754 percent in Georgia, 329 percent in Virginia, 317 percent in Texas, 262 percent in Maryland, and 211 percent in Florida.
- In 1990, only two states in the South had more than 500,000 foreign-born residents — Texas and Florida. By 2024 a total of six states had a foreign-born population of more than a million — Texas, Florida, Maryland, Virginia, North Carolina, and Georgia.
- In 2024, there were seven states in the South, plus the District of Columbia, where the foreign-born accounted for at least one in 10 residents, compared to just one state (Florida) in 1990.
- There are three states in the South (Alabama, Mississippi, and West Virginia) that have been largely unaffected by high levels of immigration. In all three states, the foreign-born population remains below 5 percent of the total population in 2024.
This Excel File Contains Regional and State Information
Data Sources. The data for this report comes from the public-use micro data of the 1990 and 2000 censuses; 2000 was the last year the decennial census identified the foreign-born. Data for 2010 and 2022 come from the public-use American Community Survey (ACS). Figures for 2024 are from the January to March Current Population Survey (CPS) averaged together.
The very large American Community Survey (ACS) is often used to study the foreign-born. Its large sample size makes it ideal for studying state-level data and subpopulations. Unfortunately, the most recent version of the ACS only reflects the population in July 2022 and is now almost two years out of date. Normally this would not matter that much, but the ACS cannot fully reflect the rapidly evolving border crisis and the enormous increase in the foreign-born population since 2022. For this reason, we use a combined three-month sample of the 2024 CPS to get the most up-to-date picture possible. While the CPS is not as large as the ACS, it can be used to look at regions and large states, though figures for smaller states should be interpreted with caution.
We use the 2022 data of the ACS and not the 2020 ACS in the Excel file linked above and in the figures below because the Census Bureau reports pandemic-related disruptions in data collection in 2020 for that survey. The bureau states that the ACS in that year "did not meet our statistical quality standards”. Also, it should be noted that the CPS, unlike the decennial census and the ACS, does not include the institutionalized population, though the share of the foreign-born in prisons, jails, and nursing homes is relatively small.
 |
End Notes
1 The foreign-born population grew by 317 percent between 1990 and 2024 in the South compared to 111 percent for the rest of the country. Nationally, the foreign-born population grew by 159 percent from 1990 to 2024.
2 Excel Tables 1 and 2 show the states that comprise each region of the country.
3 See Paul Jacobs, “The Foreign-Born Population by U.S. Region, 1850-2016”, Population Division, U.S. Census Bureau, October 2017.