The Census Bureau’s American Community Survey (ACS) released today shows 45.3 million foreign-born residents — 1.8 million larger than in 2020. However, significant problems with data collection in 2020 due to Covid-19 make it difficult to interpret the 1.8 million increase between 2020 and 2021.1 Equally important, the 2021 ACS survey only reflects the population through July 2021 and does not fully reflect the ongoing border surge or the increase in legal immigration in 2021 as Covid-19 travel restrictions abated.
In contrast, the more updated 2022 Current Population Survey Annual Social and Economic Supplement (CPS ASEC), which was released just two days ago, reflects the population in March of this year and shows 46.8 million foreign-born residents. Moreover, the monthly Current Public Survey (CPS) from August of this year, the newest data available, shows 47.3 million foreign-born residents. All of the available evidence indicates that the scale of immigration (legal and illegal together) has been enormous. The "foreign-born" or "immigrant" population includes all those who were not U.S. citizens at birth — both legal and illegal immigrants.
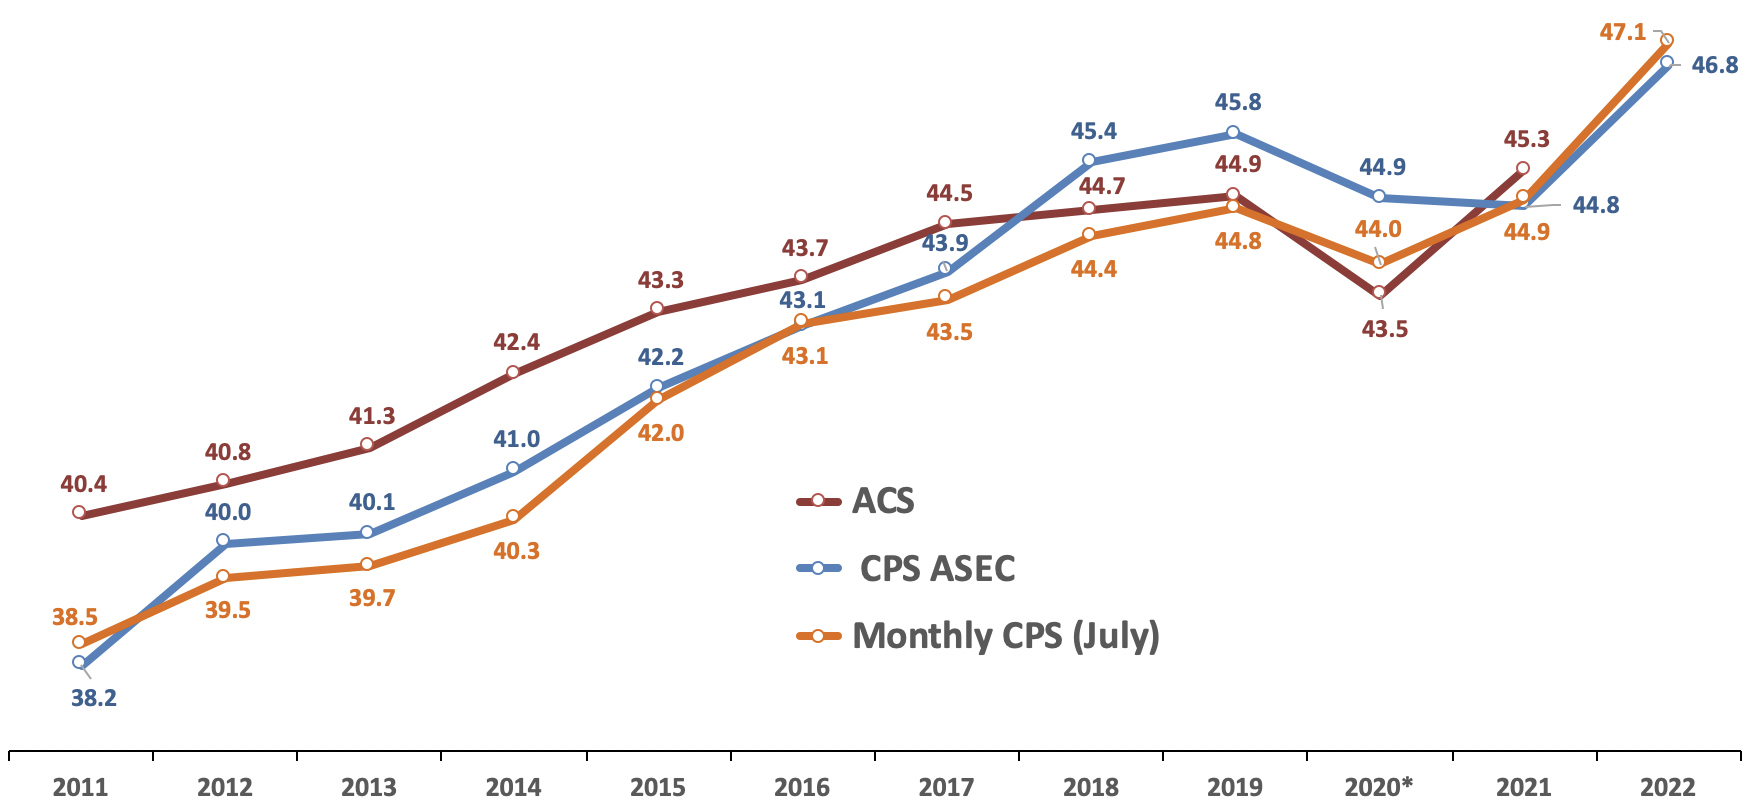
The ACS, CPS ASEC, and the monthly CPS are all collected by the Census Bureau and generally produce similar estimates of the foreign-born population, though not always.2 (See Figure 1, below.) But the surveys are released on different schedules. Typically, this does not matter too much. However, the rapidly changing immigration situation means that only the most up-to-date data fully captures current conditions. While the large size of the ACS makes it ideal for studying the foreign-born, it only reflects the population in July of each year and is not released until more than a year later. The CPS ASEC is smaller than the ACS, but it oversamples minorities, which helps in studying the foreign-born. However, it is only collected in March and is not released for six months. The monthly CPS is the smallest of the surveys, though it still surveys over 60,000 households, and it is released every month, providing the most up-to-date information.
Download Table 1 and Table 2
About the size and growth of the foreign-born population:
- The 2021 American Community Survey (ACS), which reflects the population in July 2021, shows 45.3 million foreign-born residents living in the U.S. This is the largest foreign-born population the ACS has ever shown and an increase of 1.8 million over the 2020 ACS.
- However, the 1.8 million increase between 2020 and 2021 is difficult to interpret because of significant problems collecting the 2020 data during the pandemic.3 Compared to the 2019 ACS, the foreign-born population increased by only 367,000 from 2019 to 2021.
- The 2022 Current Population Survey Annual Social and Economic Supplement (CPS ASEC), which was released just two days ago, reflects the population in March of this year and shows 46.8 million foreign-born residents. (Table A-1 in the Census Bureau’s health insurance report)
- Analysis by the Center for Immigration Studies of the public-use monthly Current Population Survey (CPS) from August 2022 shows a foreign-born population of 47.3 million.
- Although the 2021 ACS is somewhat out of date, the survey’s large size makes it possible to measure growth by immigrant-sending countries. The largest numerical increases from 2010 to 2021 were for immigrants from India, up 929,000; China, up 588,000; the Dominican Republic, up 376,000; Venezuela, up 361,000; Guatemala, up 276,000; Honduras, up 245,000; Brazil, up 230,000, Nigeria, up 224,000; and Colombia, up 218,000. (Table 1)
- The largest percentage increases from 2010 to 2021 by country were for Venezuela, up 196 percent; Nepal, up 151 percent; Afghanistan, up 127 percent; Burma, up 111 percent; Nigeria, up 102 percent; Bangladesh, up 86 percent; Syria, up 79 percent; Kenya, up 74 percent; and Brazil, up 68 percent. (Table 1)
- The large size of the ACS also makes it possible to measure growth in the foreign-born population by state. The largest numerical increases from 2010 to 2021 in immigrant populations were in Florida, up 951,000; Texas, up 950,000; California, up 301,000; New Jersey, up 290,000; Washington State, up 257,000; Massachusetts, up 244,000; Pennsylvania, up 200,000; Maryland, up 175,000; Virginia, up 159,000; and North Carolina, up 151,000. (Table 2)
- The states with the largest percentage increases from 2010 to 2021 were North Dakota, up 103 percent; Delaware, up 41 percent; South Dakota, up 39 percent; Idaho, up 32 percent; Kentucky, Washington, Minnesota, and Nebraska, each up 29 percent; Tennessee, up 28 percent; and Pennsylvania, up 27 percent. This compares to a national increase of 13 percent. (Table 2)
Figure 1. Total Foreign-Born Population, 2011 to 2022, Based on Three Census Bureau SurveysStarting in 2018, the CPS ASEC produced higher numbers than the ACS, though not in 2021. It is likely that once the 2022 ACS data is released next year it will show a foreign-born population of roughly 47 million. (in millions) |
 |
|
Source: Data for the Current Population Survey Annual Social and Economic Supplement (CPS ASEC) and monthly Current Population Survey (CPS) are from the public-use files found at Ipums. * Data for the 2020 ACS comes from author’s analysis of the 2020 public-use file of the ACS. |
End Notes
1 The Census Bureau encountered significant problems collecting the 2020 ACS due to disruptions caused by Covid-19. As a result, the bureau states that it was “unable to collect information from certain segments of the population” in 2020, particularly lower-income and less-educated individuals. So we do not have a clear picture of the foreign-born population in 2020 based on the ACS. The bureau has published a detailed analysis showing some of the problematic results in the 2020 ACS. Although the Census Bureau published very little data from the 2020 ACS, the public-use files of the 2020 ACS were released. All numbers for the 2020 ACS in this report are based on our analysis of that data.
2 In a prior analysis, the Center looked at long-term trends in the foreign-born population in the ACS compared to the CPS ASEC and discussed how the ACS typically produces higher estimates, but more recently the CPS ASEC has shown a larger immigrant population. We also discuss differences in how the data is collected and how this might impact estimates from the surveys. Figure 1 also reports the size of the foreign-born population based on the ACS, CPS ASEC, and the monthly CPS.
3 See End Note 1.