[Originally published March 20, 2026; revised March 23, 2026]
Muslim immigration has been the subject of much discussion recently. Below is a look at the statistics regarding annual immigration from Muslim-majority countries (which are home to some 80 percent of the world's Muslims), the total foreign-born population from those countries, and the number becoming naturalized American citizens.
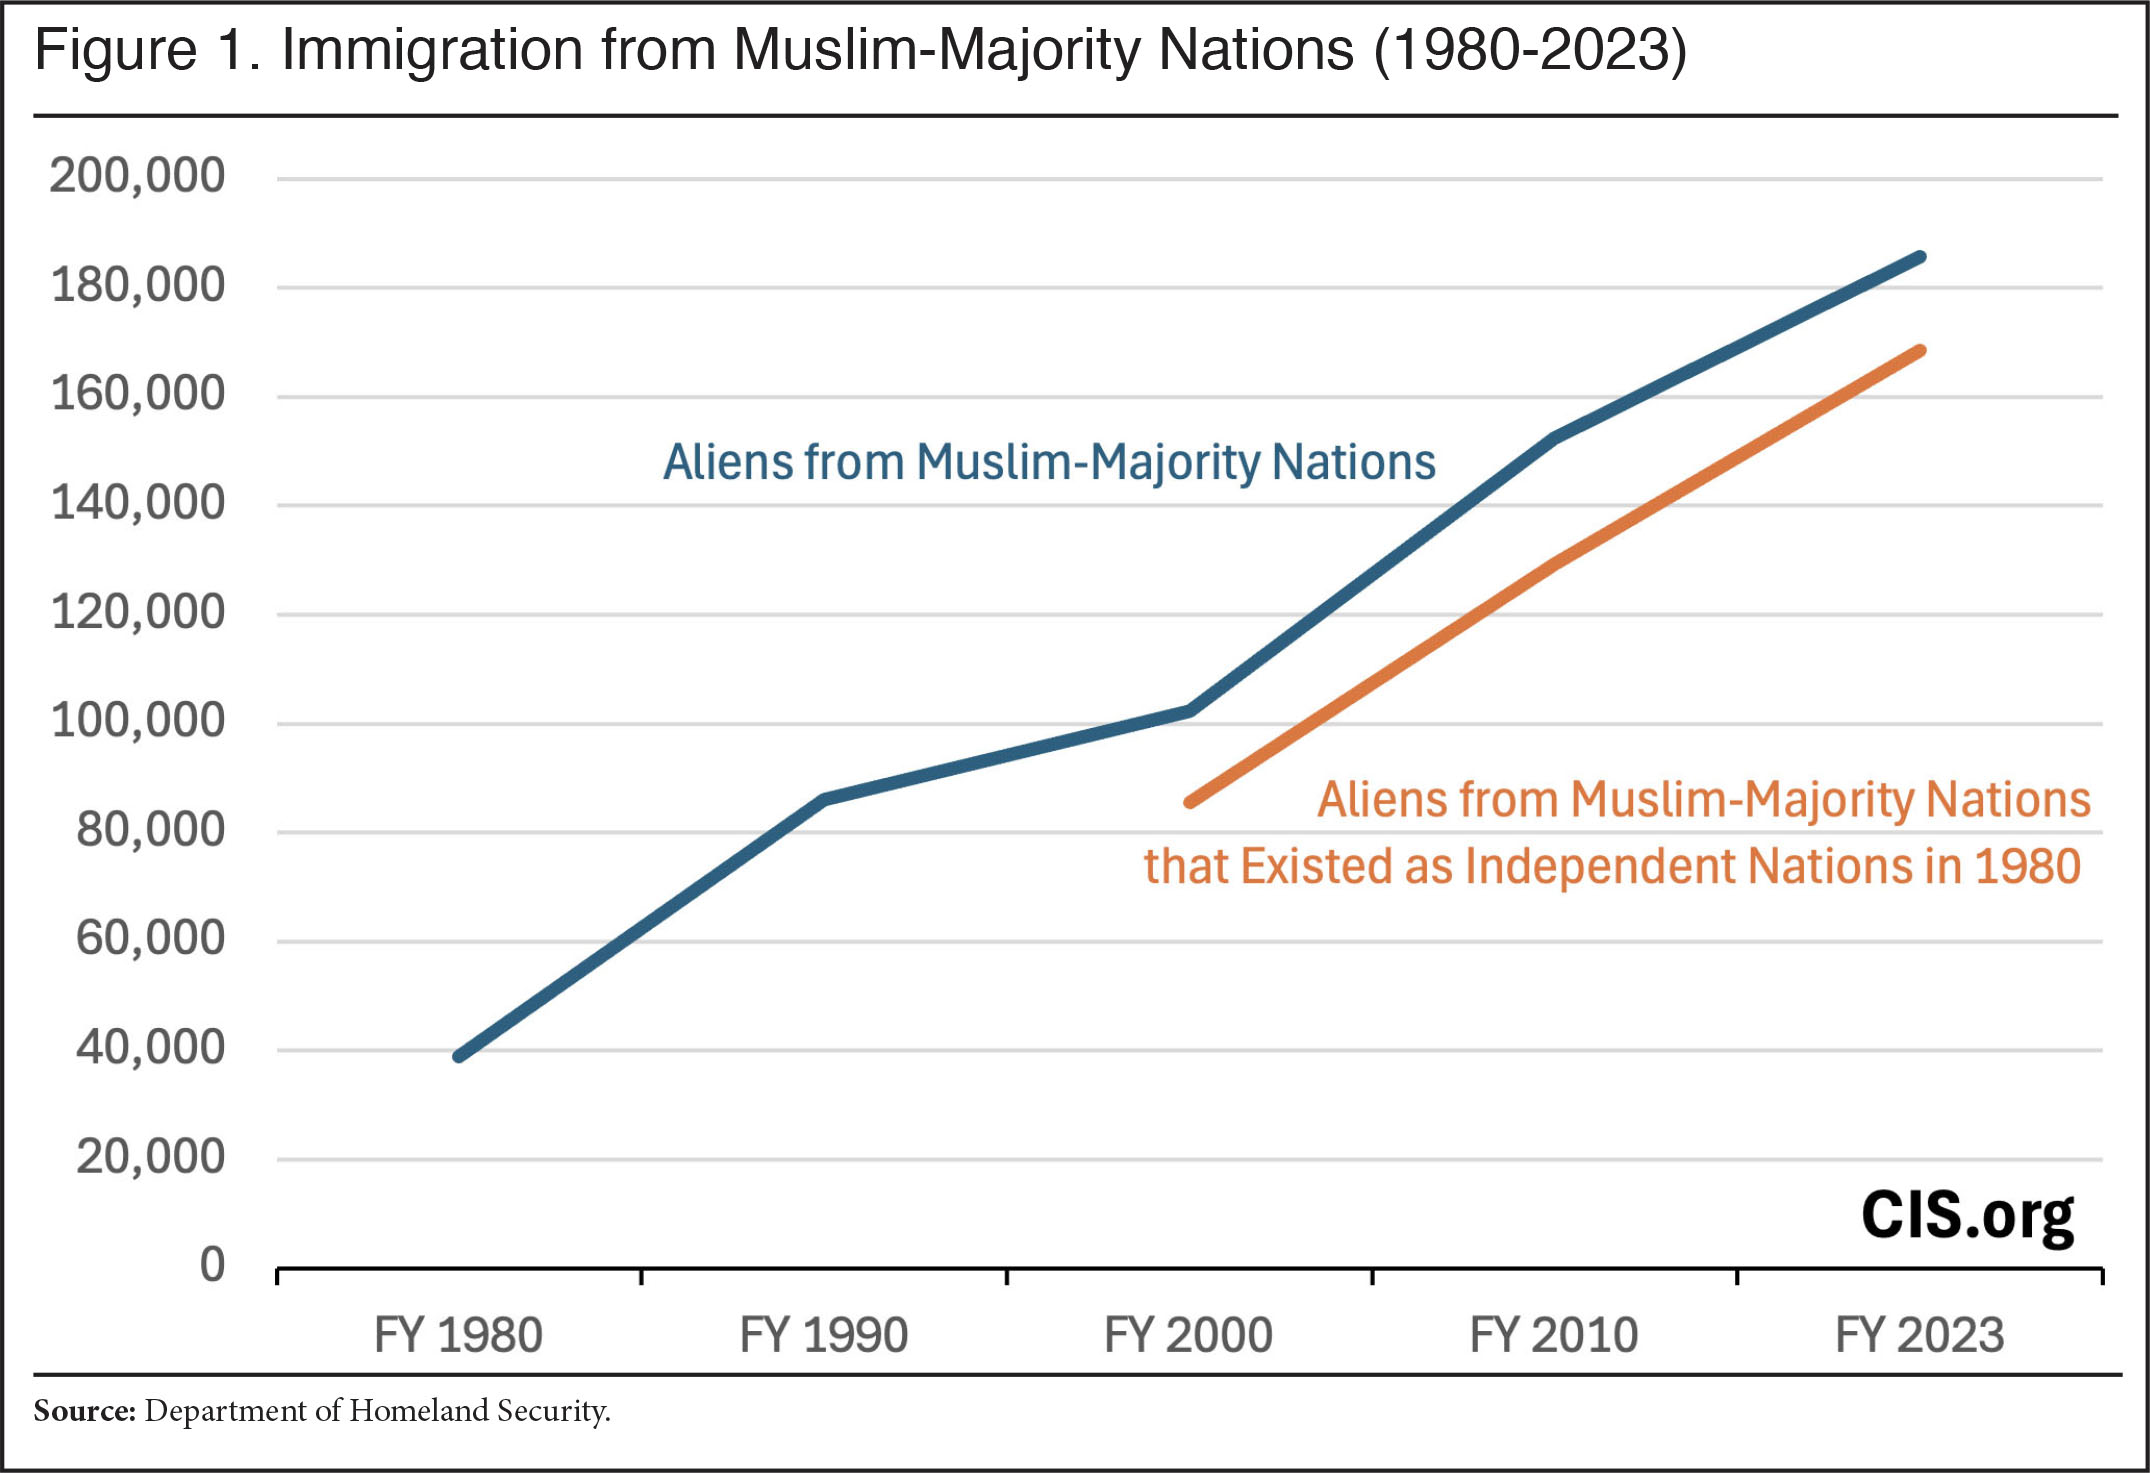
Annual Immigration from Muslim-Majority Nations
In FY 2000, the United States granted lawful permanent residence (LPR status) to 102,365 aliens born in 44 Muslim-majority countries. By FY 2023, the number had increased to 185,730, representing an 81 percent increase.
In FY 1980, the U.S. granted LPR status to 38,863 aliens born in Muslim-majority countries. Thus, the number increased by 378 percent from 1980 to 2023. Of 2023’s 185,730, 168,430 came from countries that existed as independent nations in 1980 and for which figures from that year are publicly available. If only immigrants from these countries are counted toward the 2023 total, the increase from 1980 would be 333 percent.
In 1980, immigrants from Muslim-majority countries constituted 7.3 percent of persons granted LPR status that year. By 2023, their proportion increased to 15.8 percent (14.4 percent if limited to immigrants from those Muslim-majority countries that existed as independent nations in 1980 and for which figures from that year are available). It should be noted that back in 1980 there were very few people coming from Bosnia and Herzegovina, and the former republics of the USSR in central Asia that comprise most the newly independent Muslim countries.
For country-by-country data, see here.
 |
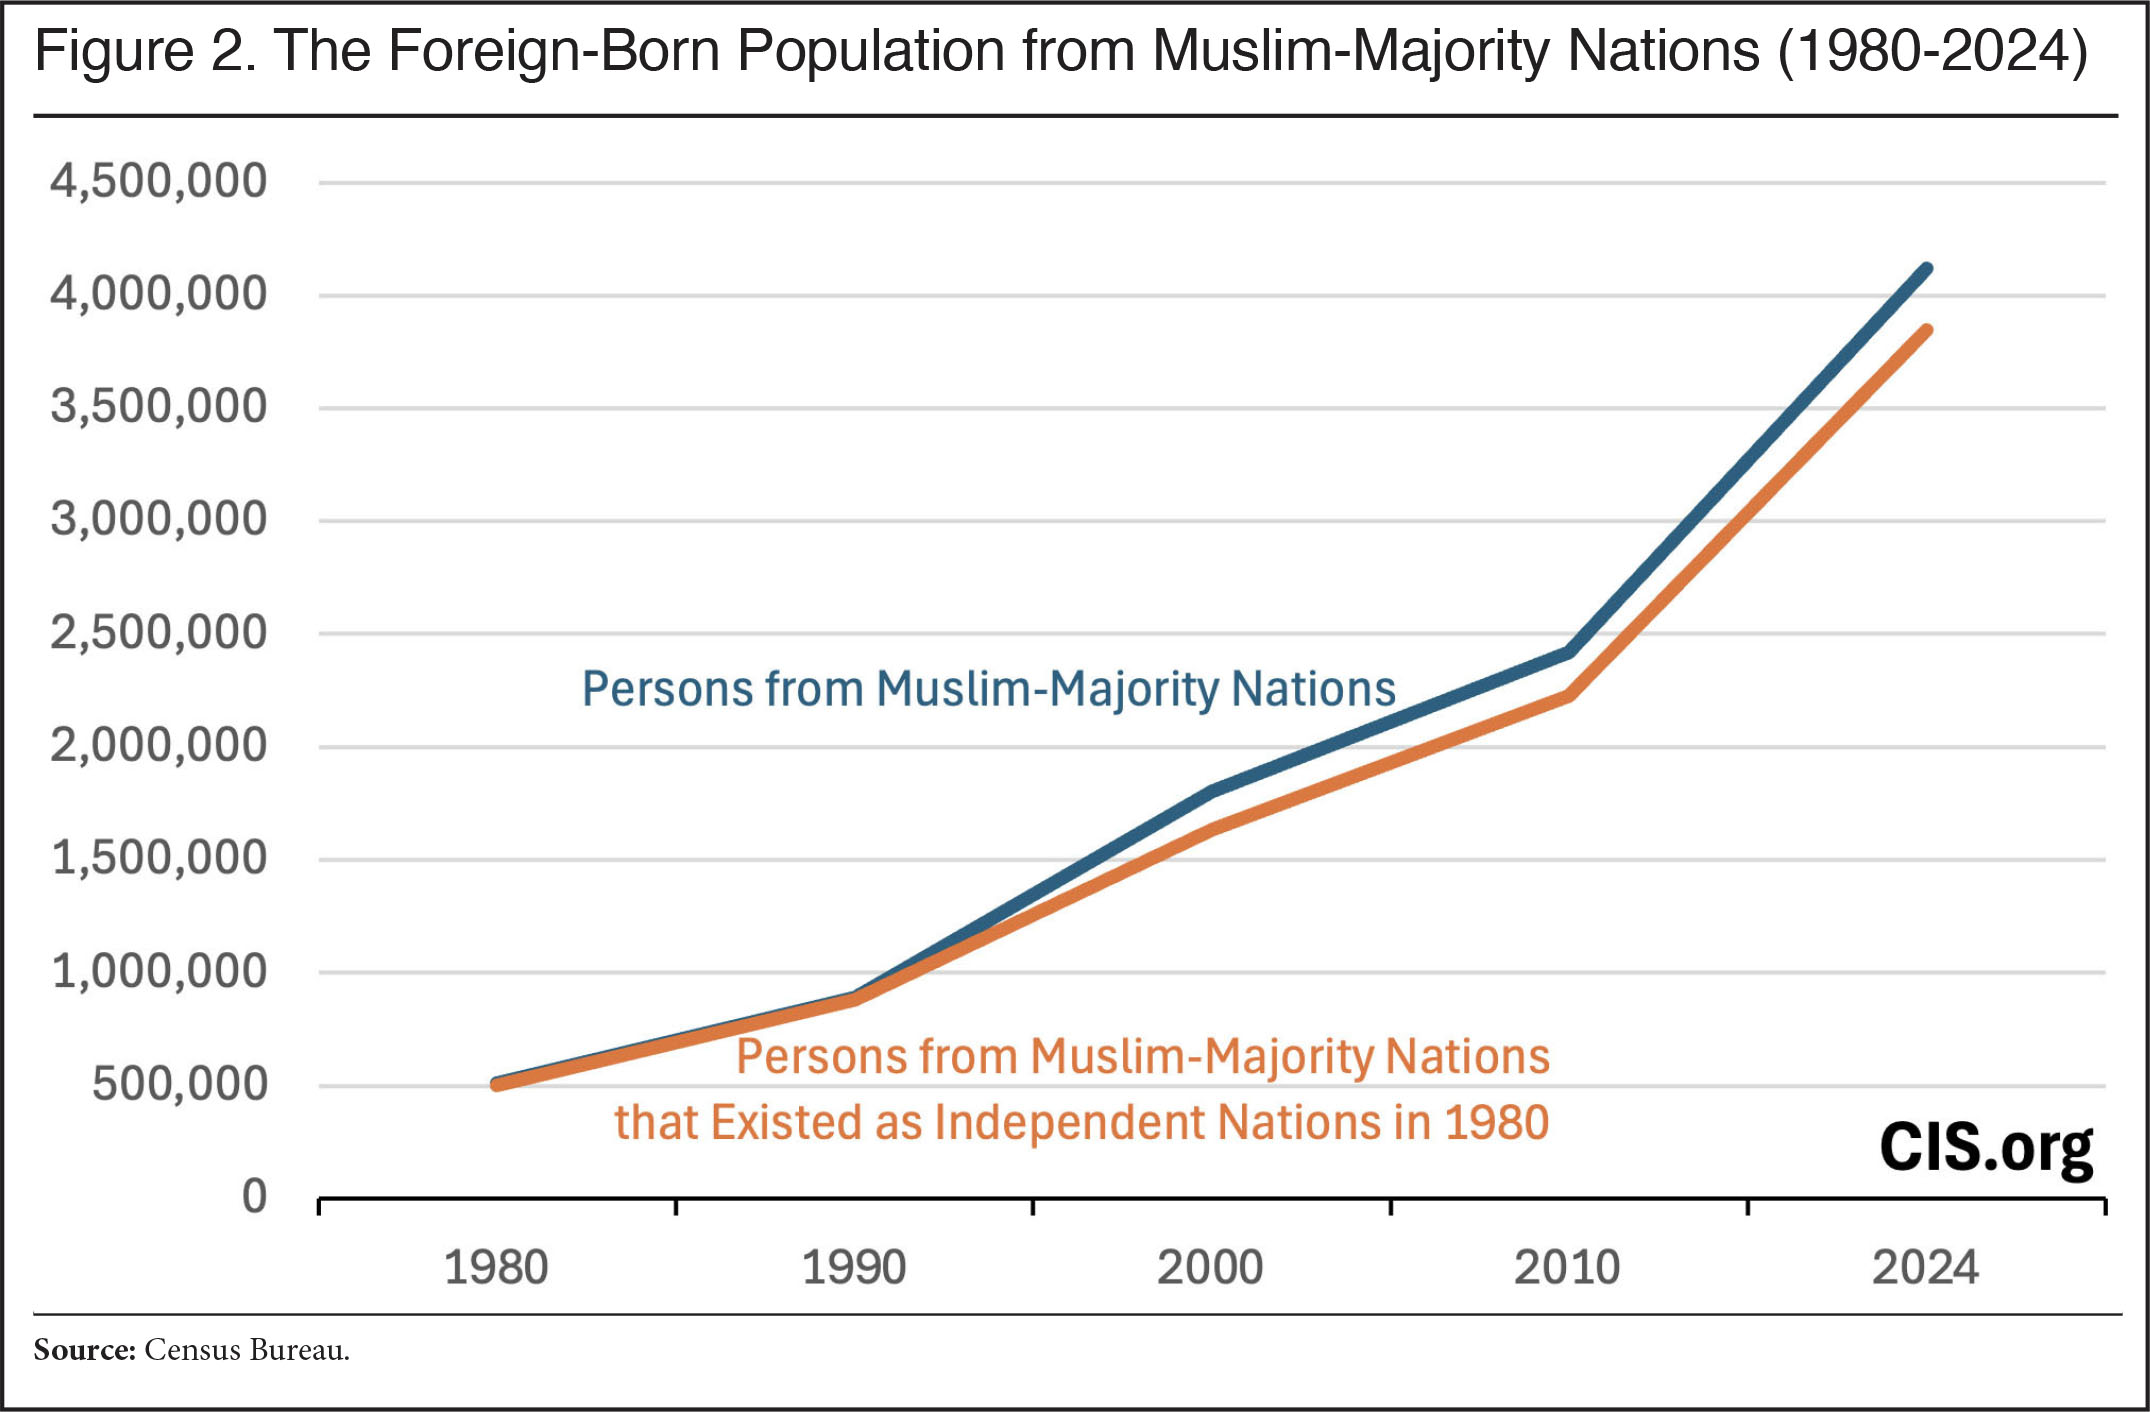
The Total Foreign-Born Population from Muslim-Majority Nations
The U.S. Census Bureau explains that “The resident population counts include all people (citizens and noncitizens) who are living in the United States at the time of the census.” In 2000 there were 1,805,232 foreign-born persons from Muslim-majority countries residing in the United States. By 2024, the number had increased to 4,117,583, representing a 128 percent increase.
In 1980, the number of foreign-born persons from Muslim-majority countries was 513,182. Thus, the number increased by 702 percent from 1980 to 2024.
Of 1980’s 513,182, 503,289 were born in countries for which figures from 2024 are publicly available. Of 2024’s 4,117,583, 3,846,620 were born in countries that existed as independent nations in 1980 and for which figures from that year are publicly available. If only foreign-born persons from countries that existed as independent nations in 1980 and for which figures from 1980 are publicly available are counted toward the 2024 total, and if only foreign-born persons from countries for which figures from 2024 are publicly available are counted toward the 1980 total, the increase from 1980 would be 664 percent.
In 1980, foreign-born persons from Muslim-majority countries constituted 3.6 percent of the total foreign-born population (and they also constituted 3.6 percent if limited to the foreign-born from Muslim-majority countries for which figures from 2024 are available). By 2024, their proportion increased to 8.2 percent (7.7 percent if limited to the foreign-born from Muslim-majority countries that existed as independent countries in 1980 and for which figures from that year are available).
For country-by-country data, see here.
 |
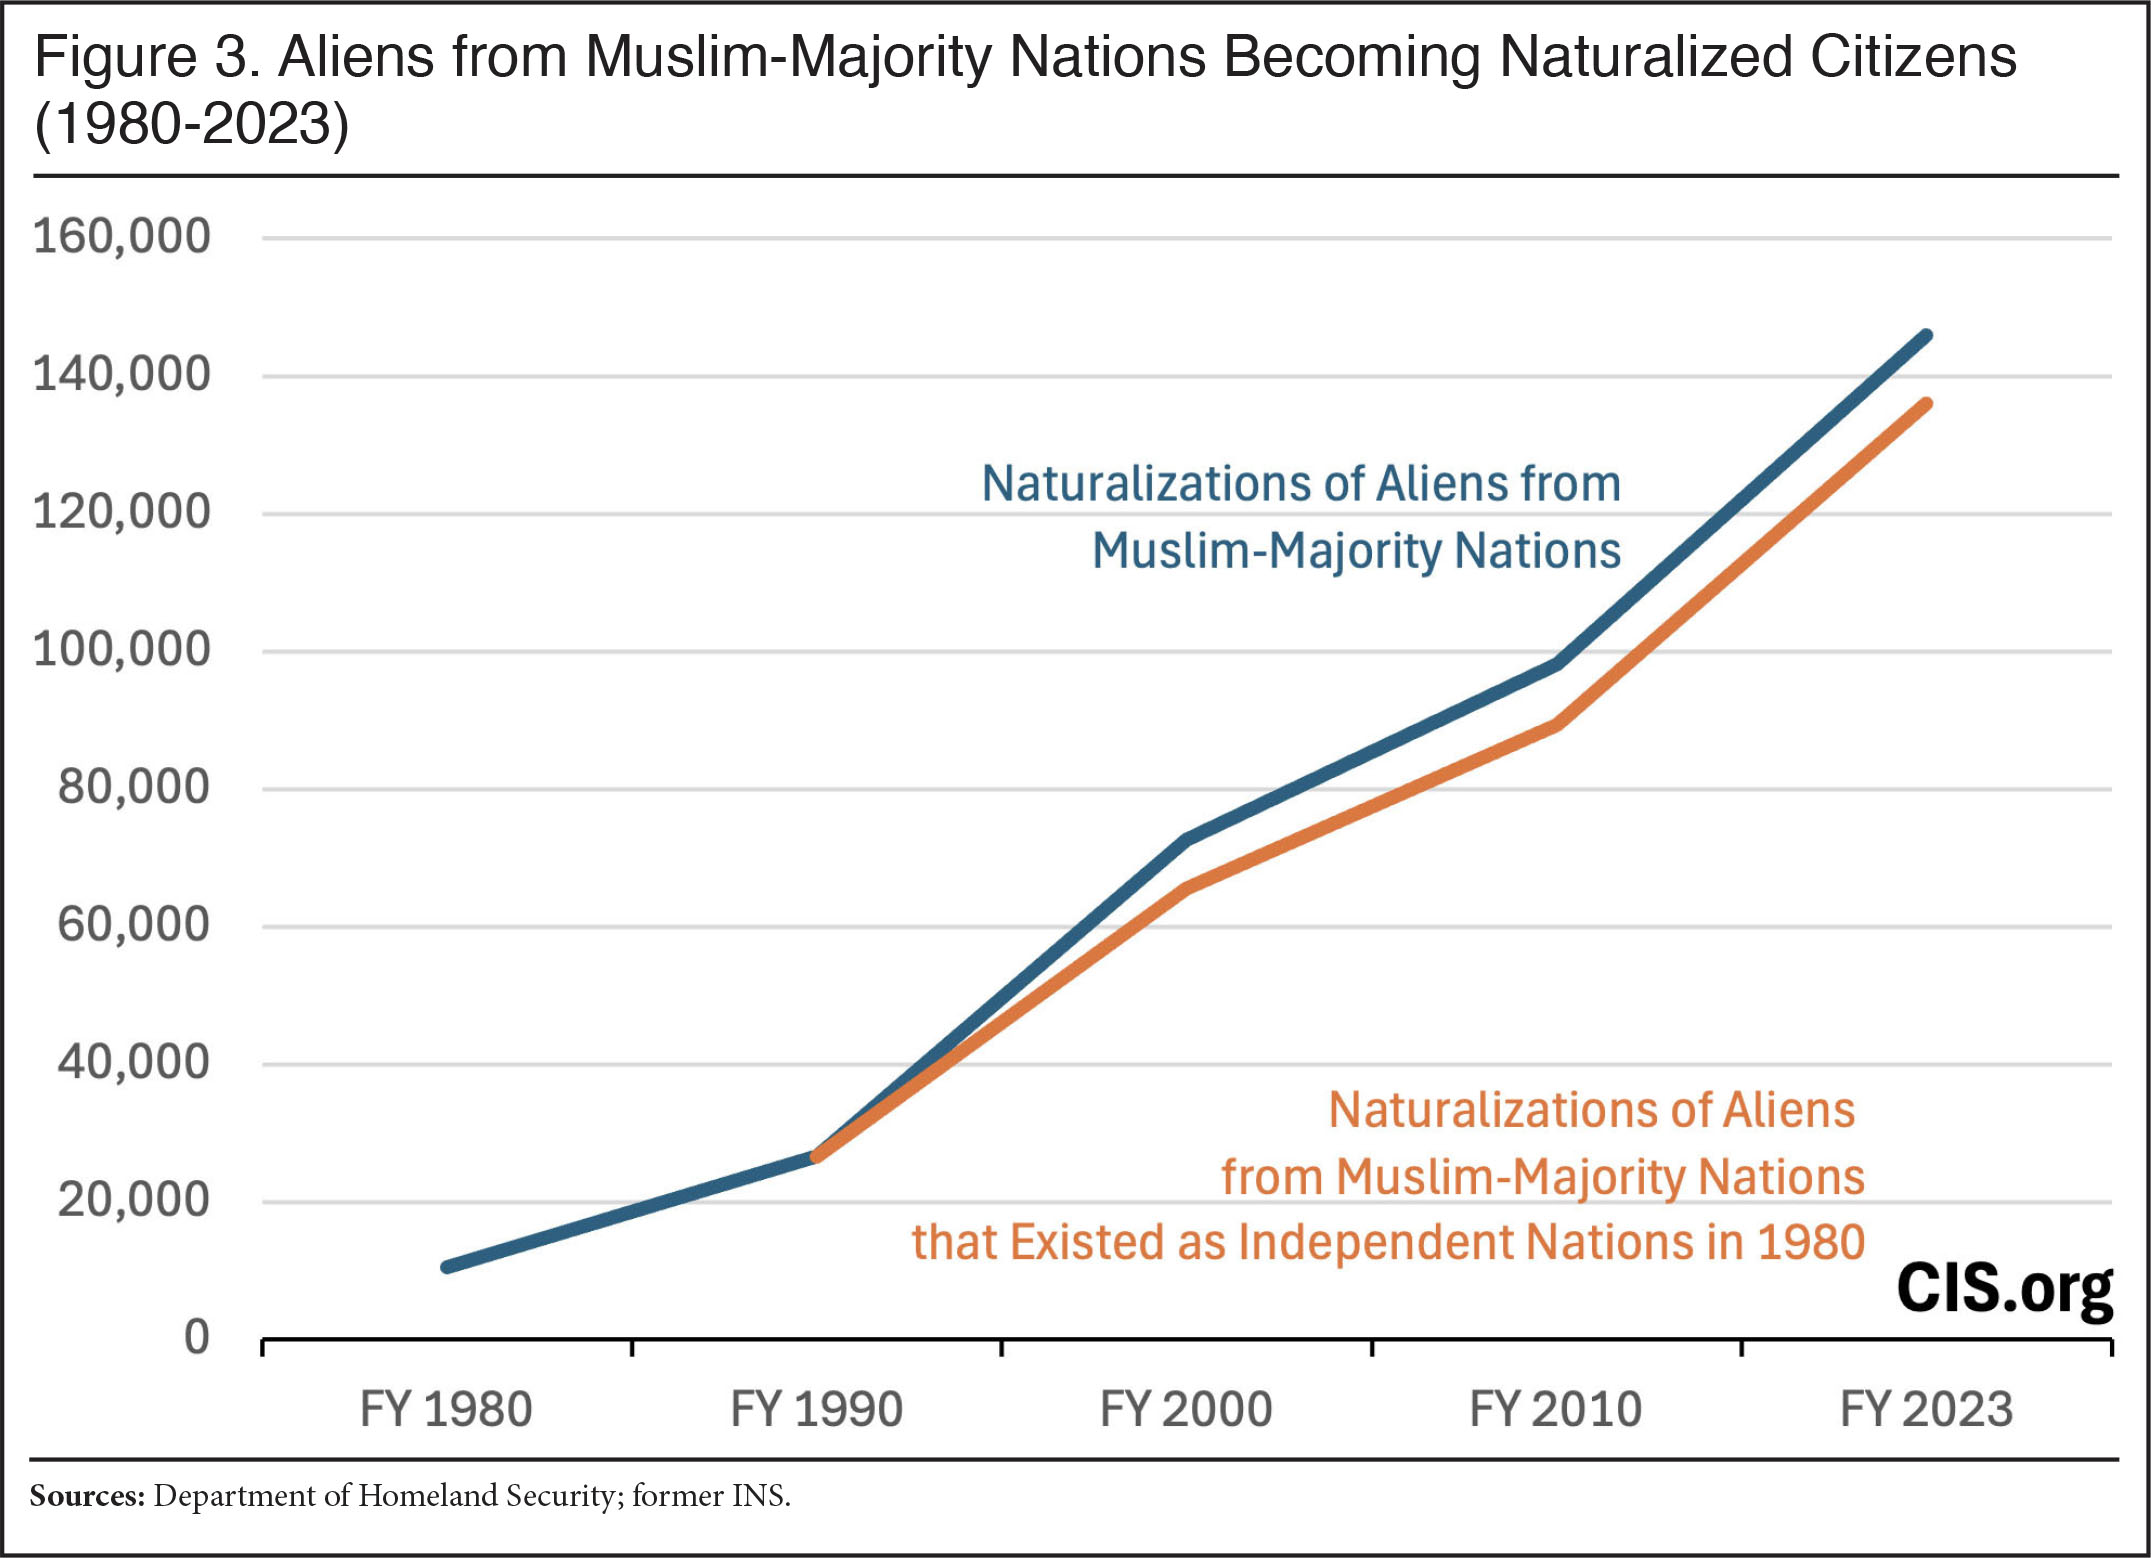
Aliens from Muslim-Majority Nations Becoming Naturalized Citizens
In FY 2000, 72,581 aliens whose countries of last allegiance were Muslim-majority countries became naturalized citizens. By FY 2023, the number who were born in Muslim-majority countries had increased to 145,950, representing a 101 percent increase.
In FY 1980, 10,530 aliens whose countries of last allegiance were Muslim-majority countries were naturalized. Thus, the number increased by 1,286 percent from 1980 to 2023. Of 2023’s 145,950 who were born in Muslim-Majority countries, 136,030 were from countries that existed as independent nations in 1980 and for which figures from that year are available. If only naturalizations of aliens from these countries are counted toward the 2024 total, the increase from 1980 would be 1,192 percent.
In FY 1980, aliens whose countries of last allegiance were Muslim-majority countries constituted 6.7 percent of all aliens naturalized that year. By 2023, the proportion of aliens born in Muslim-majority countries increased to 16.6 percent (or 15.5 percent if limited to aliens naturalized from Muslim-majority countries that existed as independent countries in 1980 and for which figures from that year are available).
For country-by-country data, see here.
 |
Muslim-Majority Nations
The following list of 44 Muslim-majority nations does not include those whose population was smallest (Brunei, Comoros, Maldives, Mayotte, and Western Sahara), ranked by the estimated proportion of their population that is Muslim. Some 80 percent of the world's Muslims live in these countries. (As the list below shows, some Muslim-majority countries have sizeable non-Muslim minorities; likewise other countries, such as India, China, and Russia, have substantial Muslim minorities.) The figures generally come from the Central Intelligence Agency’s “2020 World Fact Book” with the year in parentheses representing the year of the estimate (if given). For a number of countries, the estimate comes from the Pew Research Center’s “Religious Composition by Country, 2010-2020” .
- Mauritania — 100%
- Somalia — 99.9% (Pew, 2020)
- Turkey — 99.8%
- Afghanistan — 99.7% (2009)
- Iraq — 99.5% (Pew, 2020)
- Iran — 99.4% (2011)
- Niger — 99.3% (2012)
- Tunisia — 99.1%
- Yemen — 99.1% (2010)
- Algeria — 99% (2012)
- Morocco — 99% (2010)
- Sudan — 98.9% (Pew, 2020)
- Tajikistan — 98% (2014)
- Jordan — 97.2% (2010)
- Azerbaijan — 96.9% (2010)
- Libya — 96.6% (2010)
- Pakistan — 96.4% (2010)
- Senegal — 95.9% (2016)
- The Gambia — 95.7% (2013)
- Syria — 94.2% (Pew, 2020)
- Djibouti — 94%
- Mali — 93.9% (2018)
- Saudi Arabia — 92.7% (Pew, 2020; encompassing the entire population, of which about 62 percent are citizen Saudis, the rest being immigrants)
- Egypt — 90% (2015)
- Kyrgyzstan — 90% (2017)
- Bangladesh — 89.1% (2013)
- Guinea — 89.1% (2014)
- Turkmenistan — 89%
- Uzbekistan — 88%
- Indonesia — 87.2% (2010)
- Oman — 85.9% (2010; encompassing the entire population, of which about 56 percent are citizen Omanis, the rest being immigrants)
- Sierra Leone — 78.6% (2013)
- United Arab Emirates — 76%; encompassing the entire population, of which about 12 percent are citizen Emiratis, the rest being immigrants)
- Kuwait — 74.6% (2013; encompassing the entire population, of which about 31 percent are citizen Kuwaitis, the rest being immigrants)
- Bahrain — 73.7% (2017; encompassing the entire population, of which about 52 percent are citizen Bahrainis, the rest being immigrants)
- Kazakhstan — 70.2% (2009)
- Qatar — 67.7% (2010)
- Burkina Faso — 61.5% (2010)
- Malaysia — 61.3% (2010)
- Lebanon — 61.1% (2018)
- Albania — 56.7% (2011)
- Nigeria — 53.5% (2018)
- Chad — 52.1% (2014-15)
- Bosnia and Herzegovina — 50.7% (2013)
Appendix A: Sources
Immigration from Muslim-Majority Nations
“2023 Yearbook of Immigration Statistics”, Office of Homeland Security Statistics (OHSS), Department of Homeland Security (DHS), Table 3, country of birth, accessed March 15, 2026; “2010 Yearbook of Immigration Statistics”, OHSS, DHS, at p. 27 (Table 10, country of birth), August 2011.
“2000 Statistical Yearbook of the Immigration and Naturalization Service”, Immigration and Naturalization Service (INS), U.S. Department of Justice (DOJ), at p. 40 (Table 7, country of birth), September 2002; “1996 Statistical Yearbook of the Immigration and Naturalization Service”, INS, DOJ, at p. 30 (Table 3, country of birth), October 1997; “1980 Statistical Yearbook of the Immigration and Naturalization Service”, INS, DOJ, at p. 15 (Table 6, country of birth), undated.
The Foreign-Born Population from Muslim-Majority Nations
“Place of Birth for the Foreign-Born Population [2024] in the United States”, U.S. Census Bureau (USCB) (American Community Survey, 1-Year Estimates Detailed Tables, Table B05006), accessed March 15, 2026; ”Places of Birth for the Foreign-Born Population [2010] in the United States”, USCB (American Community Survey, 1-Year Estimates Detailed Tables, Table B05006, accessed March 15, 2026.
Campbel Gibson and Kay Jung, “Historical Census Statistics on the Foreign-Born Population in the United States: 1850 to 2000”, USCB, Population Division Working Paper No. 81, at p. 28 (Table 3, country of birth), February 2006.
Aliens from Muslim-Majority Nations Becoming Naturalized Citizens
“2023 Yearbook of Immigration Statistics”, OHSS, DHS, (Table 21, country of birth); “2010 Yearbook of Immigration Statistics”, OHSS, DHS, at p. 53 (Table 21, country of birth).
“2000 Statistical Yearbook of the Immigration and Naturalization Service” 204 (table 48) (country of former allegiance); INS, DOJ, “1996 Statistical Yearbook of the Immigration and Naturalization Service” at p. 150 (Table 47, country of former allegiance); “1980 Statistical Yearbook of the Immigration and Naturalization Service”, INS, DOJ, at p. 61 (Table 26, country of former allegiance).
Appendix B: Data Limitations
As to naturalization data, the “2000 Statistical Yearbook of the Immigration and Naturalization Service” explained that:
Data on naturalization shown in the INS Statistical Yearbook are obtained from information reported on Form N-400, the application for naturalization for persons ages 18 and over. Until 1998, the data also included information from Form N-600, the application for certificate of citizenship for children. The N-600 is optional and used to provide evidence of citizenship for children under age 18 who automatically derive or acquire citizenship through their parents. The N-600 data may have represented as many as 3 to 4 percent of the naturalizations reported annually through 1997.
Aliens who become U.S. citizens through the legislative process also are not covered in the naturalization data collected by the INS. A recent example of the legislative procedure occurred upon the dissolution of the Trust Territory of the Pacific through which the Northern Mariana Islands became a commonwealth of the United States, making its residents U.S. citizens.
The 2000 naturalization data do not necessarily reflect the demand to naturalize because of the backlog of applications pending a decision. The demographic characteristics of aliens whose cases were in the backlog are unknown.
In addition, the number of cases with missing data has increased since 1995. This is largely because the Central Index System (CIS), the source of data for approximately 8 percent to 10 percent of all naturalization records, does not maintain information on state and metropolitan area of intended residence, marital status, occupation, provision of naturalization law, country of former allegiance, and gender in some instances. Cases with information supplied by the CIS come from areas where INS offices use manual coding systems, that is primarily states and metropolitan areas with low concentrations of immigrants.
As for data on the foreign-born, Campbell Gibson and Kay Jung explained in “Historical Census Statistics on the Foreign-Born Population in the United States: 1850 to 2000” that “individuals who were born in a foreign country, but who had at least one parent who was an American citizen, have been defined as native rather than as foreign born.” They also explained that “For 1950 to 2000, data on nativity were based on a sample of the total population ranging from about 1 in 4 in 1960 to about 1 in 6 in 1990 and 2000.” They elaborated that:
The data contained in this paper are partially based on a sample of households or persons that responded to the census long form. As a result, the sample estimates may differ somewhat from the 100 percent figures that would have been obtained if all housing units, people within those housing units, and people living in group quarters had been enumerated using the same questionnaires, instructions, enumerators, and so forth. The sample estimates also differ from the values that would have been obtained from different samples of housing units, and hence of people living in those housing units, and people living in group quarters. …
The sampling variability … is low because the data are for the United States as a whole, for states, and for large metropolitan areas and cities and thus are based on relatively large numbers of sample cases.