Download a PDF of this Backgrounder.
Steven A. Camarota is the director of research and Karen Zeigler is a demographer at the Center.
The argument that the United States desperately needs immigration because Americans are not having "enough" children is a common theme of opinion pieces and even news coverage. However, the latest data from the Census Bureau's 2019 American Community Survey shows that the fertility of both native-born and immigrant women (also referred to as the foreign-born) continues to decline, with the fall-off being more pronounced among immigrants. In fact, 2019 was the first year in which immigrant fertility (legal and illegal together) dropped below replacement level — 2.1 children per woman on average. As a result, the presence of immigrants in the country has only a modest impact on overall fertility. We also find some evidence that the presence of immigrants may lower the fertility of native-born women, further reducing immigration's ability to increase overall U.S. fertility. (Figures reflect conditions through mid-2019, before Covid-19.)
Among the findings:
- Total fertility rate (TFR), which is the average number of children a woman will have in her lifetime given current trends, fell to 2.02 children for immigrants — below the 2.1 necessary to replace the existing population. This means that, in the long-run, immigration may add to population aging.
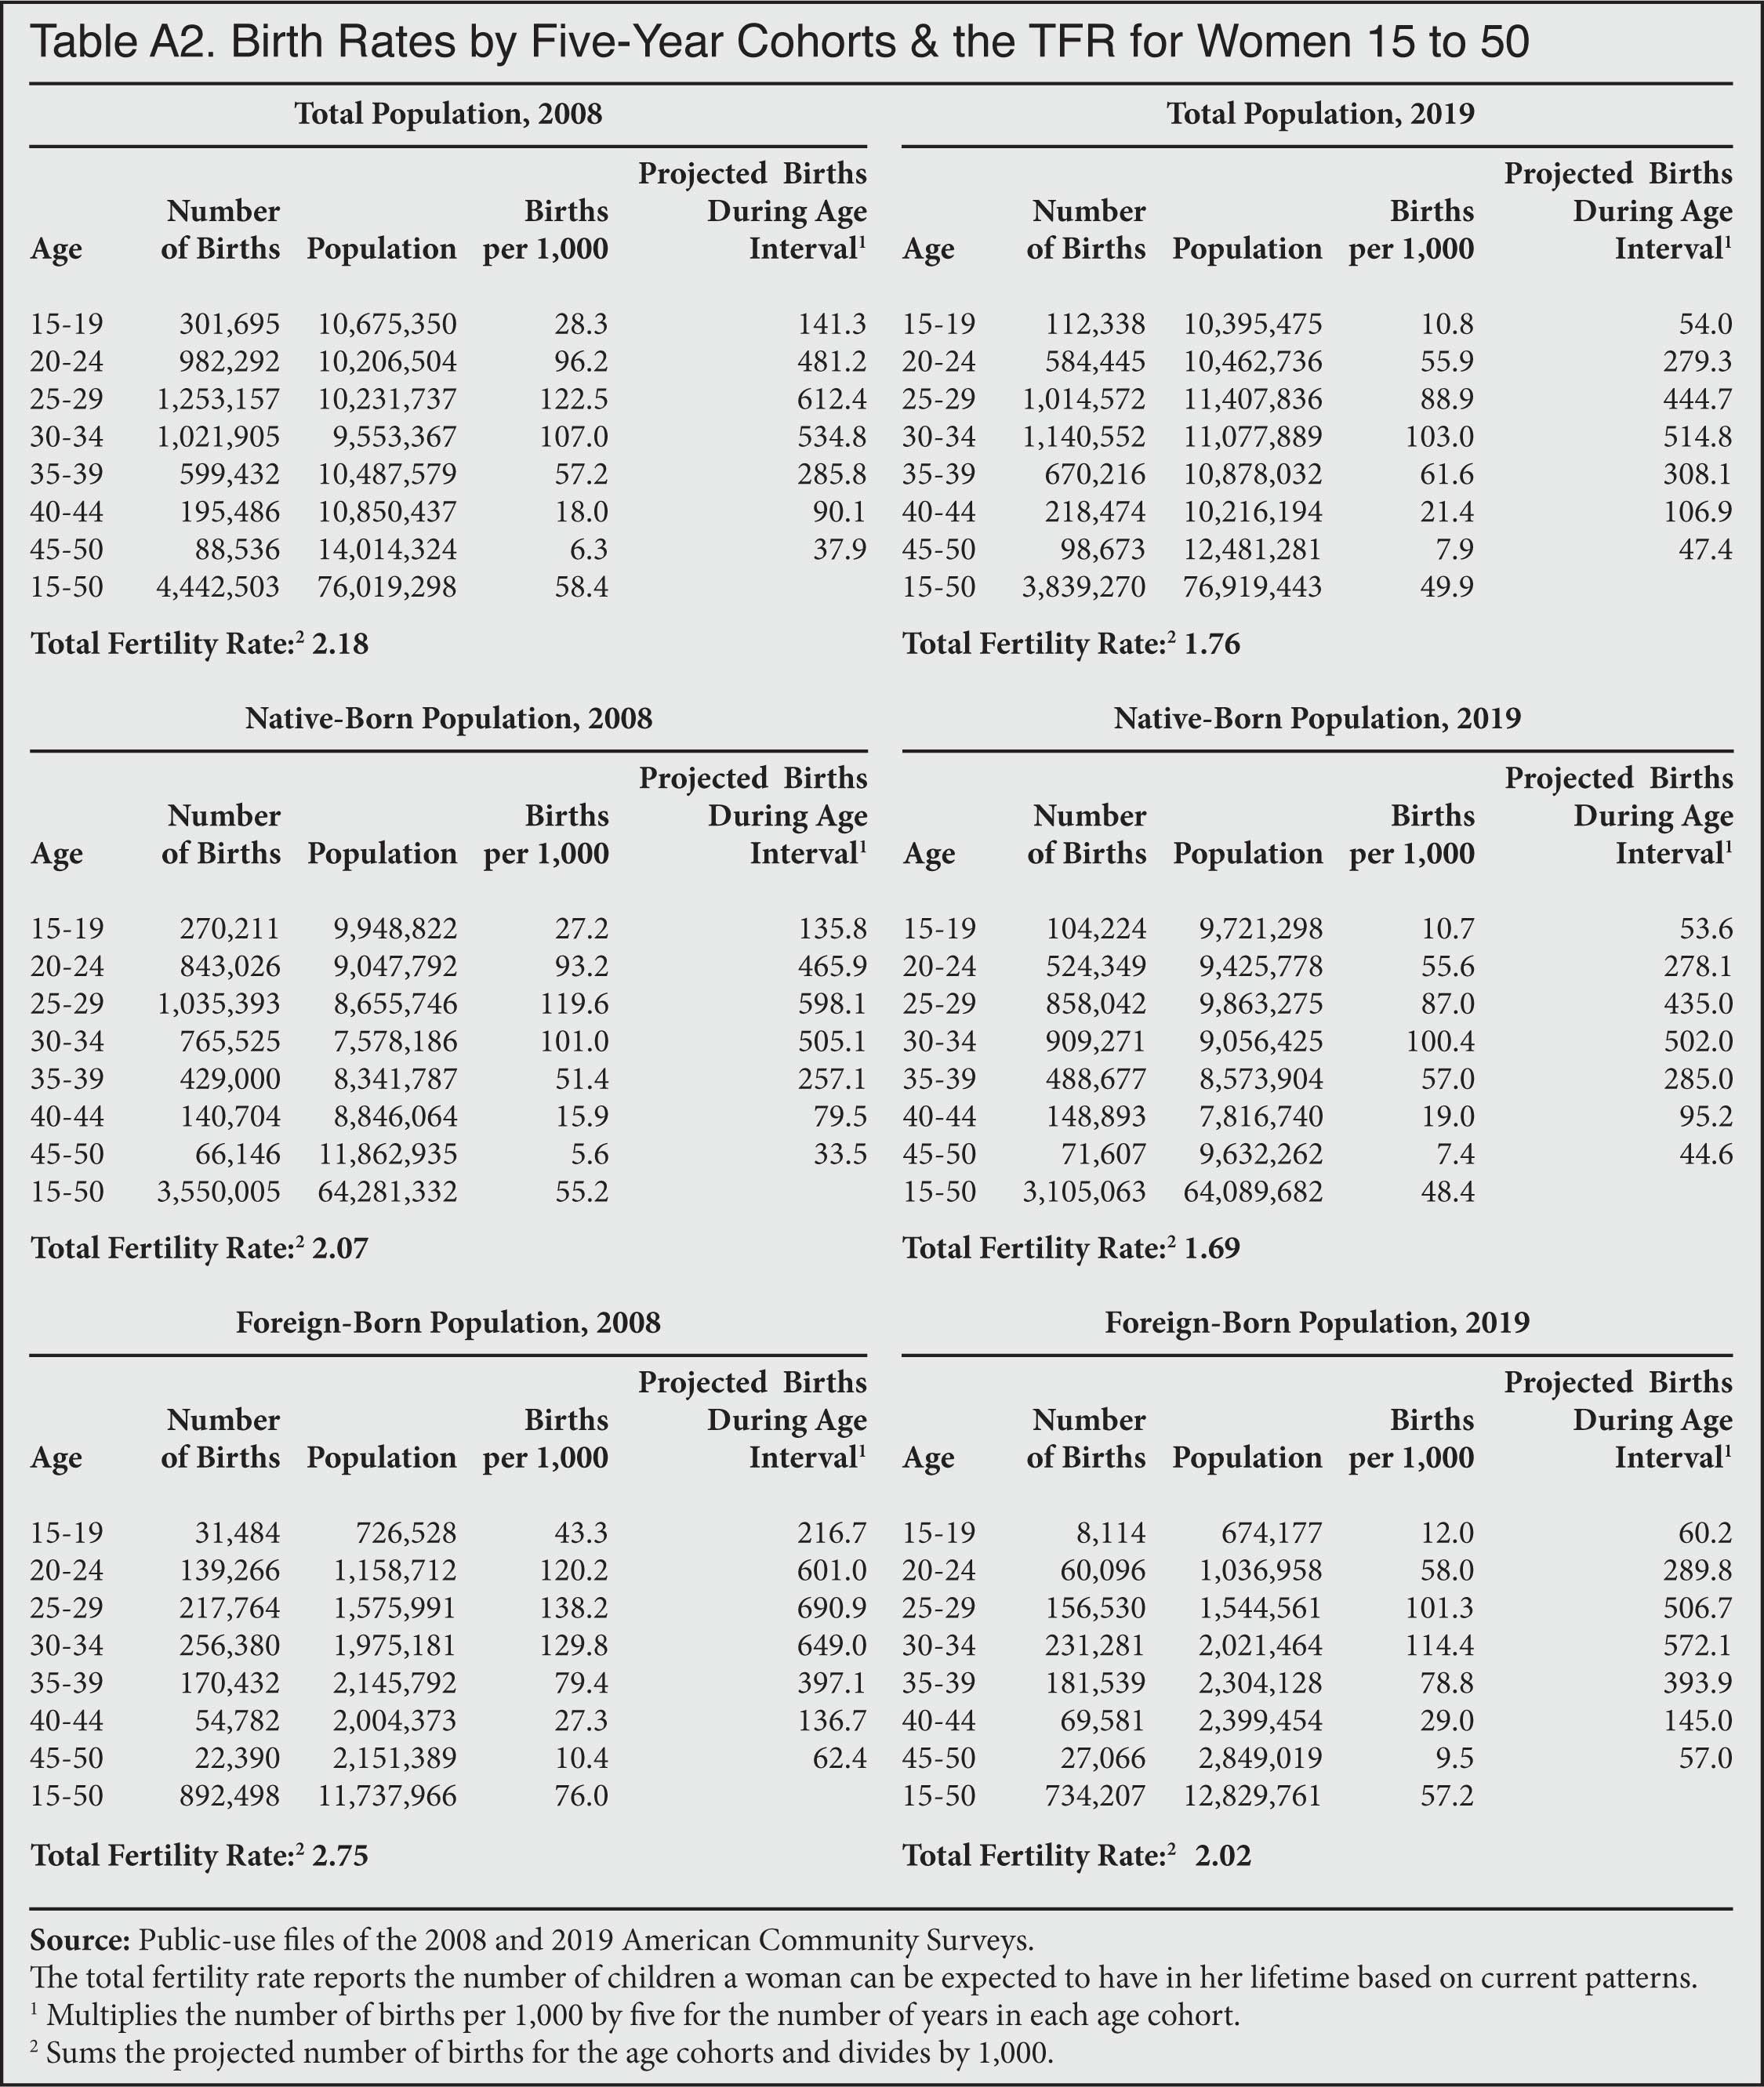
- Immigrant fertility has declined more rapidly than that of native-born women. In 2008, immigrant women had a TFR of 2.75 children; by 2019 it had fallen to 2.02 — a 0.73-child decline. For native-born women, it declined from 2.07 to 1.69 — a 0.38-child decline.
- The TFR for all women (immigrant and native-born) in America in 2019 was 1.76. Excluding immigrants, it would be 1.69 — the rate for natives. The difference is .06 children, or a 4 percent increase in overall TFR in the United States.
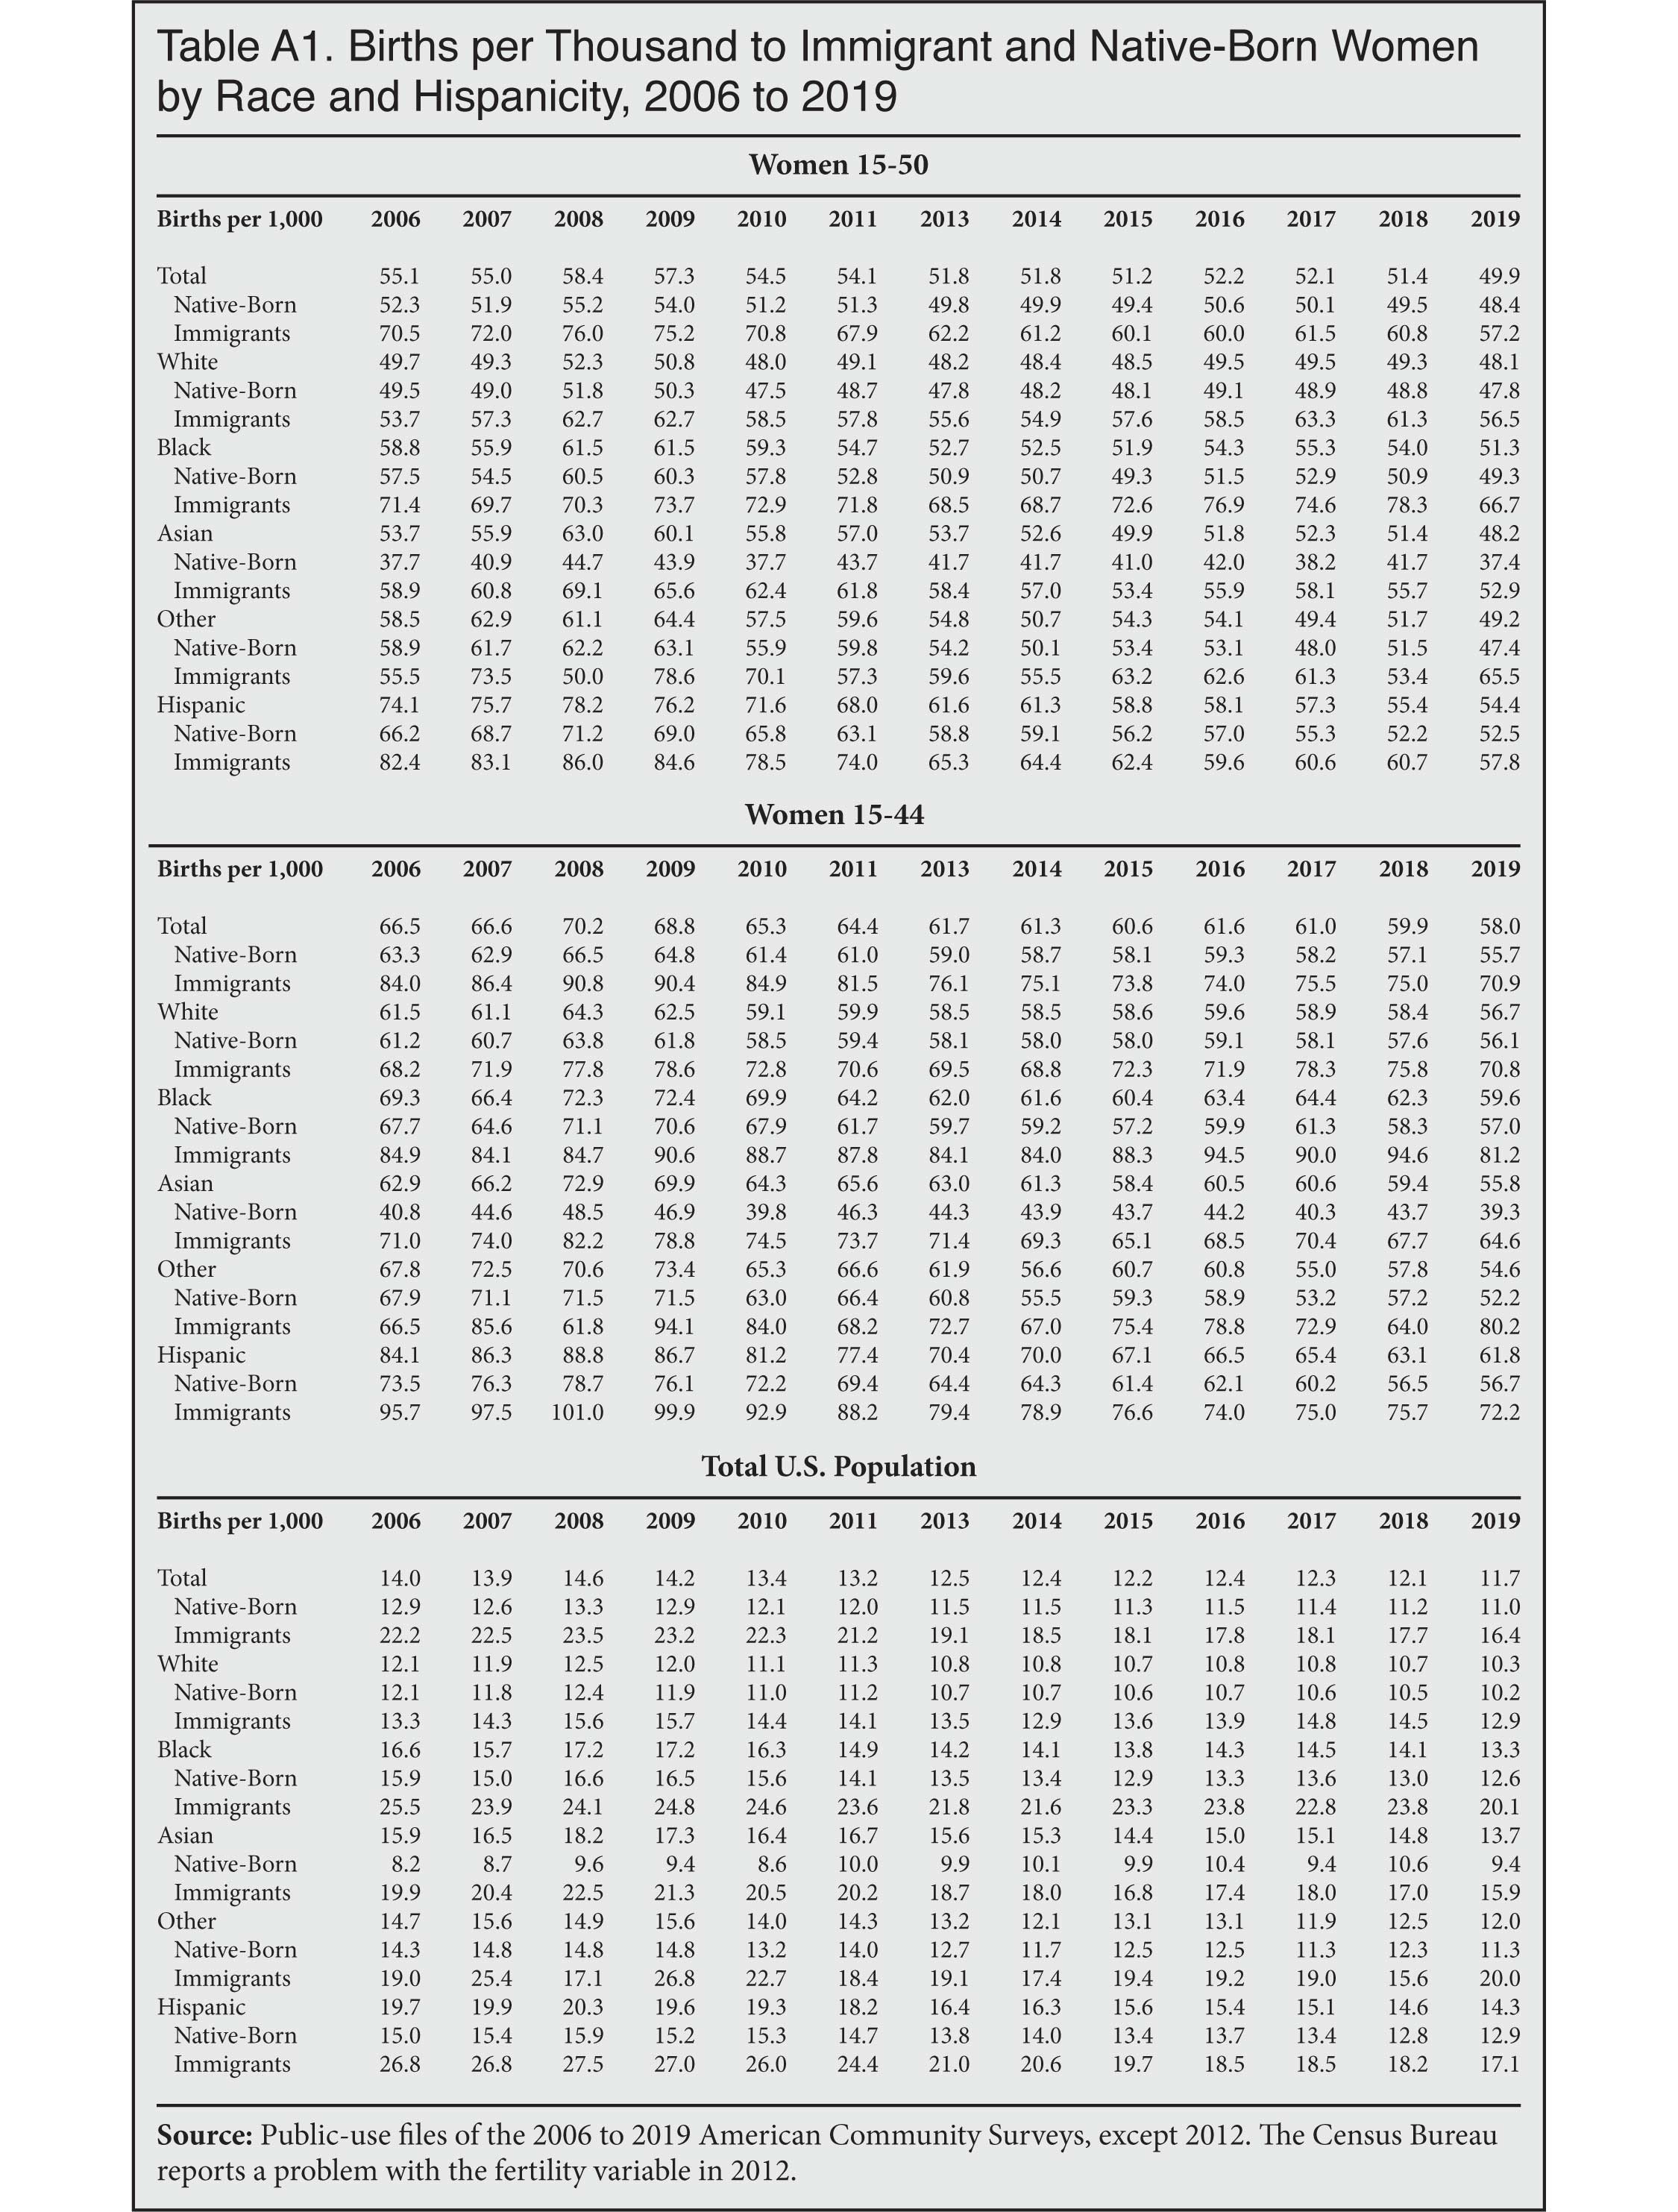
- Measuring fertility by births per thousand also shows that fertility fell more dramatically for immigrant women of reproductive age (15-50), from 76 births per thousand in 2008 to 57 births per thousand in 2019 — a decline of 19 births per thousand. In contrast, native fertility declined from 55 births per thousand to 48 births per thousand in the same time period — a decline of seven births per thousand.
- Even if the number of immigrant women ages 15-50 doubled, along with births to this population, it would still only raise the overall national birth rate for women by an additional one birth per thousand, or by 2.1 percent.1
- Immigration has a minor impact because the difference between immigrant and native fertility is too small to significantly change the nation's overall birth rate.
- Immigration can also add to population aging in the long-term because the fertility for every major racial/ethnic group sending large numbers of immigrants is below replacement level among the native-born generation. In 2019, about three-fourths of immigrant women in their reproductive years were either Hispanic or Asian. The TFRs of native-born Hispanic and Asian women in 2019 were 1.77 and 1.42 respectively — both well below replacement level.
- There is some evidence that immigration reduces native fertility. We find that in larger metropolitan areas, the higher the immigrant share of the population, the fewer children native-born women have. This is the case even after controlling for age, education, income, race, marital status, and other factors.
- There are a number of possible reasons why immigration might lower the fertility of native-born Americans. It could be because it drives up housing costs for families with children, lowers wages for some American workers, or strains public services relied on by families, such as local schools. All of these factors may make American couples more reluctant to have children.
- Although immigration has only a small impact on overall fertility and aging, it has a significant impact on population size. For example, new immigrants and births to immigrants between 2000 and 2019 added 35.9 million people to the country — equal to more than three-fourths of U.S. population growth over this time period.2
Introduction
There is no question that America is aging due to both a decline in fertility rates and increases in life expectancy. Many advocates of immigration, like Jeb Bush, argue that immigrants can fundamentally change this fact, partly because "immigrants are more fertile." It is true that immigrants have more children on average than the native-born. But the American Community Survey collected by the U.S. Census Bureau shows that the impact of immigrants on the nation's overall fertility rate (native and immigrant together) is quite modest no matter how fertility is measured. Therefore, it would be incorrect to argue that the fertility of immigrants "rebuilds the demographic pyramid", as Bush argued in 2013.3 Further, immigrant fertility is falling, so the impact of immigration on aging is falling as well. We use the term immigrant in this analysis to mean all persons who were not U.S. citizens at birth. This includes naturalized American citizens, legal permanent residents (green card holders), illegal immigrants, and long-term visitors such as guestworkers and foreign students captured by the survey. The U.S. Census Bureau and other government agencies typically refer to this population as the "foreign-born". We use the terms "immigrant" and "foreign-born" synonymously in this report.
Demographers, the people who study human populations, have long known that immigration has only a small impact on the aging of low-fertility countries like the United States. In an important 1992 article in Demography, the leading academic journal in the field, economist Carl Schmertmann explained that, mathematically, "constant inflows of immigrants, even at relatively young ages, do not necessarily rejuvenate low-fertility populations. In fact, immigration may even contribute to population aging." The Census Bureau also concluded in projections done in 2000 that immigration is a "highly inefficient" means for increasing the percentage of the population that is of working-age in the long run. Thomas Espenshade, the former chairman of Princeton's sociology department and director of its graduate program in population studies, has observed, "the effect of alternative immigration levels on population age structure is small unless we are willing to entertain a volume of U.S. immigration of historic proportion."4
In two studies published by the Center for Immigration Studies, we also demonstrated the modest impact of immigration on slowing the aging of American society. The first examined immigration and aging retrospectively. We found that immigration between 1990 and 2017 added nearly 43 million people to the country, but the presence of these immigrants and their progeny only increased the working-age (16-64) share of the population from 63.9 percent to 64.4 percent in 2017.5 The second study, published in 2019, used the Census Bureau's 2017-based population projections out to 2060, varying the level of immigration, and also showed that immigration's impact on population aging, no matter how it is measured, is not large.6
In February 2020, several years after releasing its original 2017-based projections, the Census Bureau published alternative immigration scenarios based on the same fertility and mortality assumption as the 2017 projections. These projections show the U.S. population out to 2060 assuming different levels of immigration. The Bureau's alternative immigration projections produce very similar results to the Center's earlier projections that varied the immigration component, which is to be expected since our work was based directly on the Bureau's original projections. The only major difference between the Census Bureau findings and ours is how it conventionalizes a zero-net-immigration scenario.7 Nonetheless, comparing the Census Bureau's low and high immigration scenarios shows that immigration has a large impact on population size, but not on stopping the decline in the share of the U.S. population that is working-age or the share 65 and older.8
The Impact of Immigration on the Total Fertility Rate
One of the most common ways to measure fertility is the total fertility rate (TFR). The Census Bureau defines TFR as "the average number of children that would be born per woman if all women lived to the end of their childbearing years and bore children according to a given set of age-specific fertility rates."9 One way to think about the TFR is that it assumes that when women who are, for example, currently 20-24 move into the 25-29 age group, they will have the same fertility as women in that age group today. In other words, the TFR uses current fertility rates by age to estimate the fertility of today's women during their lifetimes. (Appendix Table A2 at the end of this report shows the calculations used to generate a TFR).
The assumption that younger women will have the same fertility as the current cohort of older women may, of course, turn out to be wrong. Experience has shown that, while not perfect, the TFR does a good job of measuring births to women in their childbearing years. The primary reason that the TFR is so often used in population studies is that it provides a shorthand way of looking at the fertility of all women in their reproductive years. As a general rule, it can be said that a TFR of at least 2.1 children per woman is necessary to maintain the current population in the long run — putting aside people entering or leaving a country. Hence a TFR of 2.1 is referred to as replacement-level fertility.10
This report uses the public-use files of the 2006 to 2019 American Community Surveys (ACS), excluding 2012. The ACS is ideally suited for studying immigrant and native fertility because the survey asks women 15-50 if they had a child in the last year and it also identifies both immigrants and the native-born.11 Figure 1 reports the TFR of immigrants and the native-born based on the public-use files of the American Community Survey (ACS). In 2008, immigrant women had a TFR of 2.75 children; by 2019 it had fallen to 2.02 — a 0.73-child decline. For native-born women, it declined from 2.07 to 1.69 — a 0.38-child decline. In fact, 2019 is almost certainly the first time in American History that immigrant fertility was below replacement level.12 While immigrant women still have higher fertility than the native-born, the difference is not that large. As a result, immigration only modestly increases overall fertility in the United States.
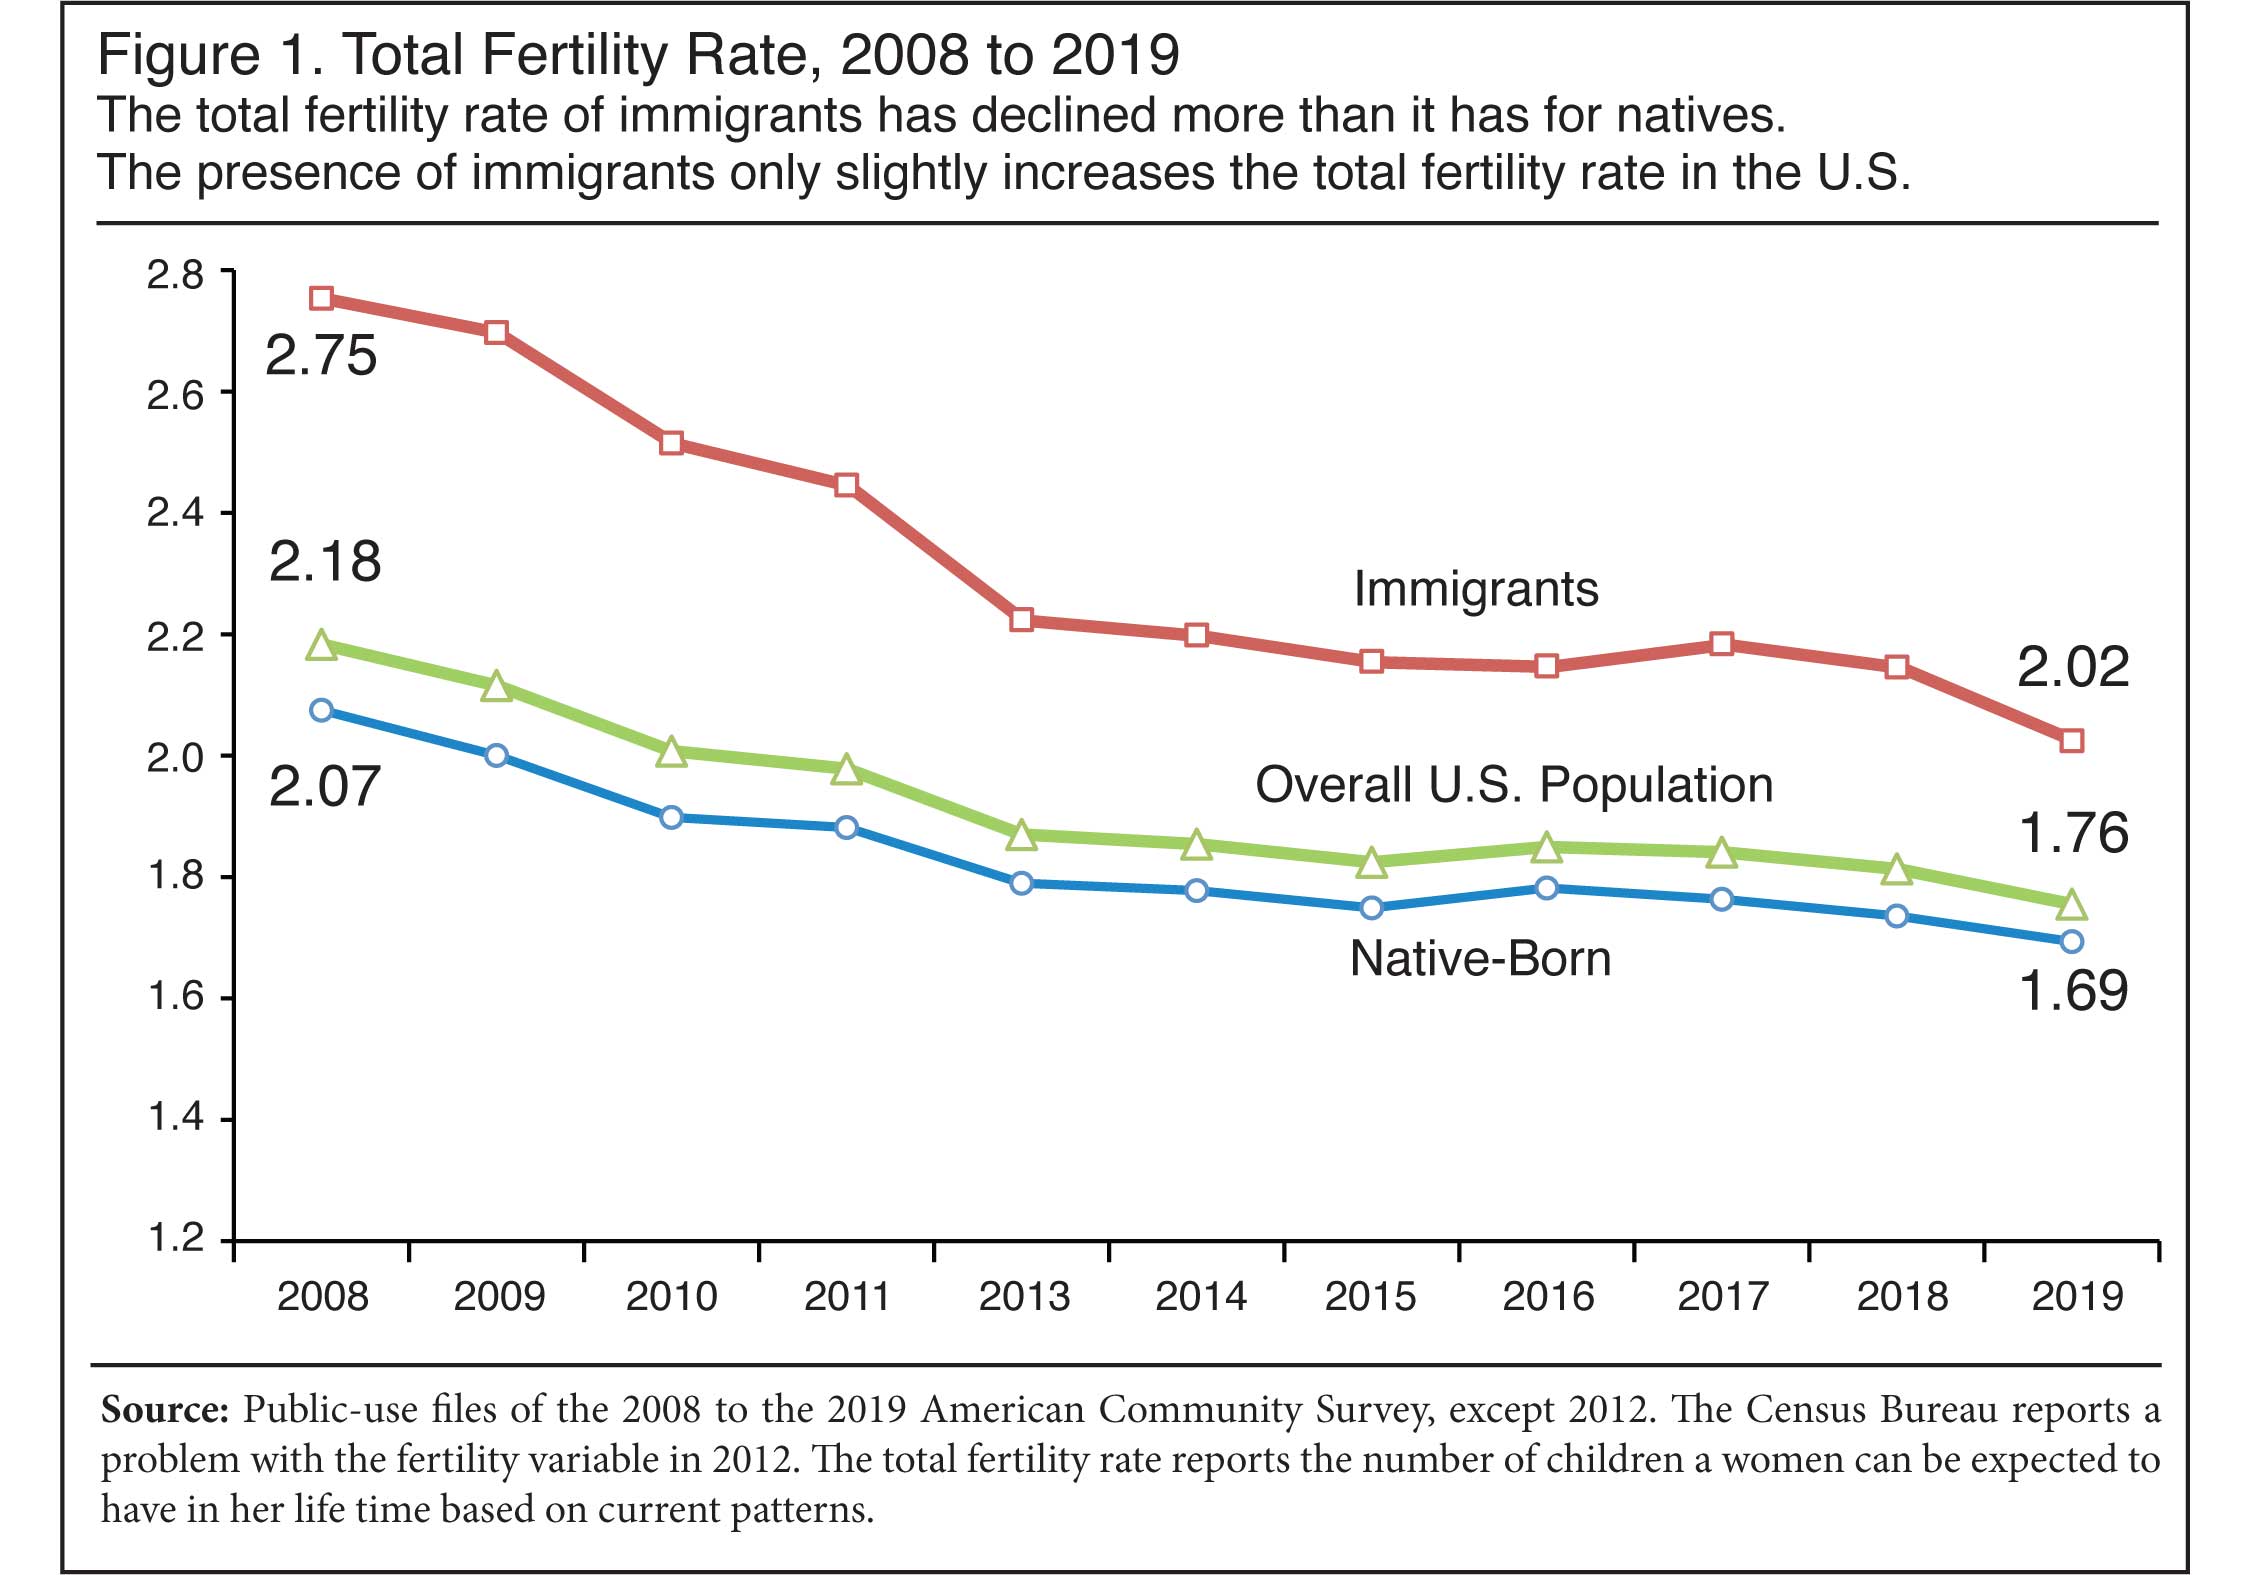 |
Figure 1 shows that the TFR for all women (immigrant and native-born) in America in 2019 was 1.76. Excluding immigrants, it would be 1.69 — the rate for natives. The difference of .06 children (3.6 percent) represents the impact of immigrants on the nation's overall TFR. So while immigrants do have higher fertility than the native-born, their impact on the overall fertility rate in the United States is quite modest. This might seem counterintuitive since immigrants gave birth to 734,000 children in the United States in 2019, which accounted for 19 percent of all births. Yet it only modestly raises the overall total fertility rate.
The impact of immigrants is modest on the nation's TFR because the differences with the native-born are not that large. It is like adding together the average incomes or ages of two groups of people with similar incomes or ages. The new average is not very different. The same is true when adding immigrants whose fertility is similar to the native-born. It may also be helpful to remember that immigration does not simply add new births, which is the numerator when calculating the TFR, it also adds to the denominator, which is the number of women in the country. In 2019, there were 12.8 million immigrant women in their childbearing years. So while they added significantly to the number of births, they also added in a nearly equal proportion to the number of women.
Table 1 shows the fertility rate for immigrant groups by race, with Hispanics (of any race) shown separately. Among immigrants, the largest fall in TFR was among Hispanics, both in absolute terms and proportionately. The table shows that fertility peaked for Hispanic immigrants, and for most other groups as well, in 2008 and declined thereafter. The decline for Hispanic immigrant women has been the steepest of any group. But Hispanic immigrants are by no means alone; fertility for all of the largest racial/ethnic groups among the native-born also declined, though not as steeply.
 |
Births per Thousand, Ages 15 to 50
In addition to the total fertility rate, demographers often measure fertility by simply calculating births per thousand. It is a very straightforward and easy to understand way of thinking about fertility. Figures 2 through 4 report births per thousand for immigrants, the native-born, and the total population. (Table A1 in the Appendix reports more detailed information.) Figure 2 shows births per thousand for women 15-50. More typically, demographers have examined fertility for women 15-44. However, the ACS asks women ages 15 o 50 if they had a child, and we follow the Census Bureau's example in a recent publication and report on births for women 15-50 in Figure 2.13 Doing so provides a more complete picture of fertility in modern America, as there are now a significant number of births to women over age 44 — nearly 99,000 in 2019.
 |
Like the total fertility rate examined above, Figure 2 shows that the birth rate for immigrant women 15-50 has declined more significantly than the rate for the native-born. The birth rate for all immigrant women 15-50 declined from 76 births per thousand to 57.2 per thousand — a decline of 18.8 births, or 24.7 percent. For natives, the birth rate for women in this age group declined from 55.2 to 48.4 births per thousand, or 12.2 percent.
We can also calculate immigration's impact on the overall birth rate for women 15-50 simply by comparing births per thousand for all women (immigrant and native-born), which was 49.9 per thousand in 2019, to the rate for native-born women, which was 48.4 per thousand. Thus, the presence of immigrants in the United States increased the overall birth rate by just 1.5 births per thousand, which is 3 percent. Because immigrant fertility has declined more steeply than native-born fertility, the impact of immigrants on the nation's fertility has also declined somewhat more. In 2008, the presence of immigrants increased fertility for all women (15 to 50) by 3.2 births per thousand, or 5.8 percent. So what was a small impact has become even smaller. As is the case with the total fertility rate, the largest decline has been for foreign-born Hispanics. Among the native-born, Hispanics have also experienced a large decline. (See Table A1.)
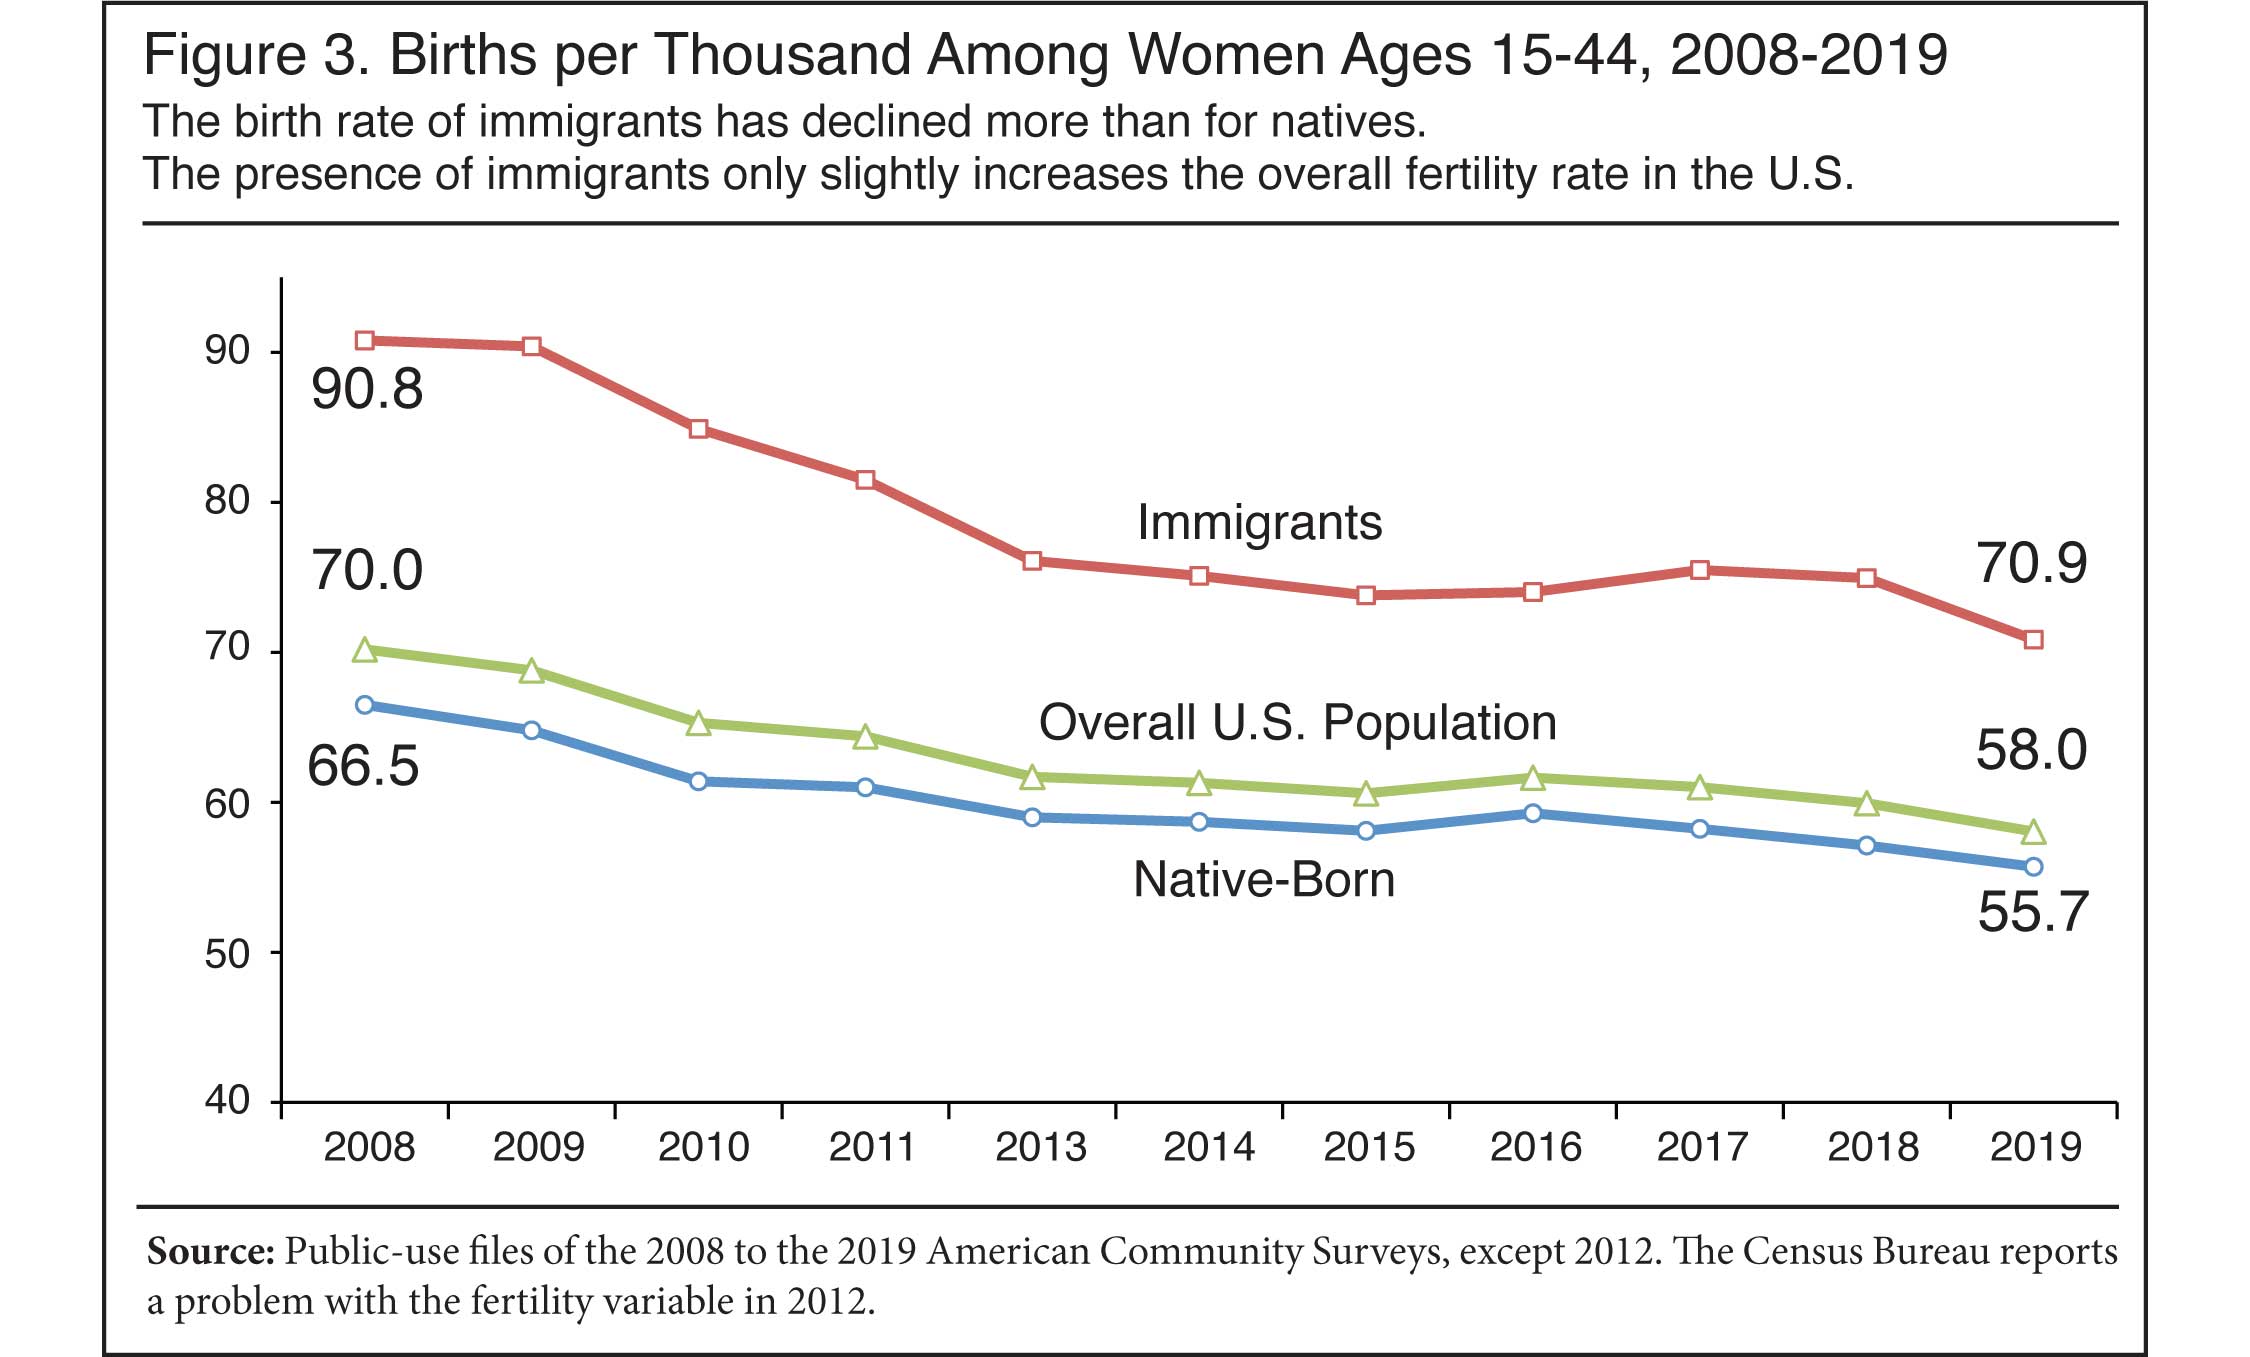
Births per Thousand, Ages 15-44
Figure 3 reports births per thousand for women 15-44. The results are very similar to those shown in Figure 2, though the rates for both immigrants and the native-born are higher than in Figure 2, reflecting the exclusion of women over age 44, who have the lowest fertility rates. As in Figures 1 and 2, immigrant fertility declined more than native-born fertility. Figure 3 also shows that the immigrant birth rate is higher than the rate for native-born women, but that immigrants only slightly raise the overall fertility rate for women 15-44. In 2019, the fertility of all women (immigrant and native-born) in the United States in this age group was 58 births per thousand. If immigrants are not counted, the rate would be 55.7 births per thousand — the rate for native-born women. Thus, immigrants increased the fertility of all women in the United States (15-44) by only 2.3 births per thousand (4.2 percent) in 2019.
 |
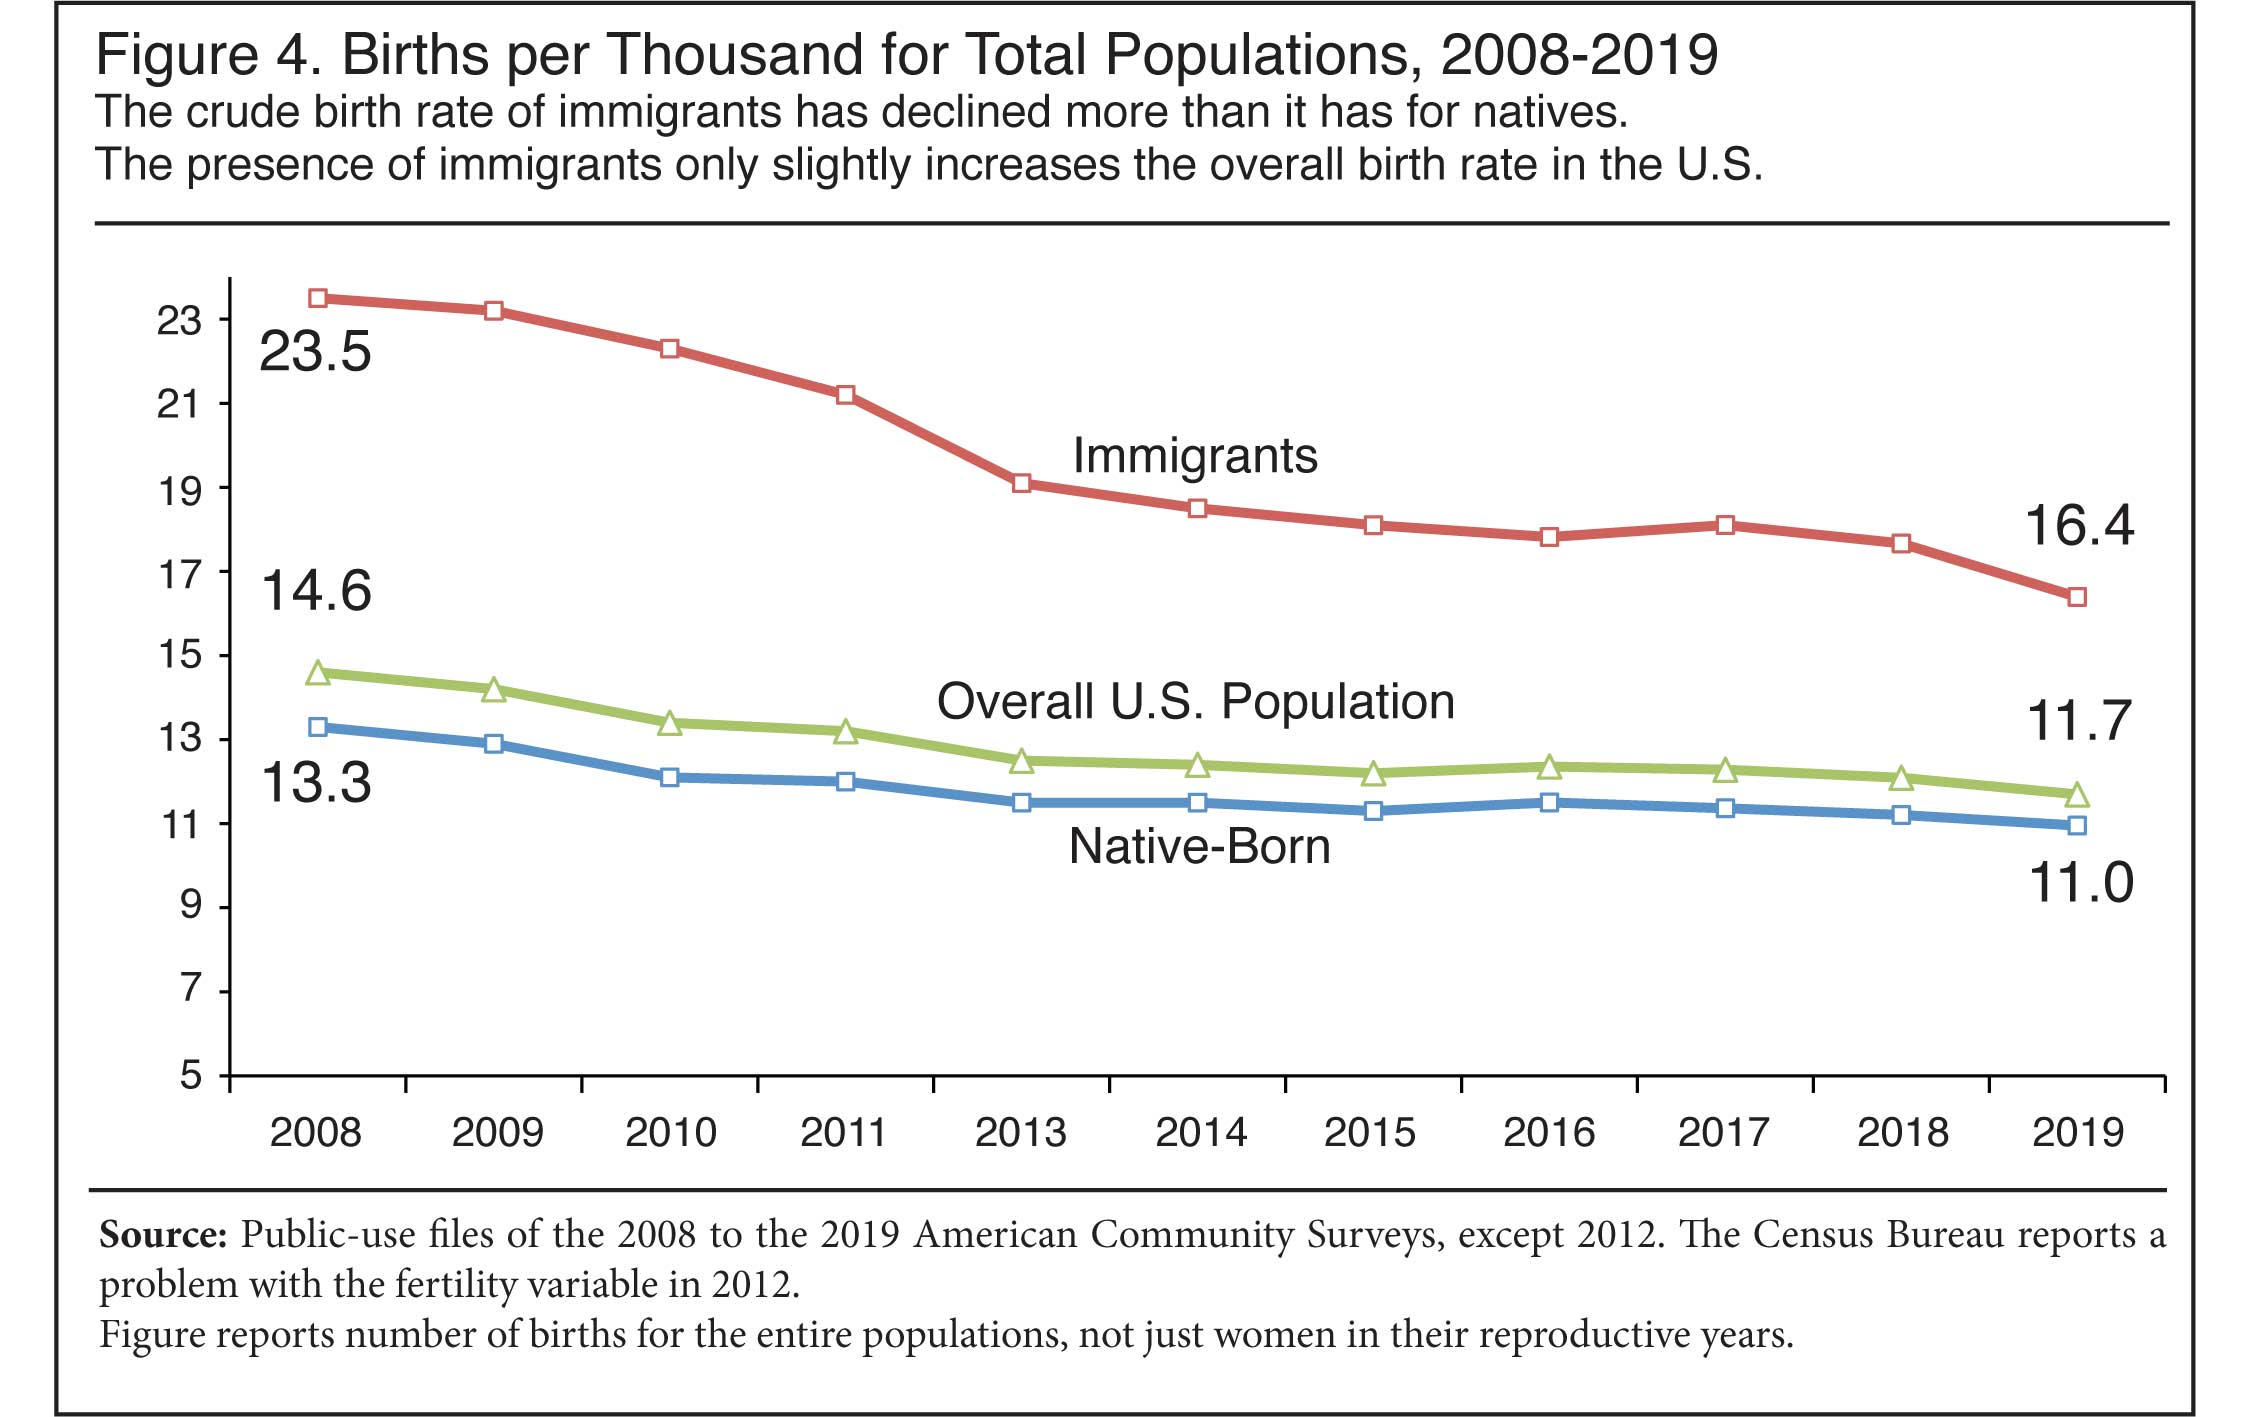
Births per Thousand for the Entire Population
While birth rates are often reported for women in their reproductive years, it is also possible to report births relative to the entire population. This is sometimes referred to as the crude birth rate. This is expressed as births per thousand relative to the country's total population, including children, men, and women outside their childbearing years. This measure of fertility tends to show a larger impact on the nation's fertility from immigration than looking at women only in their reproductive years because the crude birth rate reflects both the higher fertility of immigrants and the somewhat larger share who are in their reproductive years compared to the native-born.14
Figure 4 shows, however, that even when the nation's fertility is measured as a crude birth rate, the impact of immigration remains small. The rate for the nation as a whole is 11.7 births per thousand when immigrants are included. Without immigrants, it would be 11 births per thousand — the rate for the native-born alone. The .7 births per thousand that immigration added to the crude birth rate means that the 44.9 million immigrants in the country in 2019 increased fertility by just 6.8 percent.15 It must be remembered that immigrants arrive at all ages, they age over time, and their fertility is not that much higher than the native-born. As a result, immigrants do not simply add to the number of women having children, they also add to the population across the age distribution and for these reasons do not significantly change the nation's fertility. Like Figures 2 and 3, Figure 4 also indicates that the fertility of immigrants is falling faster than that of the native-born. Between 2008 and 2019, the fertility of the native-born fell by 2.3 births per thousand, compared to 7.1 births per thousand for immigrants. The decline in fertility for immigrants means their impact on the overall fertility rate of the nation has also become somewhat smaller.16
 |
A Changing Age Profile
There has been a significant decline in net immigration in recent years.17 Could this decline have reduced the number of immigrants in their primary reproductive years, resulting in fewer births to immigrants? Most births occur before age 34, peaking in the 25- to 34-year-old age group. A decline in the share of immigrant women in the younger age groups would lower fertility. Appendix Table A2 reports the number of women in five-year age cohorts from 15 to 50, and the TFRs for 2008 and 2019. The share of immigrant women 15 to 34 was smaller in 2019 than 2008, as was the share in the peak fertility period of 25 to 34. Therefore, the falloff in the share in the younger age groups did play a role in the decline in immigrant fertility. However, comparing the same age cohorts in 2008 to 2019 also shows very significant declines among immigrants for every age group under age 34. This means that even if the share of immigrants in the younger age groups had remained the same, their fertility would still have declined. We also see declines in the birth rate for the native-born in most age cohorts as well, particularly at younger ages, though the fall-off tends to be somewhat less pronounced than the fall-off for immigrants. In general, the decline in immigrant fertility seems to be related to both a change in the share who are younger and a decline in birth rates across almost every age group.
States
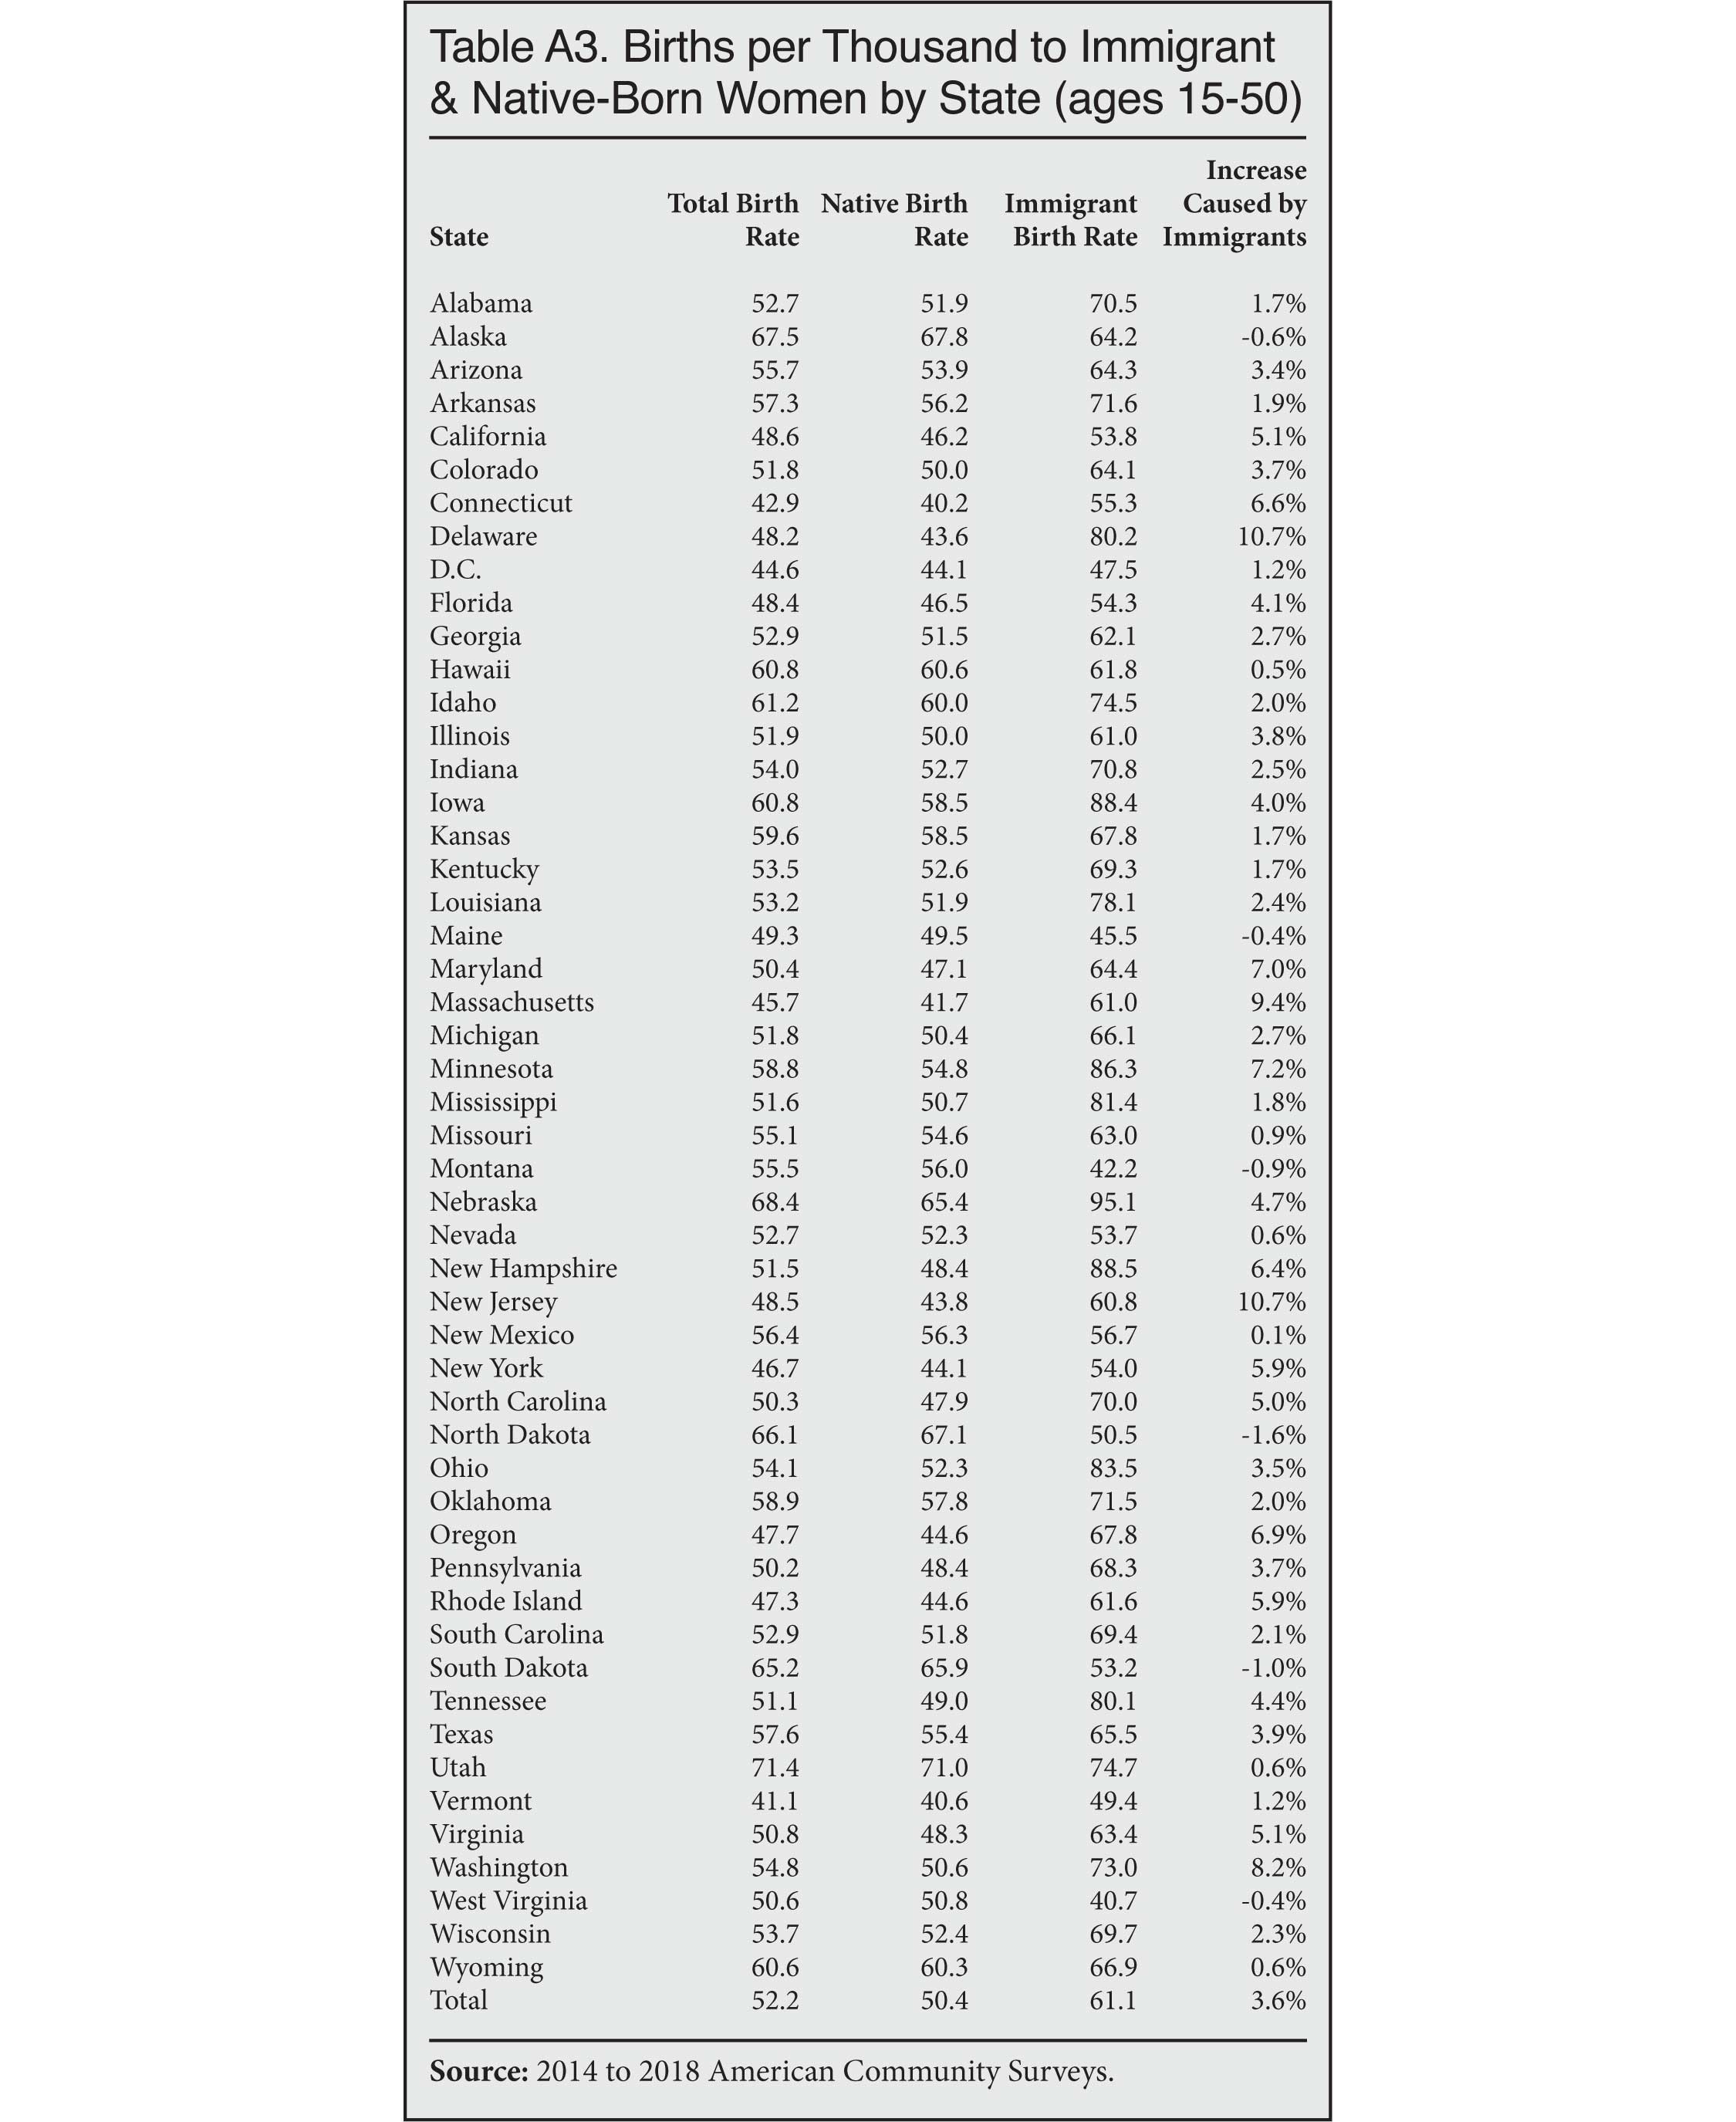
Appendix Table A3 reports immigrant and native birth rates by state. In order to obtain more statistically robust estimates, we use the Census Bureau's five-year ACS data from 2014 to 2018. Unfortunately, at the time of this publication, the 2015-2019 five-year data had not yet been released. Table A3 shows that there is significant variation in birth rates across states for both immigrants and natives. As already reported, immigration increases the birth rate by 3.6 percent. There are a number of states where the impact of immigration is larger. In five states, immigration raised the birth rate by more than twice its impact on the nation. However, it is also true that in six states immigration actually lowered overall fertility. But in general, immigration has a small positive impact on the birth rate in most states.
The Impact of Immigration on Native Fertility
This analysis has primarily focused on the direct effect immigrants have on fertility in the United States by changing the national average. However, it is possible that immigration has an indirect effect as well. Immigration may create conditions that encourage or discourage native-born women from having children. There are many possible ways this might happen. For example, immigration could impact everything from the costs of child-care to housing. It may also reduce or increase wages for some workers. How all of these factors play out is, of course, very complex. However, there has been prior research on immigration's impact on native fertility.
In a 2018 study of the 1980 Mariel boatlift to Miami, Fla., Kelvin K. C. Seah found that it significantly reduced native fertility, but only in the short term, with the effect being primarily on women who live in rental housing.18 This may suggest that immigration reduces fertility in receiving communities by making it more difficult for younger, less affluent couples to move into larger or owner-occupied housing. There is certainly evidence from across the world that immigration increases demand for housing and drives up prices.19 Barbu et al.'s analysis across a number of immigrant-receiving counties found that immigration raises housing prices.20 If immigration increases the cost of homeownership or rent, it could discourage couples from starting or expanding a family if adequate housing is seen as a prerequisite for having a child.
There are other ways that immigration can impact native fertility as well. Perhaps the most obvious way immigration could impact the decision to bear children is by creating uncertainty about the economic prospects of native-born women or their partners. There is very strong evidence that the economic uncertainty created by the 2008 recession significantly reduced births in the United States.21 Sobotka et al.'s review of the literature on economic recessions over time in developed countries found that while many factors impact the decision to bear children, declining GDP levels, falling consumer confidence, and rising unemployment all tend to lower birth rates.22 There is a long and complex debate about immigration's effect on the labor market outcomes of the native-born that need not be summarized here.23 What is important to note is that if immigration reduces wages or employment for some native-born workers, then it could discourage them from having children. It is also possible that whatever immigration's actual effect on the labor market, the perception that immigration reduces wages or job prospects could cause some native-born couples to forego childbearing. Conversely, if immigration raises income or employment for some workers, it may positively impact their propensity to have children.
The most straightforward way to measure immigration's impact on fertility using the ACS is to look for correlations between the presence of immigrants in an area and the fertility of the native-born. The best unit of analysis available in the ACS for this type of research is the Metropolitan Statistical Area (MSA). Metro areas are often used for this kind of analysis because they best approximate a labor and housing market, at least as measured in Census Bureau data. Table 2 reports correlations between the immigrant share of a metropolitan area's population and the birth rate of native-born women 15 to 50.
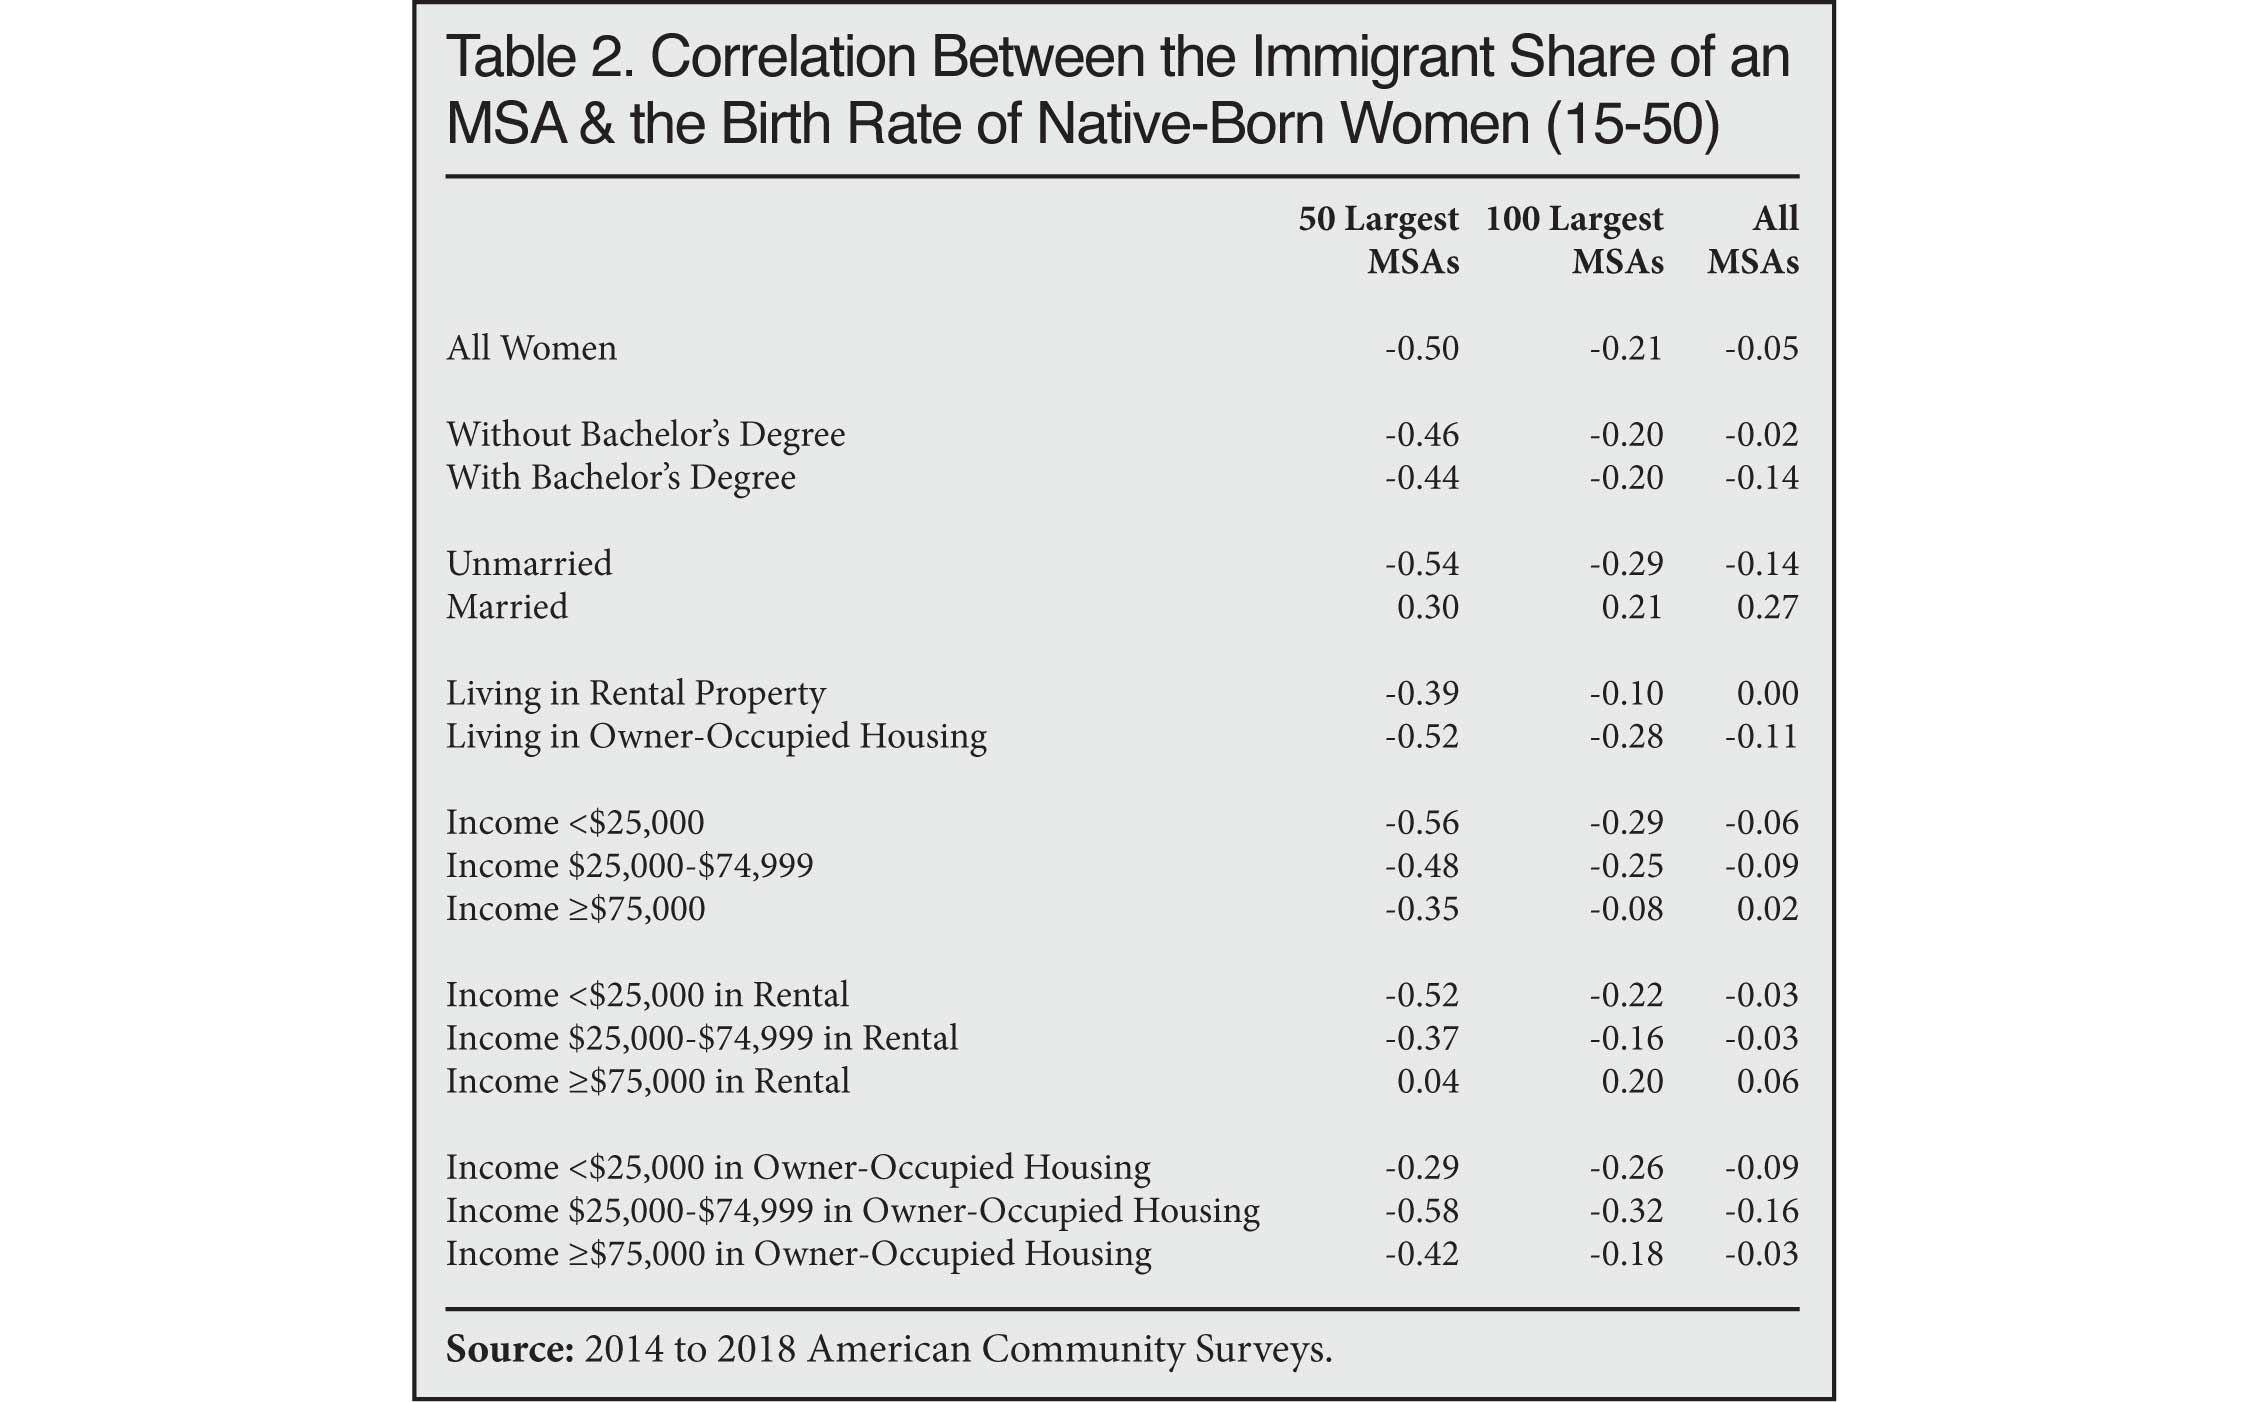 |
The top of Table 2 shows that native fertility is negatively correlated with the share of an MSA that is foreign-born. This means that the larger the immigrant share in a metro area, the lower the fertility of natives. However, only in the 50 largest cities is the negative correlation very strong, at -.50. In the largest 100 MSAs and all 260 MSAs the table shows that the negative correlation is much weaker. It is unclear whether the much higher correlation in the 50 largest cities is due to some characteristic or characteristics in those particular cities or if it reflects the larger sample and resulting lower error in measuring immigrant and native fertility in bigger metro areas. Put a different way, in the larger cities the margin of error around the immigrant share, fertility, or any other variable is much smaller because the sample used to create these variables is much larger. This allows for more precise measurement than in the smaller cities. In the 50 largest MSAs, the sample of native-born women (15 to 50) averages about 29,000 cases. In the rest of the MSAs, the sample of women averages only about 3,200 cases, and in the 100 smallest MSAs it averages less than 1,500. While these might still seem like large samples, it must be remembered that having a child is a relatively rare event, with only about 5 percent of native-born women actually giving birth each year. Measurement error will bias a correlation toward zero. That is, the larger the error, the less likely it will be to find a relationship between two variables. So the variation in sample sizes could explain the results in Table 2.
Looking down Table 2 shows that the other correlations show much stronger relationships in the 50 largest metro areas as well. In general, it is unmarried, lower- and middle-income native-born women whose fertility seems to be most negatively impacted by the presence of immigrants, at least in the 50 largest cities. The negative correlations for lower- and middle-income women in larger cities of -.56 and -.48 respectively are among the strongest in the table. The correlations with the presence of immigrants for lower and middle-income renters and homeowners also tend to be negative and relatively strong. If immigration increases housing or the general cost of living in an area, it seems reasonable to assume this would be most felt for women of modest means, making them less willing to start or add to their family. The relatively high negative correlation for lower- and middle-income renters in particular is consistent with the possibility that immigration makes homeownership more difficult for some Americans by driving up prices, thereby causing them to delay or forgo childbearing.
Of course, simple correlations are quite limited and deal with one variable at a time. To further explore the potential relationship between immigration and native fertility, we use the following OLS regression model:
NB = a + b1(TP) + b2(IS) + b3(SM) + b4(SB) + b5 (PR) + b6(HI) + b7(MS) + b8(OO) + e
The regression is a cross-sectional comparison of the nation's MSAs with each variable reflecting the characteristics of the metro area, where NB is the birth rate for native-born women (15-50) measured as birth per thousands, TP is the total population in thousands, IS is the immigrant share of the population, SM is the share of women who are minority,25 SB is the share of women with a bachelor's degree or more, PR is the share of women in their peak reproductive years of 25 to 34, HI is the average household income in which women live in thousands of dollars, MS is the married share of women, and OO is the share of women living in owner-occupied housing. All figures come from the 2014 to 2018 five-year public-use file of the ACS with the institutionalized population excluded.26
Given that the correlations indicate that the impact of immigration on native birth rates may be related to the size of the metro area, Table 3 reports the results of three separate regressions, which divide the sample based on MSA population. The first is only the 50 largest MSAs, the second is for the largest 100 metro areas, and the third includes all MSAs. The R-squared, standard error of the estimates, and the number of vari¬ables that are statistically significant all indicate that the best fit for the model is in the 50 largest MSAs. As we add more cases, the R-squared and standard error of the estimates decline and fewer variables are statistically significant. This may be because the relationship between these variables is weaker in the smaller cities or the seemingly weaker relationship is due to the larger measurement error around these variables in the smaller MSAs, as discussed at length above.27 In general, we would expect that adding more cases to the regression should increase the number of variables that are statistically significant. But that is not the case here. This tends to support the idea that the error around the variables masks their effect in the smaller cities.
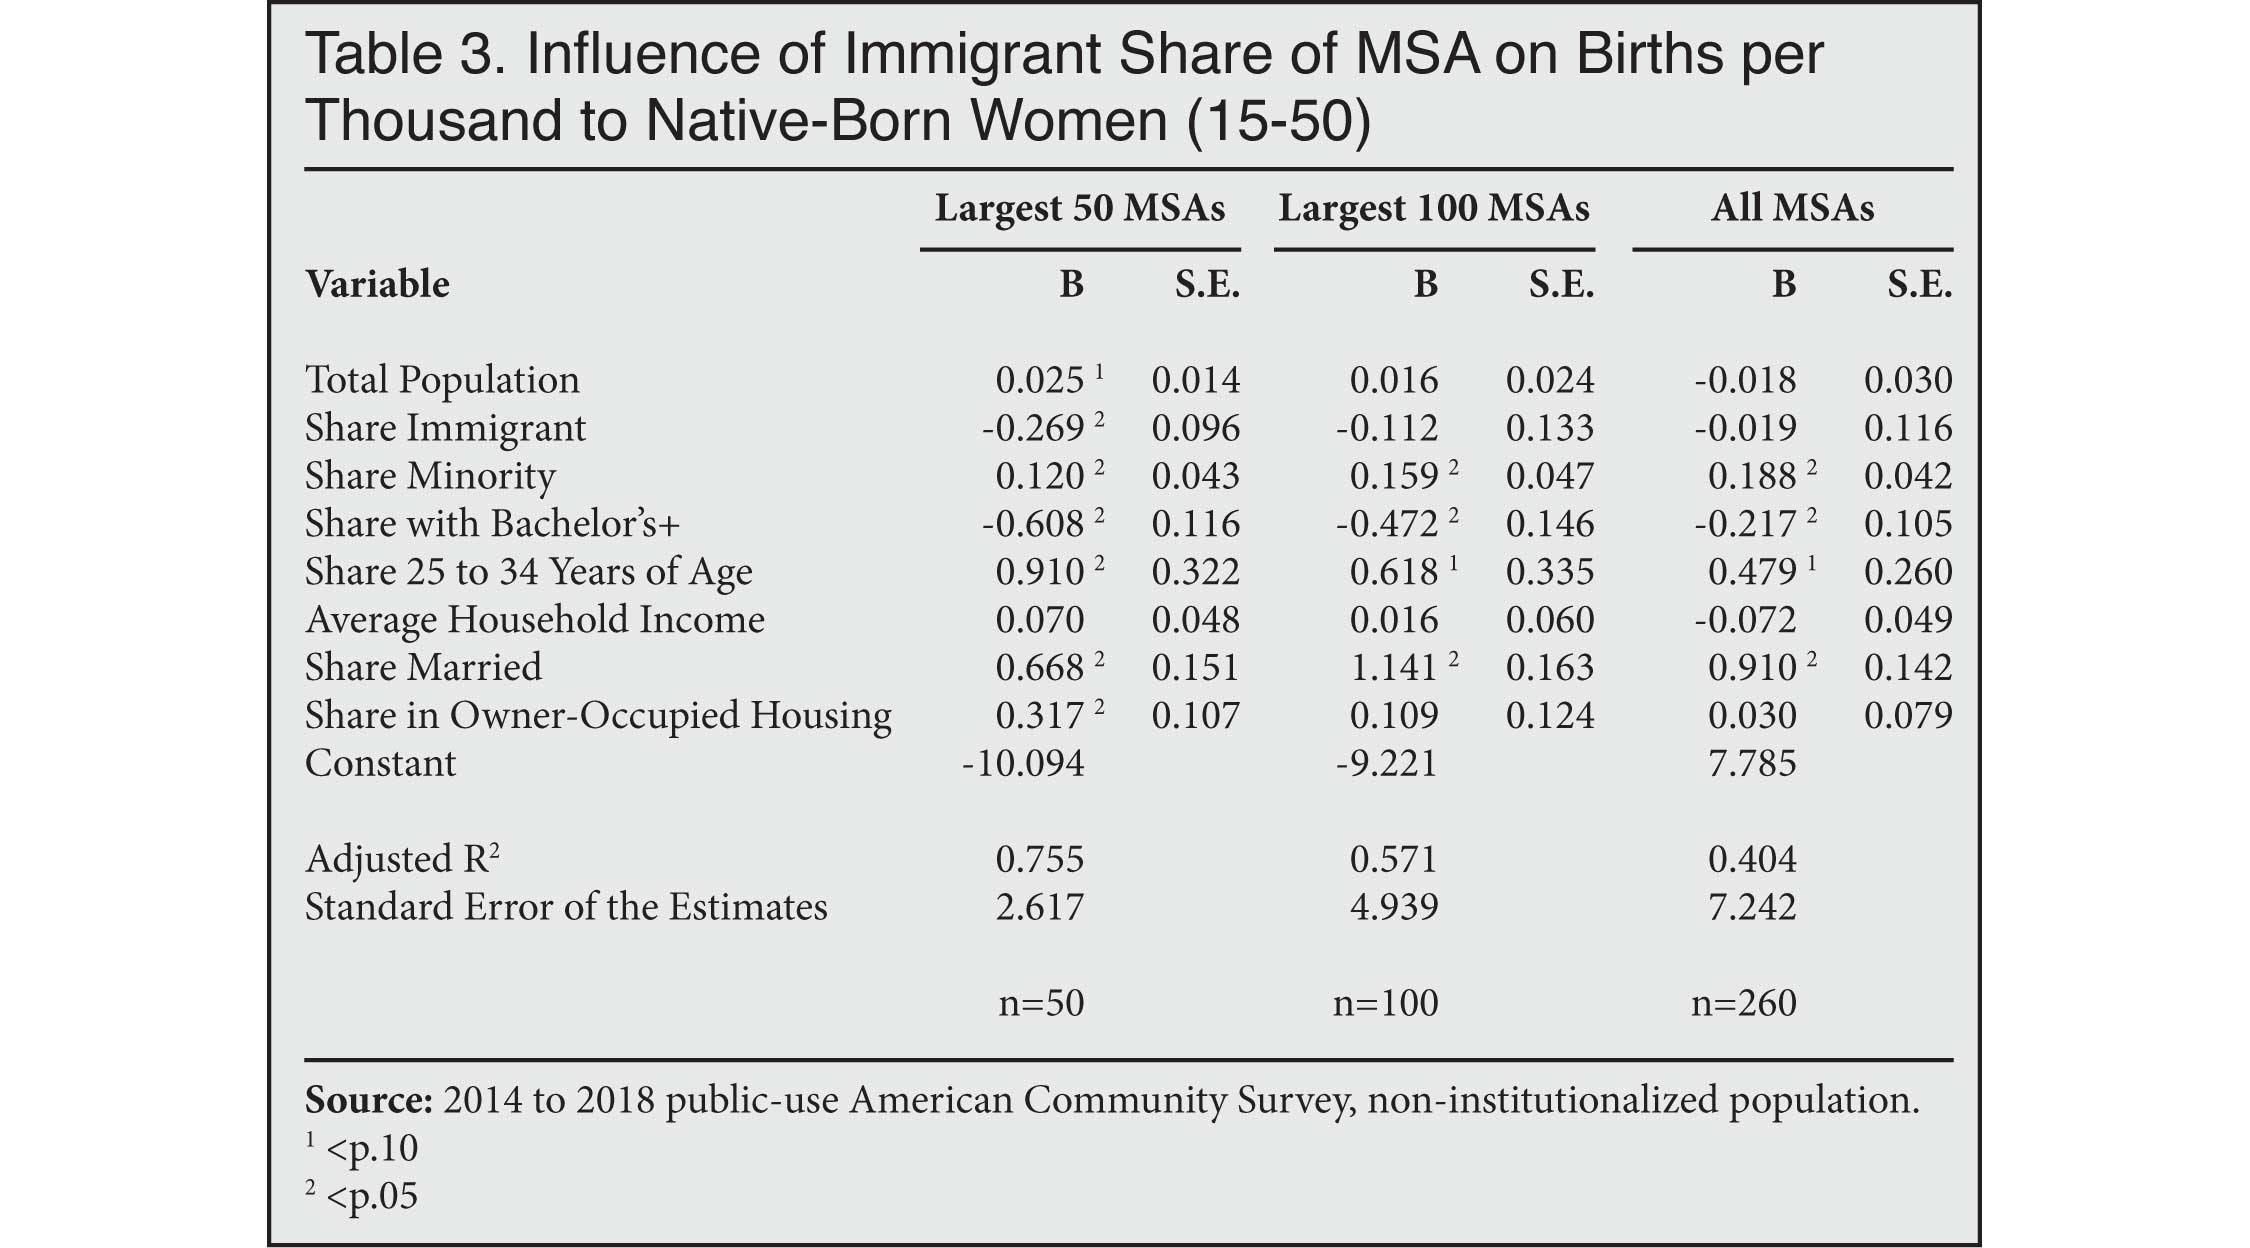 |
As for the immigrant variable, in the 50 largest MSAs, the impact seems to be strong. The negative coefficient of -0.269 means that for each one percentage-point increase in the immigrant share of a city's population, there is a .269 decline in births to native-born women of reproductive age. This is the case even after controlling for the income, homeownership, racial composition, and other characteristics of the MSAs. Nationally, 13.5 percent of the population was immigrant based on the five-year ACS, so if the relationship was linear and held nationally (two big assumptions), it would imply that immigration reduces native fertility by three to four births per thousand in total. If true, it would mean that the reduction in native fertility is larger than the average increase in fertility caused by the presence of immigrants, as shown in Figure 2.
However, while the results are interesting and consistent with that possibility, a number of important caveats need to be noted. First, it is not known if the statistical significance for the immigrant variable in only the larger MSAs is related to these particular cities or reflects greater measurement error in the smaller MSAs. Second, it is very possible there are other variables not included in the analysis that impact native fertility. Third, we are only comparing one point in time. Even assuming immigration does reduce native fertility, we do not know how this may have changed over the years. All of these issues should be the focus of future research. Nonetheless, our finding that immigration may potentially reduce native fertility is important and is consistent with Seah's research on the effect of the Mariel boatlift on fertility in Miami.
Conclusion
The idea that immigrants can prevent the aging of society and "rebuild the demographic pyramid" because they are "more fertile" has an intrinsic appeal. It is tempting partly because it seems like a quick fix to problems like funding Social Security and Medicare and avoiding politically painful choices like cutting benefits, raising taxes, or increasing the retirement age. Prior research shows that the "immigration will fix aging" argument is largely a mirage. In terms of fertility, immigrants' somewhat higher fertility has only a small impact on the overall fertility rate no matter how fertility is measured. In fact, even if the number of immigrant women (15-50) doubled, along with the number of births to this population, it would only raise the nation's overall birth rate for all women 15-50 (immigrant and native-born) by 2.1 percent above the current level.
Further, the fertility of immigrants is declining. This decline in immigrant fertility means that the small impact immigration has on the overall fertility rate in the United States, and the resulting impact on the aging of America's population, is becoming even smaller. In 2019, immigrant fertility dropped below 2.1 children on average, which is the level necessary to replace the existing population. We also find some evidence that in large metropolitan areas the presence of immigrants reduces native fertility significantly. There has been some prior research showing the same thing. If this turns out to be correct, then this would further reduce immigration's ability to increase average fertility in the United States.
Fertility is dropping around the world, including in all of the primary immigrant-sending regions. Thus it should come as no surprise that immigrants in the United States are also having fewer children. One can favor reduced or increased immigration for any number of reasons, but America will simply have to look for solutions other than immigration to deal with the challenges associated with an aging society.
Appendix
 |
 |
 |
End Notes
1 In 2019, the total population of women ages 15 to 50 in the United States was 76.919 million, and there were 3.839 million births, making for 49.9 births per thousand. Of this population, there were 12.83 million immigrant women who had 734,207 births in that year. If the number of immigrant women were doubled to 25.66 million and the number of births to immigrant women also doubled to 1.468 million, then the total female population (15-50) would be 89.75 million and the total number of births would be 4.573 million. This would raise births per thousand from 49.9 to 51.0 (2.1 percent).
2 There were 22.1 million immigrants in the country in 2019 who indicated that they had arrived between 2000 and 2019, according to the 2019 ACS. In addition, there were 15.7 million U.S.-born children of immigrants born between 2000 and 2019 living in the country, according to the 2019 Current Population Survey's Annual Social and Economic Supplement (CPS ASEC). Unlike the ACS, which does not ask each person about their mother's place of birth, the ASEC does ask this question, making it straightforward to calculate the number of U.S.-born children in the country age 19 or younger with an immigrant mother. (It should be noted that many of these births were to immigrant women who arrived prior to 2000.) Adding the 22.1 million post-2000 immigrants in the country to the 15.7 million births to immigrants since 2000 means that immigration added 37.8 million people to the U.S. population between 2000 and 2019. It is worth adding that population growth in the United States is estimated by the Census Bureau from July 1 to July 1 of each year. If we wish to estimate immigration's impact on the population since 2000, it would make sense to exclude those immigrants who arrived in the first half of 2000 as they were already included in the 2000 population estimates for July 1 of that year. Doing so means that immigration added 37.0 million people, equal to 79 percent of population growth over this time period.
3 Bill Chappell, "'Immigrants Are More Fertile,' Jeb Bush Says In Reform Speech", NPR, June 14, 2013.
4 See Carl P. Schmertmann, "Immigrants' Ages and the Structure of Stationary Populations with Below-Replacement Fertility", Demography, Vol. 29, No. 4, November 1992; Thomas J. Espenshade, "Can Immigration Slow U.S. Population Aging?", Journal of Policy Analysis and Management, Vol. 13, No. 4 (Autumn, 1994), pp.759-768; "Replacement Migration: Is It a Solution to Declining and Ageing Populations?", Frederick W. Hollmann, Tammany J. Mulder, and Jeffrey E. Kallan, "Methodology and Assumptions for the Population Projections of the United States: 1999 to 2100", Population Division Working Paper No. 38. U.S. Census, January 13, 2000.
5 Steven A. Camarota and Karen Zeigler, "Can Immigration Solve the Problem of an Aging Society? Estimating the impact of post-1990 immigration", Center for Immigration Studies Backgrounder, July 15, 2019.
6 Steven A. Camarota and Karen Zeigler, "Projecting the Impact of Immigration on the U.S. Population: A look at size and age structure through 2060", Center for Immigration Studies Backgrounder, February 4, 2019.
7 The Bureau's zero immigration scenario assumed no new immigration, but allows for the continued out-migration of immigrants already here. In contrast, the Center's zero immigration scenario assumes no new immigrants arrive or leave. Of course, neither the Census Bureau or the Center's zero immigration projections represent realistic scenarios. Both zero immigration projections are only abstractions, designed to help shed light on the impact of immigration. They do not represent practical or realistic policy options. It would not be possible stop all immigration, including illegal entry and overstays. But even if the United States did so somehow, there is still no way to know how outmigration might change.
8 Tables showing the Census Bureau immigration scenarios can be found here. It makes much more sense to compare the high and low immigration scenarios provided by the Census Bureau than the zero-immigration scenario, which as discussed in end note 7, is not a realistic projection politically or as a practical matter. In contrast, the high and low scenarios represent levels of immigration that might be actually adopted and enforced. Table B, "Projected Components of Immigration Change", shows net immigration through 2060 under different immigration scenarios. The Bureau's low-immigration scenario assumes net immigration (the difference between the number of people coming vs. those going) will total 27.8 million through 2060. Its high-immigration scenario assumes net immigration of 76.9 million by 2060. Table A, "Projected Population Size and Annual Total Population Change", shows the size of the U.S. population under different scenarios. The low-immigration scenario produces a U.S. population of 376.2 million in 2060, while the high-immigration scenario produces a total population of 446.9 million in 2060, 70.6 million larger. These numbers reflect future immigrants and their progeny. The second tab in Table D, "Projected Population by Age Group", reports the share of the population by age cohorts under the different scenarios. Under the low-immigration scenario, 56.3 percent of the population will be adults of working age (18-64); under the high-immigration scenario 57.4 percent will be — a 1.1 percentage-point difference. This means that the 70.6 million additional people added to the country under the high-immigration scenario relative to the low-immigration scenario would increase the working-age share by 1.1 percentage points.
One way to think about this effect is to compare the decline in the working-age share that occurs under the two scenarios. The Census Bureau reports in Table D that in 2016, the takeoff year for its projections, just under 62 percent of the U.S. population was working-age. The 2060 working-age share in the low immigration scenario shows a decline of 5.7 percentage points. This compares to a decline of 4.6 percentage points under the high immigration scenario. So about 81 percent of the decline in the working-age share occurs under a high-immigration scenario relative to a low-immigration scenario, even though the high-immigration scenario adds nearly 71 million more people to the country.
While the decline in the share of the U.S. population who are of working-age is probably the most important concern when it comes to the aging of American society, the share 65 and older is another common way to think about this issue. Census Bureau Table D shows that the share 65 and older will be 24.3 percent in 2060 under the low-immigration scenario, compared to 22.3 percent in the high-immigration scenario — a two percentage-point difference. Table D also shows the share in this age group in 2016 was 15.2 percent. This means that under the high-immigration scenario about 78 percent of the increase in the elderly share of the population occurs relative to the low immigration scenario. This is a similar percentage to the impact of high versus low immigration on the working-age share discussed above.
9 The Census Bureau's glossary of terms can be found here.
10 The idea behind the 2.1 number is that each woman has to have one child to replace herself and one man in order for the population to reproduce itself. It has traditionally been assumed that 2.1 children rather than 2.0 children are necessary to sustain the population, partly because there are slightly more boys than girls born each year. It should also be added that if life expectancy is increasing (as it has for more than a century) it might be some time before the population actually declines, even if fertility drops below 2.1.
11 Data from 2012 is not used because of a problem reported by the Census Bureau with this variable in that particular year. In its source and accuracy statement for the 2012 ACS, the Census Bureau states that, "the ACS PUMS [Public Use Micro Sample] file has suppressed variables in the 2012 year PUMS file for a limited number of geographies. This is due to non-sampling error or issues with interpreting the recode. The fertility variable (FER) was suppressed in 59 PUMAs [Public Use Microdata Areas] within states [sic] Florida, Georgia, Kansas, Montana, North Carolina, Ohio and Texas." This comes to 1.8 million (weighted) cases with missing values for the fertility question. Because it is not clear what biases the missing values introduced, we have chosen to exclude the 2012 ACS from this analysis. See p. 10 in "PUMS Accuracy of the Data (2012)".
12 We cannot say with absolute certainty that there was never a time when fertility among the foreign-born was this low because such records are incomplete. But our review of vital statistics data, the ACS, and the June Current Population Survey indicates that 2.02 is the lowest TFR ever recorded for immigrant women.
13 Lindsay M. Monte and Renee R. Ellis, "Fertility of Women in the United States: 2012", U.S. Census Bureau, 2014. The Bureau reports more recent years at their website using the 15 to 50 age range, here.
14 In 2019, of all immigrants (both sexes and all ages), 28.6 percent were women ages 15 to 50. Of all natives (both sexes and all ages) 22.6 percent were women 15 to 50. Because a larger share of immigrant women are in their childbearing years, the birth rate for the total immigrant population tends to be higher than for the total native population. The age structure of the immigrant population partly reflects the fact that immigrants typically arrive in their 20s and 30s, though they do age over time like everyone else. Moreover, all children born to immigrants once in the United States are considered natives; as a result, children make up a relatively small share of all immigrants, creating a population that is almost entirely adults, unlike the native-born. This is the case even though there are large numbers of children in immigrant households; they are mostly U.S.-born and by definition are not immigrants.
15 The difference between 11.7 and 11.0 would seem to be 6.4 percent but the actual difference is 6.8 percent because of rounding. Immigration increases fertility by .74 births per thousand and the fertility rate of natives is 10.95.
16 In 2008, immigrants increased the nation's overall crude birth rate by 9.8 percent, compared to 6.8 percent in 2019.
17 Steven A. Camarota and Karen Zeigler, "Immigrant Population Growth Slows: 'Trump Effect' likely explains slowdown", Center for Immigration Studies Backgrounder, October 22, 2020.
18 Kelvin K. C. Seah, "The effect of immigration shocks on native fertility outcomes: evidence from a natural experiment", IZA Journal of Development and Migration, September 27, 2018.
19 In immigrant-receiving countries such as Australia and Canada, there is ample indication that immigration increases housing prices.
20 Teodora Barbu, Mariana Vuta, Adina Străchinaru, and Sorin-Iulian Cioaca. (2017). "An Assessment of the Immigration Impact on the International Housing Price", Amfiteatru Economic 19, pp. 682-695.
21 Data from Vital Statistics based on birth certificates shows a dramatic decline in births from 4.3 million in 2008 to 3.7 million in 2019. Most researchers think that the Great Recession played a very large role in reducing both the number of births and the fertility rate in the United States. Kenneth M. Johnson at the University of New Hampshire Carsey School of Public Policy argues that, just between 2008 and 2013, the recession reduced the aggregate number of births by 2.3 million.
22 Tomáš Sobotka, Vegard Skirbekk, and Dimiter Philipov, "Economic Recession and Fertility in the Developed World", Population and Development Review, June 22 2011.
23 Probably the most comprehensive review of the literature on the impact of immigration on the employment and wages of the native born is the National Academies of Sciences, Engineering, and Medicine's 2017 report The Economic and Fiscal Consequences of Immigration, Washington, D.C.: The National Academies Press, 2017. Since the National Academies' study came out, research on the impact of immigration has continued. One of the more important literature reviews that came out after the Academies' study was by Anthony Edo. He examined the findings of over 50 studies across numerous developed countries for the Journal of Economic Surveys.
24 The relatively high negative correction of -.52 for lower-income women in owner-occupied housing is also interesting. It must be remembered that the women in question do not necessarily own the home they live in. Owner-occupied housing simply means that the owner lives in the household. The correlation may reflect younger, lower-income women living with parents who hope to get a place of their own (rented or owned) before having a baby. The simple correlation does not indicate the circumstances of these women.
25 Minority is defined as the percentage of the population who are not single-race, non-Hispanic whites.
26 At the time of this publication, the 2015 to 2019 five-year file from the ACS had not yet been released, so the most recent five-year sample available was 2014 to 2018.
27 In a linear model of the kind used here, measurement error in the regressors will almost always underestimate the size of the coefficient. That is, it will make it seem that there is less of a relationship between the independent variables and the dependent variable.