Dowload a PDF of this Backgrounder.
Steven A. Camarota is the director of research and Karen Zeigler is a demographer at the Center.
We estimate that immigration between 1990 and 2017 added nearly 43 million people to the population, but had a minimal impact on the share of the population that is of working age. This is because immigration added to both the working-age population and to those outside of the working-age population in nearly equal proportions. We also find that post-1990 immigration had a somewhat larger impact on the ratio of workers to retirees. However, raising the retirement age by one year has as large an impact on the ratio as do the nearly 43 million post-1990 immigrants and their progeny.
Among the findings:
- In 2017, there were 30.8 million post-1990 immigrants (legal and illegal) and 12 million of their U.S.-born children and grandchildren in the country — 42.8 million in total, or one in eight U.S. residents.
- The 42.8 million people post-1990 immigration (legal and illegal) added to the country is larger than the combined population of 22 states.
- While adding significantly to the population, the presence of post-1990 immigrants and their progeny only increased the working-age (16-64) share of the population from 63.9 percent to 64.4 percent in 2017.
- Immigration had a small impact on the working-age share because immigrants arrive at all ages, grow older over time, and have children, so they added to both the working-age and those too old or too young to work in nearly equal proportions.
- Even if the number of post-1990 immigrants and their offspring was doubled to almost 86 million, about one in four residents, it would still only have raised the working-age share to 64.8 percent — 0.9 percentage points higher than if there had been no immigration.
- The working-age share can be seen as the best way to think about the ability of society to pay for government or support the economy, as both children and the elderly generally do not work and are supported by the labor of others.
- Excluding children, and looking only at the number of working-age people (16-64) relative to those of retirement age shows that post 1990-immigration increased the ratio from 3.7 potential workers per potential retiree to 4.1.
- If the retirement age were raised by just one year, assuming no immigration, the ratio of workers to retirees would be 4.1, matching the effect of post-1990 immigration.
- Increasing the retirement age by two years, assuming no post-1990 immigration, would have increased the worker to retiree ratio to 4.5 in 2017. It would have required doubling post-1990 immigration to nearly 86 million to match this effect.
- In terms of using immigration as a way to pay for entitlement programs, it must also be pointed out that a large share of post-1990 immigrants and their children struggle, living in or near poverty and using welfare programs at relatively high rates. This makes it difficult for them to generate a fiscal surplus that can pay for social insurance programs.
- In 2017, 45 percent of households headed by post-1990 immigrants or their adult children used one or more major welfare programs, compared to 26 percent of native-headed households. The rates of poverty or near poverty for post-1990 immigrants and their children were 50 to 60 percent higher than that of natives.
- While this analysis is focused on all immigrants (legal and illegal), we roughly estimate that 32 percent (13.8 million) of the people immigration has added to the country since 1990 are illegal immigrants or their progeny. Since legal and illegal immigration together have a modest impact on the working-age share or the worker-to-retiree ratio, the impact of illegal immigration by itself is very small.
Introduction
To examine the impact of immigration on the size and age structure of the U.S. population, this analysis takes a retrospective approach by using Census Bureau data to look at the impact of immigration since 1990. Most prior research, including several analyses published by the Center for Immigration Studies, have studied the impact of immigrants on population size and the age structure of the country by projecting the effect of immigration into the future. While projections have the advantage of allowing researchers to discern the possible impact of future immigration levels, by their nature they rely on assumptions about future rates of fertility, mortality, and migration, which are far from certain. In contrast, this analysis measures the impact of immigration based on what actually happened between 1990 and 2017. Relying primarily on the Census Bureau’s American Community Survey, we find that immigration added nearly 43 million people to the country’s population since 1990. This includes post-1990 immigrants and their U.S.-born children and grandchildren.
This large and relatively young population of immigrants is a good test of the argument that immigration can solve the problem of an aging society. Our analysis shows that immigration over a 27-year period did add significantly to the working-age population, but it also increased the size of the dependent population (children and the elderly). As a result, it did not significantly increase the share of the population that is of working-age.
Demographers often focus on the working-age share of the population, which is sometimes called the dependence ratio, because it reflects the ratio of people who are typically in the workforce relative to those who, because of their age, are dependent on workers for support. Looking at the working-age share is probably the most holistic way of thinking about whether there will be enough workers to support the government or the economy as both the elderly and children typically do not work. While expenditures on the elderly seems obvious to most, it is sometimes forgotten how much our society spends on children. Putting aside what their families provide, government expenditures on children make up a large share of federal, state, and local budgets. In the 2016-2017 school year, the United States spent $668 billion, or $13,119 per public school student.1 Further, the United States spends more than $1 trillion a year on means-tested programs in the United States. A very large share of these expenditures are for health, food, housing, and cash assistance to families with children. With good reason, all societies, including ours, devote enormous resources to providing for children. But a larger population of children also means more people not working who have to be supported by the labor of others.
In addition to the working-age, in this analysis we also look at the ratio of working-age people to those of retirement age. We find that post-1990 immigration did impact this ratio somewhat more, but the impact was still modest. Further, increasing the retirement age by one year would have as large an impact on the ratio of workers to retirees or the working-age share as did post-1990 immigration.
This retrospective analysis is very much in line with projections by academics, the U.S. Census Bureau, and the United Nations. This prior research has shown that immigration does not fundamentally change the age structure of a receiving country in the long run. In a 1992 article in Demography, the leading academic journal in the field, economist Carl Schmertmann explained that, mathematically, "constant inflows of immigrants, even at relatively young ages, do not necessarily rejuvenate low-fertility populations. In fact, immigration may even contribute to population aging." After reviewing the impact of immigration on aging, Princeton University economist Thomas J. Espenshade observed that, "it becomes apparent that the effect of alternative immigration levels on population age structure is small, unless we are willing to entertain a volume of U.S. immigration of historic proportion." He concludes by stating that, "immigration is a clumsy and unrealistic policy alternative to offset a shortage of domestic labor or to correct a perceived imbalance in the pensioner/worker ratio in the United States." An extensive UN study also found that immigration alone cannot make up for population decline and aging in Western countries. The Census Bureau stated in 2000 that immigration is a "highly inefficient" means for increasing the percentage of the population that is of working-age in the long run. The Center for Immigration Studies’ most recent population projections based on Census Bureau projections also show the modest impact of immigration on population aging.2
Of course, prior research has not kept numerous commentators over the years from arguing that immigration is the solution to the supposed argument that there will not be enough workers to support the economy or government. But our analysis confirms something that should be obvious: Immigrants arrive at all ages, including some at or near retirement. In a recent analysis of new arrivals we found that the share who are coming at older ages increased significantly between 2000 and 2017.3 They also grow old over time and have children who, like the elderly, have to be supported by the labor of others. For these reasons, the impact of post-1990 immigration on the ratio of workers to non-workers is quite limited.
One final note about terminology in this report. We use the term "immigrant" to refer to all persons not U.S. citizens at birth — green card holders, illegal immigrants, naturalized citizens, and a small number of long-term temporary visitors. They are typically referred to as the "foreign-born" by the Census Bureau. Prior research indicates that more than 90 percent of illegal immigrants are captured in the Census Bureau data used for this analysis, as are their children. So this report includes legal and illegal immigrants. Second, at various times we examine the ratio of working-age people to people of retirement age. For short hand, we also refer to this ratio as the ratio of workers to retirees. But it should be obvious that not all persons of working age, however it is defined, are actually working; and not all persons who have reached traditional retirement ages are actually retired. Thus, this ratio actually measures potential workers and likely retirees.
Findings
In the appendix to this report, we explain in more detail how we estimated the number of post-1990 immigrants and their progeny in the country based primarily on the 2017 American Community Survey (ACS) collected by the U.S. Census Bureau. In short, we use the 2017 American Community Survey to estimate the number of post-1990 immigrants in the country and their minor children. To estimate the number of adult children of post-1990 immigrants in 2017, we use the ACS and other Census Bureau data. Our estimate includes the original immigrants, their U.S.-born minor and adult children, and the modest number of grandchildren the adult U.S.-born children of post-1990 immigrants had by 2017.
Since this analysis is focused on the impact of post-1990 immigration on the age structure of United States as it relates to our ability to support the economy or pay for government, we concentrate on those of working age and those not of working age, either retirees or minors. However, Tables 1 and 2 in the appendix report many different ways of looking at the age structure and the impact of different immigration levels. Of course, there is no one retirement age in the United States. Early Social Security, Medicaid, and full Social Security all have different eligibility ages. Private pensions, 401ks, 403bs, IRAs, and related programs, as well as military and civil service retirement, all begin making payments or allow withdrawals at still other ages. Nevertheless, rates of employment are low for those under 16 and over 64. For these reasons demographers, economists, and others have generally focused on the working-age share and the ratio of workers to retirees, assuming working age begins at 16 or 18 and retirement age begins at 65. We follow this convention in the analysis, though we report figures assuming different retirement ages as well.
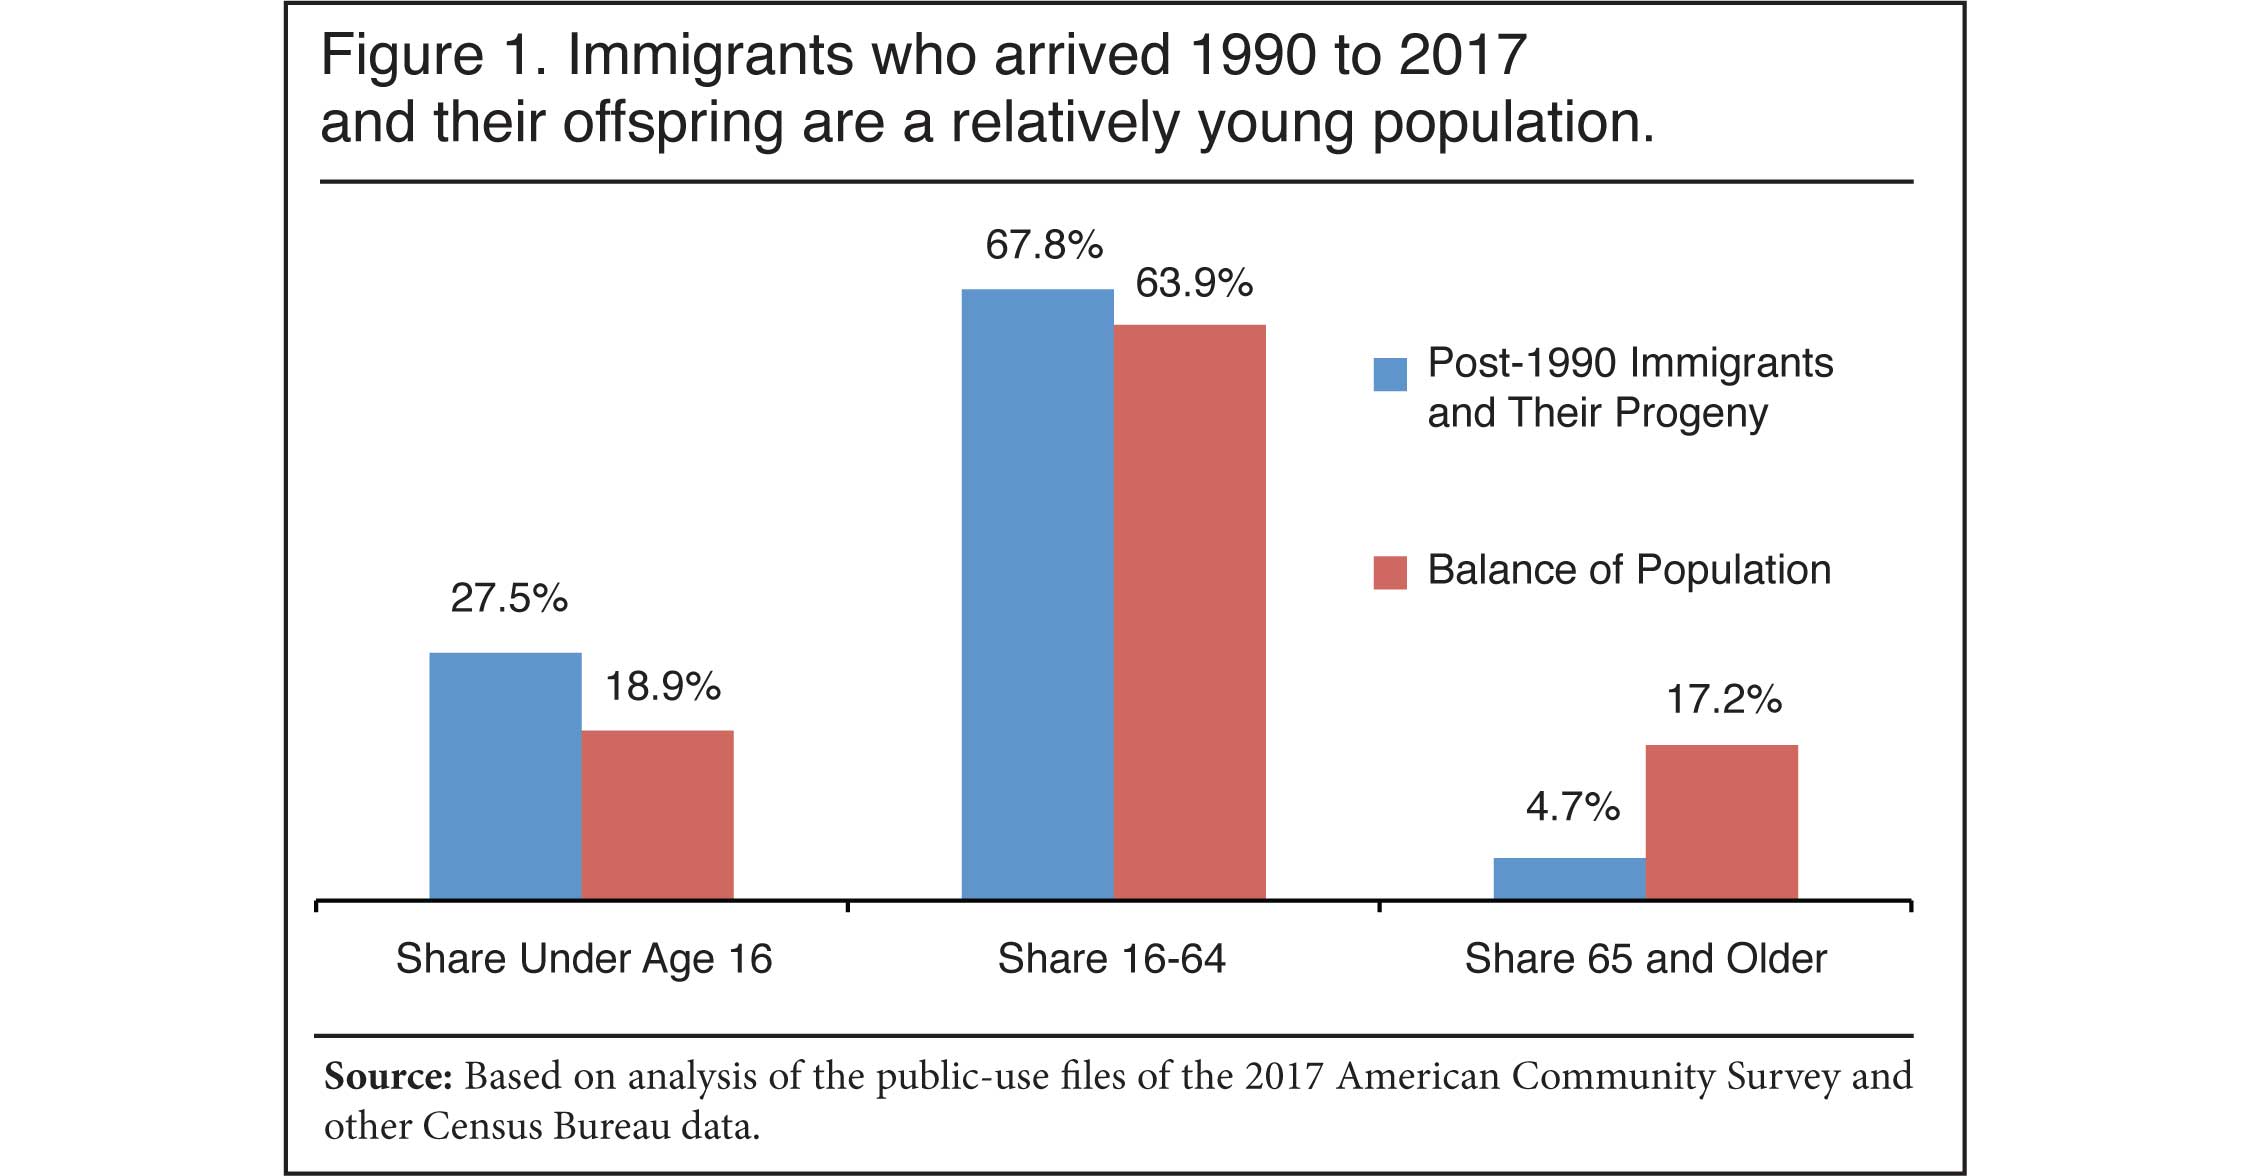
Post-1990 Immigration. Figure 1 shows the shares of post-1990 immigrants and their offspring who are under age 16, working age (16 to 64), and retirement age (65-plus). The 42.8 million people post-1990 immigration has added to the country are clearly a young population. Many are children and only a modest share is of retirement age. This basic fact means that at least in the relatively short term there is an inherit plausibility to the argument that immigration is the solution to an aging society. However, the figure also shows something that may be surprising to some. The share of post-1990 immigrants who are working age is not that different from the rest of the population. This is a reminder that while immigration adds to the number of workers, or at least people who are of working age, it also adds to the population of people who typically do not work because they are too young or too old to do so.
 |
Impact on the Working-Age Population. The relative youthfulness of the population added to the country as a result of post-1990 immigration does not mean that they necessarily had a large impact on the U.S. age structure. Figure 2 shows the effect of post-1990 immigration on the working-age share and the ratio of those of working age vs. those of retirement age. The figure shows that when post-1990 immigration is included, 64.4 percent of the population is of working age (16-64); without it, the working-age share would have been 63.9 percent. This modest increase in the working-age share due to immigration stems directly from the values shown in the prior figure. The working-age share of post-1990 immigrants and their offspring is not that different from the rest of the population. As a result, the presence of post-1990 immigrants and their descendants does not significantly change the working-age share of the total population, even though they added nearly 43 million people to the country and accounted for one in eight U.S. residents in 2017.
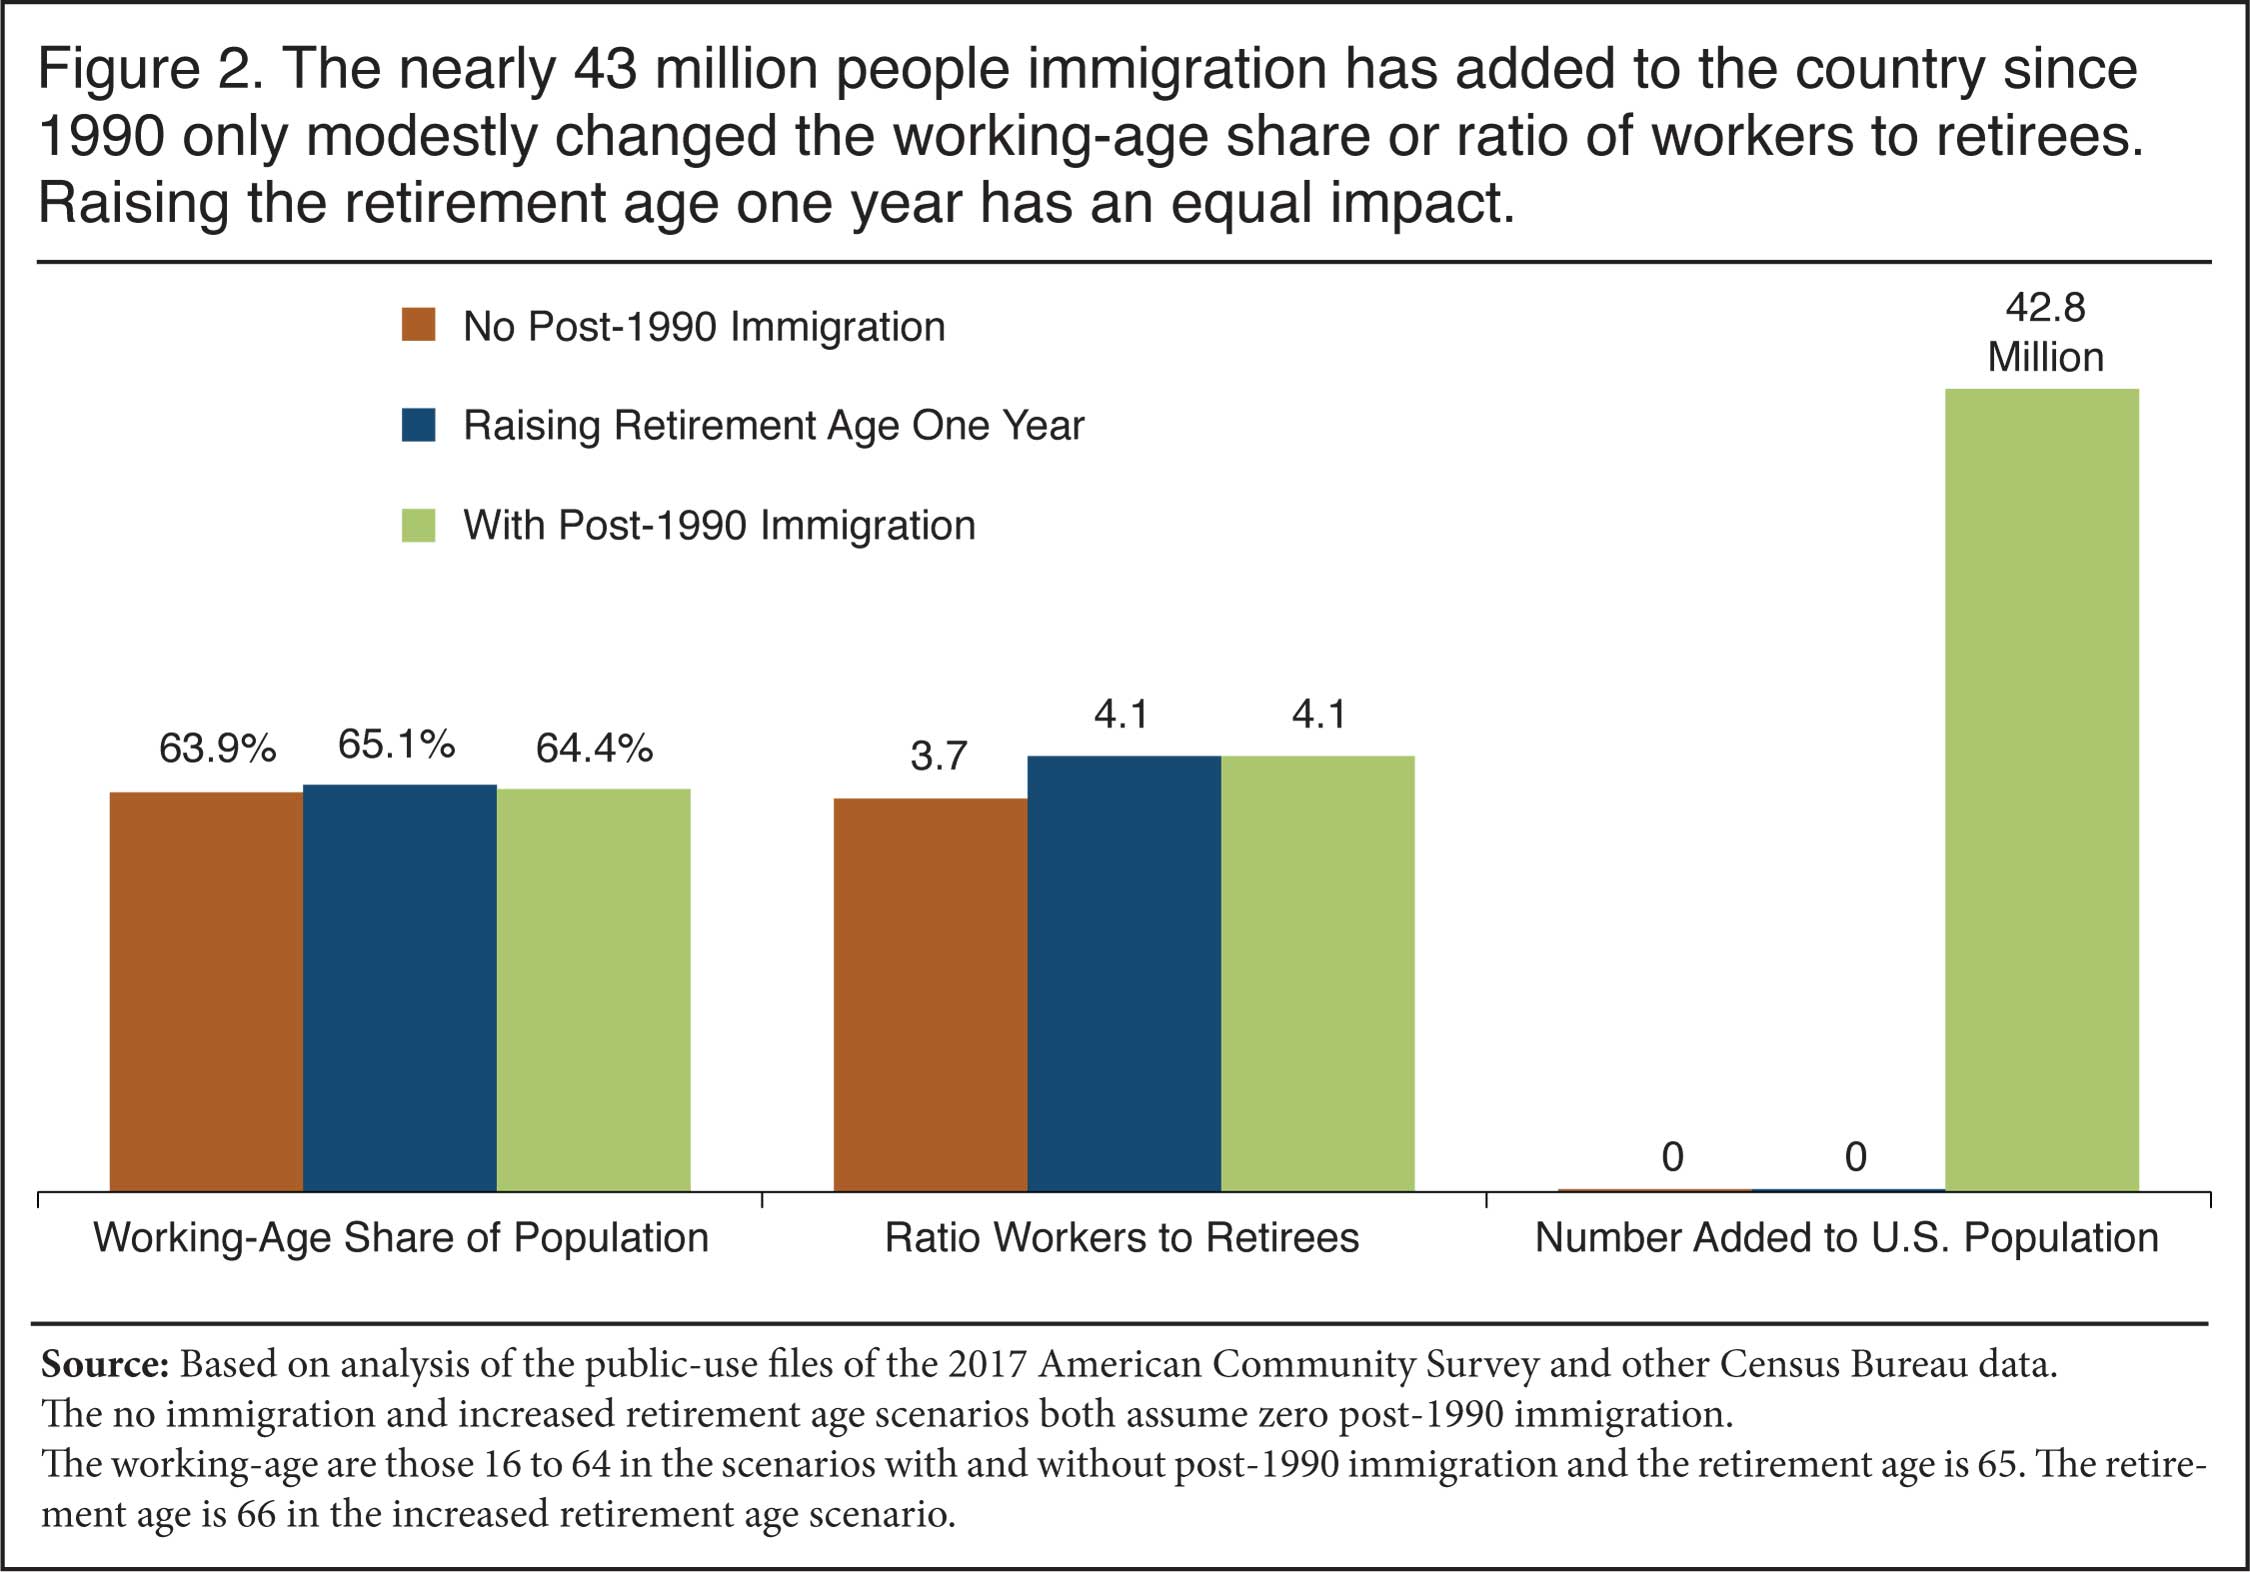 |
Impact on Ratio of Workers to Retirees. Turning to their impact on the ratio of the working age (16 to 64) to those of retirement age, Figure 2 shows that the impact of immigration from 1990 to 2017 is somewhat larger, but the effect is still modest. Without post-1990 immigration, there would have been 3.7 persons of working age for each person of retirement age; with immigration it is 4.1 persons. To place the impact of immigration in perspective, Figure 2 also shows what would have happened if there had been no immigration and the retirement age was 66 and the working age was 16 to 65. In general, the effect of increasing the retirement age by one year is equal to the effect of all post-1990 immigration. In fact, the impact of increasing the retirement age by one year is somewhat larger on the working-age share of the population than were the 42.8 million post-1990 immigrants and their progeny.
Immigration vs. Raising Retirement Age. Figure 3 examines in more detail the impact of different immigration levels and retirement ages on the working-age share. The left side of the figure assumes the working age is 16 to 64 and then varies the immigration level. The right side of the figure assumes no post-1990 immigration and varies the retirement age. The figure shows that, in general, increasing the retirement age would have had a much larger impact on the working-age share of the population than even truly dramatic increases in immigration. It fact, increasing immigration two, three, four, five, and six times are not realistic levels of immigration. Given how much immigration has riled American politics, it seems certain that the country would never double immigration, let alone increase it several fold. The purpose of the figures on the left is to show what the impact of immigration would have been even assuming implausibly high levels.
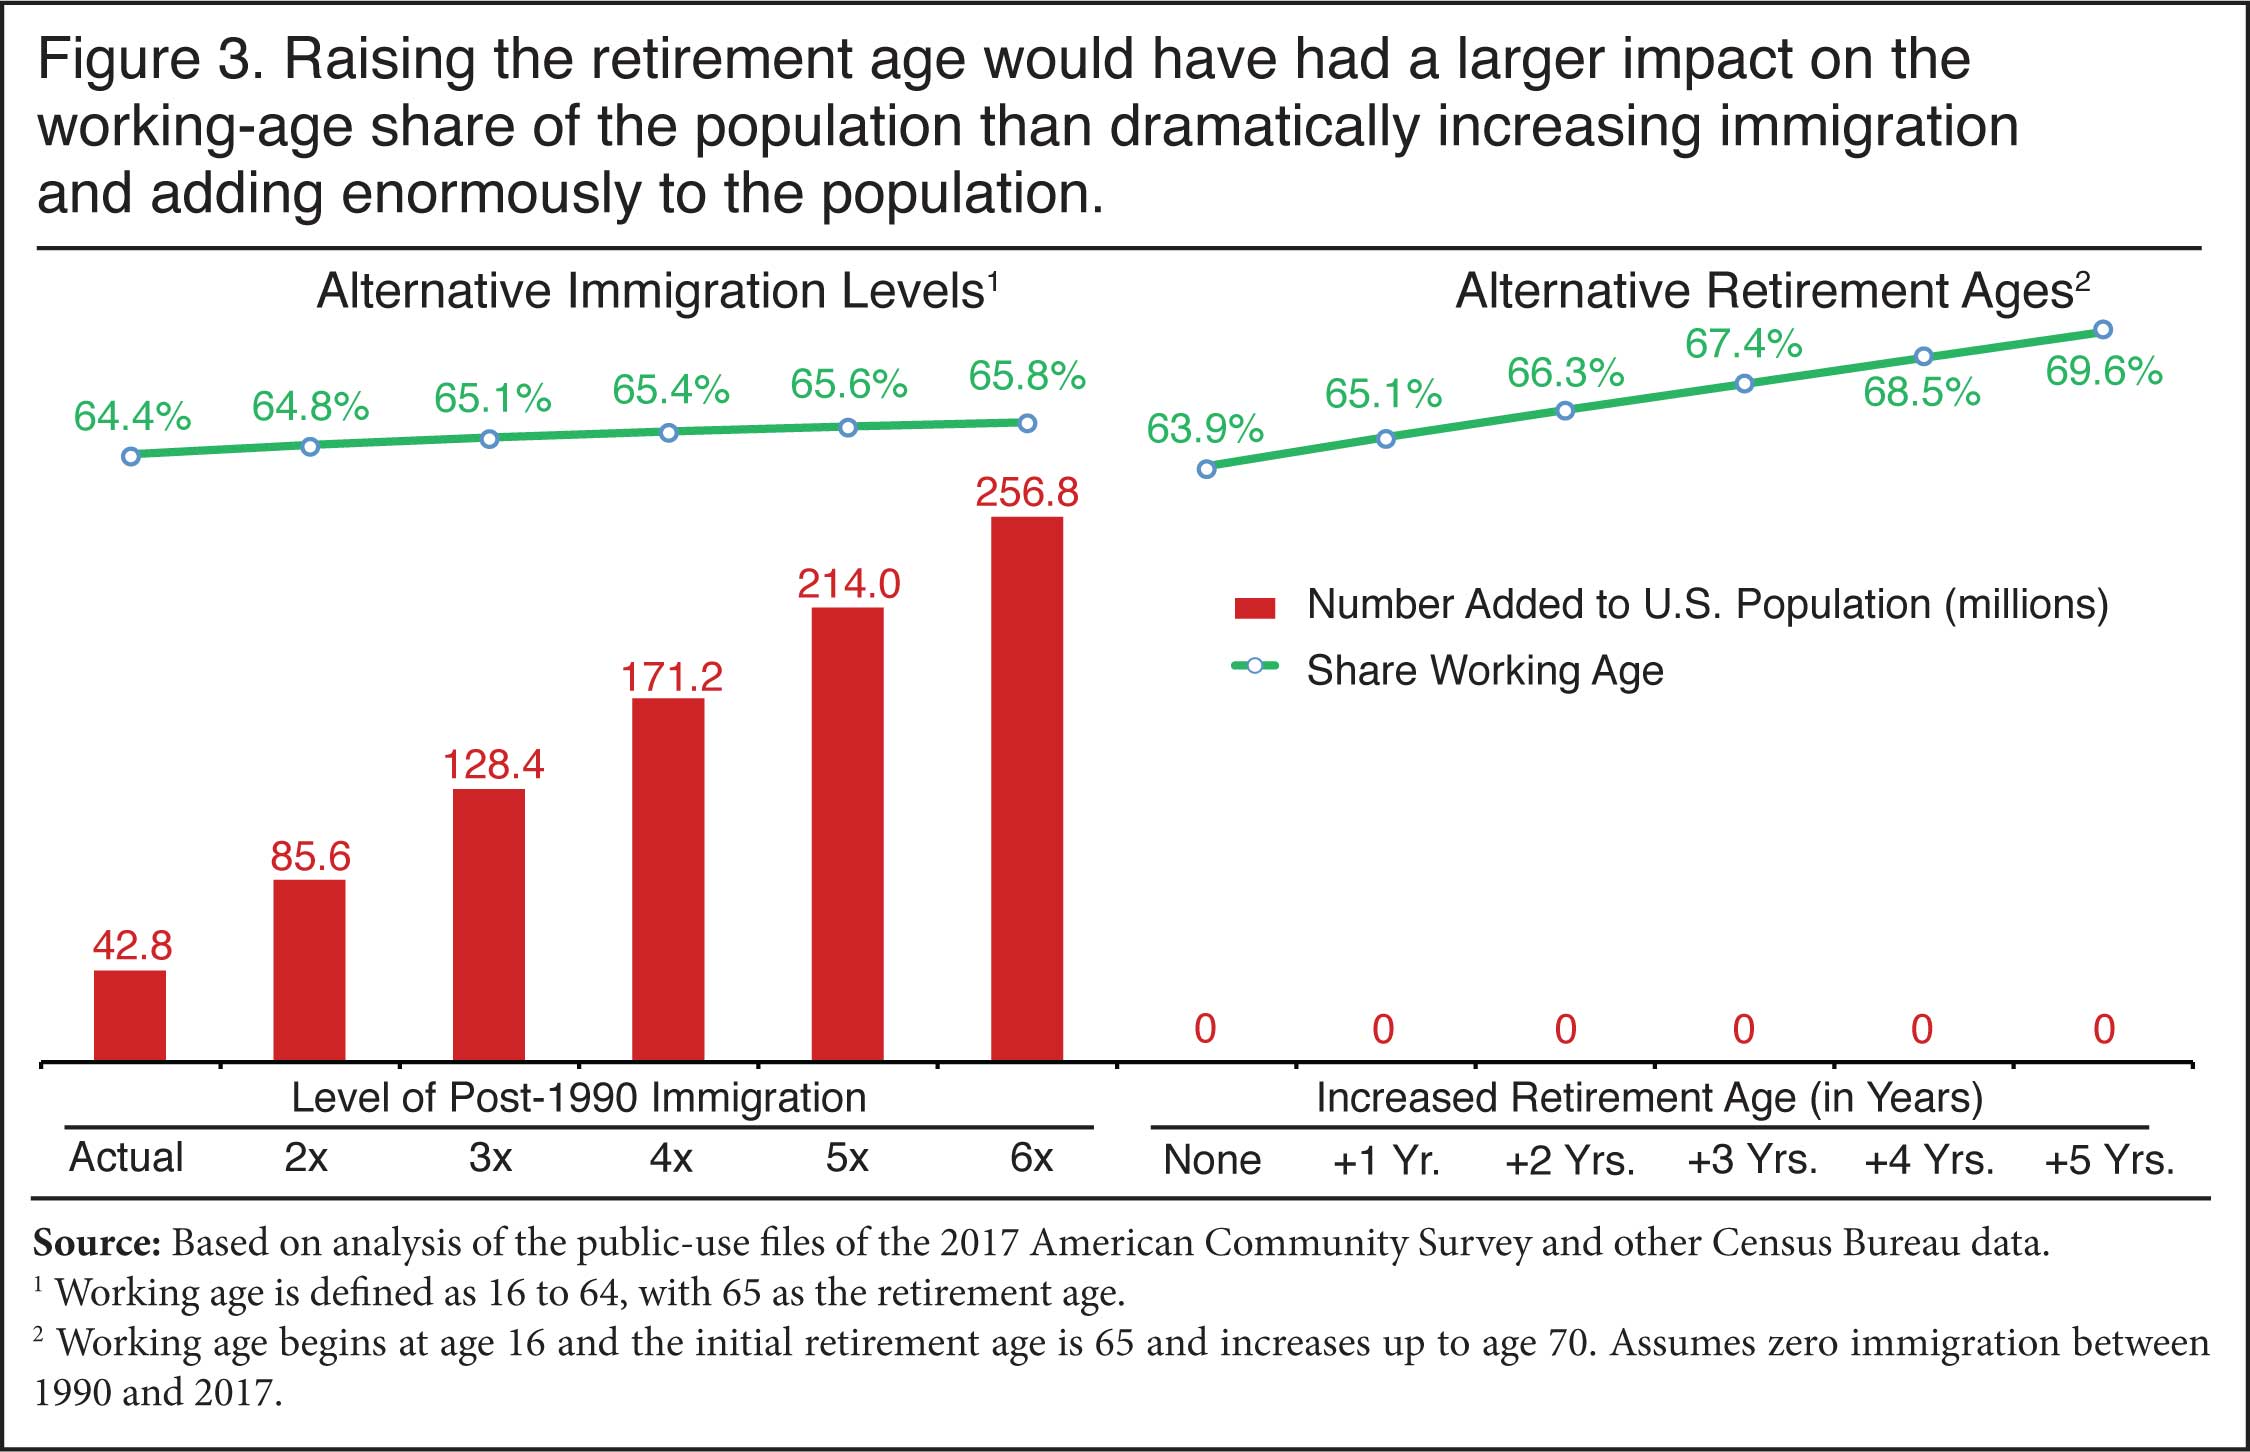 |
Figure 3 indicates that doubling post-1990 immigration would have meant there were 85.6 million post-1990 immigrants and their descendants in the country, yet the working-age share would have been 64.8 percent, not very different from the 63.9 percent if there was no immigration. The right side of Figure 3 shows that if the retirement age was increased one year, the working-age share would have been 65.1 percent, higher than doubling the level of immigration. This is perhaps even more remarkable when one considers that post-1990 immigrants and their offspring would have accounted for nearly one in four U.S. residents under such a scenario.
Again, extremely unlikely immigration levels on the left side of the figure all show how limited the impact of immigration can be on the working-age share of the population. If there had been six times the level of post-1990 immigration, it would have added 256.8 million to the population; and this population would have accounted for nearly half the nation’s total population in 2017. Yet it would have still increased the working-age share of the population less than a two-year increase in the retirement age.
Immigration’s Diminishing Returns. One other important observation that can be drawn from Figure 3 is that each one-year increase in the retirement age, up to age 70, has a similar impact on the working-age share. If the retirement age had been increased by one year from 65 to 66 or 66 to 67, it causes a 1.1 to 1.2 percentage-point increase in the working-age share. To receive full Social Security in 2019, a person has to be 66 and six months old, with the retirement age increasing by two months each year until it researches 67. Figure 3 shows that if the retirement age in 2017 was increased one year from 67 to 68 it would have increased the working-age share by 1.1 percentage points. Increasing it to 69 would have increased the working share an additional 1.1 points.
In contrast to increasing the retirement age, the effect of immigration has a diminishing effect on the working-age share even though the hypothetical increases on the left side of the figure are truly enormous. For example, actual post-1990 immigration increased the working-age share by 0.5 percentage points, but if immigration had been doubled, the increase only would have been another 0.4 percentage points, while tripling it would raise it only an additional 0.3 percentage points. The effect continues to diminish if you quadruple and then quintuple the level. It should be added that this finding of diminishing returns on increasing the working-age share from even higher levels of immigration is entirely consistent with our findings in our population projections published earlier this year.4
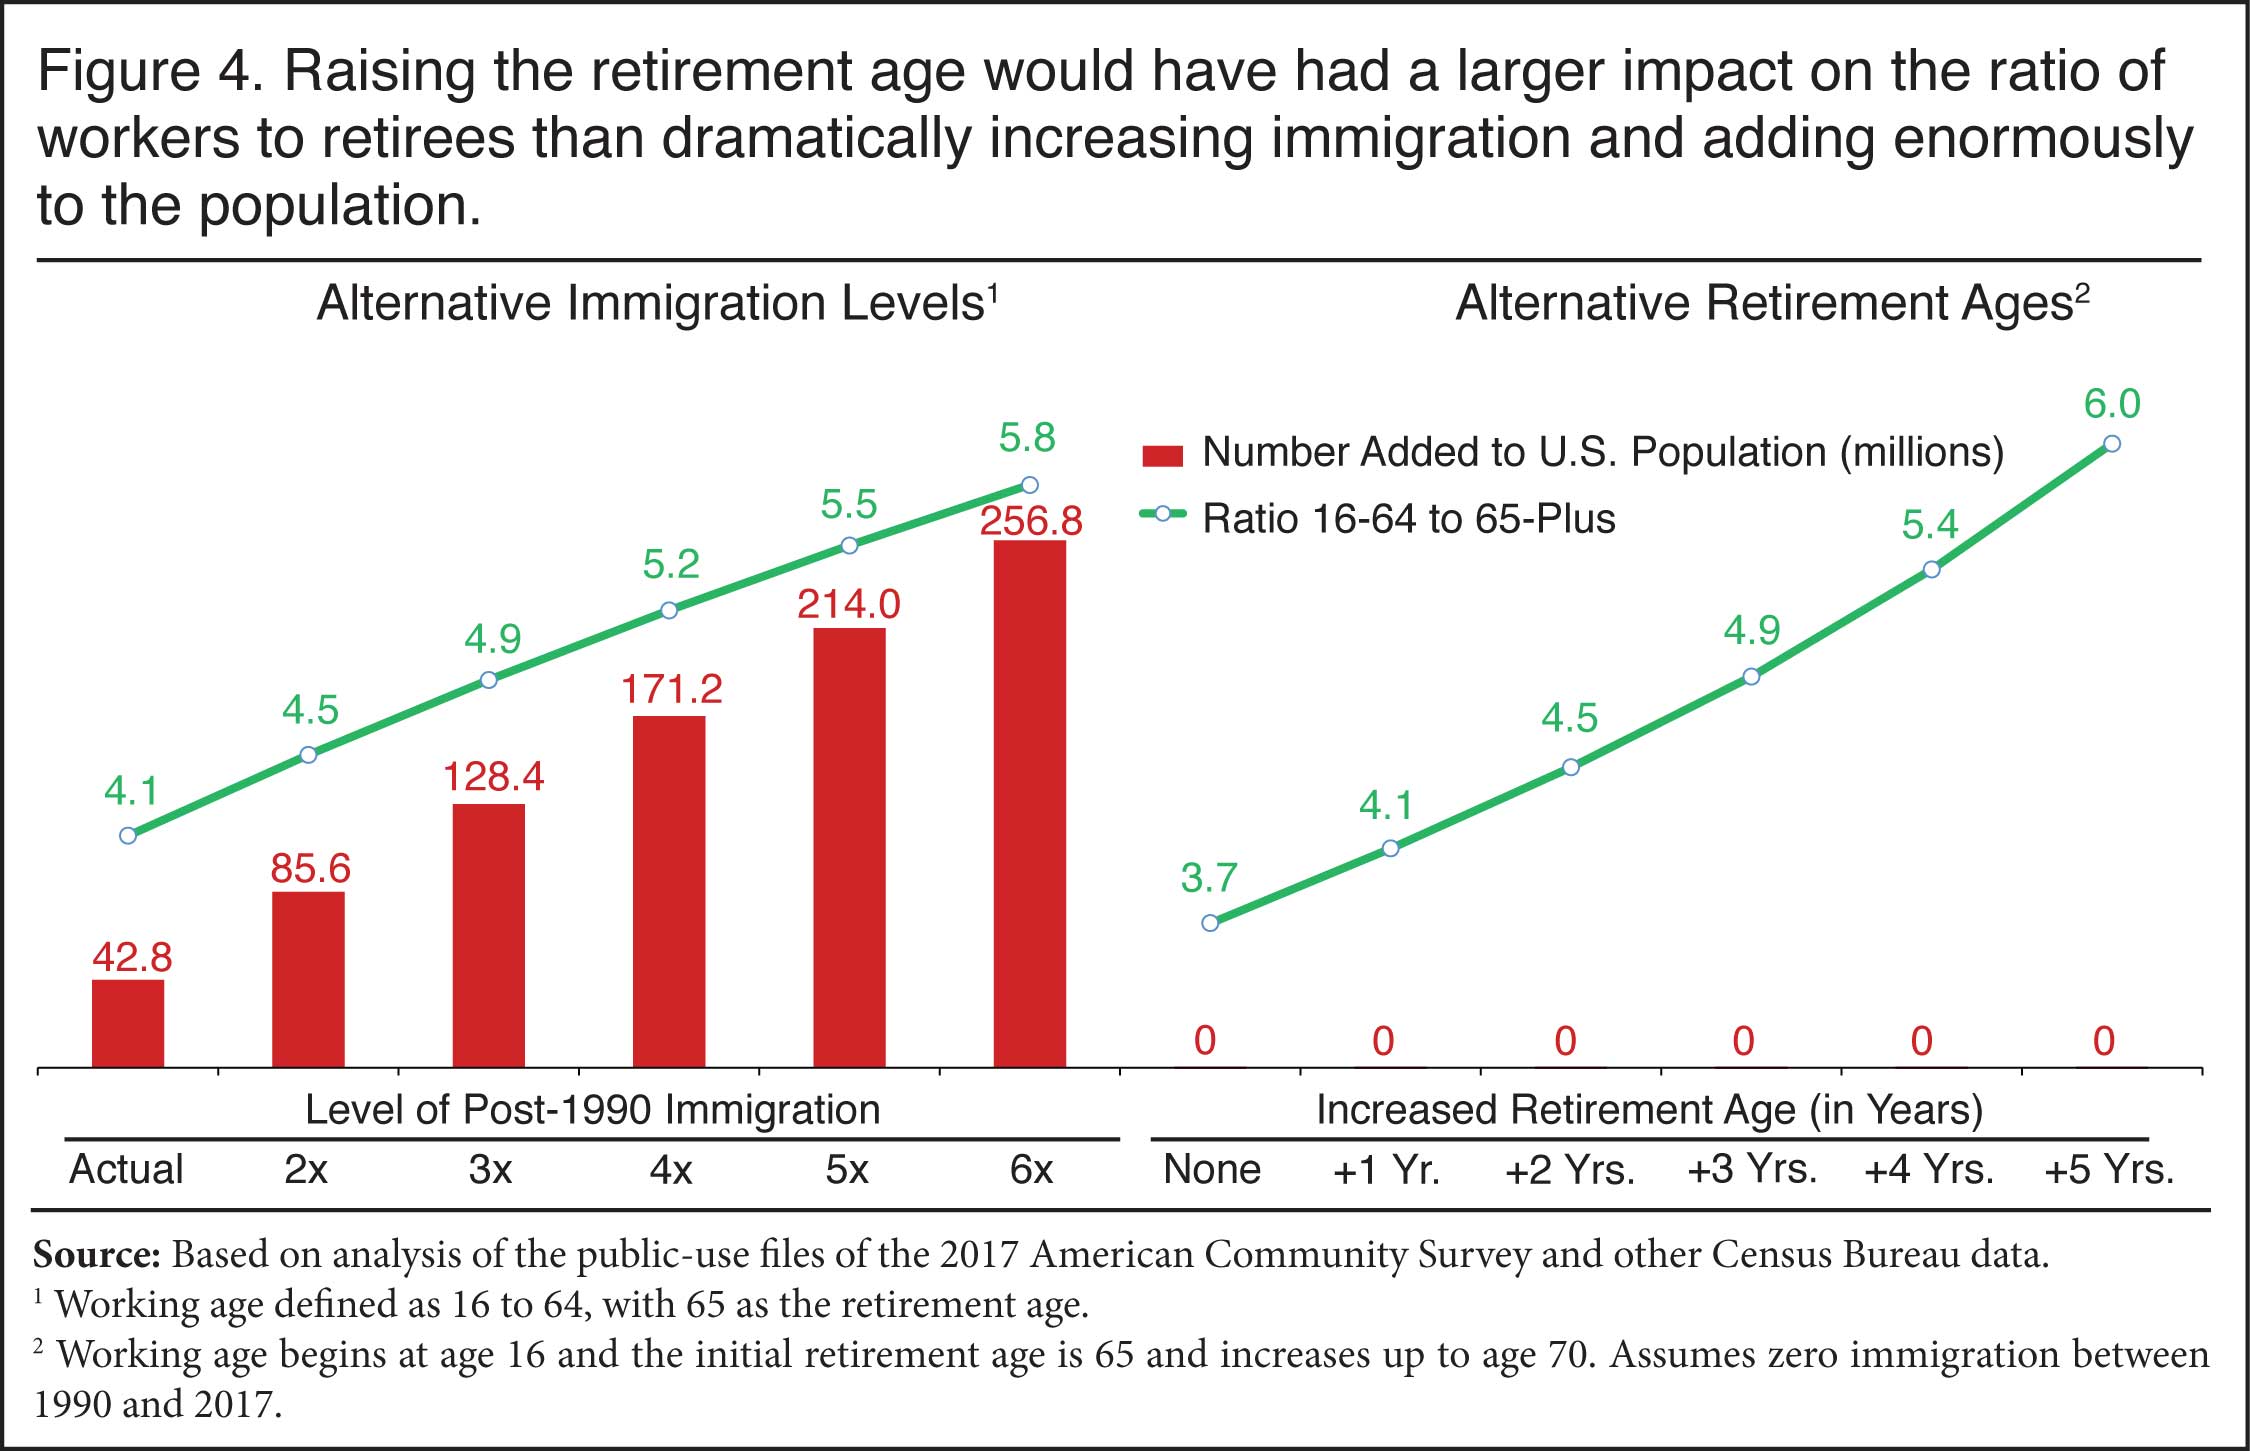
Impact on Ratio of Workers to Retirees. Figure 4 is similar to Figure 3 except that it reports the impact of different scenarios on the ratio of working-age people to retirees rather than the working-age share. The left side of the figure shows the impact of immigration levels on the ratio of workers to retirees. Figure 4 shows that immigration had more of an effect on the ratio of potential workers to potential retirees than it does on the working-age share. Nevertheless, raising the retirement age by one year would have the same impact on the ratio of workers to retirees as all 42.8 million post-1990 immigrants and their progeny. In the unlikely event that immigration was double what it was post-1990, the figure shows that it would have the same impact on the ratio of workers to retirees as increasing the retirement age by two years. The various scenarios in Figure 4 show that raising the retirement age only a few years would have had the same or a larger effect on the worker to retiree ratio than would unrealistically high levels of immigration.
 |
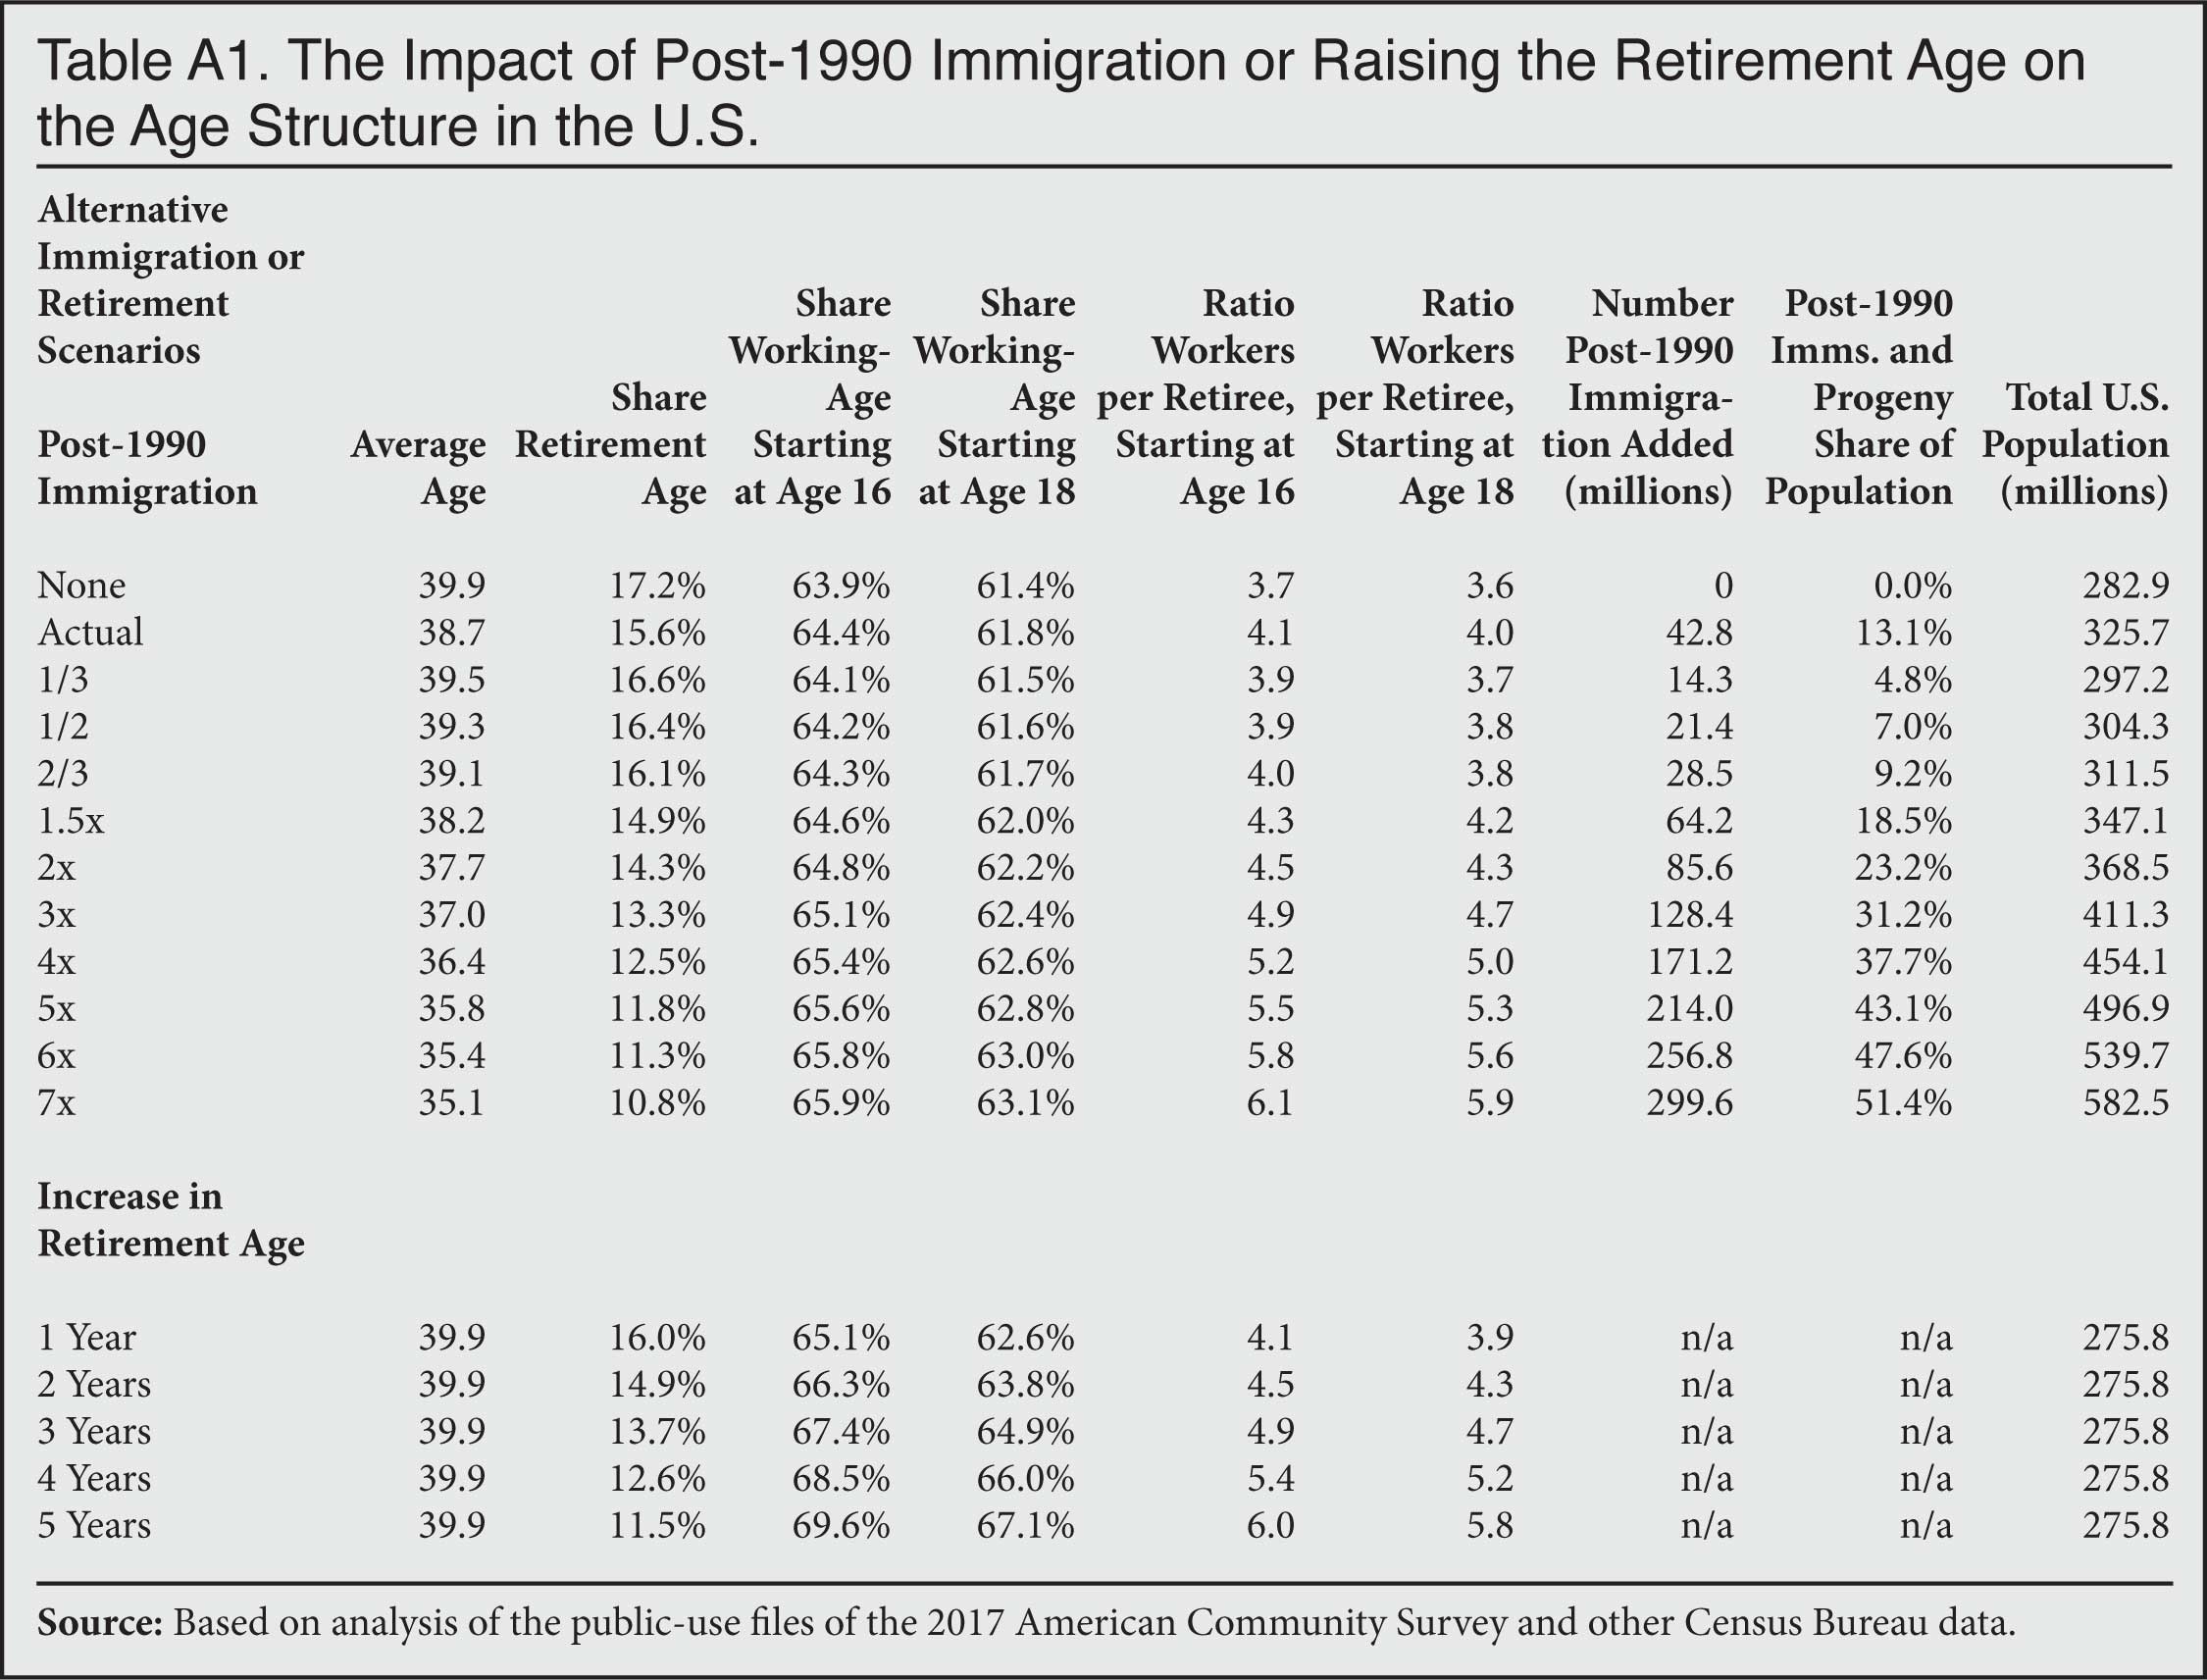
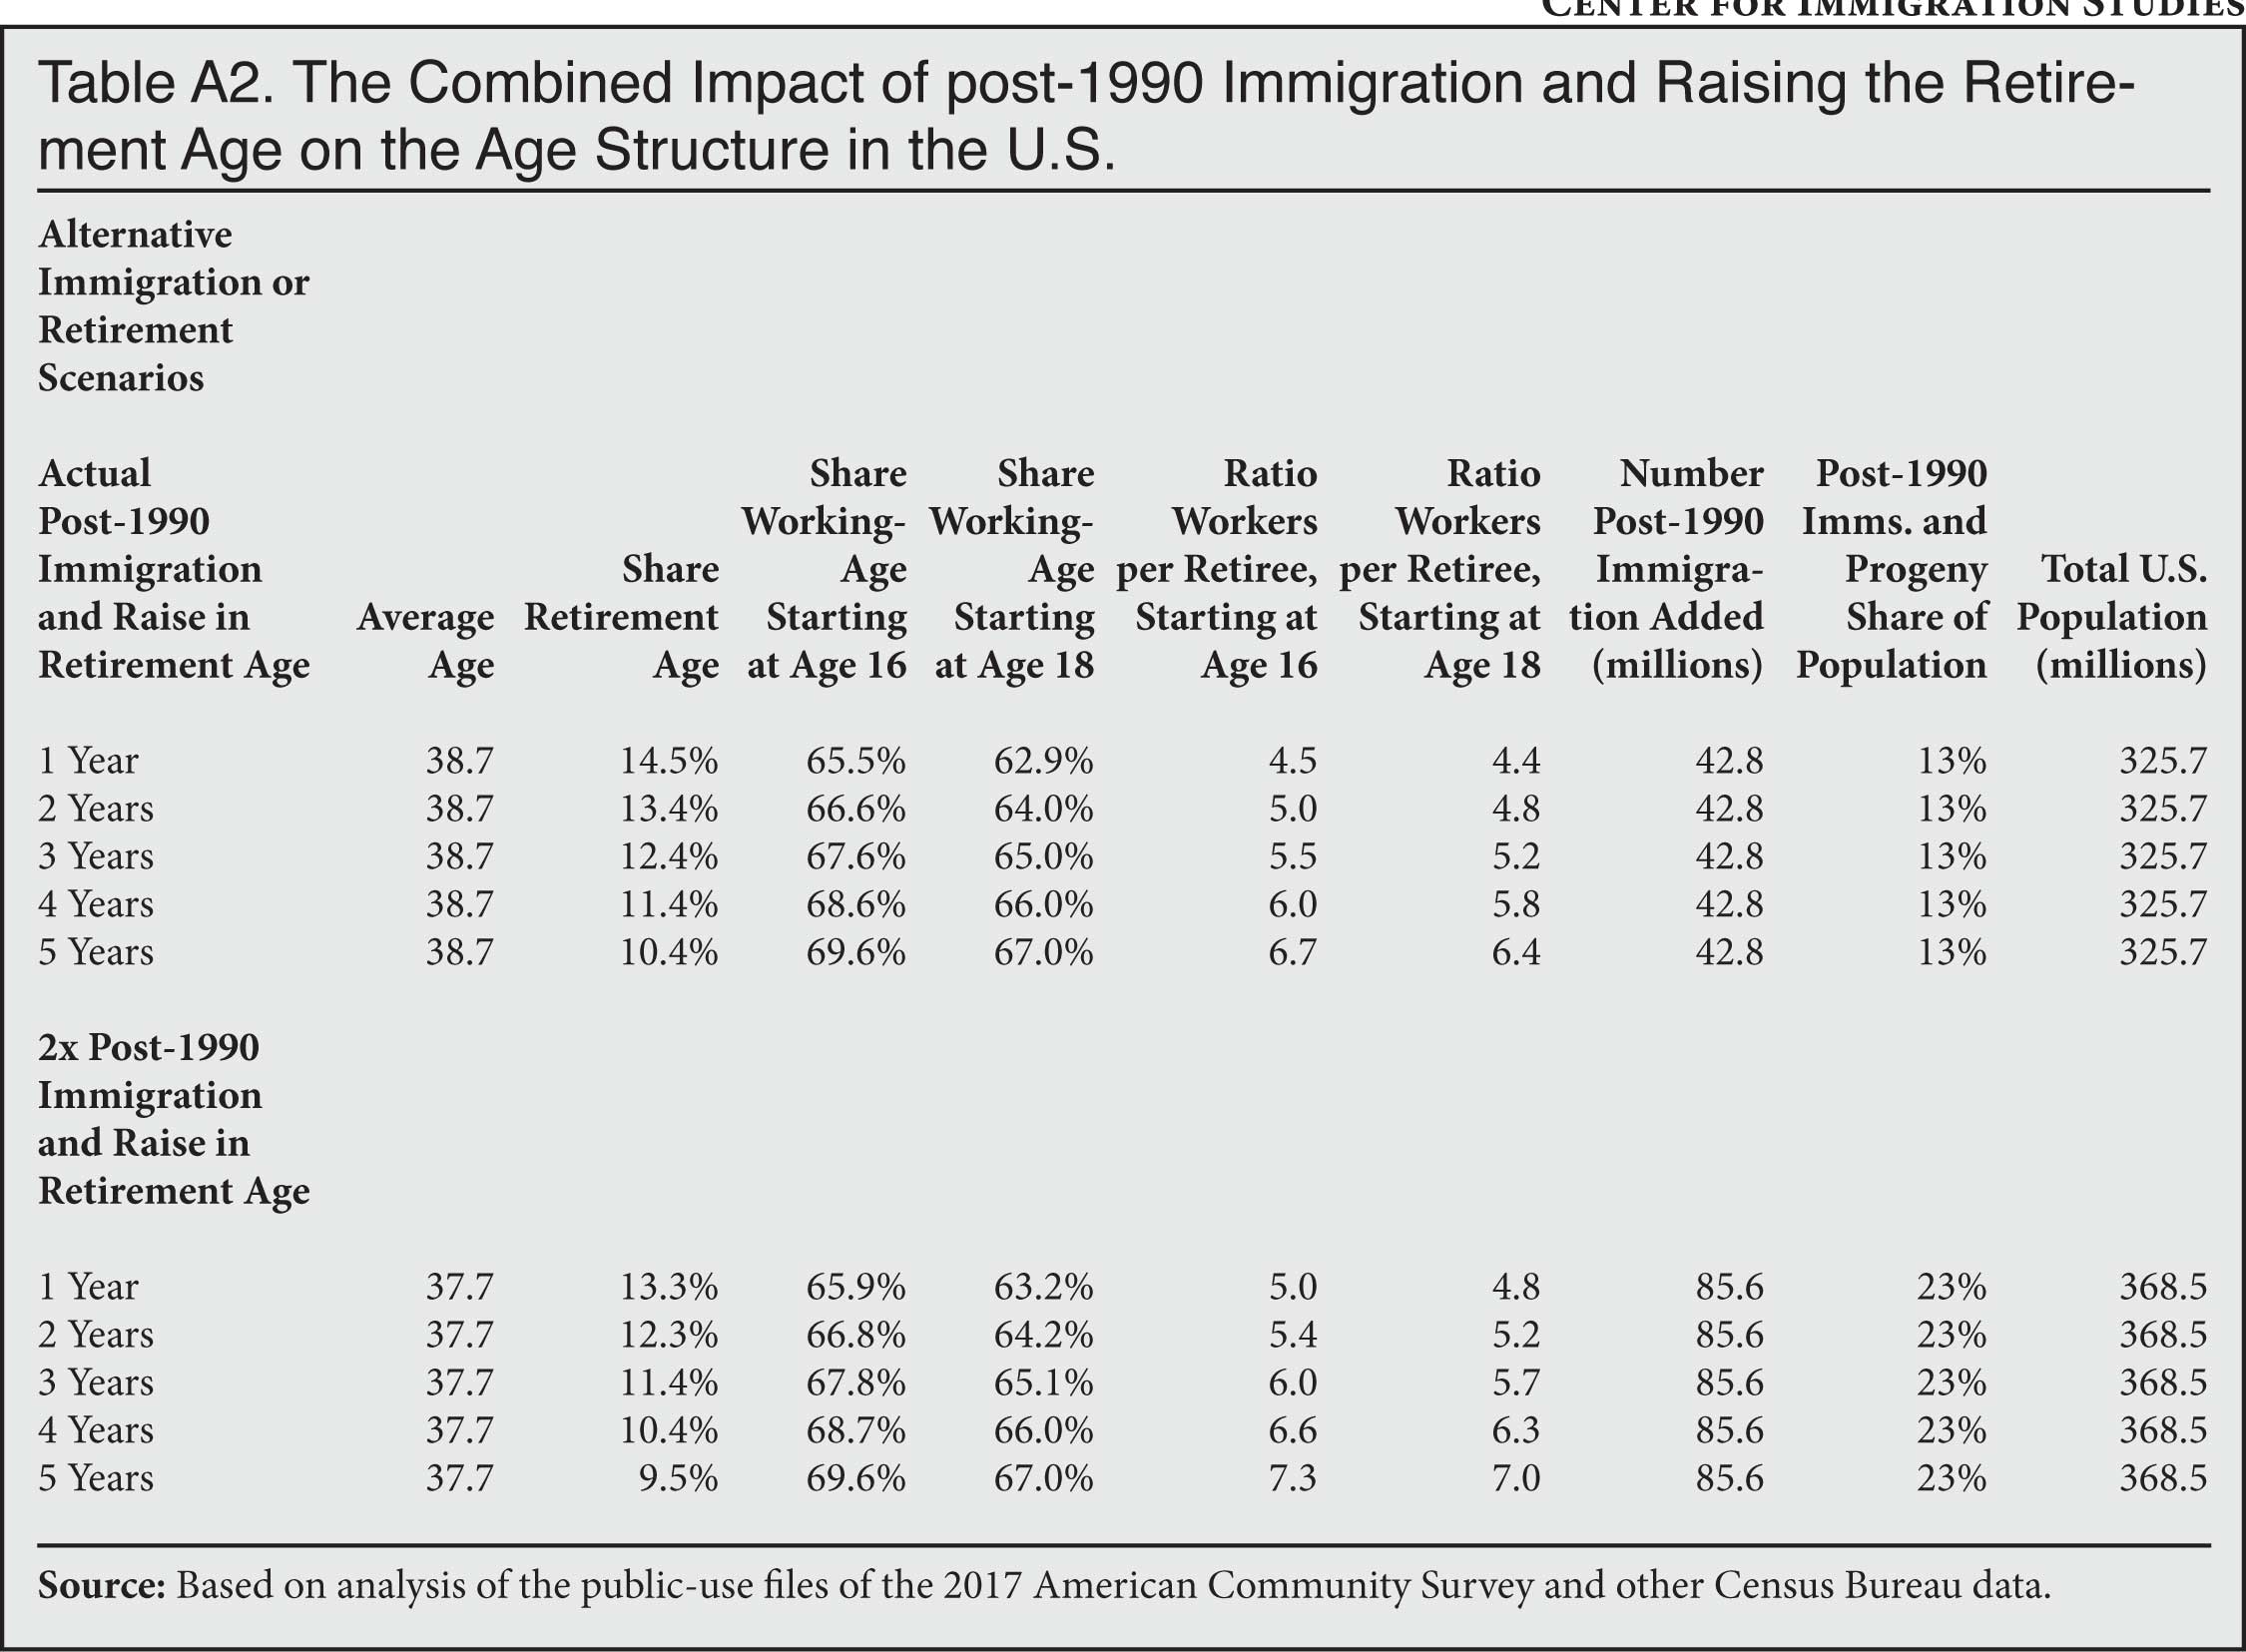
Other Scenarios. Table A1 in the appendix provides a more detailed look at the impact of immigration on the working age, worker to retiree ratio, and several other ways of looking at the nation’s age structure. With the exception of the average age, which cannot be changed by raising the retirement age, the table shows that raising the retirement age has as large or a larger impact on the age structure as it relates to having enough workers to support the economy or pay for government. Table A2 shows the impact of post-1990 immigrants and doubling it coupled with raising the retirement age.
Paying for Social Insurance Programs. A key argument for immigration as it relates to aging stems from the concern that more workers are needed to pay for Social Security and Medicare. Prior research by others, as well as this analysis, shows that immigration’s ability to change the working-age share of the population or the ratio of workers to retirees is quite limited. But putting that issue aside, for immigration to actually help pay for social insurance programs immigrants would need to be a fiscal surplus — paying more in taxes than they use in services while they are young before they grow old and begin to draw from these programs. Unfortunately, many post-1990 immigrants and their children struggle, accessing welfare programs at higher rates than the native-born.
Table 1 shows that a significantly larger share of households headed by post-1990 immigrants or their adult children access one or more major welfare programs compared to the native-born. The table also shows that the percentage living in or near poverty is a good deal higher than the native-born and that their average income is lower. In or near poverty in Table 1 is defined as less than 200 percent of the poverty threshold; those below this level tend to pay zero federal income tax. Tax payments mostly reflect income and the lower income and much higher poverty rates of post-1990 immigrants and their adult children will translate into lower average taxes relative to natives.
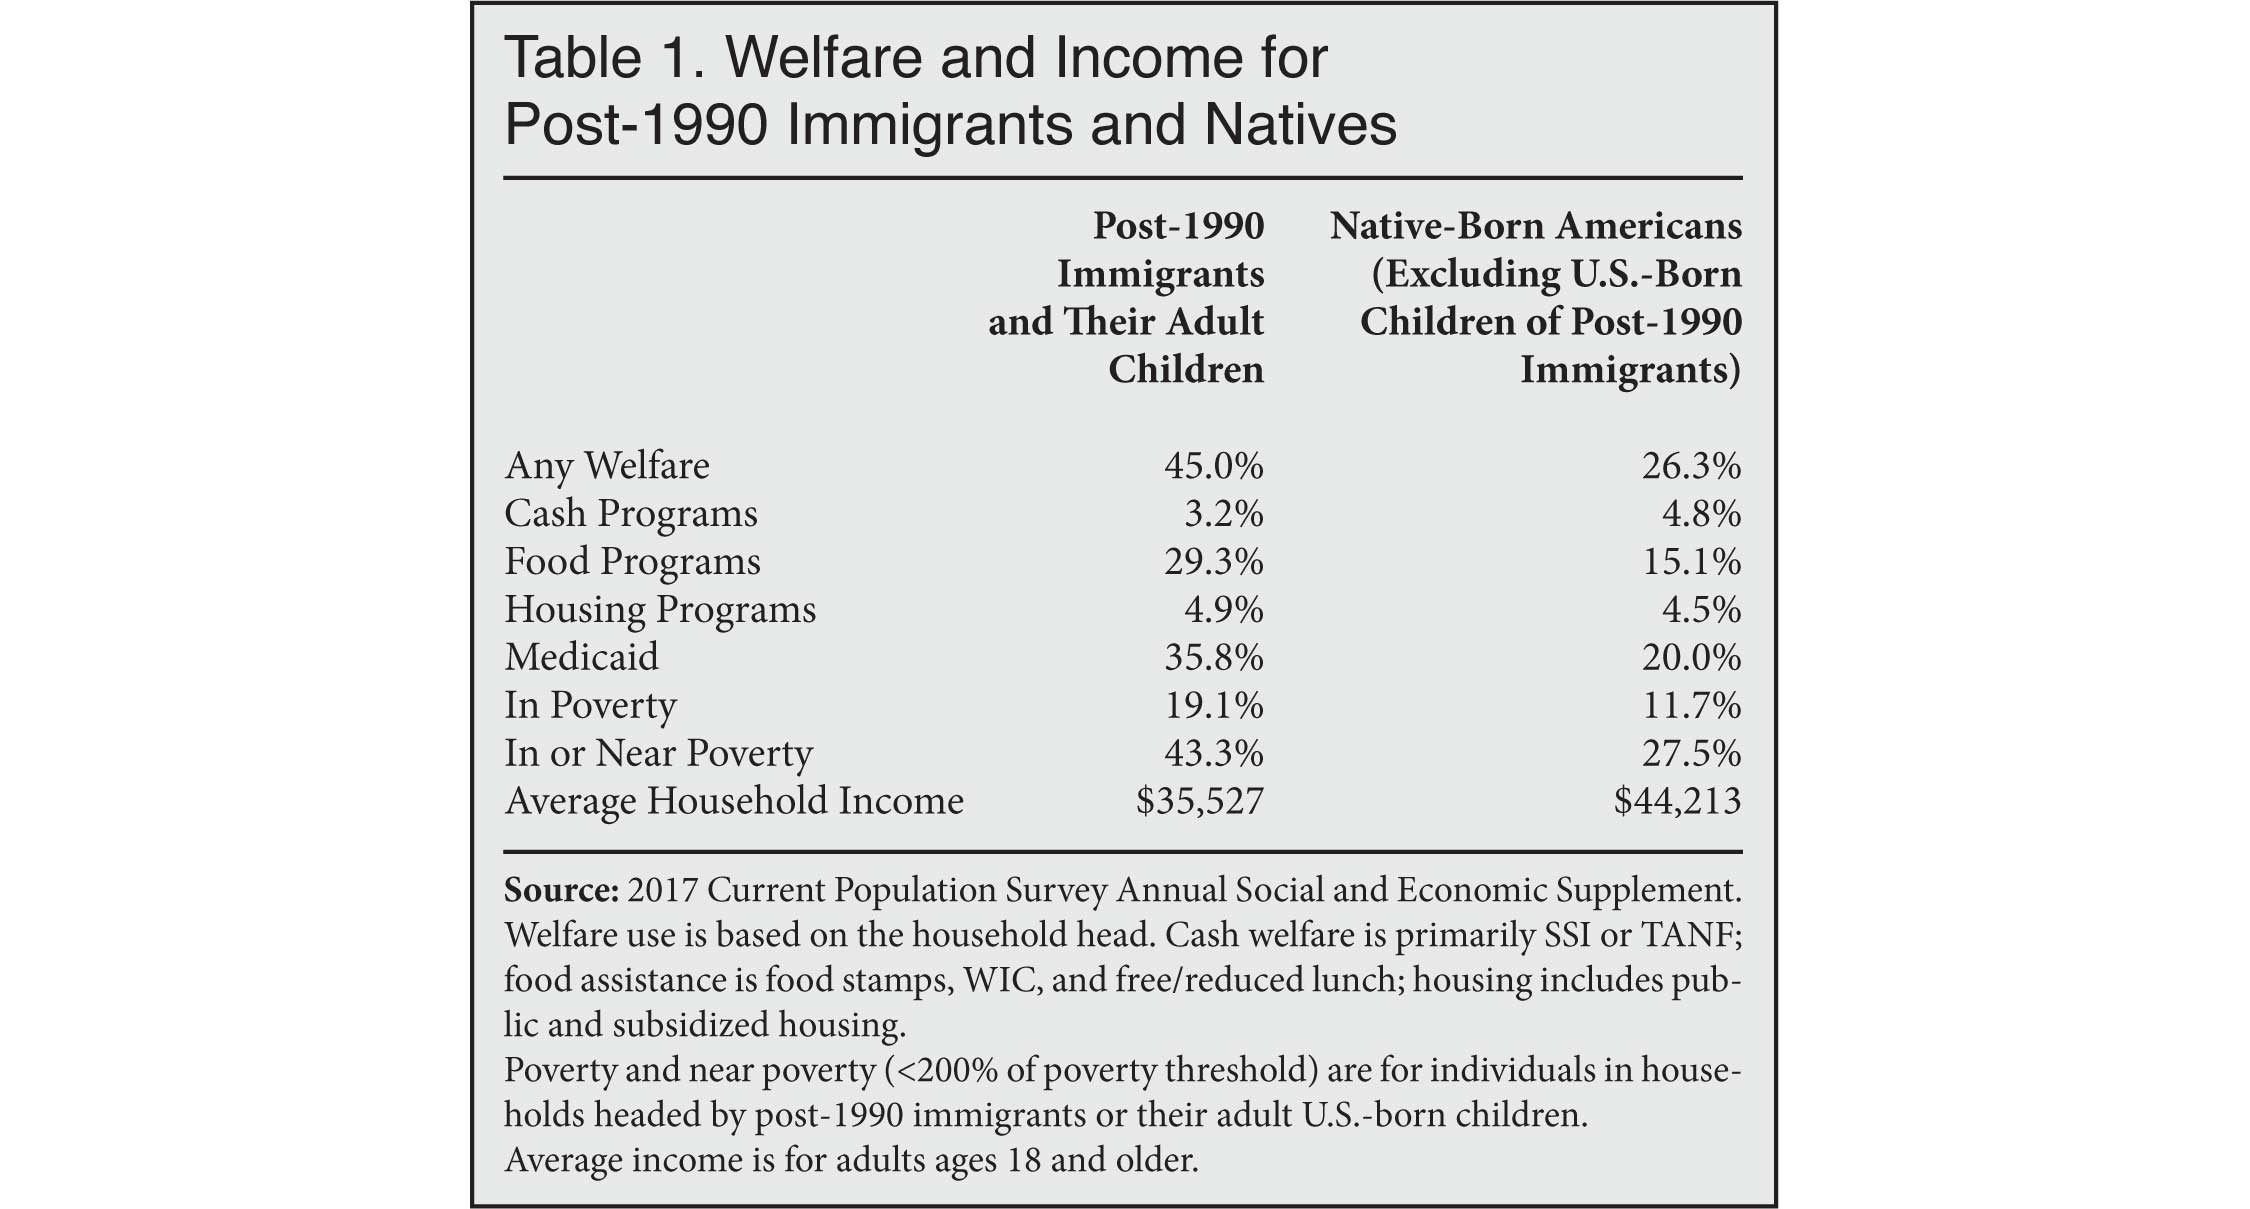 |
The poverty rates and share of post-1990 immigrant households accessing welfare is roughly 50 to 70 percent higher than those of the native-born, while their average income is 20 percent lower. If there is concern that the native-born are not generating enough tax revenue, relative to costs, to pay for social insurance programs, the high welfare use, poverty rate, and lower average income of post-1990 immigrants makes it almost certain they are not making the fiscal problem better, at least at the present time, even though they are relatively young and not making extensive use of Social Security and Medicare.
While Table 1 indicates that it is unlikely that post-1990 immigrants are a net fiscal benefit, it is not a fully developed model of all tax contributions and fiscal costs. In 2017, the National Academy of Sciences, Engineering, and Medicine (NAS) estimated the current net fiscal impact of all immigrants and their dependents. They ran eight different scenarios making different assumptions about current tax payments and use of public services. In all eight scenarios the immigrants were found to be a net fiscal drain, paying less in all taxes than the costs they create for government. Though they were found to be in surplus in four of the scenarios at the federal level, their large fiscal drain at the state level in every scenario offset the federal surplus in those four scenarios.5
Since all tax revenue has to come from taxpayers, it is of no help if immigrants create a fiscal benefit at the federal level — something that is unclear — that is entirely offset by deficits at the state and local level. The bottom line from the NAS analysis is that immigrants at the present time are a net fiscal drain, even though many are young and are not using programs designed for the elderly. This means that even if immigrants were able to dramatically shift the ratio of workers to retirees, it seems unlikely that they are going to help pay for social insurance programs by generating large fiscal surpluses in the short term. The reason for this is straightforward: Immigrants, including those who have arrived since 1990, are poorer than natives and make more extensive use of means-tested programs.
Illegal Immigration. While the specific impact of illegal immigration is not the focus of this analysis, we roughly estimate that there were 13.8 million post-1990 illegal immigrants in the country in 2017, plus their U.S.-born children and grandchildren. They accounted for 32 percent of all post-1990 immigrants and their progeny. It must be remembered that this is only the post-1990 illegal immigrant population and their offspring.6 Illegal immigrants who came prior to 1990 and their descendants are not included.7 It also does not include legal immigrants who resided in the United States illegally for a time before they obtained legal status or any offspring born during their time living in the country without authorization.8
Of the 13.8 million post-1990 illegal immigrants and their offspring, we estimate that 32.9 percent are under age 16, 66.8 percent are 16 to 64, and less than 1 percent are 65 and older. Like all persons added to the population by post-1990 immigration, the illegal post-1990 population is relatively young. Almost all are under age 16 or of working age. However, the presence of these illegal immigrants and their children and grandchildren still has only a minuscule impact on the working-age share.
Without post-1990 illegal immigration, the working-age share in the United States would be 64.3 percent, almost the same as the 64.4 percent when they are included. The reason for this is straightforward. Post-1990 illegal immigrants are 4.2 percent of the total population and, as already discussed, their working-age share is 66.8, not very different from the 64.3 for all other persons — native-born, legal immigrants, and pre-1990 illegal immigrants. So their ability to impact the working-age percentage is very limited. The same holds true for their impact on the ratio of workers to retirees. Without post-1990 illegal immigrants and their descendants, the ratio of workers to retirees would be 4.0 compared to 4.1 when they are included. Like their impact on the working-age share, their impact on the ratio of potential workers to potential retirees is quite small.
As previously discussed (See Figure 2, for example), we found that all post-1990 immigration (legal and illegal) increased the working-age share from 63.9 percent to 64.4 percent. So based on the results above, we estimate that 0.1 percentage points of this increase is illegal immigration and 0.4 points is from legal immigration. In terms of the impact on the ratio of workers to retirees, we found that all post-1990 immigration increased the ratio from 3.7 to 4.1. This means that of this 0.4-point increase, 0.1 is from illegal immigration. Since post-1990 illegal immigrants and their progeny account for less than one-third of all post-1990 immigrants and their progeny, it makes sense that their impact on the nation’s age structure will be very limited.
Conclusion
This report first estimates the number of people immigration — immigrants plus their progeny — added to the United States between 1990 and 2017. We then use this large and relatively young population to evaluate the argument that immigration can solve the problem of America’s aging society. We find that, although post-1990 immigration added almost 43 million people to the country, it had a minimal impact on the share of the population who are of working age. This is because it added to both the working-age population and to those outside of the working-age population in nearly equal proportions. Post-1990 immigration had a somewhat larger impact on the ratio of workers to retirees. However, raising the retirement age even one year increases the ratio of workers to retirees the same as all-post 1990 immigration, without increasing the size of the U.S. population.
Immigrants, it must be remembered, arrive at all ages and grow older over time and have children, so while they add to the working-age population and thus to the number of potential workers, they also add to the population that must be supported by the labor of others — children and the elderly. Immigrants are people. They are not simply the idealized young workers in perpetuity that many immigration advocates seem to imagine. To be sure, one can advocate for immigration for other reasons. But prior research, as well as this analysis, makes clear that the notion immigration will dramatically increase the number of workers relative to retirees or the rest of population is mistaken.
Methods Appendix
To estimate the number and ages of post-1990 immigrants in 2017, we used the following method: First, we used the year of arrival question from the ACS to identify all post-1990 immigrants living in the country in 2017. Second, to calculate the age and number of the U.S.-born minor children (<18) of post-1990 immigrants, we assume they live with their immigrant parent(s) and link the child to the parent in the ACS. If the U.S.-born grandchild of the post-1990 immigrant lives with the parent, we capture these individuals in this step as well. We assume that the small number of the U.S.-born children of post-1990 immigrants who themselves are minors (15 to 17) and have a child will live with their immigrant parents. So later we only calculate the number of U.S.-born grandchildren whose parents are adults in 2017. Third, we estimate the share of all children born in the 1990s to immigrants whose parents arrived in that decade based on the 2000 census. This is necessary so we can determine the number of adults with immigrant parents who arrived in the 1990s. Fourth, using the March 2017 Current Population Survey (CPS), we calculate the number of U.S.-born adults with immigrant fathers born in the 1990s. The CPS, unlike the ACS, asks about parents’ place of birth, so using it allows us to estimate the number of adult children of immigrants born in the 1990s. Of post-1990 immigrants, only those who arrived in the 1990s can have adult children in 2017. Fifth, we use the number of U.S.-born persons with immigrant fathers ages 18 to 27 in 2017 and multiply it by the population share calculated in step three to determine the number of U.S.-born persons in 2017 with immigrant fathers who are the children of immigrants who specifically arrived in the 1990s. This allows us to estimate the number of adult children of 1990s immigrants in 2017.
Sixth, we calculate the number of grandchildren born to 18- to 27-year-old, native-born persons who are the children of 1990s immigrants. We begin by calculating the birth rate of U.S.-born persons 18- to 27-years-old by race and Hispanic origin starting when the first of these individuals turned 15 in 2005. (Births by race and nativity are derived from the 2005 to 2017 ACS. In step seven, we add together the number of post-1990 immigrants, their U.S.-born minor children, adult children, and grandchildren by individual year of age. We then use these numbers to calculate the results reported in the figures and tables of this report.
 |
 |
End Notes
1 "Fast Facts", National Center for Education Statistics, undated.
2 See Carl P. Schmertmann, "Immigrants' Ages and the Structure of Stationary Populations with Below-Replacement Fertility", Demography, Vol. 29, No. 4, November 1992; Thomas J. Espenshade, "Can Immigration Slow U.S. Population Aging?", Journal of Policy Analysis and Management, Vol. 13, No. 4 (Autumn, 1994), pp.759-768; "Replacement Migration: Is It a Solution to Declining and Ageing Populations?", United Nations Department of Economic and Social Affairs, Population Division, March 2000. The 2000 Census Bureau population projections can be found here. See Steven A. Camarota and Karen Zeigler,"Projecting the Impact of Immigration on the U.S. Population: A look at size and age structure through 2060", Center for Immigration Studies Backgrounder, February 4, 2019.
3 Steven A. Camarota and Karen Zeigler, "Immigrants Are Coming to America at Older Ages: A look at age at arrival among new immigrants, 2000 to 2017", Center for Immigration Studies Backgrounder, July 1, 2019.
4 Steven A. Camarota and Karen Zeigler, "Projecting the Impact of Immigration on the U.S. Population: A look at size and age structure through 2060", Center for Immigration Studies Backgrounder, February 4, 2019.
5 See Table 8-12 (p. 430) in The Economic and Fiscal Consequences of Immigration, Francine D. Blau and Christopher Mackie, Eds., Washington, D.C.: National Academies of Sciences, Engineering, and Medicine, 2017, which can be downloaded here.
6 We arrive at this estimate using the approach relied on in an earlier analysis by matching the size and characteristics of the illegal population published by the DHS. See Steven A. Camarota, Karen Zeigler, and Jason Richwine, "Births to Legal and Illegal Immigrants in the U.S.: A look at health insurance coverage among new mothers by legal status at the state and local level", Center for Immigration Studies Backgrounder, October 9, 2018. However, DHS's most recent estimates are for 2015 so we have to carry forward their estimates to 2017. This fact introduces more uncertainty to our estimates.
7 There are a significant number of long-time resident illegal immigrants in the country. In its 2015 estimate, the Department of Homeland Security estimated that there were 3.6 million illegal immigrants in the country who had been in the country for more than 20 years. If these individuals and their offspring were included, then the impact of illegal immigration would be correspondingly higher.
8 Robert Warren, formally with the INS and now with the Center for Migration Studies, has done some of the most detailed estimates of those leaving the illegal population by adjusting to legal status. He has estimated that from 1990 to 2010, 1.48 million illegal immigrants adjusted to legal status. All such individuals are not included in our illegal immigrant totals. See Table 3 in "Unauthorized Immigration to the United States: Annual Estimates and Components of Change, by State, 1990 to 2010", International National Migration Review, Vol. 47 Number 2 (Summer 2013): 296–329.