Download a PDF of this Backgrounder.
Steven A. Camarota is the director of research and Karen Zeigler is a demographer at the Center.
An analysis of the Census Bureau's American Community Survey shows that immigrants (legal and illegal) are coming to the United States at significantly older ages than in the past. The average age and the share arriving at or near retirement increased significantly in the last two decades. These findings have implications for the often-made argument that immigration makes the country significantly younger. The findings also have implications for public coffers because prior research indicates that younger immigrants tend to have a more positive lifetime fiscal impact than older immigrants. The nation's overall immigrant population is also aging rapidly.
Among the findings:
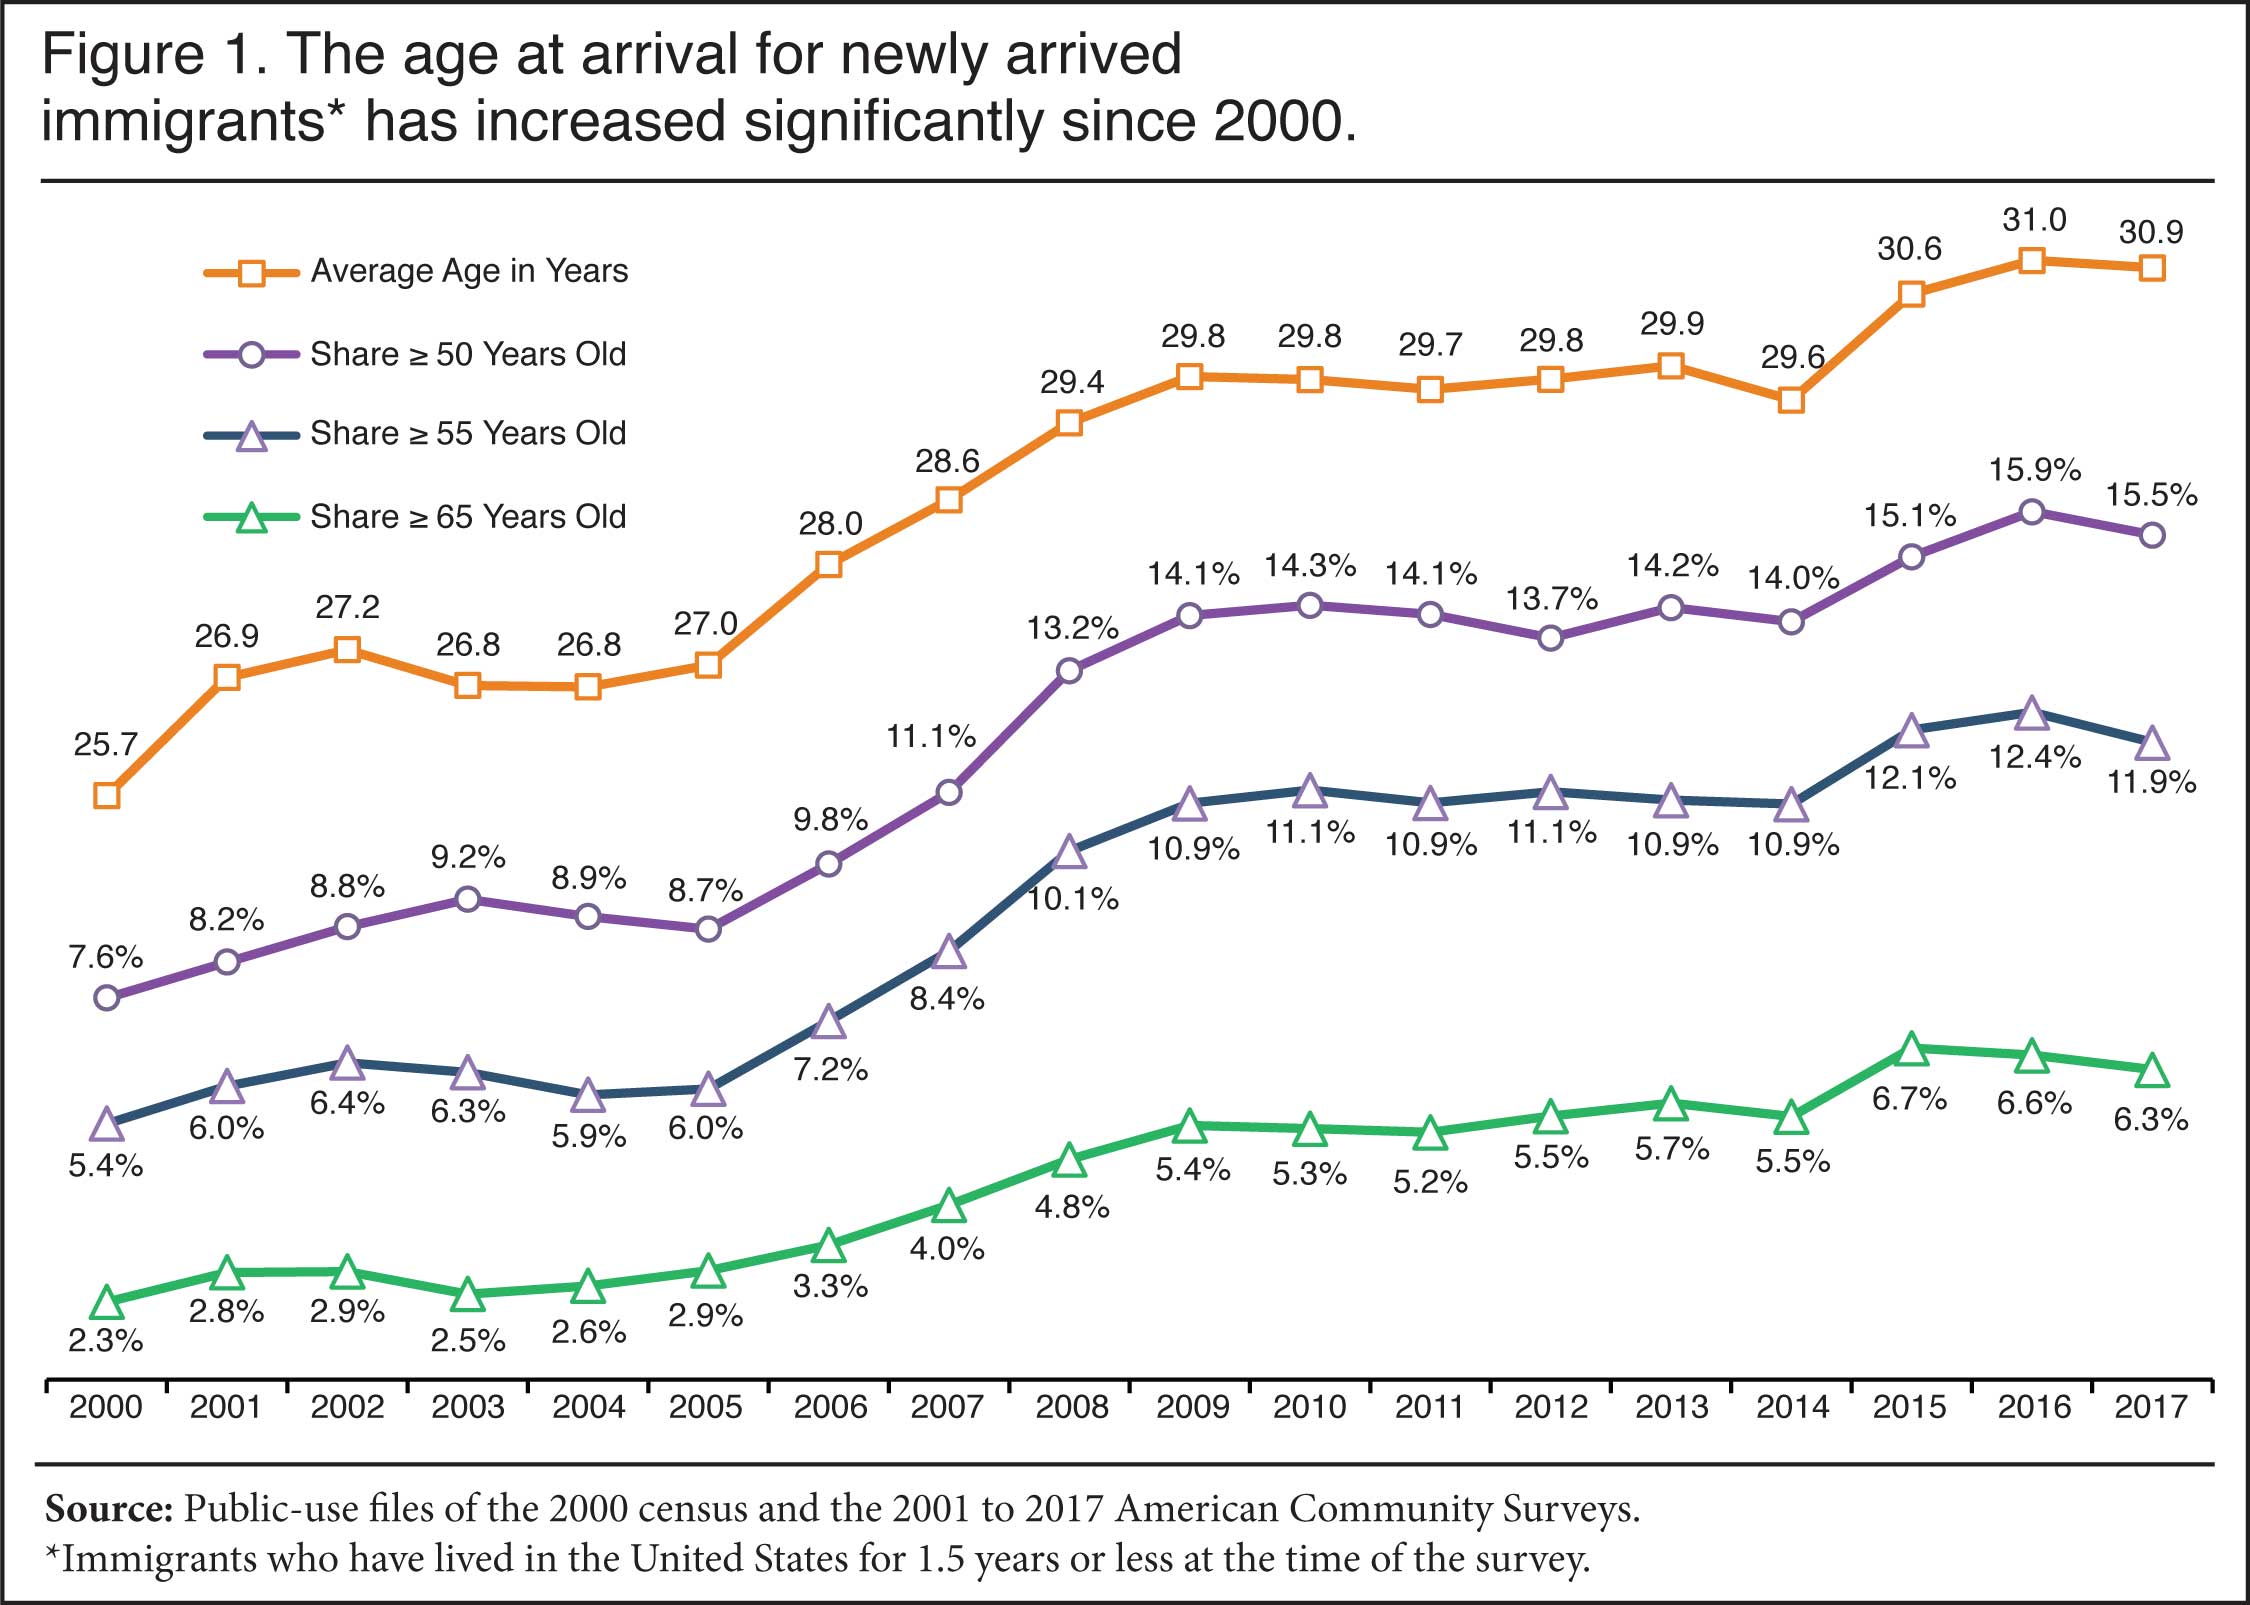
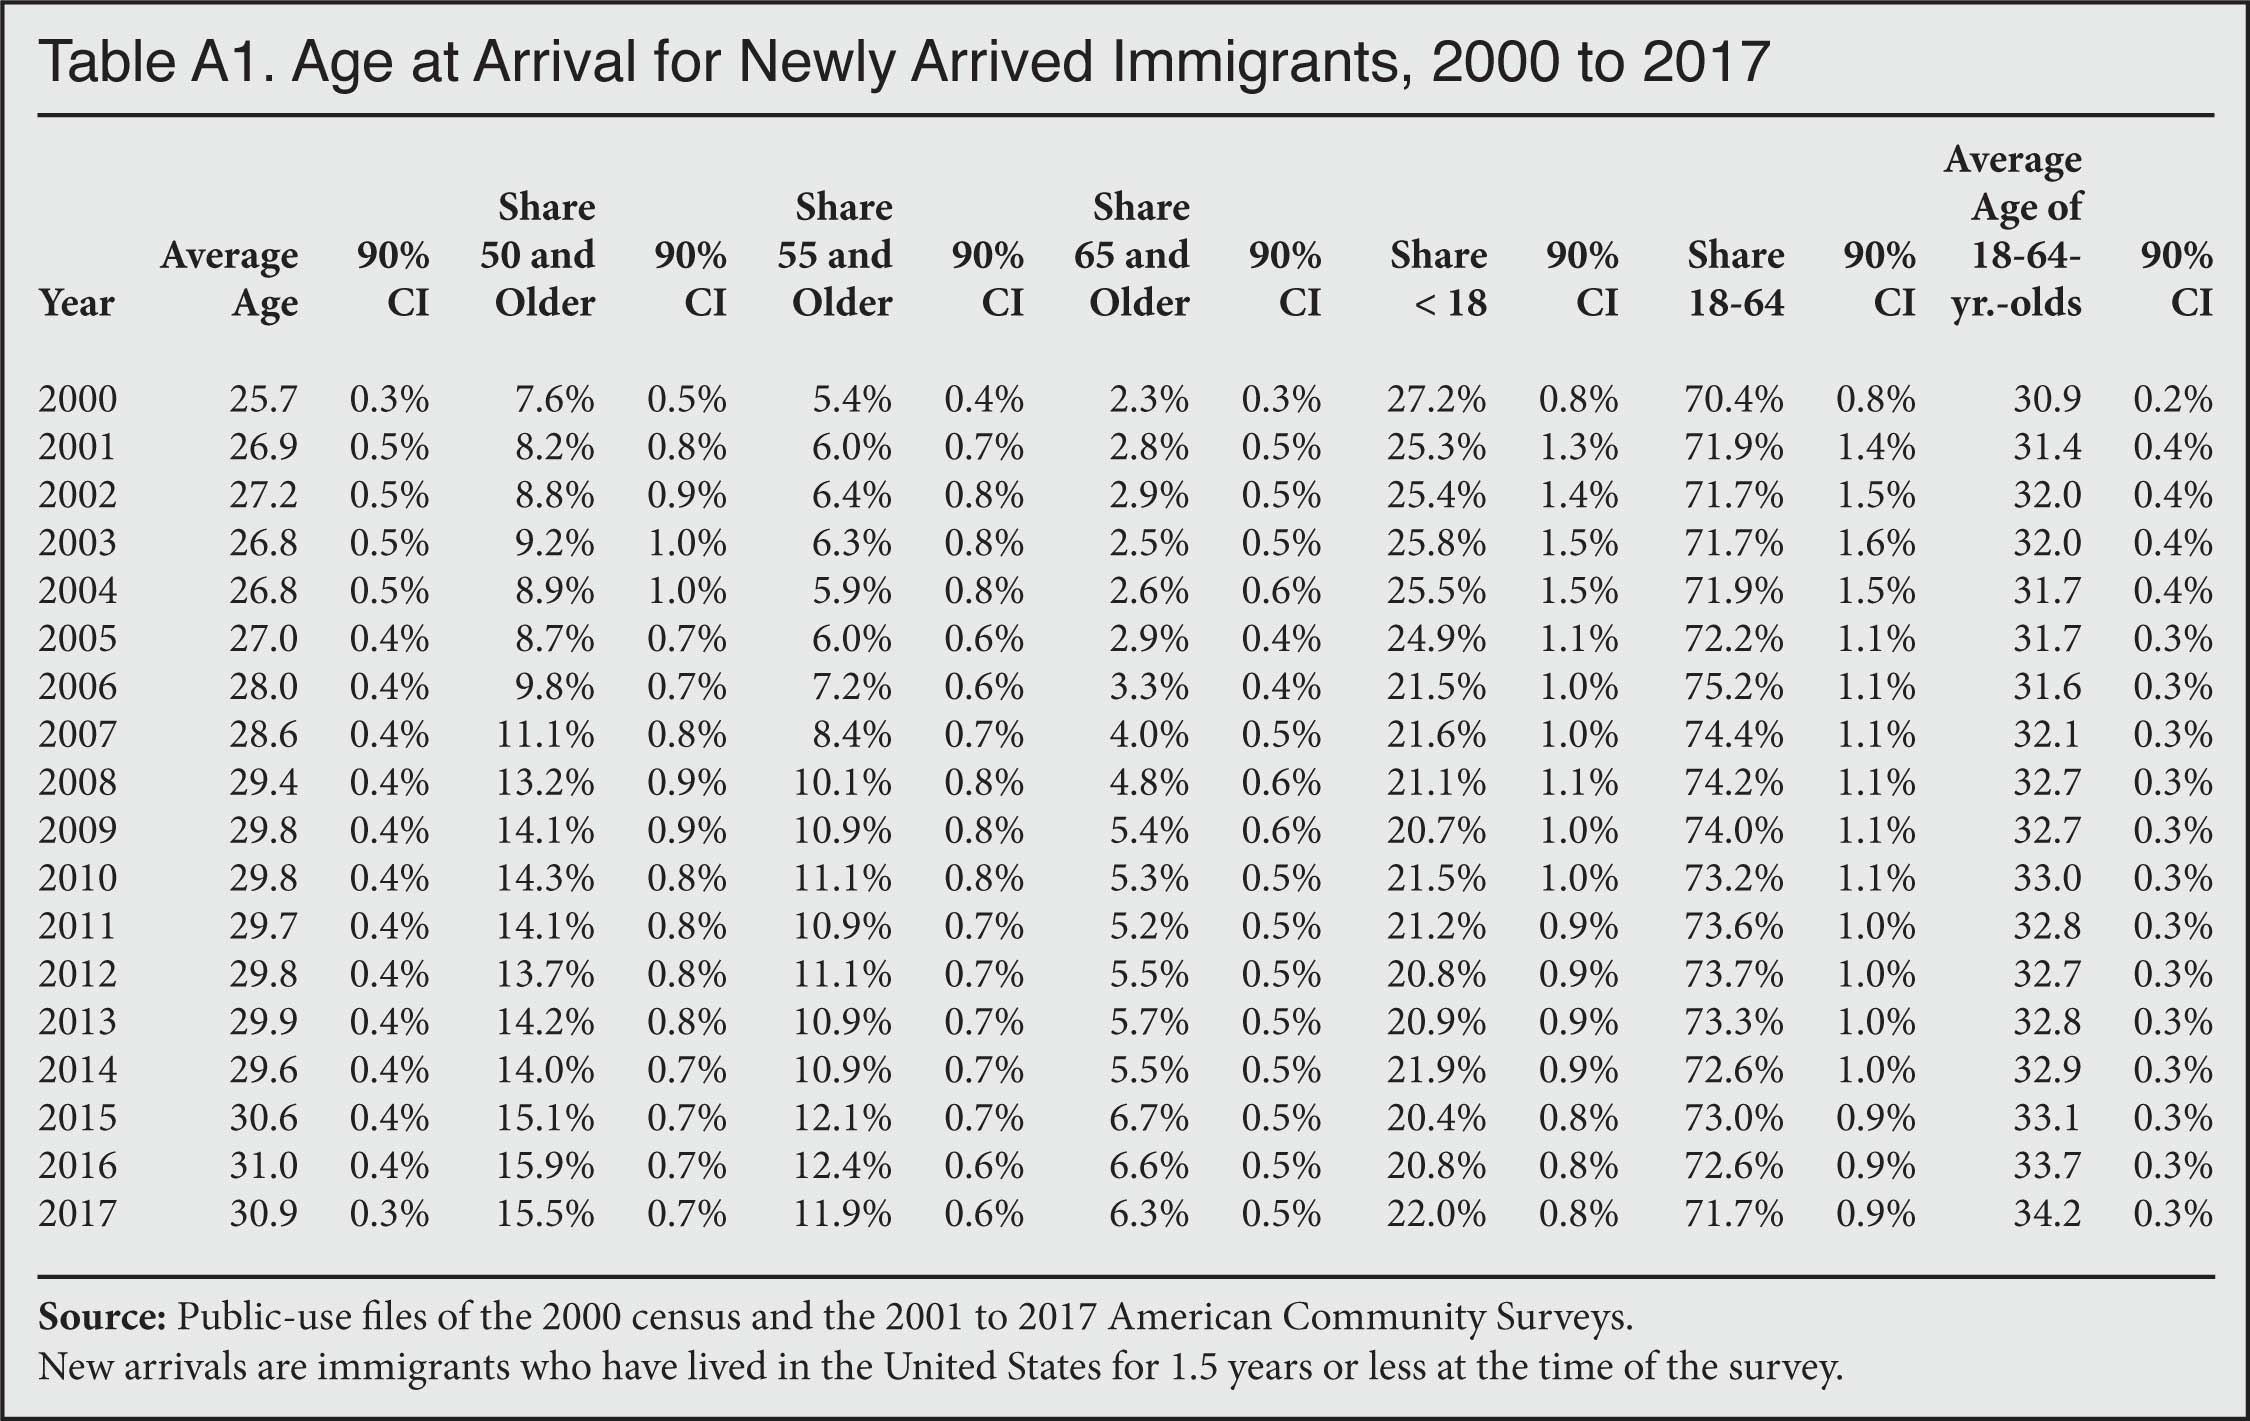
- The average age of newly arrived legal and illegal immigrants has increased from 26 in 2000 to 31 in 2017. The newly arrived are those who have lived in the country for 1.5 years or less at the time of the survey.
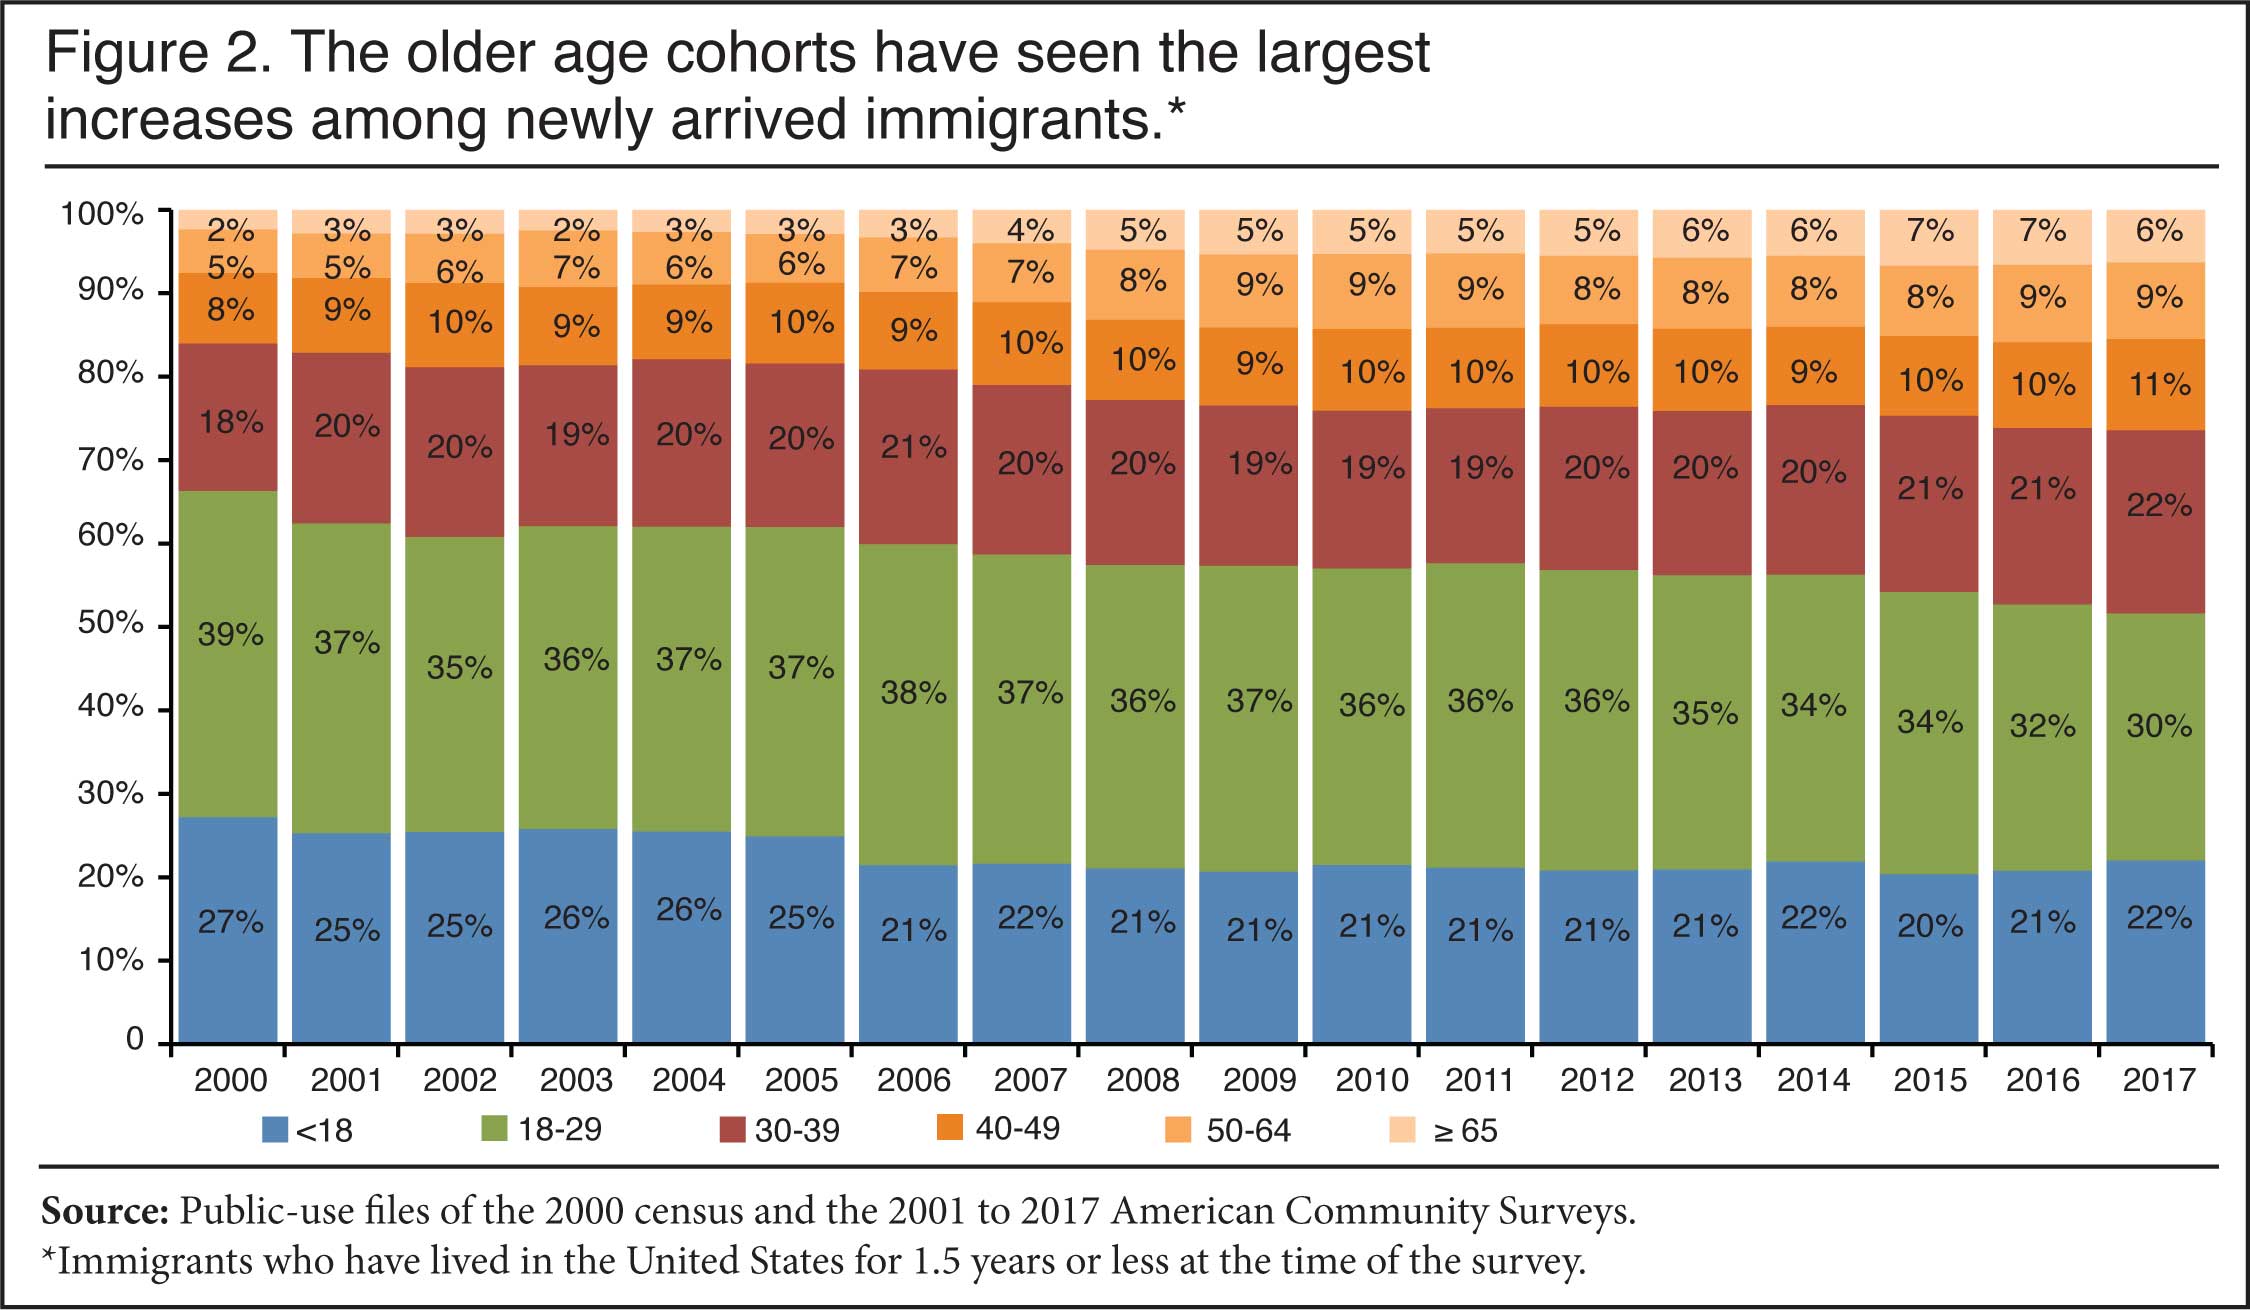
- Older age groups have seen the largest increases. The share of newly arrived immigrants who are 50 or over nearly doubled, from 8 percent to 15 percent; the share 55 and over more than doubled, from 5 percent to 12 percent; and the share 65 and older roughly tripled, from 2 percent to 6 percent.
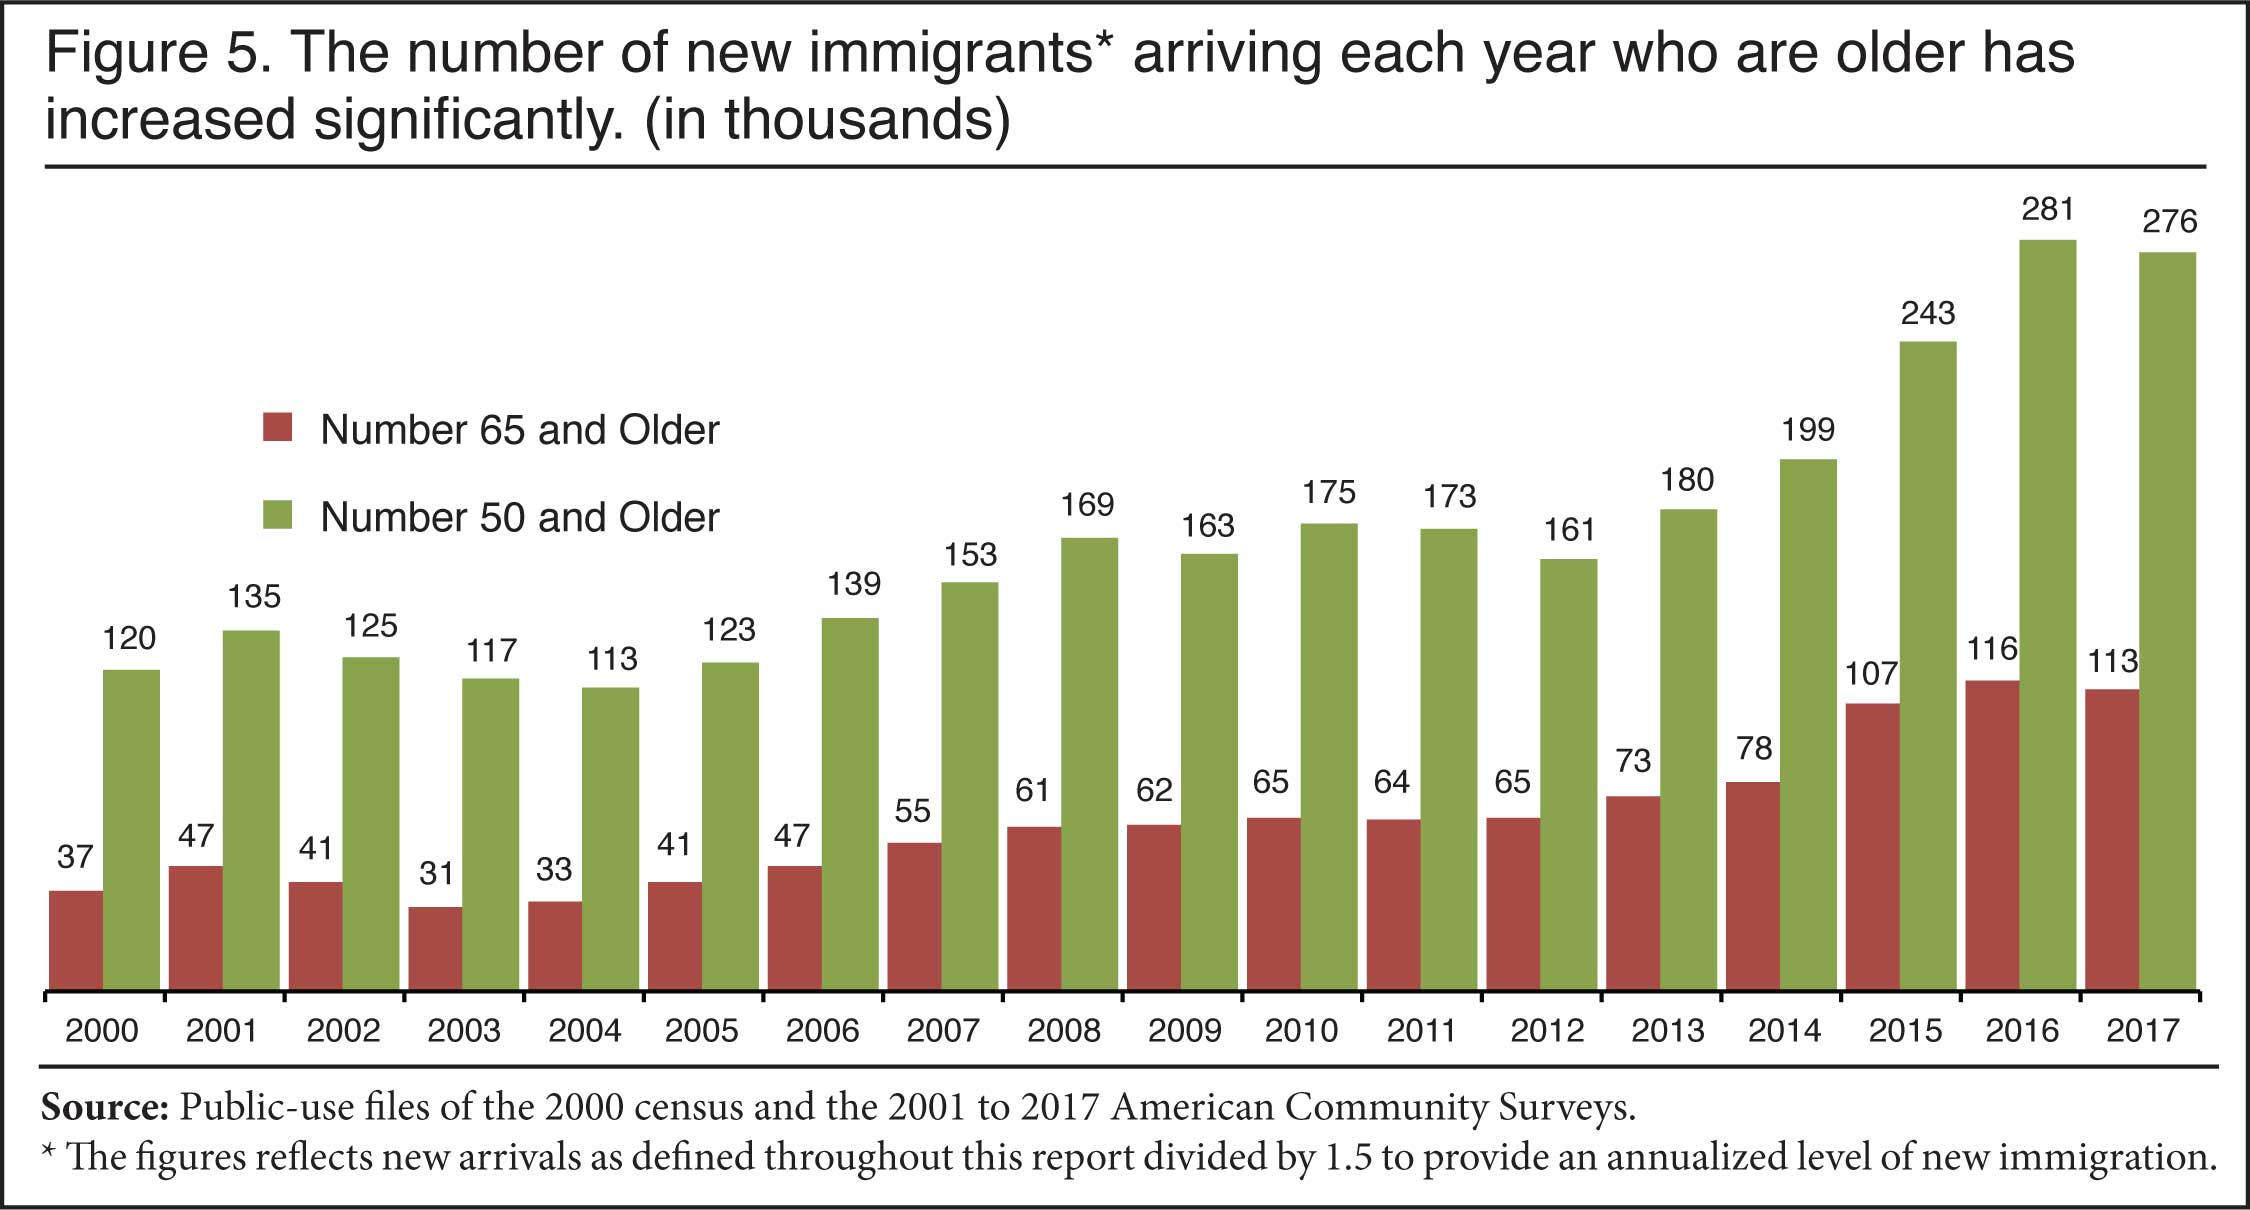
- On an annual basis, 276,000 immigrants 50 and older now settle in the country, including 213,000 immigrants 55 and older, and 113,000 who are 65 and older.
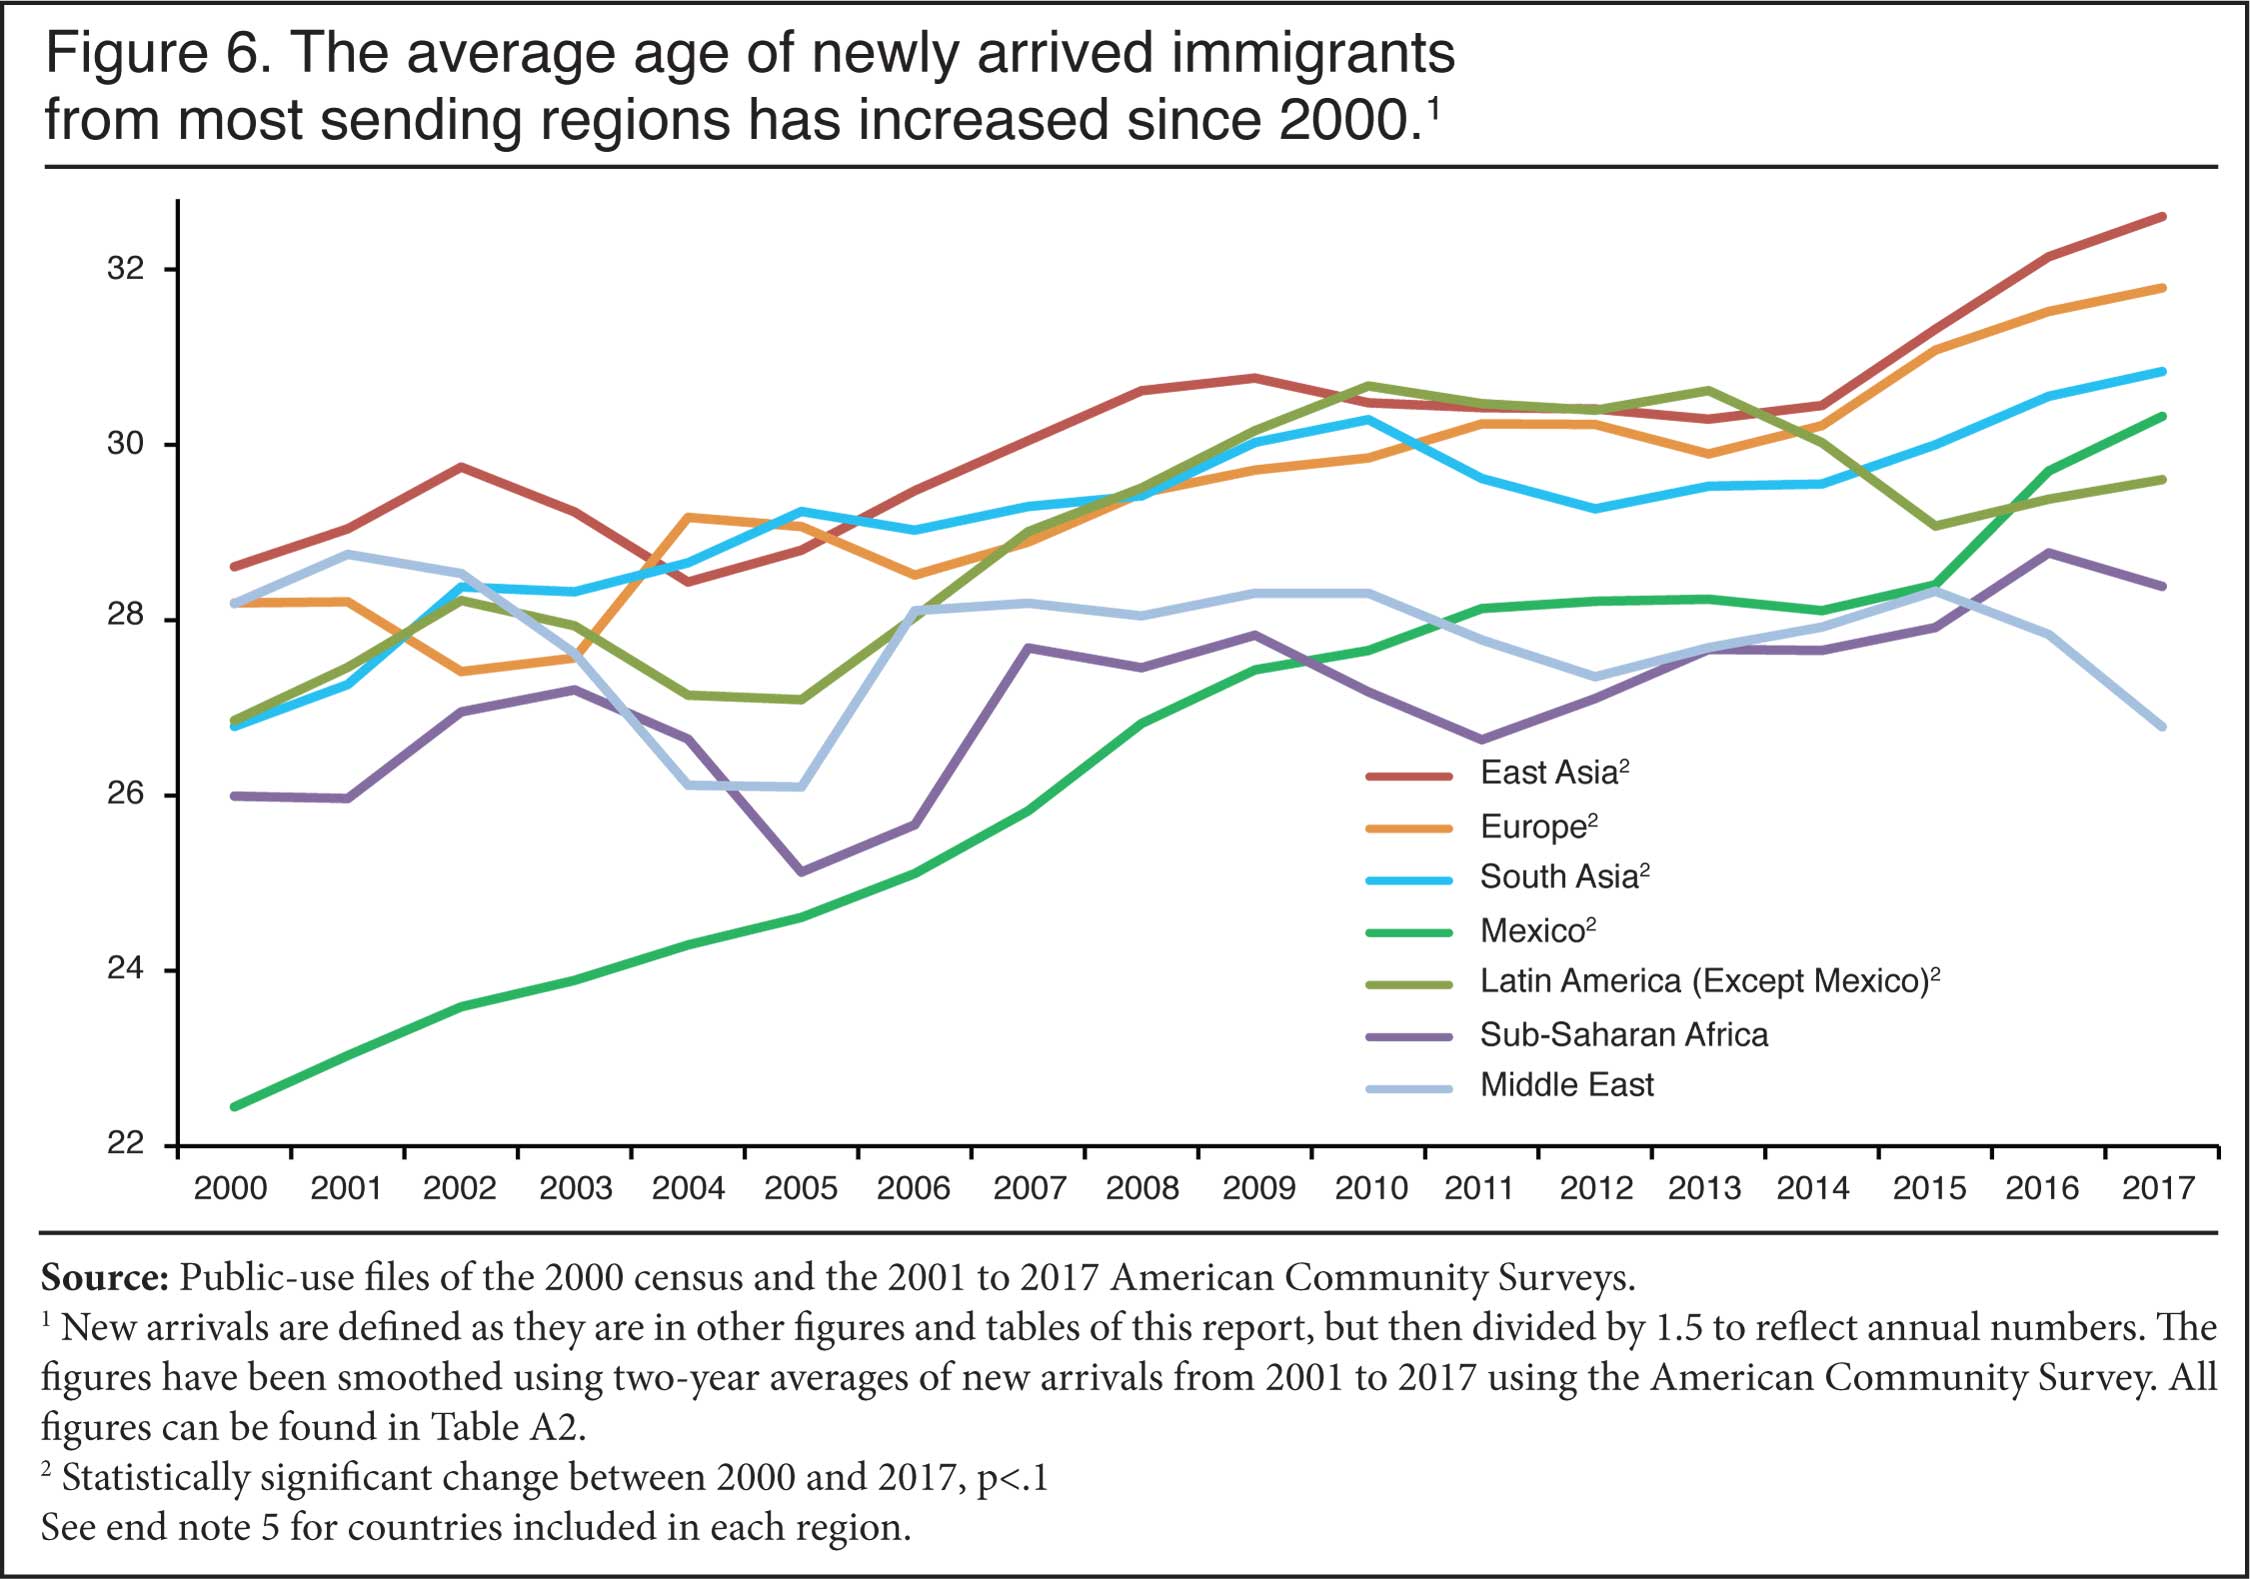
- The rise in the age at arrival for immigrants is a broad phenomenon affecting immigrants from most of the primary sending regions and top sending countries.
- Several factors likely explain the rising age of new arrivals, including significant population aging in all of the top immigrant-sending regions of the world, an increase in the number of green cards going to the parents of U.S. citizens, and a decline in new illegal immigration prior to 2017.
Aging of Overall Immigrant Population
- Looking at all immigrants, the number of working-age (18-64) immigrants increased by 42 percent between 2000 and 2017, but the number over the age of 64 increased by 108 percent.
- The average age of all immigrants increased from 39 years to 45 years between 2000 and 2017. This is more than twice as fast as the average age increase for the nation's overall population.
- Because the population of immigrants 65 and older has grown so fast, the share of all immigrants who are of retirement age now matches that of the native-born — 16 percent.
- The increase in the age at which immigrants are arriving contributed to rapid aging in the overall immigrant population, though the primary reason immigrants are aging is simply the natural aging of immigrants already in the country.
Introduction
Traditionally, one of the benefits of immigration is that new arrivals generally come at young ages, helping to offset population aging in advanced industrial democracies like the United States, which have high life expectancies and low fertility. The question of how much immigration slows population aging in receiving countries has been well studied by demographers for some time, and the research shows that immigration to low-fertility countries like the United States does slow aging, but only modestly.1 This analysis finds that even that modest impact is likely becoming smaller as the age of new immigrants has risen significantly in the last two decades.
To measure the age of new arrivals, we use the public-use files of the American Community Survey (ACS) collected by the Census Bureau, which asks all respondents the year they came to the United States to live. New arrivals are defined as those who came to the United States in the calendar year prior to the year of the survey or in the year of the survey. Since the ACS represents the population on July 1 of each year, new immigrants are those who have lived in the country no more than 1.5 years. Alternative definitions of new arrivals also show significant population aging. We use the terms "new immigrants", "newly arrived immigrants", and "new arrivals" synonymously in this report to describe these newcomers. The ACS includes both legal and illegal immigrants, referred to as "foreign-born" by the Census Bureau.2 Our analysis shows that there has been a marked increase in the age at which immigrants arrive in the United States. We also find that the overall immigrant population, not just new arrivals, is aging rapidly.
Age at Arrival
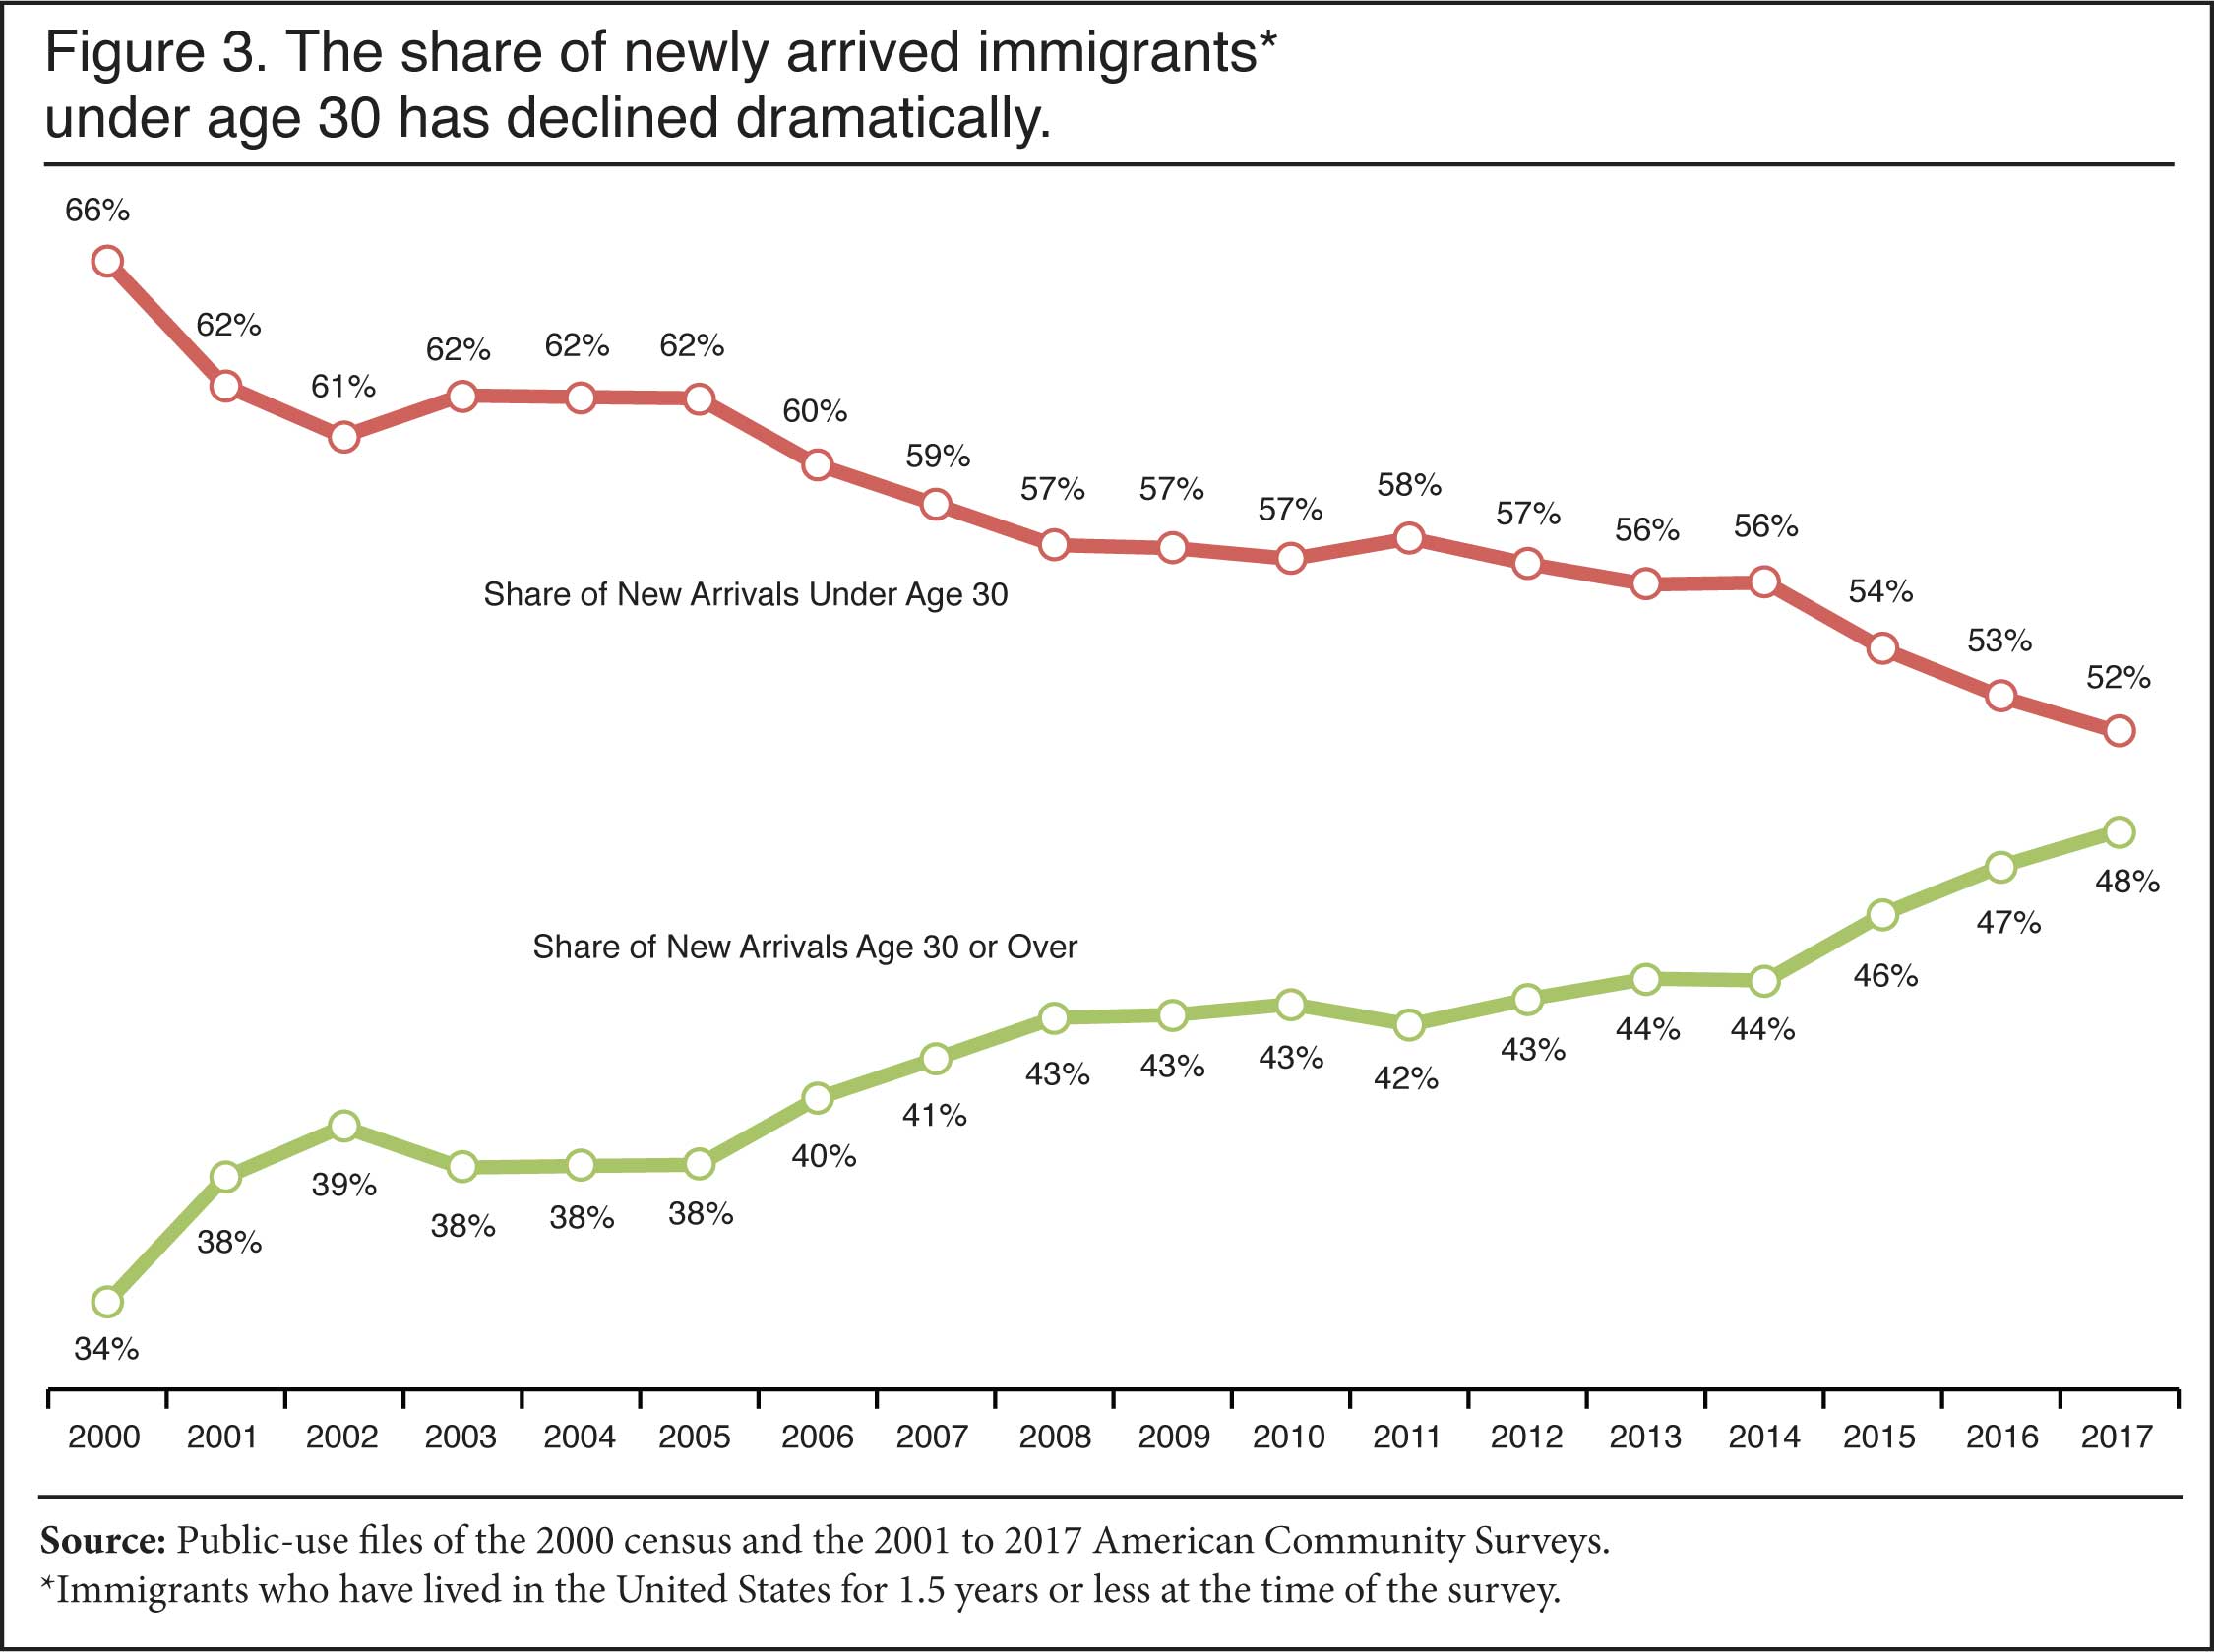
Arriving Immigrants Are Much Older. Figure 1 shows the dramatic increase in the age of newly arrived immigrants. The average age at arrival was more than five years older in 2017 than it was in 2000 — 25.7 vs. 30.9 years. The figure shows that older age groups have seen the largest increases. The share of newly arrived immigrants who are over the age of 50 roughly doubled, from 8 percent to 15 percent between 2000 and 2017; and the share 65 and older nearly tripled, from 2 percent to 6 percent. While we focus on those immigrants who have lived in the country for 1.5 years or less at the time of the survey, other definitions of "new arrivals" also show the same increase in age.3 Figure 2 shows that the share of new immigrants arriving in the older age cohorts has increased the most since 2000. As older age groups make up a larger share of new arrivals, the shares in the younger age groups have declined significantly. Figure 3 shows the very large decline in the share of new immigrants who are coming to the United States under the age of 30. The share under age 30 has fallen from roughly two-thirds to about half.
 |
 |
 |
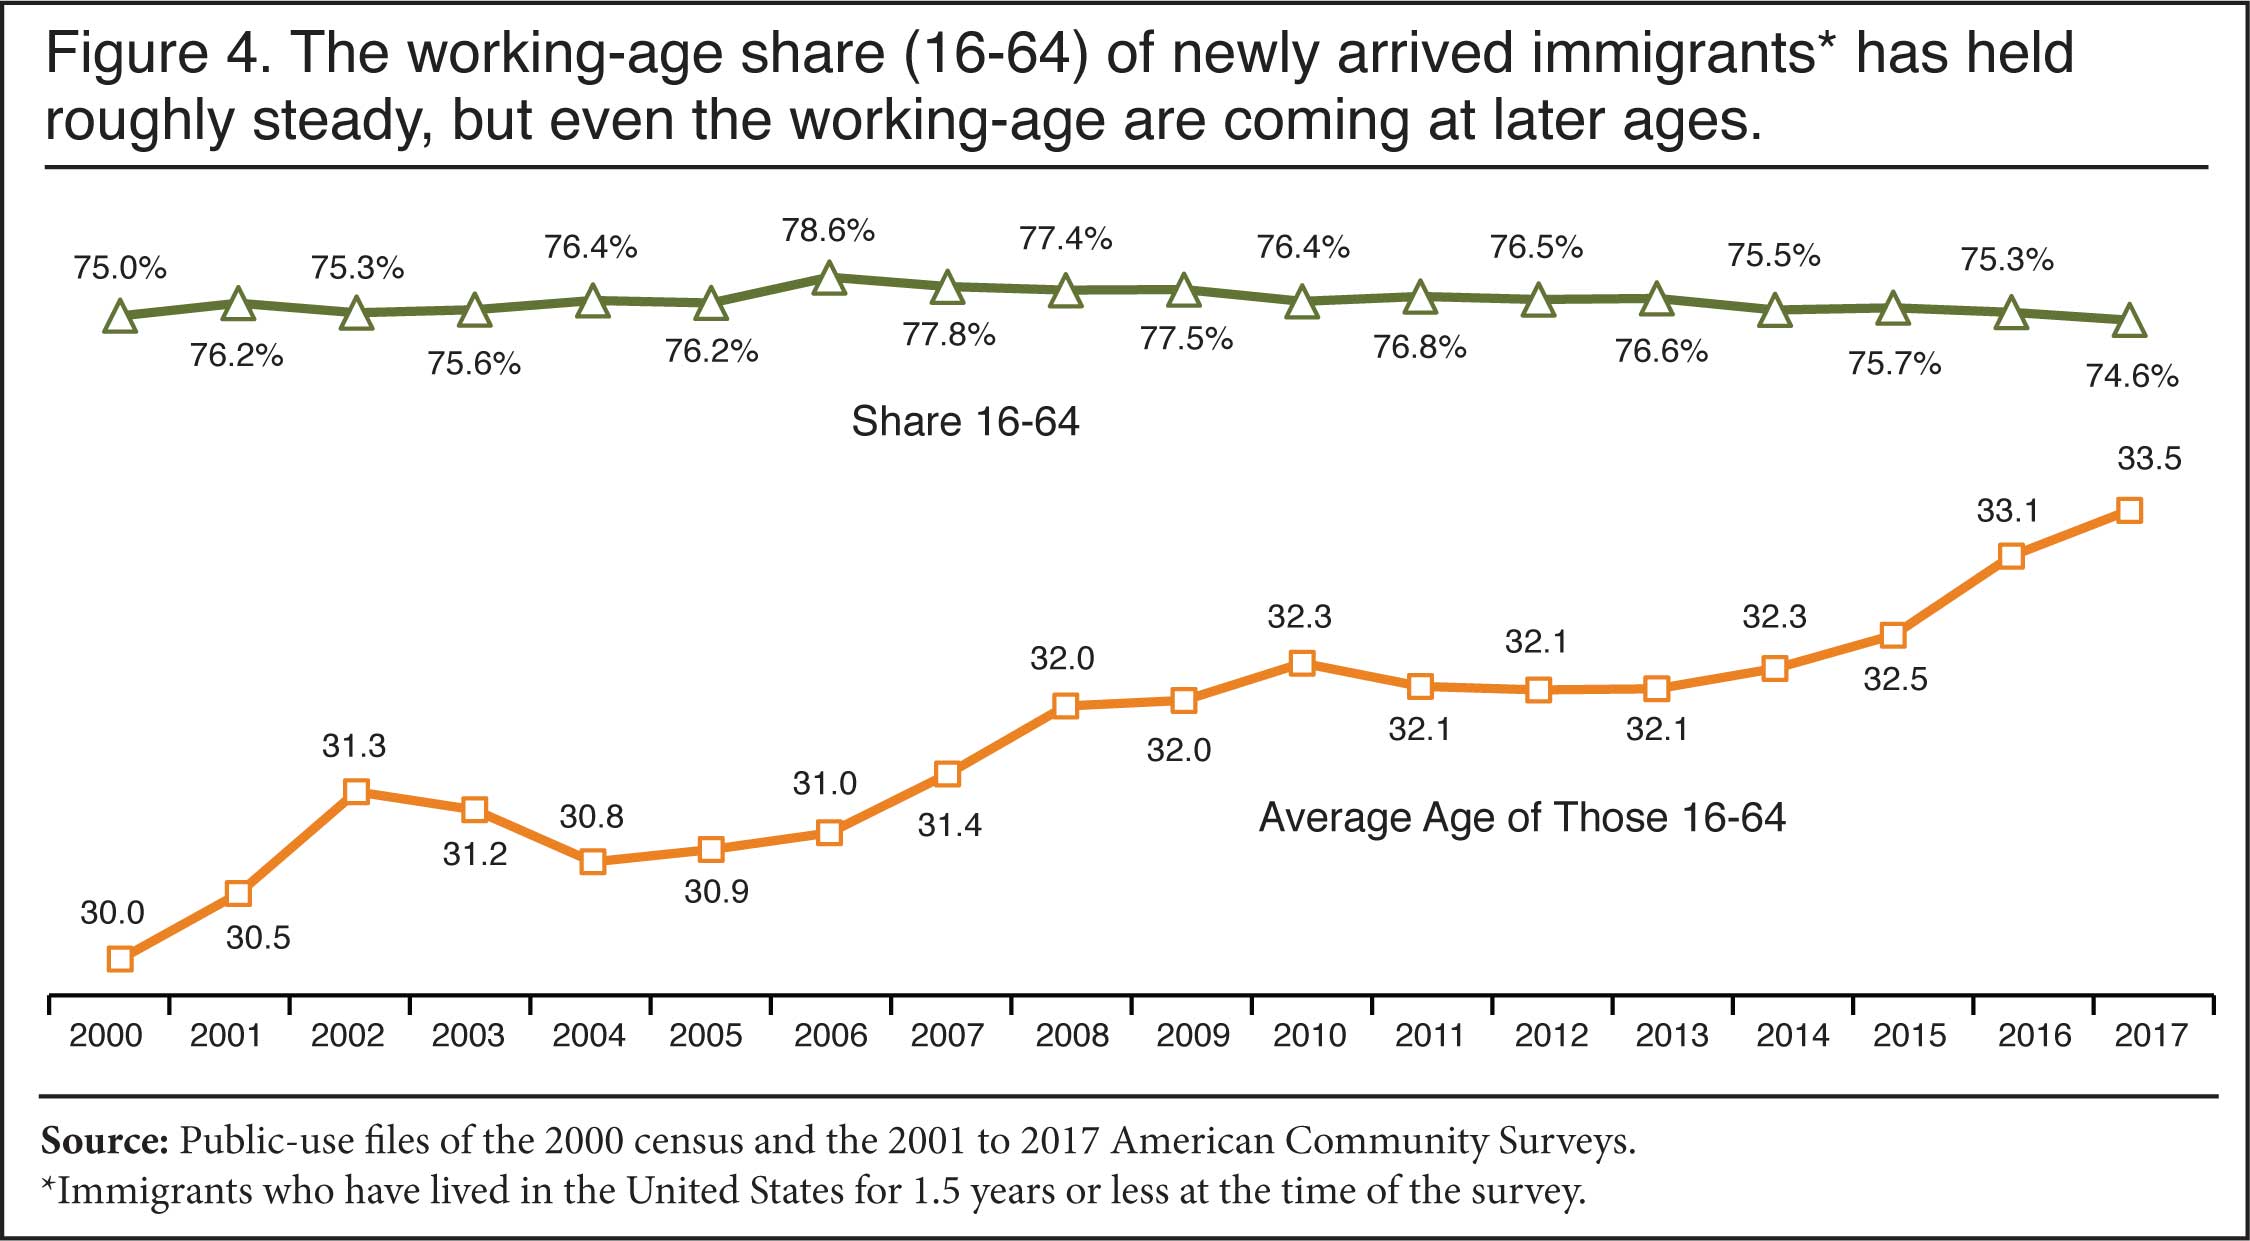
The Working-Age Share. Figure 4 examines the share of new immigrants who are of working-age (defined as 16 to 64). The share has held roughly steady, with some decline in the most recent years. However, even among the working-age there has been a 3.5-year increase in the average age. This is a larger decline than it may seem because the average age only reflects the age distribution of those ages 16 to 64. Averages are often heavily impacted by those on the tails of the distribution — the young and old. In Figure 4, new arrivals under age 16 and over 64 are excluded, yet there is still a significant increase in the average age. As we have seen, more working-age immigrants are coming in their 30s, 40s, 50s, and 60s than was true in the past and this explains the results in Figure 4.
 |
Number of Older Immigrants. The level of immigration has fluctuated in the last two decades. As the Center for Immigration Studies has reported in prior studies, the number of immigrants fell immediately after the Great Recession and has since increased significantly. The increase in the level of new immigration coupled with an increase in the share that is older means that the number of immigrants arriving at older ages has increased significantly. Figure 5 shows this numerical increase. On an annualized basis, 276,000 immigrants 50 and older now settle in the country each year, as do 213,000 age 55 and older and 113,000 age 65 and older.4 The fact that more than a quarter-million older immigrants are now settling in the country each year and over 100,000 are at the age traditionally associated with retirement is certainly a striking finding.
 |
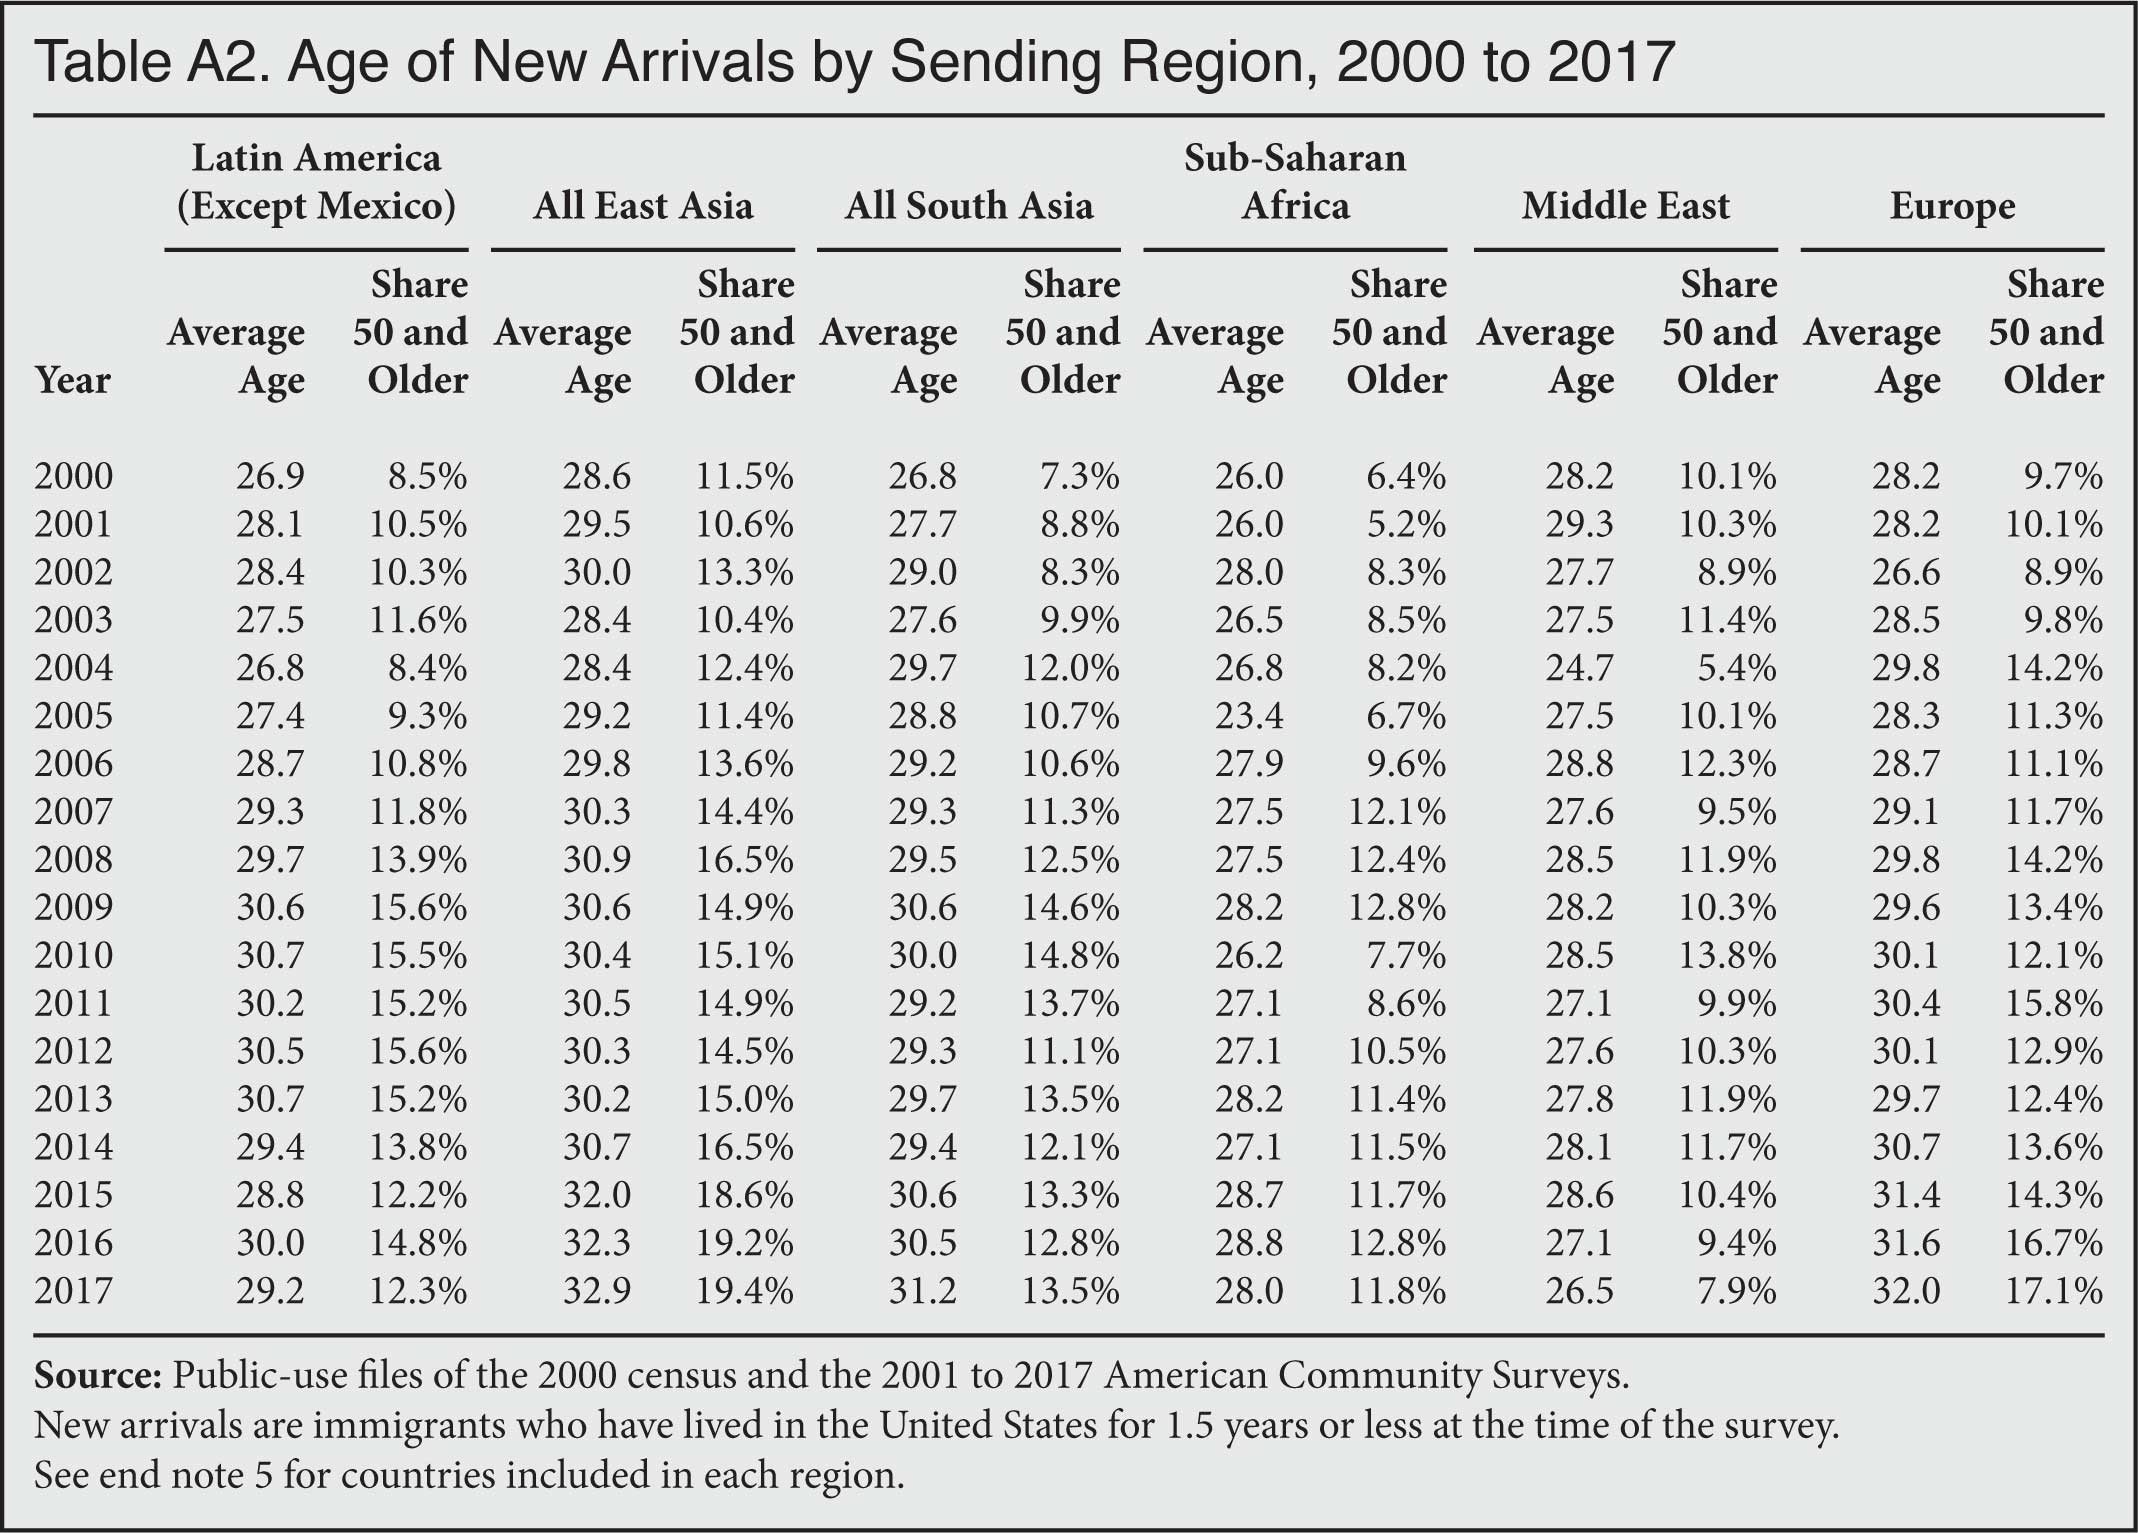
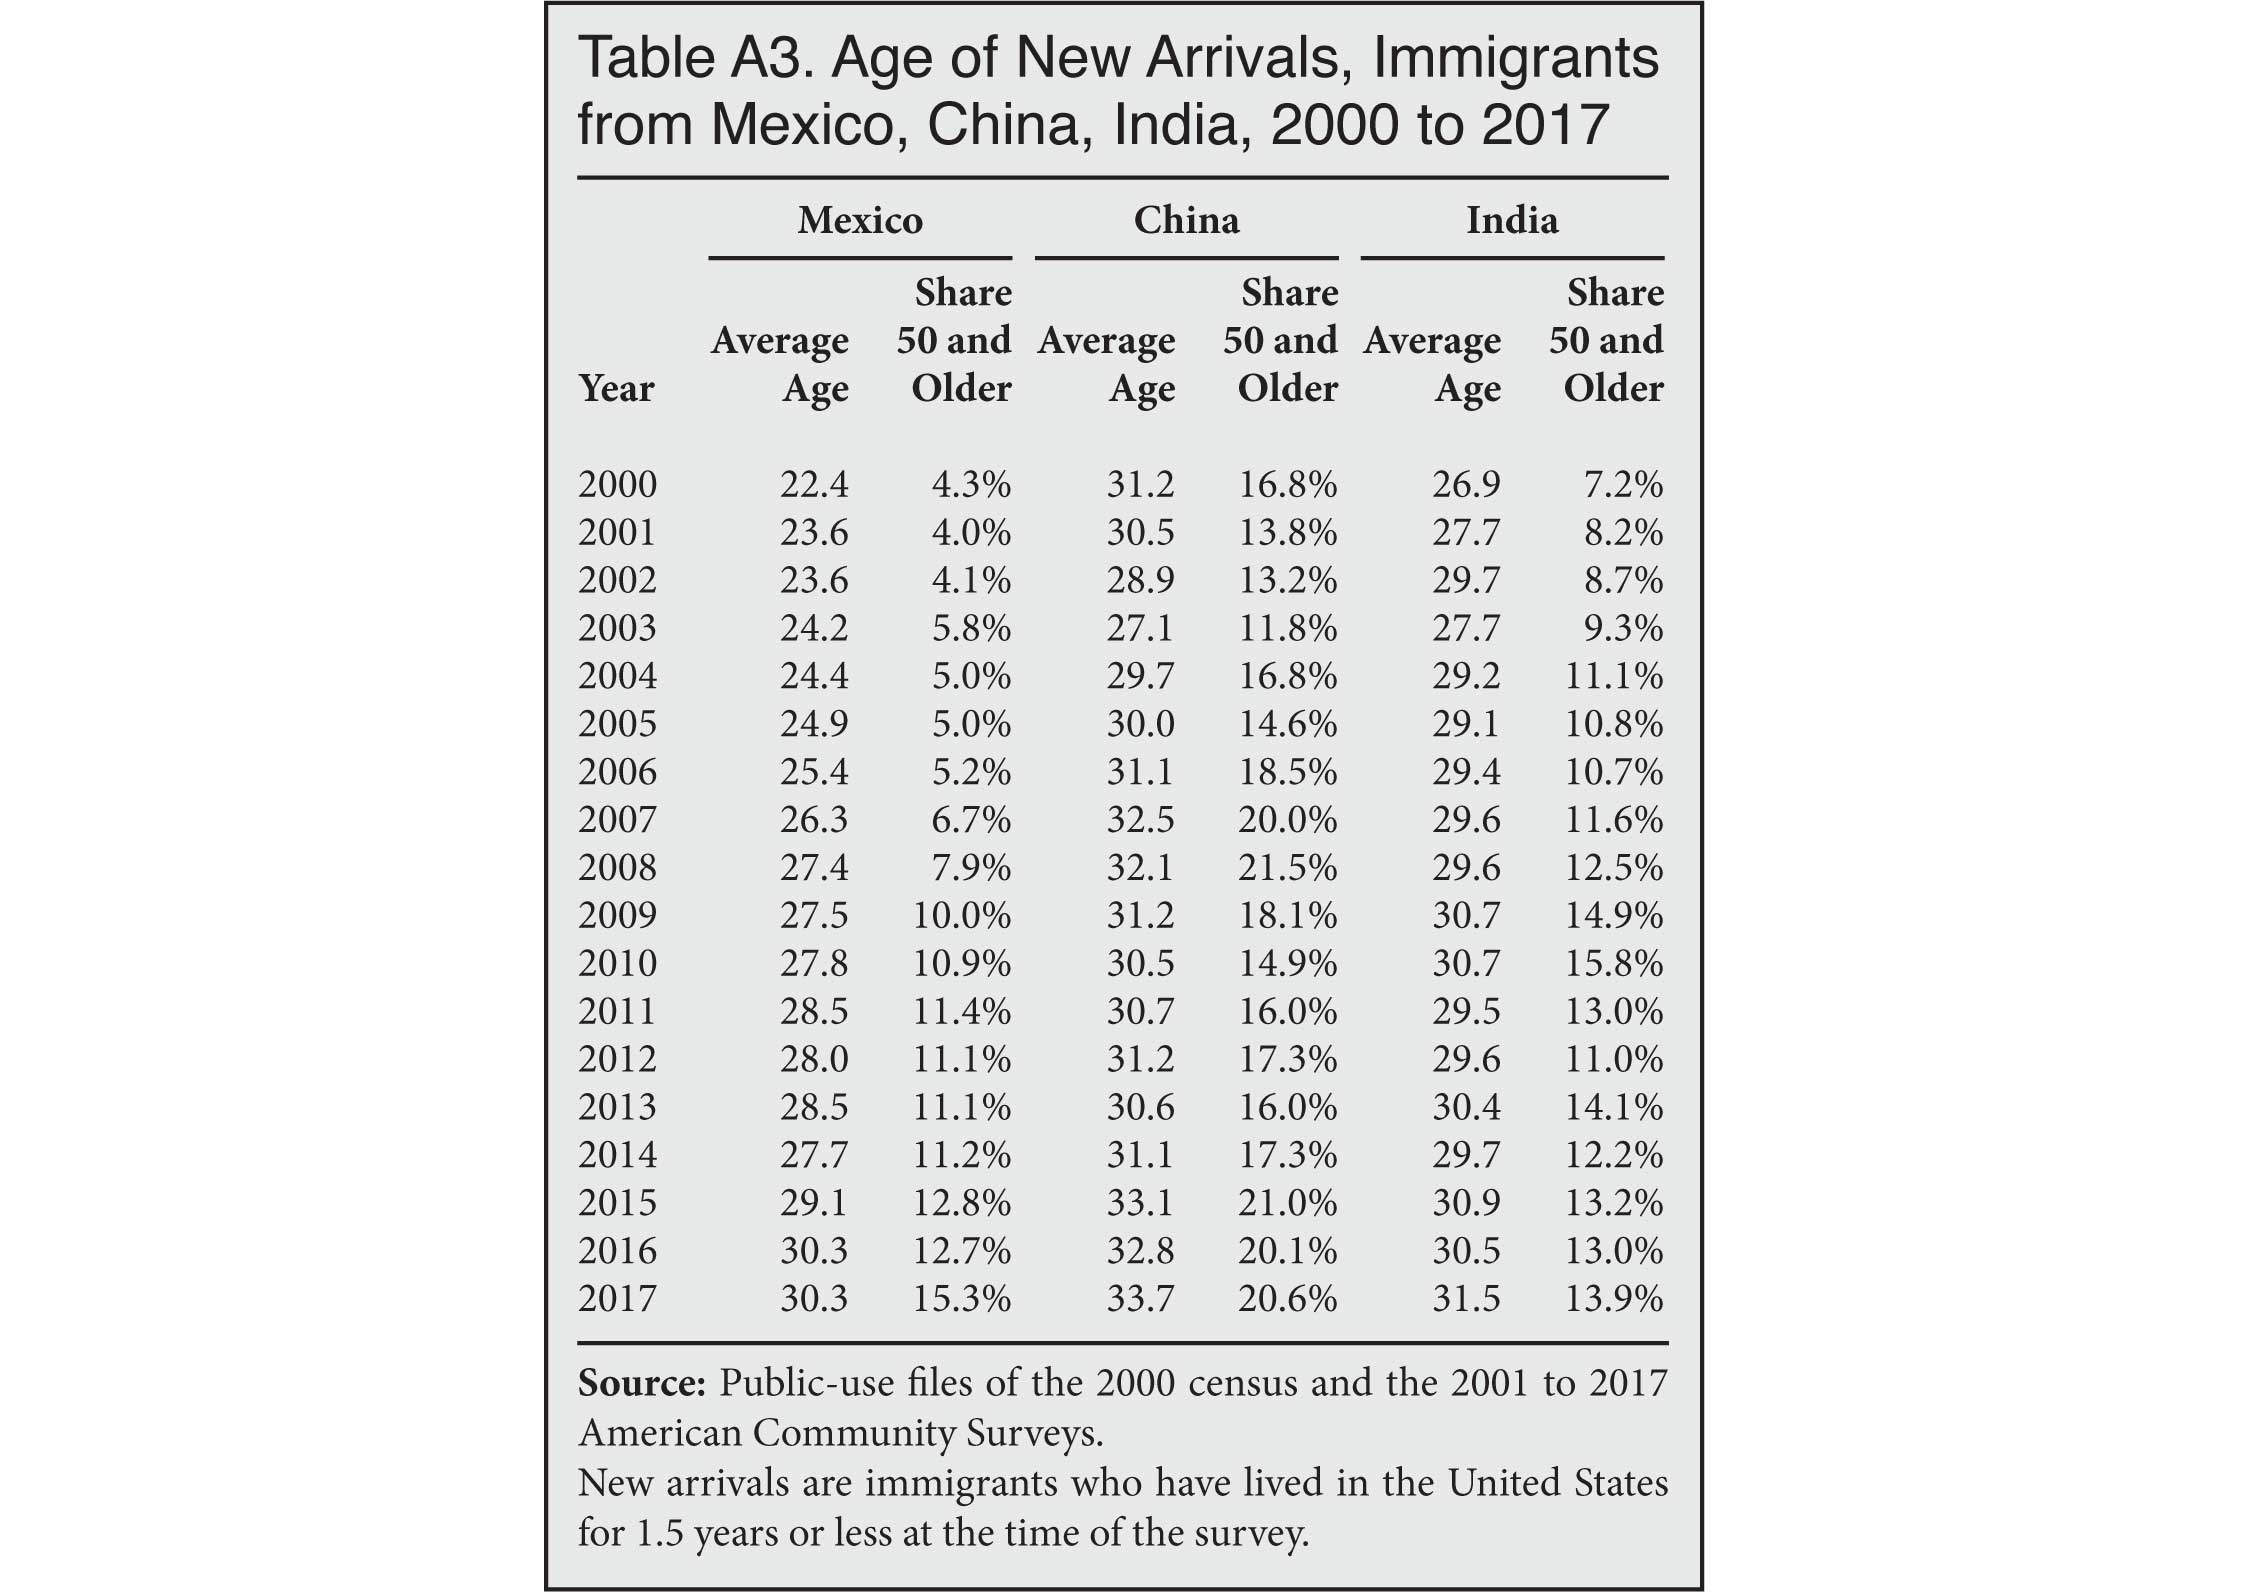
Rise in Age Is a Broad Phenomenon. Figure 6 reports the average age for immigrants by sending region.5 The figure shows that the increase in the average age of new immigrants from 2000 to 2017 was statistically significant for East Asia, Europe, South Asia, Mexico, and the rest of Latin America. Those regions alone account for 82 percent of new arrivals. Appendix Table A2 reports figures for the average age and share over 50 for each region for new arrivals. Table A3 shows the same information for the top-three sending countries of Mexico, China, and India. (Sample size issues make it more difficult to examine new arrivals from other individual countries that send fewer immigrants than these three countries.) Figure 6 and Tables A2 and A3 indicate that the rise in the age of immigrants is broad, impacting new immigrants from the top sending regions. This means the factors causing the increase in the age at arrival are widespread and not simply confined to immigrants from one part of the world.
 |
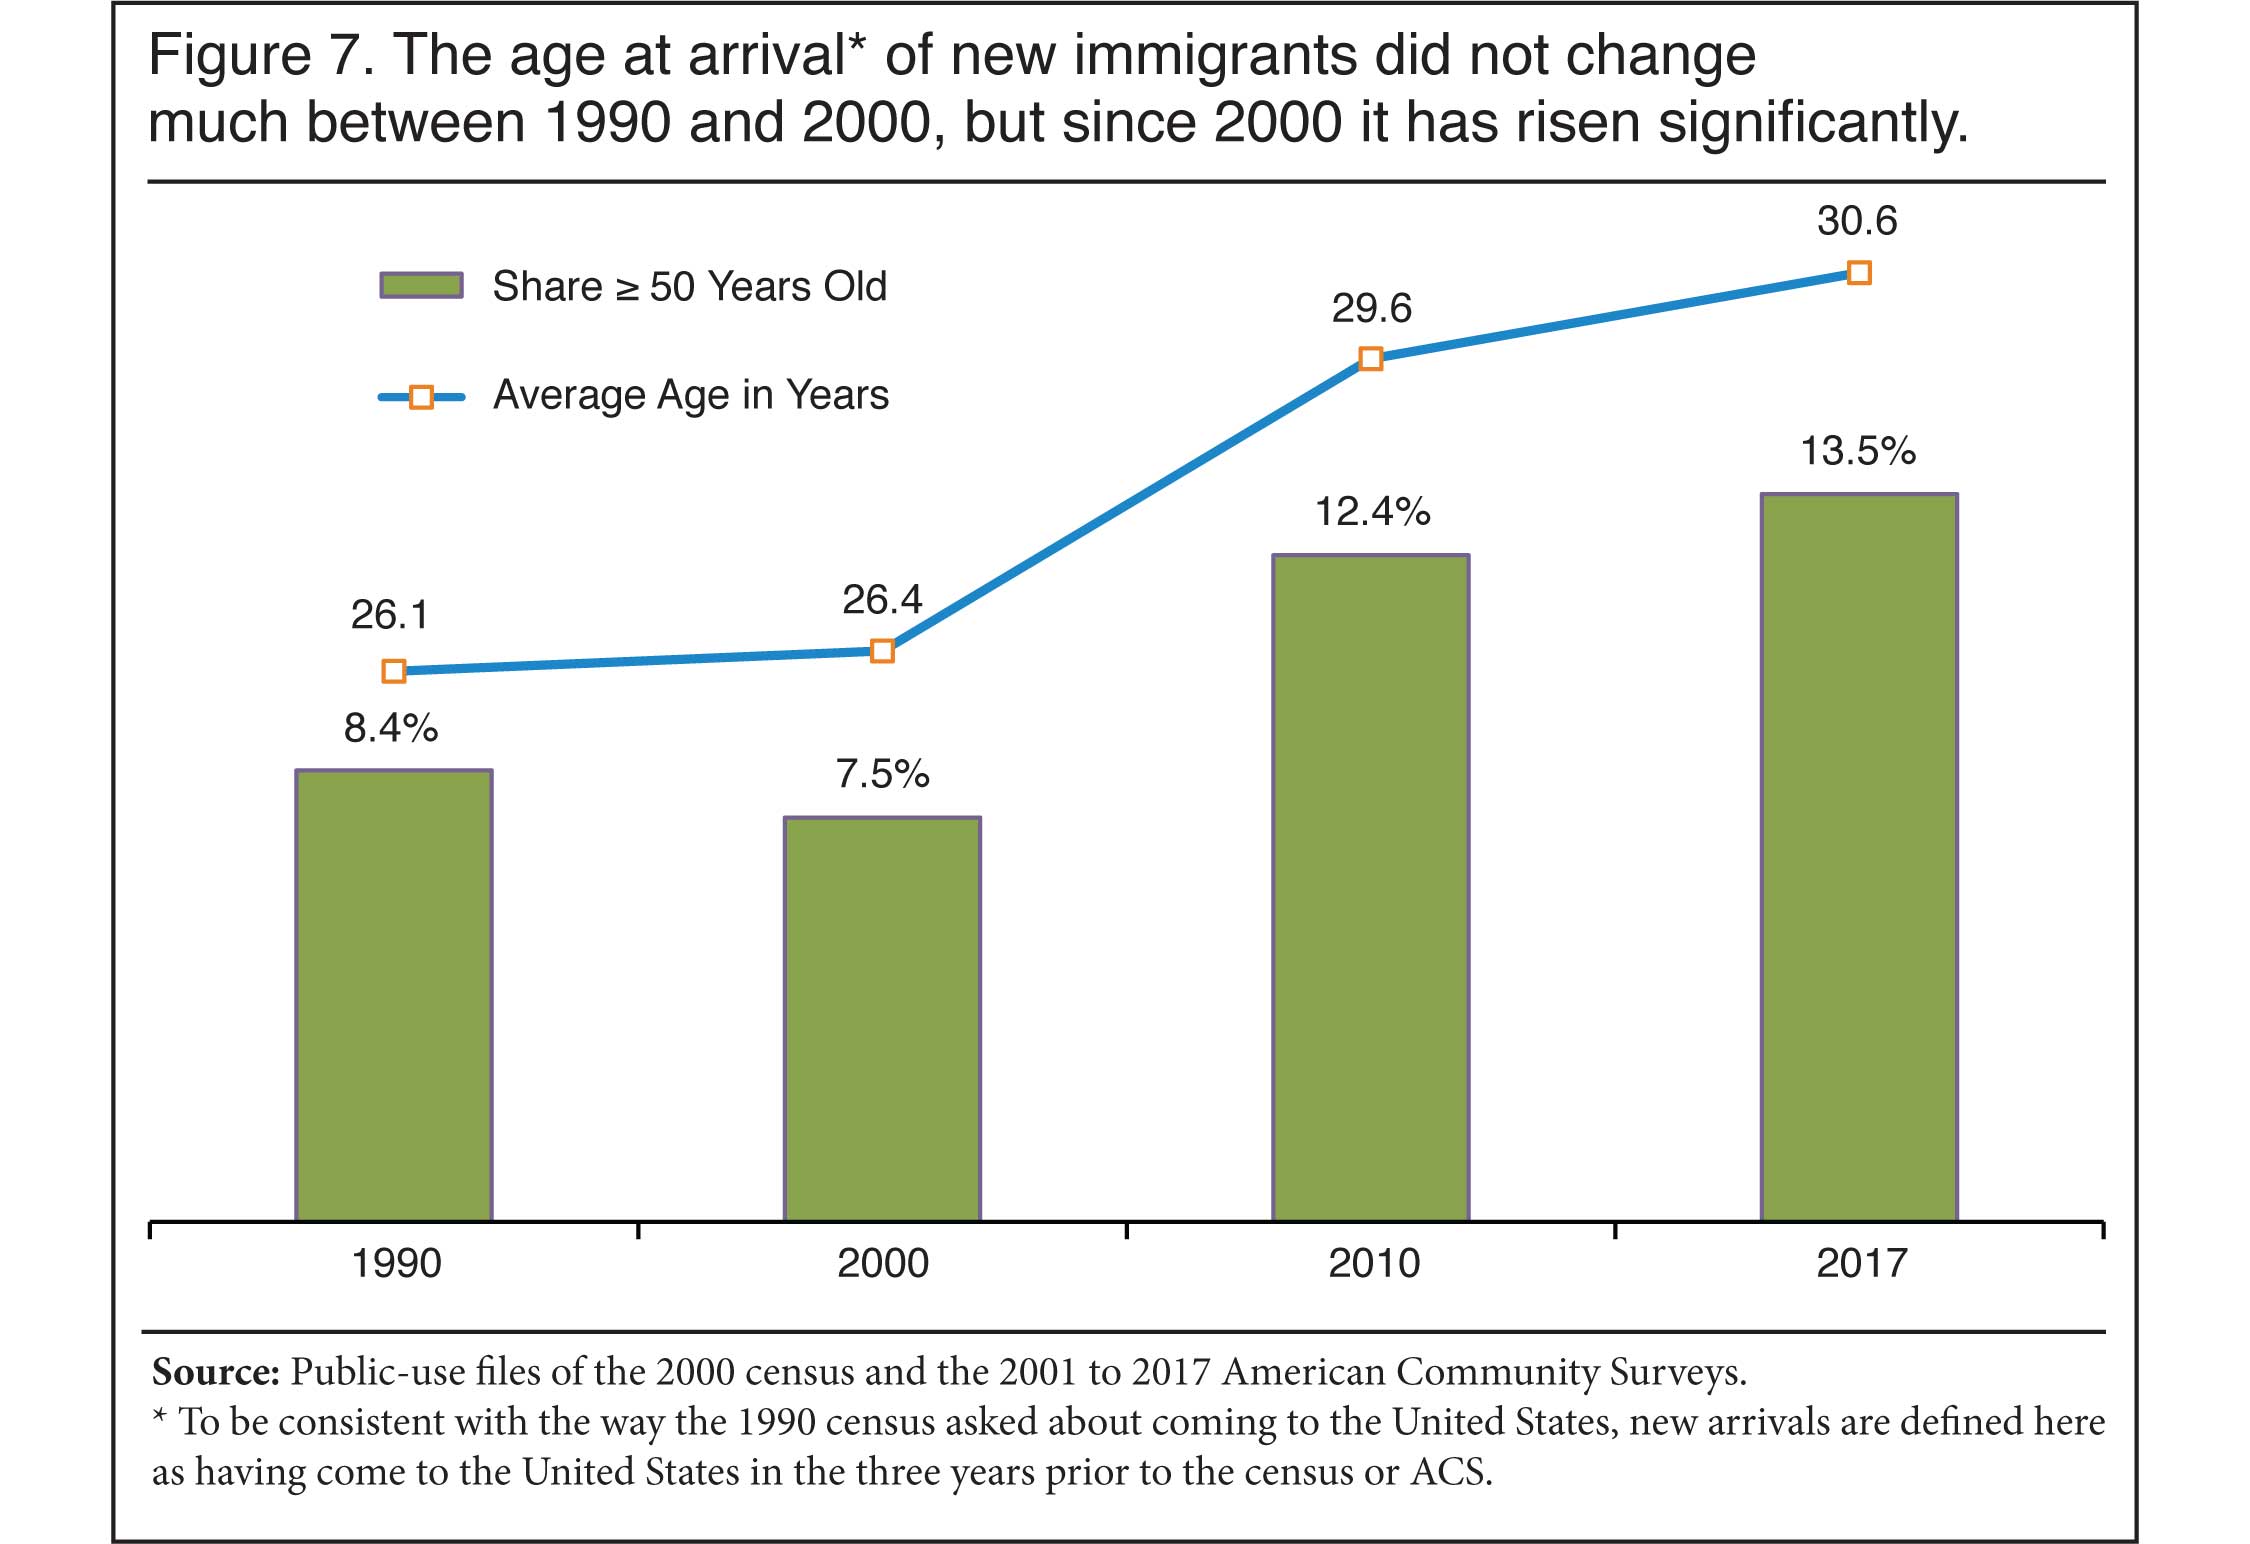
Longer-Term Comparisons. The public-use ACS and the 2000 census files provide single year of arrival data going back to 2000. Prior to 2000, single-year-of-arrival information does not exist in Census Bureau data. The 1990, 1980, and 1970 censuses, for example, all grouped year-of-arrival responses into multi-year cohorts, so data on recent immigrants is not available in the same way before 2000 as it is after 2000. However, it is possible to re-code the data after 2000 to match the 1990 census, which grouped arrival for the census year and the three years prior (1987 to 1990). The 1980 census used a different coding scheme. Figure 7 reports data from 1990 and from later years using a consistent definition of new arrivals. It shows that the age of recent arrivals, defined as those who arrived in the three years prior to the survey or census year, is similar in 1990 and 2000, whereas after 2000 there was a large increase. Whatever factors caused the age at arrival of new immigrants to increase, it seems to be a post-2000 phenomenon.
 |
Causes of Increased Age at Arrival
Aging in Sending Countries. Several factors likely caused the decline in the youthfulness of new immigrants. One is the general aging in all of the primary sending regions and countries. Almost every country in the world has experienced a significant decline in fertility and a rise in life expectancy, referred to by demographers as the demographic transition. This trend maybe more pronounced in Europe, the United States, and parts of East Asia, but as the UN has reported, the demographic transition has caused virtually all countries in the world to experience significant population aging. Further, this increase is expected to continue for the foreseeable future throughout the world. This is certainly true in all of the areas that send the most immigrants to the United States, including Asia and Latin America.6 Older populations in sending countries are very likely to impact the age at which people come to the United States. It is worth adding that the aging of the world's population makes it unlikely that the youthfulness of immigrants to the United States will return to the level in 2000, even if there are some fluctuations in the age at arrival in the future.
More Parents Getting Green Cards. Family relationships are the primary way persons obtain legal permanent residence. This is the so-called "green card". Under current law, American citizens may sponsor their parents overseas for green cards without numerical limit. While legal immigrants typically wait five years before applying for citizenship, between 2000 and 2017, 12.5 million people naturalized.7 This reflects the cumulative effect of several decades of high legal immigration. The number of naturalized citizens increased from 12.5 million in 2000 to 22 million in 2017. Some 95 percent of these individuals were 21 and older in 2017 and so potentially could sponsor a parent overseas.8 This means there is an ever-larger pool of people in the United States who can sponsor a parent or parents overseas.
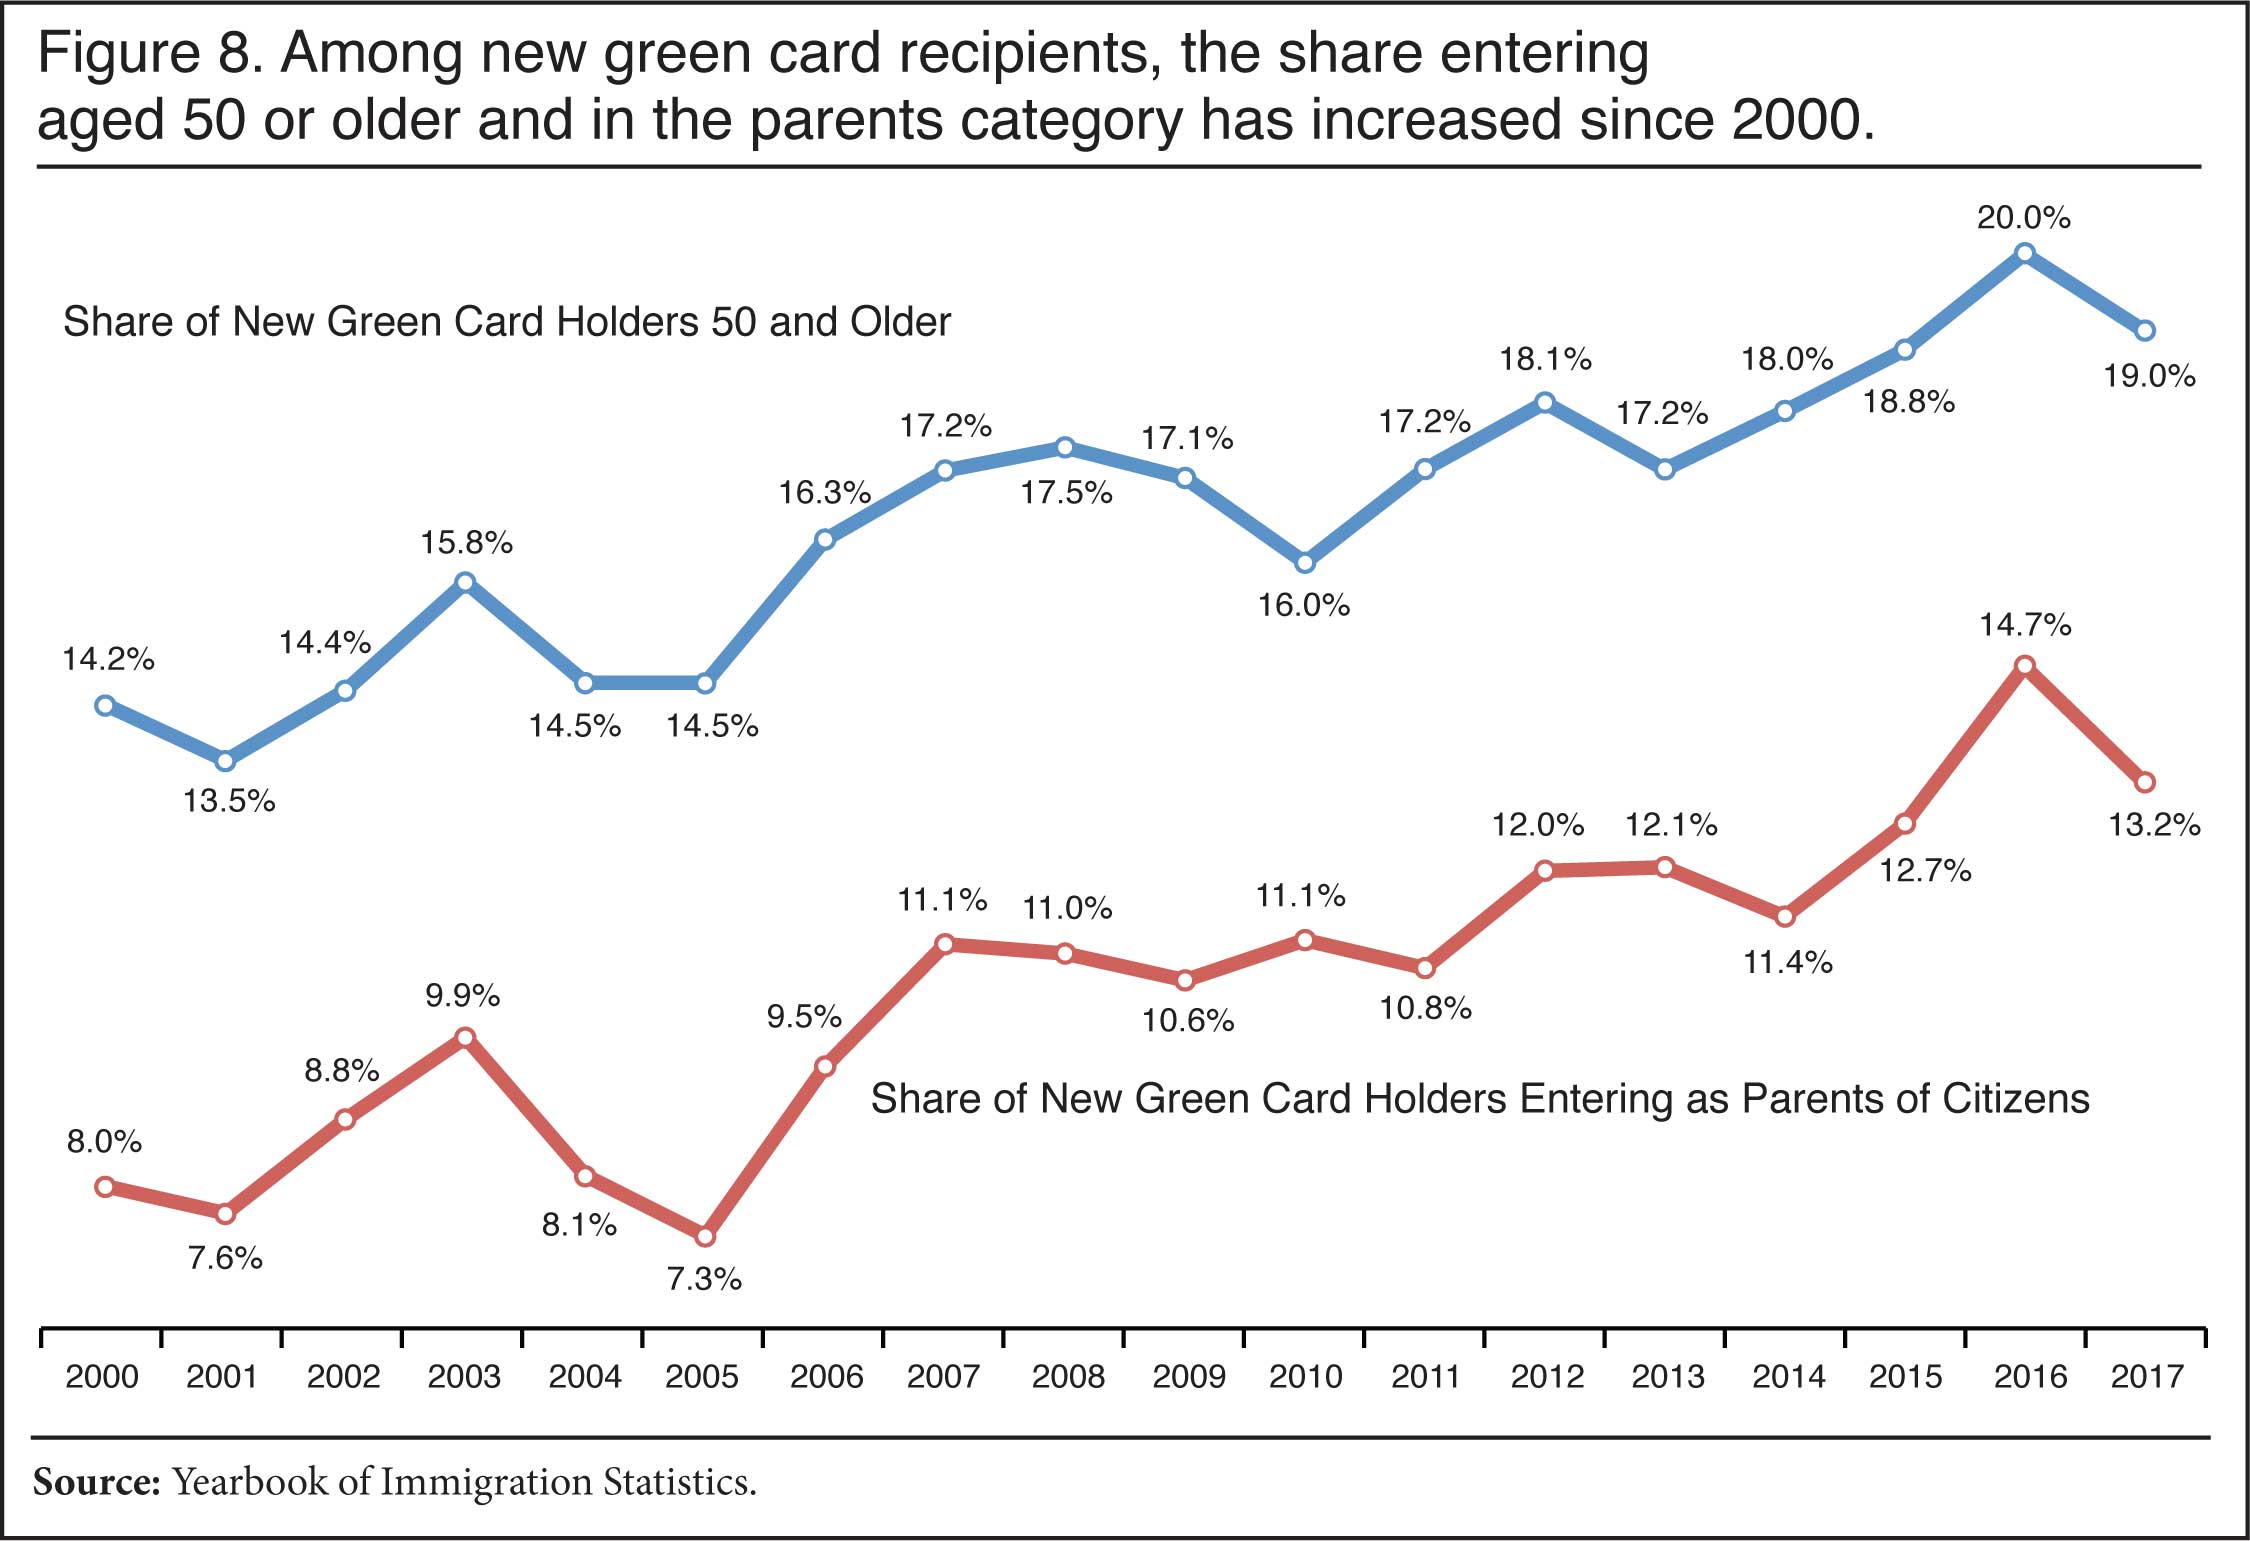
Adult children sponsoring a parent typically came to the United States as adults. If they came as children, more often than not they came with their father or mother and so their parents typically do not need green cards. Because those in the parent category are sponsored by an adult child, the parents are almost always in their late 40s or older when they get their green cards.9 Figure 8 shows that the share of new green cards going to parents has roughly doubled since 2000. While the administrative data is limited, Figure 8 also shows that the share of new green card recipients 50 and older has risen right along with the increase in the share of green cards going to the parent category. The fact that more green cards are going to parents and a larger share of new permanent residents are older almost certainly accounts for some of the increase in the age at arrival of new immigrants.
 |
Fall-Off in Illegal Immigration Through 2017. The data for this analysis runs through the middle of 2017 and does not entirely reflect the recent well-publicized upturn in illegal immigration at the southern border of the United States. Prior to the start of 2017, there was general agreement that the level of new illegal immigration had fallen, particularly from Mexico.10 Illegal immigrants tend to arrive at younger ages, so a decline in new illegal immigrants should have increased the average age of all new arrivals in Census Bureau data, which does include them. The dramatic increase in the age of newly arrived Mexican immigrants shown in Figure 6 and Table A3 is a good indication that the decline of illegal immigration explains in part the rise in the age of new immigrants. Mexico was and is the top sending country of illegal immigrants. The falloff in illegal immigrants would be expected to impact Mexican immigration the most because such a large share of Mexican arrivals in the past came illegally. Now a smaller number of Mexicans are entering illegally, making the flow from that country more legal and older.
However, Figure 6 and Table A2 also indicate that even new immigrants from regions such as South Asia, East Asia, and Europe, from which relatively fewer illegal immigrants have traditionally come, also exhibit a marked increase in age at arrival. Further, the increase in the absolute number — not just percentage of new arrivals — of new immigrants who are age 50 and older and 65 and older shown in Figure 5 cannot be explained by the decline in new illegal immigrants. The reduction in the share of all new arrivals that are illegal would impact averages and the overall shares in the higher age cohort, but not the absolute number of older immigrants coming. So while the decline in illegal immigration almost certainly accounts for some of the rising age of new immigrants, other factors are clearly contributing to the trend. As we have seen, these factors include the general population aging occurring throughout the world and the increase in the parents category.
Implications
Impact on the Aging of American Society. One of the most common arguments made about immigration is that it prevents post-industrial societies with low fertility and high life expectancy from aging. The younger the immigrants are at arrival, the larger their positive impact on aging in the receiving society. In reality, there is general agreement among demographers that while immigration makes the population much larger, its impact on slowing the aging of low fertility countries like the United States is modest.11 The significant increase in the age at which immigrants are coming to America shown in this report means that the modest positive impact on the nation's age structure will be correspondingly smaller moving forward.
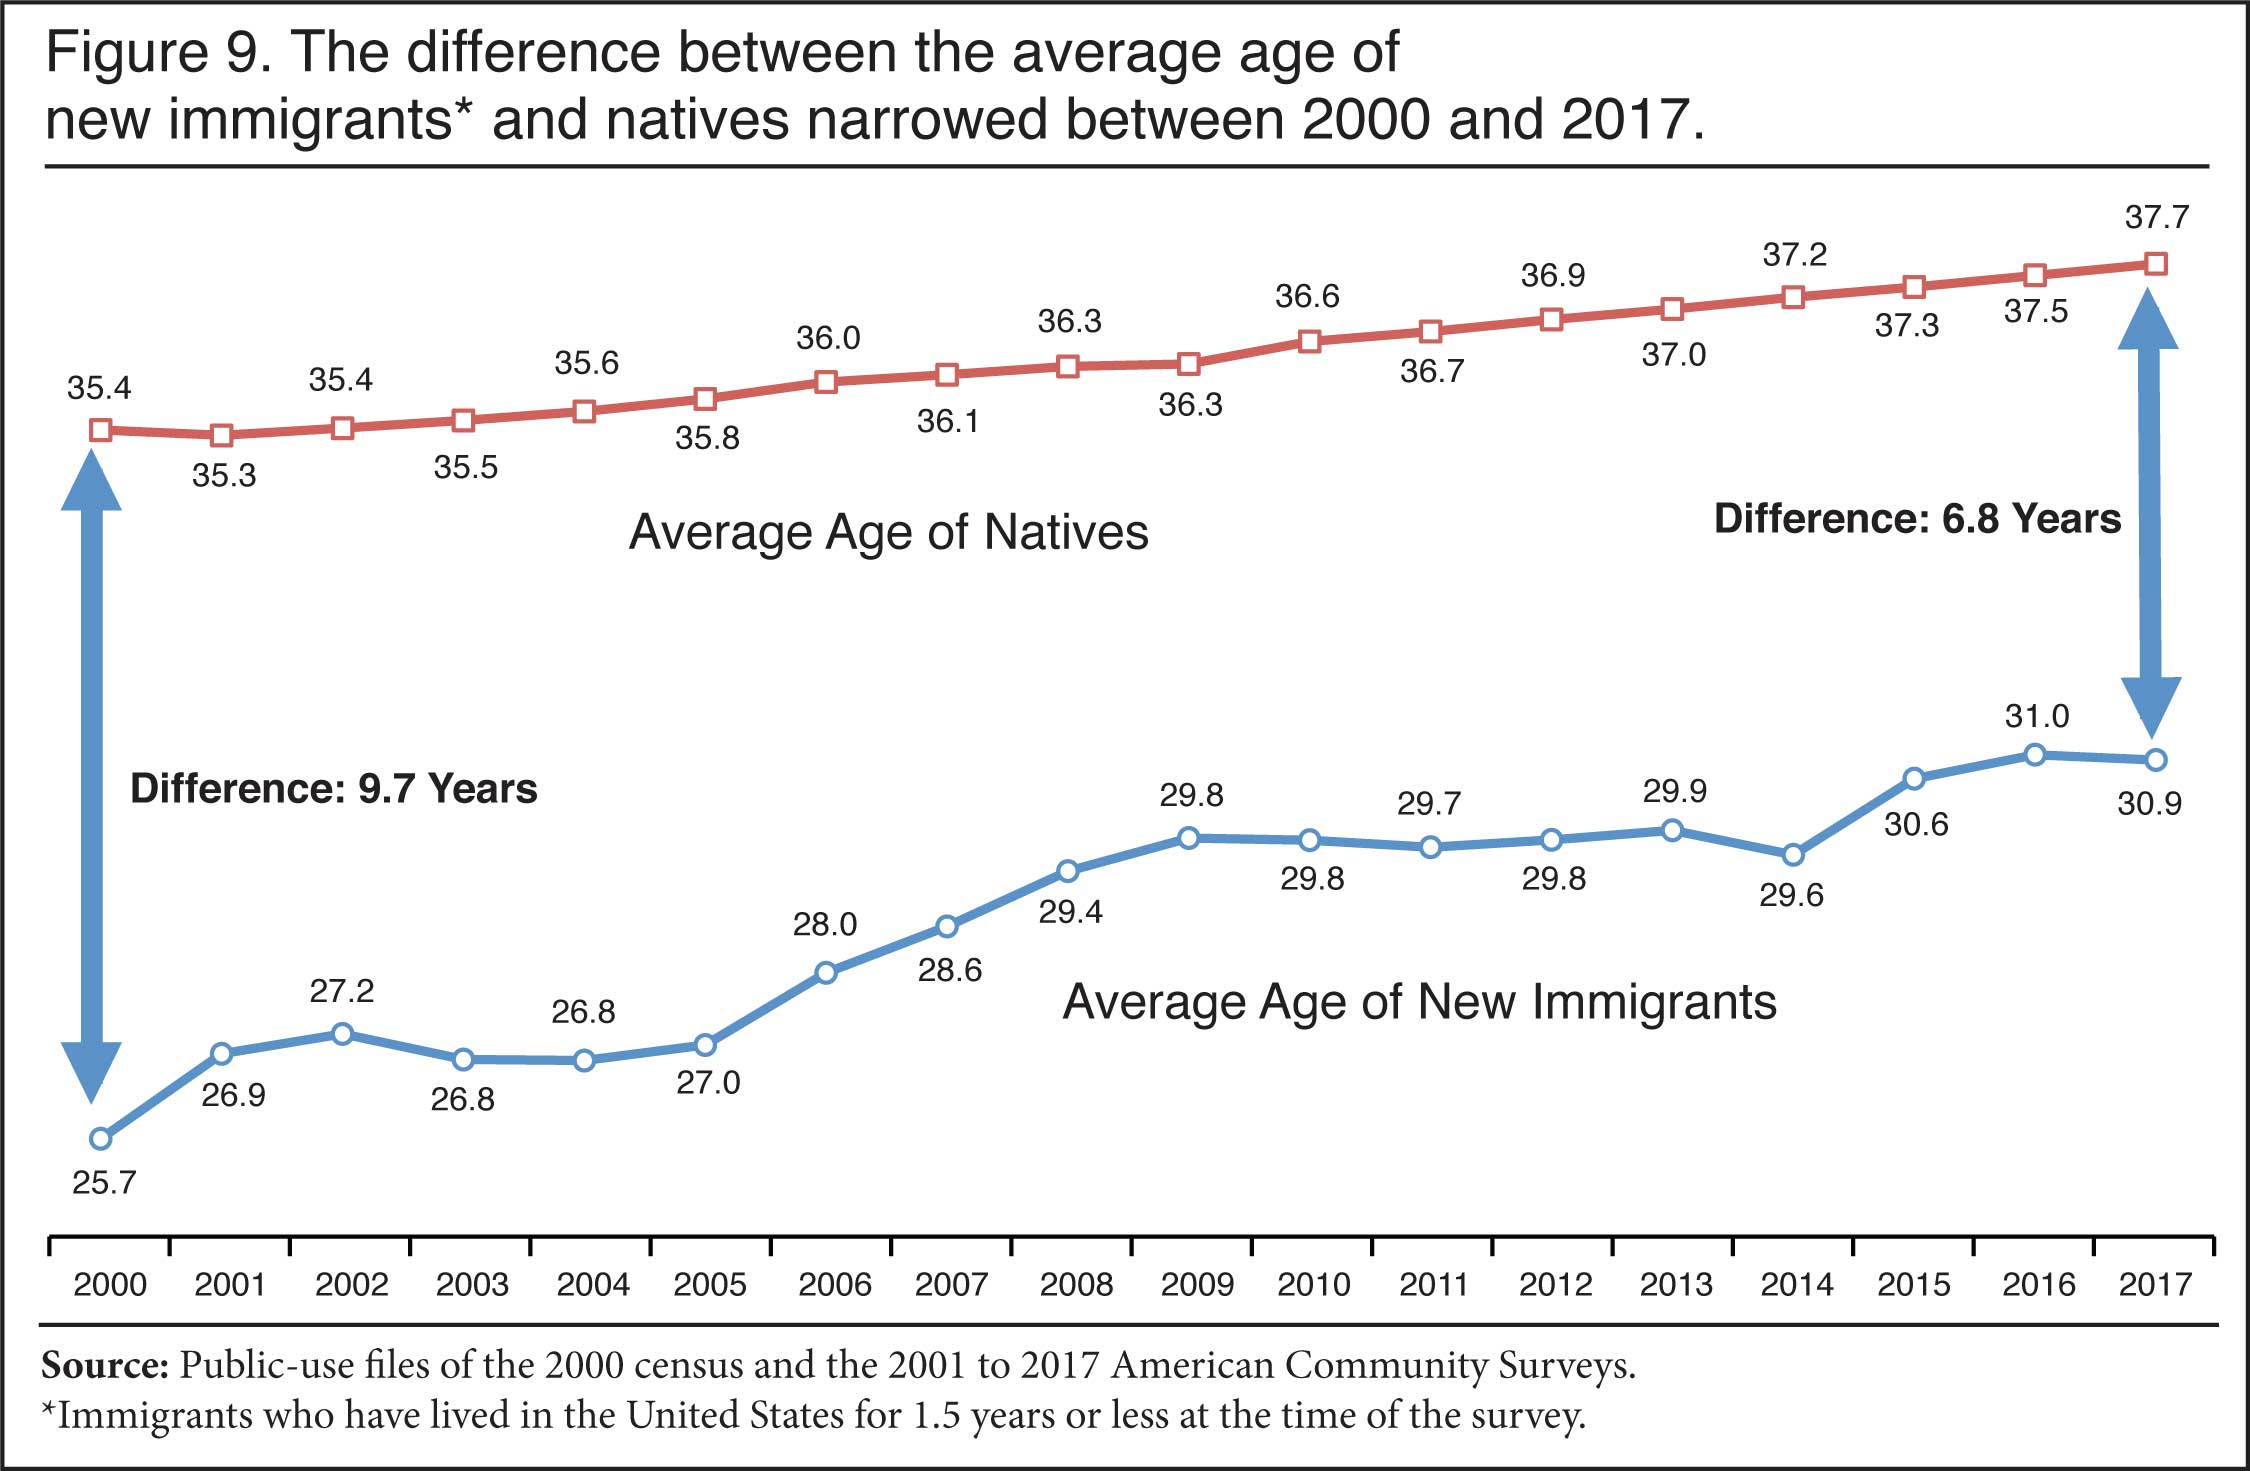
One way to think about this question is that the larger the difference in the average age of new immigrants relative to the average age of the existing native population, the more immigration will lower the average age of the country. Figure 9 shows the average age of immigrants at arrival relative to the average age of all natives. In 2000, new immigrants were 9.7 years younger than the average native-born person. By 2017, the average age of natives had risen, but not as fast as the average age of new arrivals so that the difference was 6.8 years — nearly three years less than in 2000.
 |
We can also gain insight into the effect of immigration on age by comparing the effect of immigrants in 2000 to those in 2017. While the effect of one year of immigration on the average age in the United States is so small it is difficult to measure, we can examine the effect of immigration over the course of several years. In 2000, the average age in the United States was 35.8 years; if we exclude those immigrants who came in the prior five years, the average age would have been 36.04 years — a reduction in average age of 0.24 years. In 2017, immigrants who had arrived in the five years prior lowered the average age in the United States by only 0.18 years.12 The rise in the age at arrival of new immigrants means that the modest impact of immigration on the nation's age structure is now smaller than it was two decades ago, at least in the short term.
Fiscal Implications of Older Immigrants. A number of studies have examined the taxes paid and costs created by immigrants in order to discern their net fiscal impact. The National Academies of Sciences, Engineering, and Medicine (NAS) has done some of the most extensive research in this area. One of the conclusions of NAS studies in both 1997 and 2017 was that immigrant age at arrival is one of the key factors determining their net lifetime fiscal impact. Education level is another key factor. As the 1997 NAS study observed, "the fiscal impact of an immigrant depends heavily indeed on the immigrant's age and education at arrival."13
The 2017 NAS study also shows that younger arrivals often have a more positive impact than older arrivals. The study did not report the lifetime net fiscal impact of immigrants by detailed age groups. But it did provide estimates for those who arrived ages 0-24, 25 to 64, and 65 and older. The NAS ran eight different fiscal scenarios based on different assumptions about future taxes and expenditures. The analysis shows that the original immigrant is a net fiscal positive in all eight scenarios if he came between the ages of 0 and 24, paying more in taxes than he costs during his lifetime, regardless of education level. Those who arrived ages 25 to 64 were a fiscal benefit in five of the eight scenarios; and, those who came over age 64 were an unambiguous net drain in every scenario. If descendants are included, the study found that the fiscal impact was positive in six of the eight scenarios for those who came at ages 0 to 24 compared to a net positive finding in five scenarios when an immigrant arrived ages 25 to 64. Again, those 65 and older at arrival are a large fiscal drain in every scenario.14 None of this is surprising; those who come at young ages are more likely to have a U.S. education, be more acculturated, and tend to have higher lifetime earnings, all other things being equal.
Another reason why younger immigrants will tend to have a more positive fiscal impact is that they will pay taxes longer before reaching retirement age and begin accessing Medicaid and Social Security, which are very costly. The immigrants who arrive at the oldest ages are, not surprisingly, extremely costly for taxpayers. In addition to the NAS studies cited above, we can see this by looking at the 2017 ACS data. The survey from 2017 shows that, of immigrants who were 65 and older and had come in the five years prior, 31 percent were on Medicaid (the health insurance program for the poor) compared to 13 percent for the native-born. The vast majority of these immigrants had not been in the country long enough to pay into Medicare (the insurance program for the elderly) to be eligible for that program, but because many of them have incomes below the poverty threshold, they access Medicaid at very high rates. Data from the Census Bureau's Current Population Survey shows that immigrants over 65 who came to the United States at older ages accessed the Supplemental Security Income (SSI) program at about five times the rate of natives age 65 and older.15 The program provides cash payment to the disabled and low-income elderly. These figures are a good reminder that immigrants who arrive at older ages often struggle to support themselves and even if they may not be eligible for Medicare or Social Security, having not paid into those programs long enough or at all, they still will access programs like Medicaid and SSI at high rates. All of this means that the increase in the age at arrival of immigrants likely has negative fiscal implications, especially the significant increase in the number of immigrants coming in the oldest age groups.
Aging Among All Immigrants
There is no question that immigrants are coming to America at older ages. However, at any given moment new immigrants account for only a modest share of all immigrants. In 2017, there were 44.5 million immigrants (legal and illegal) in the country. Like all people over time, the existing immigrant population ages. Of course, new immigrants will make the overall immigrant population somewhat younger when they first arrive, though how much younger depends on their age and number. Since new immigrants are coming at older ages than in the past, this will tend to reduce their ability to slow the aging of the nation's overall population or slow the aging of the overall immigrant population. Between 1990 and 2000, the share of immigrants 65 and older actually fell. This was partly due to the relatively large number of older immigrants in 1990, which reflected prior flows of immigration earlier in the century, including the tail end of the Great Wave. By 2000, many of these very old immigrants had passed away. As we have seen, since 2000 immigrants have been arriving at older ages and, as the next section will show, the overall immigrant population has aged significantly.
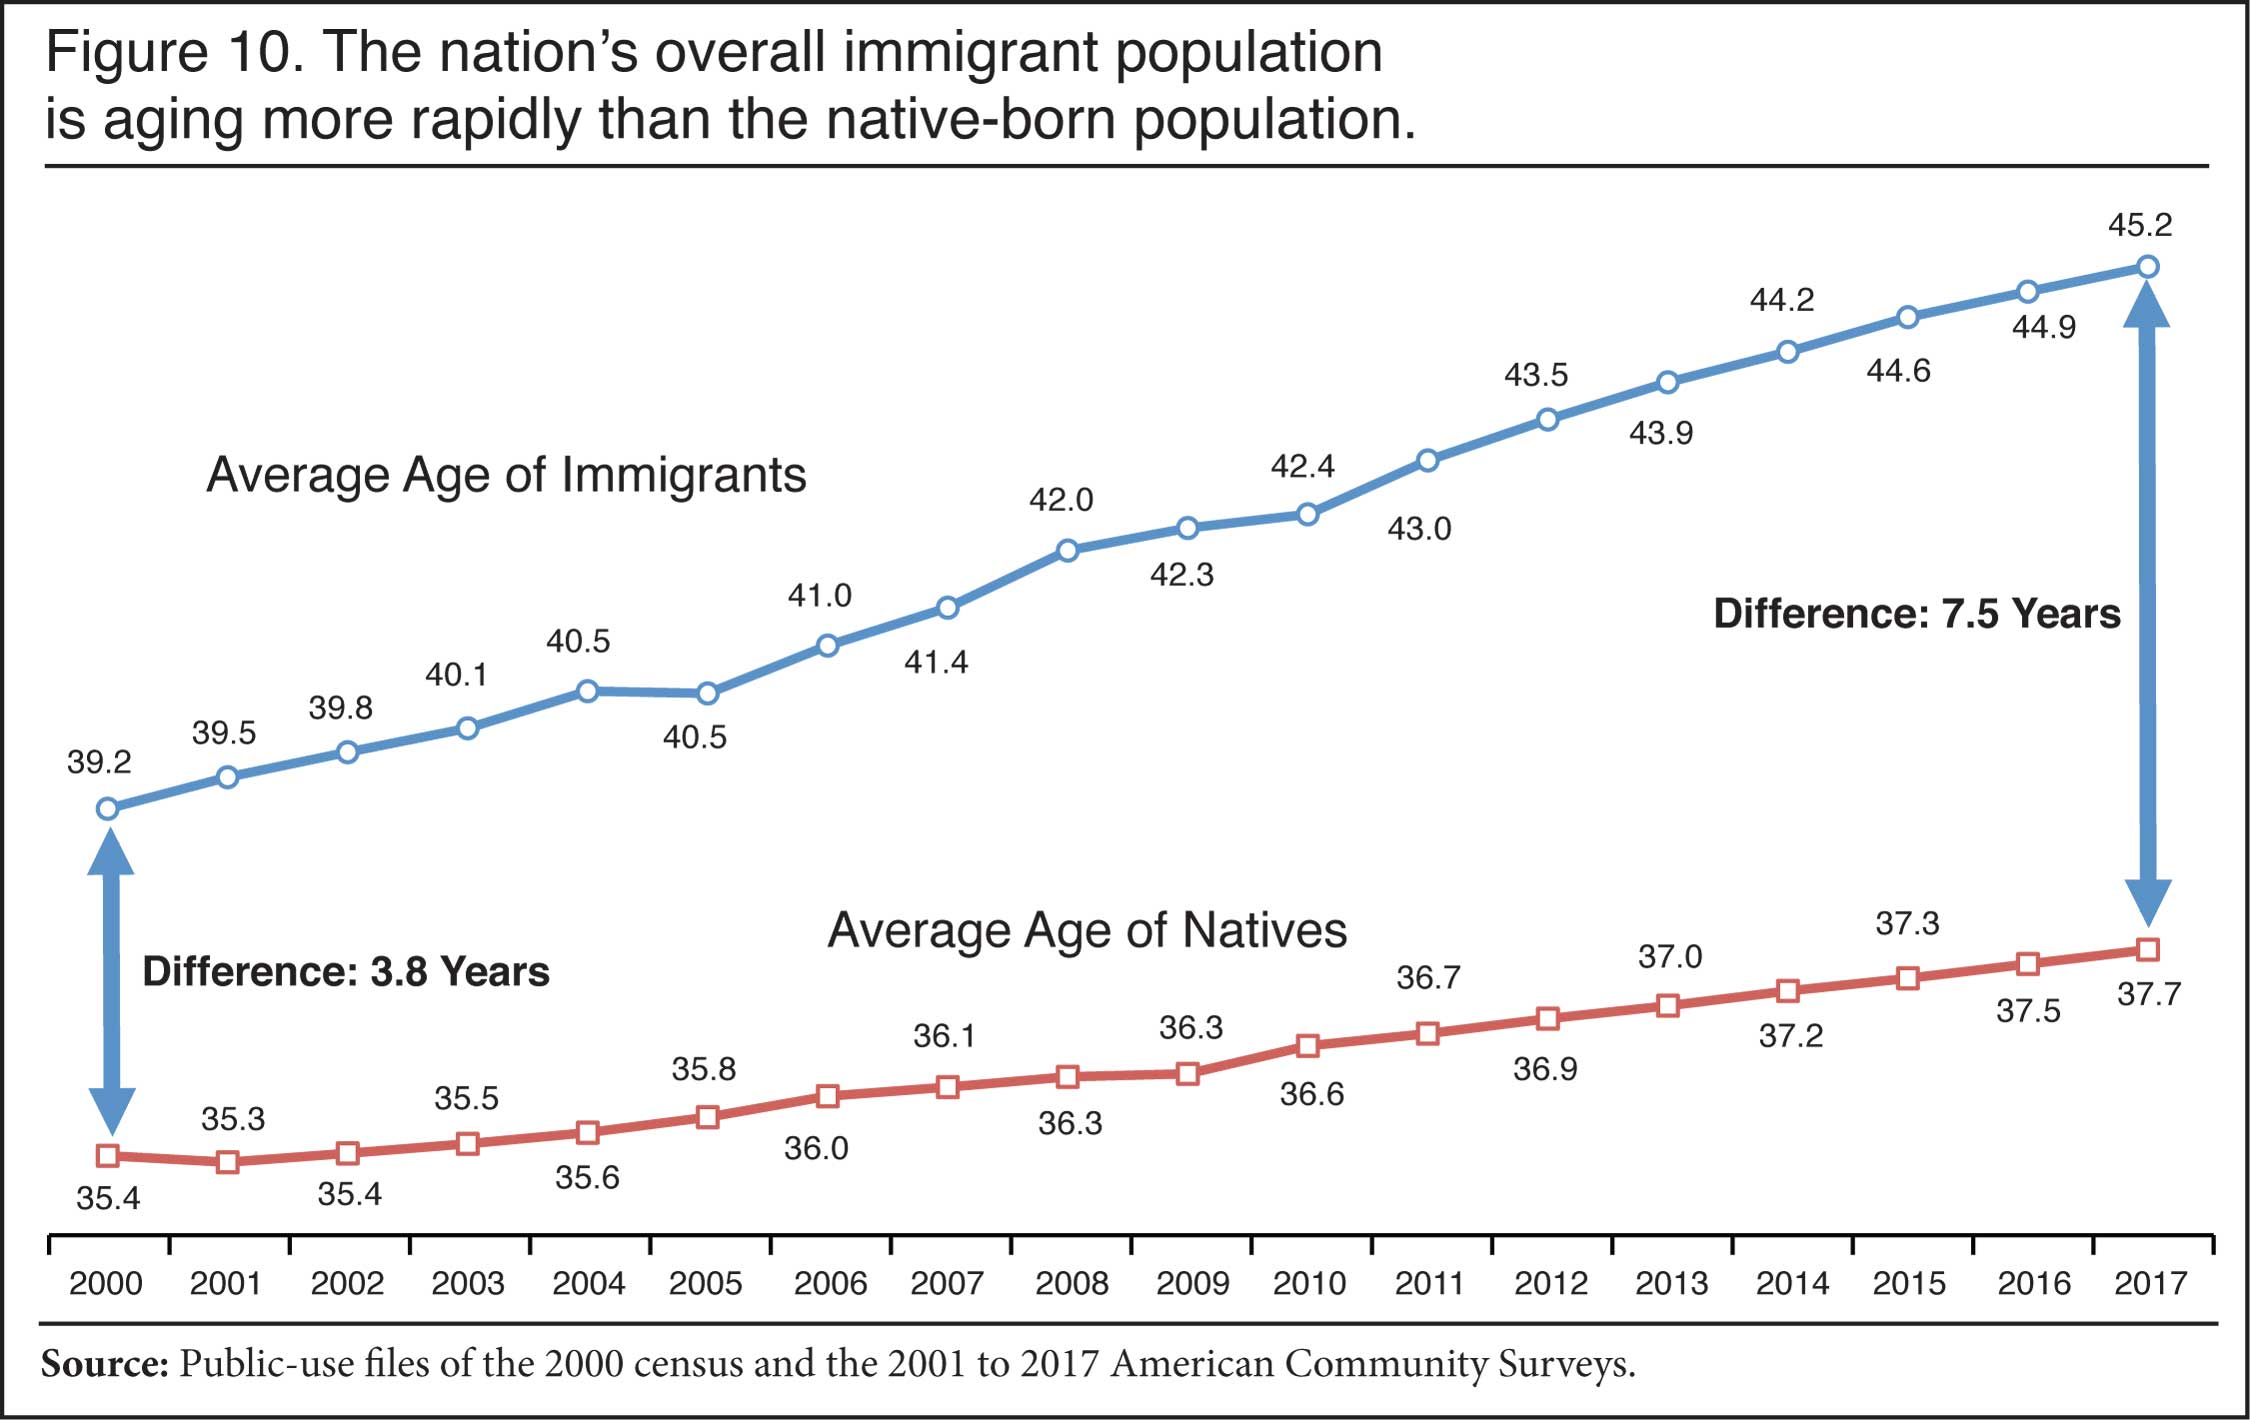
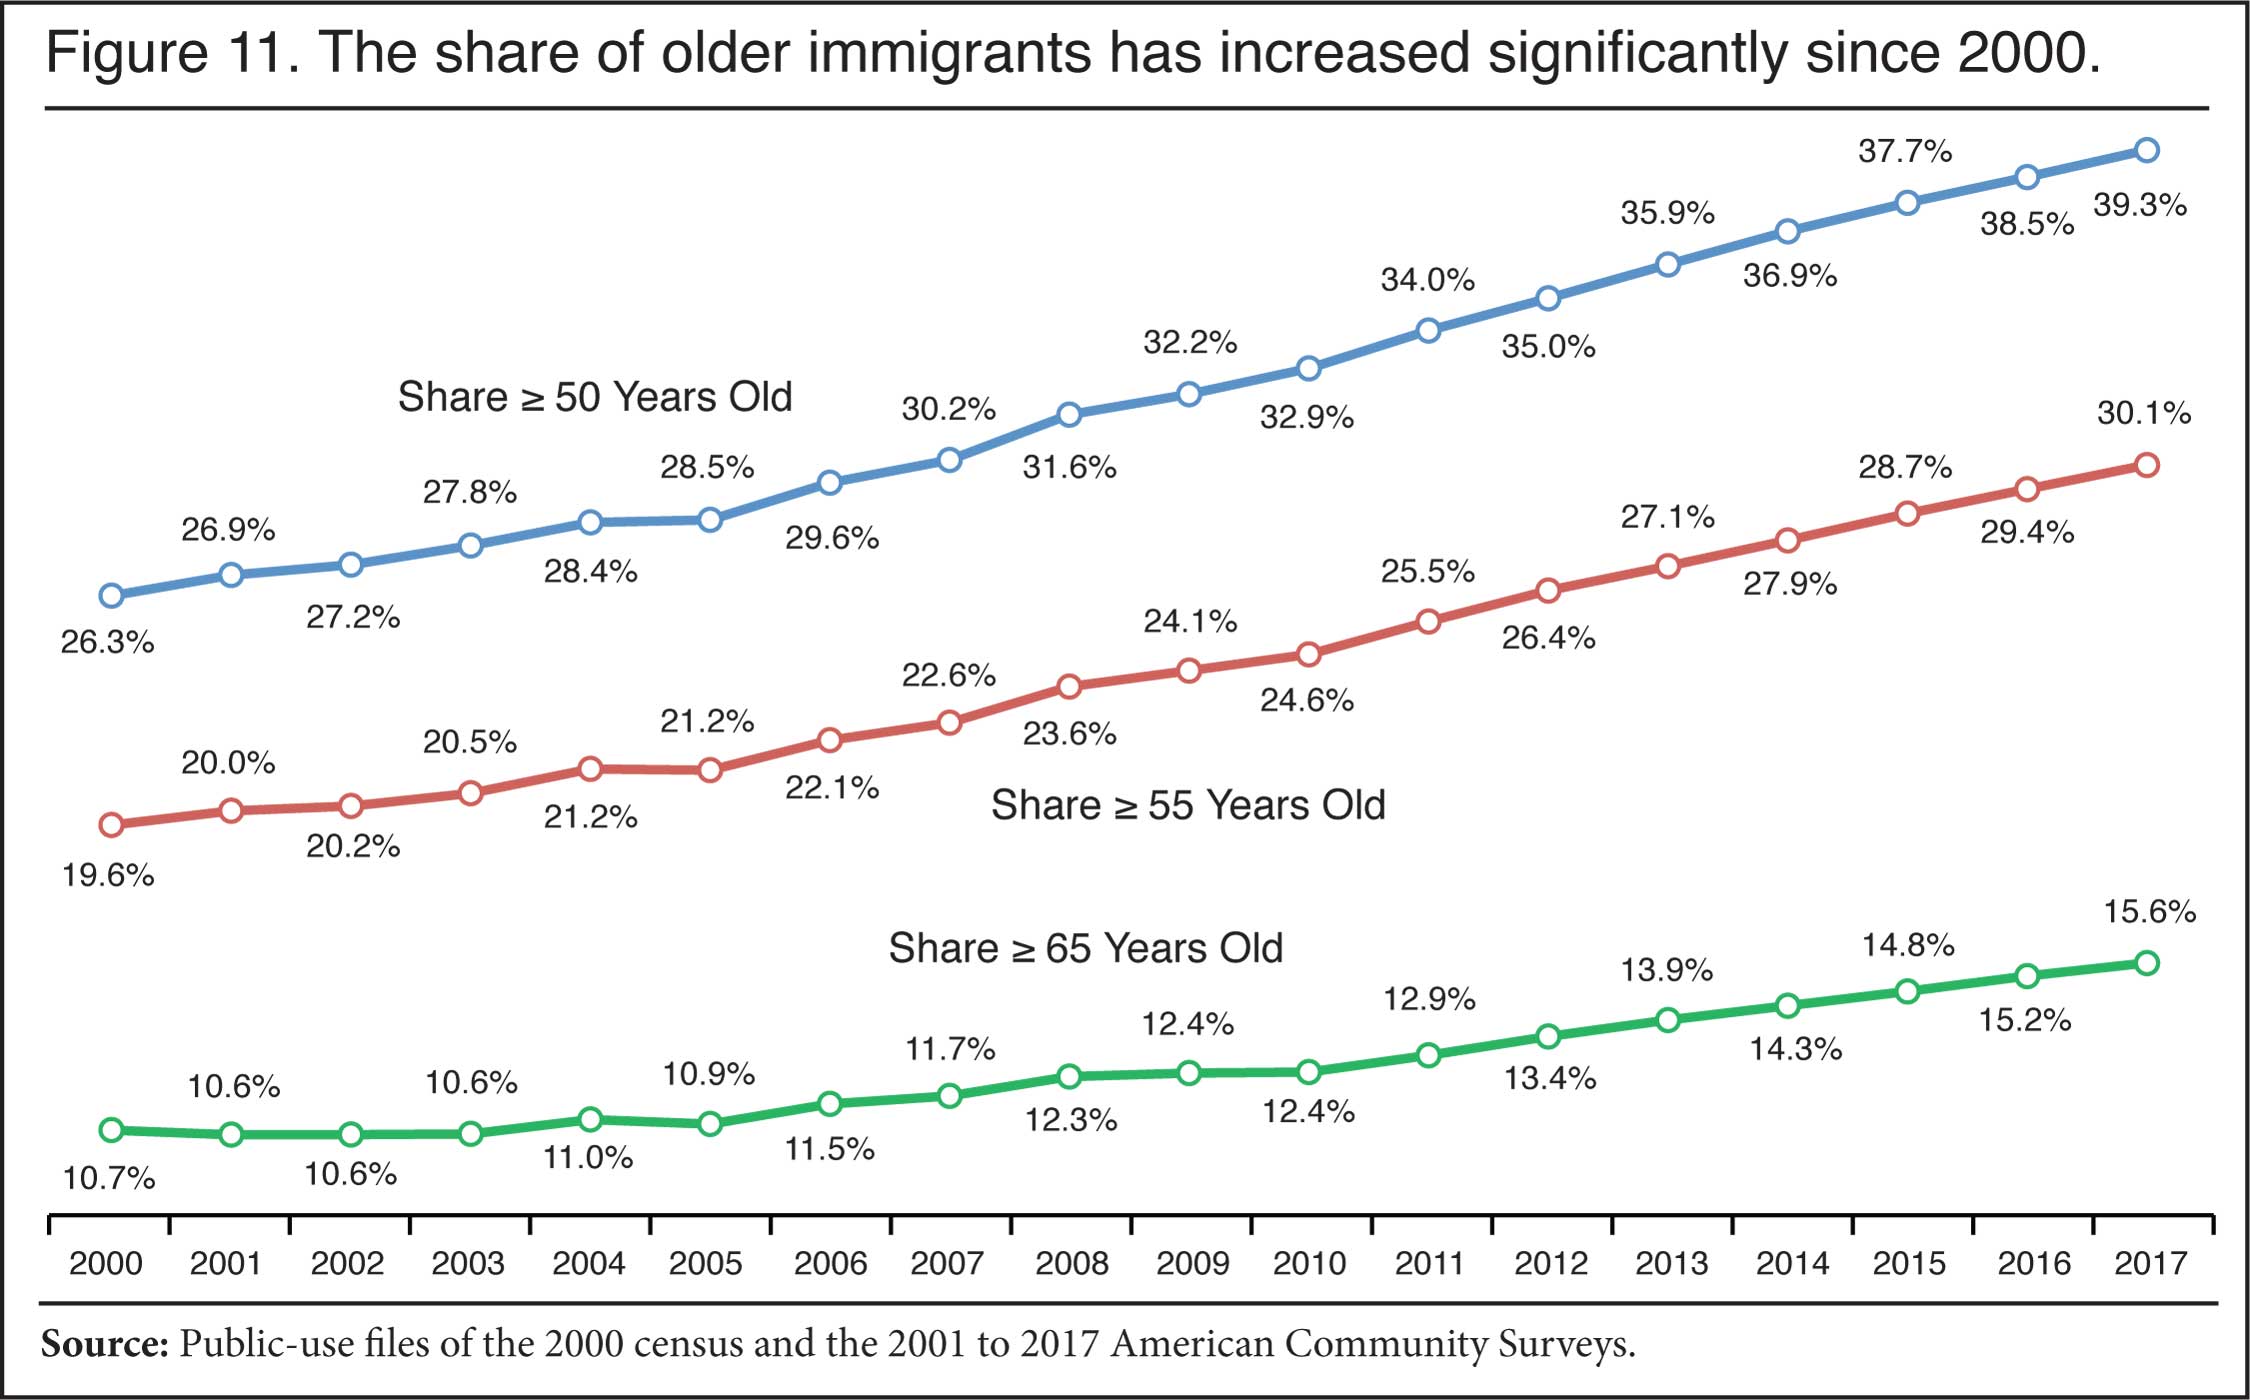
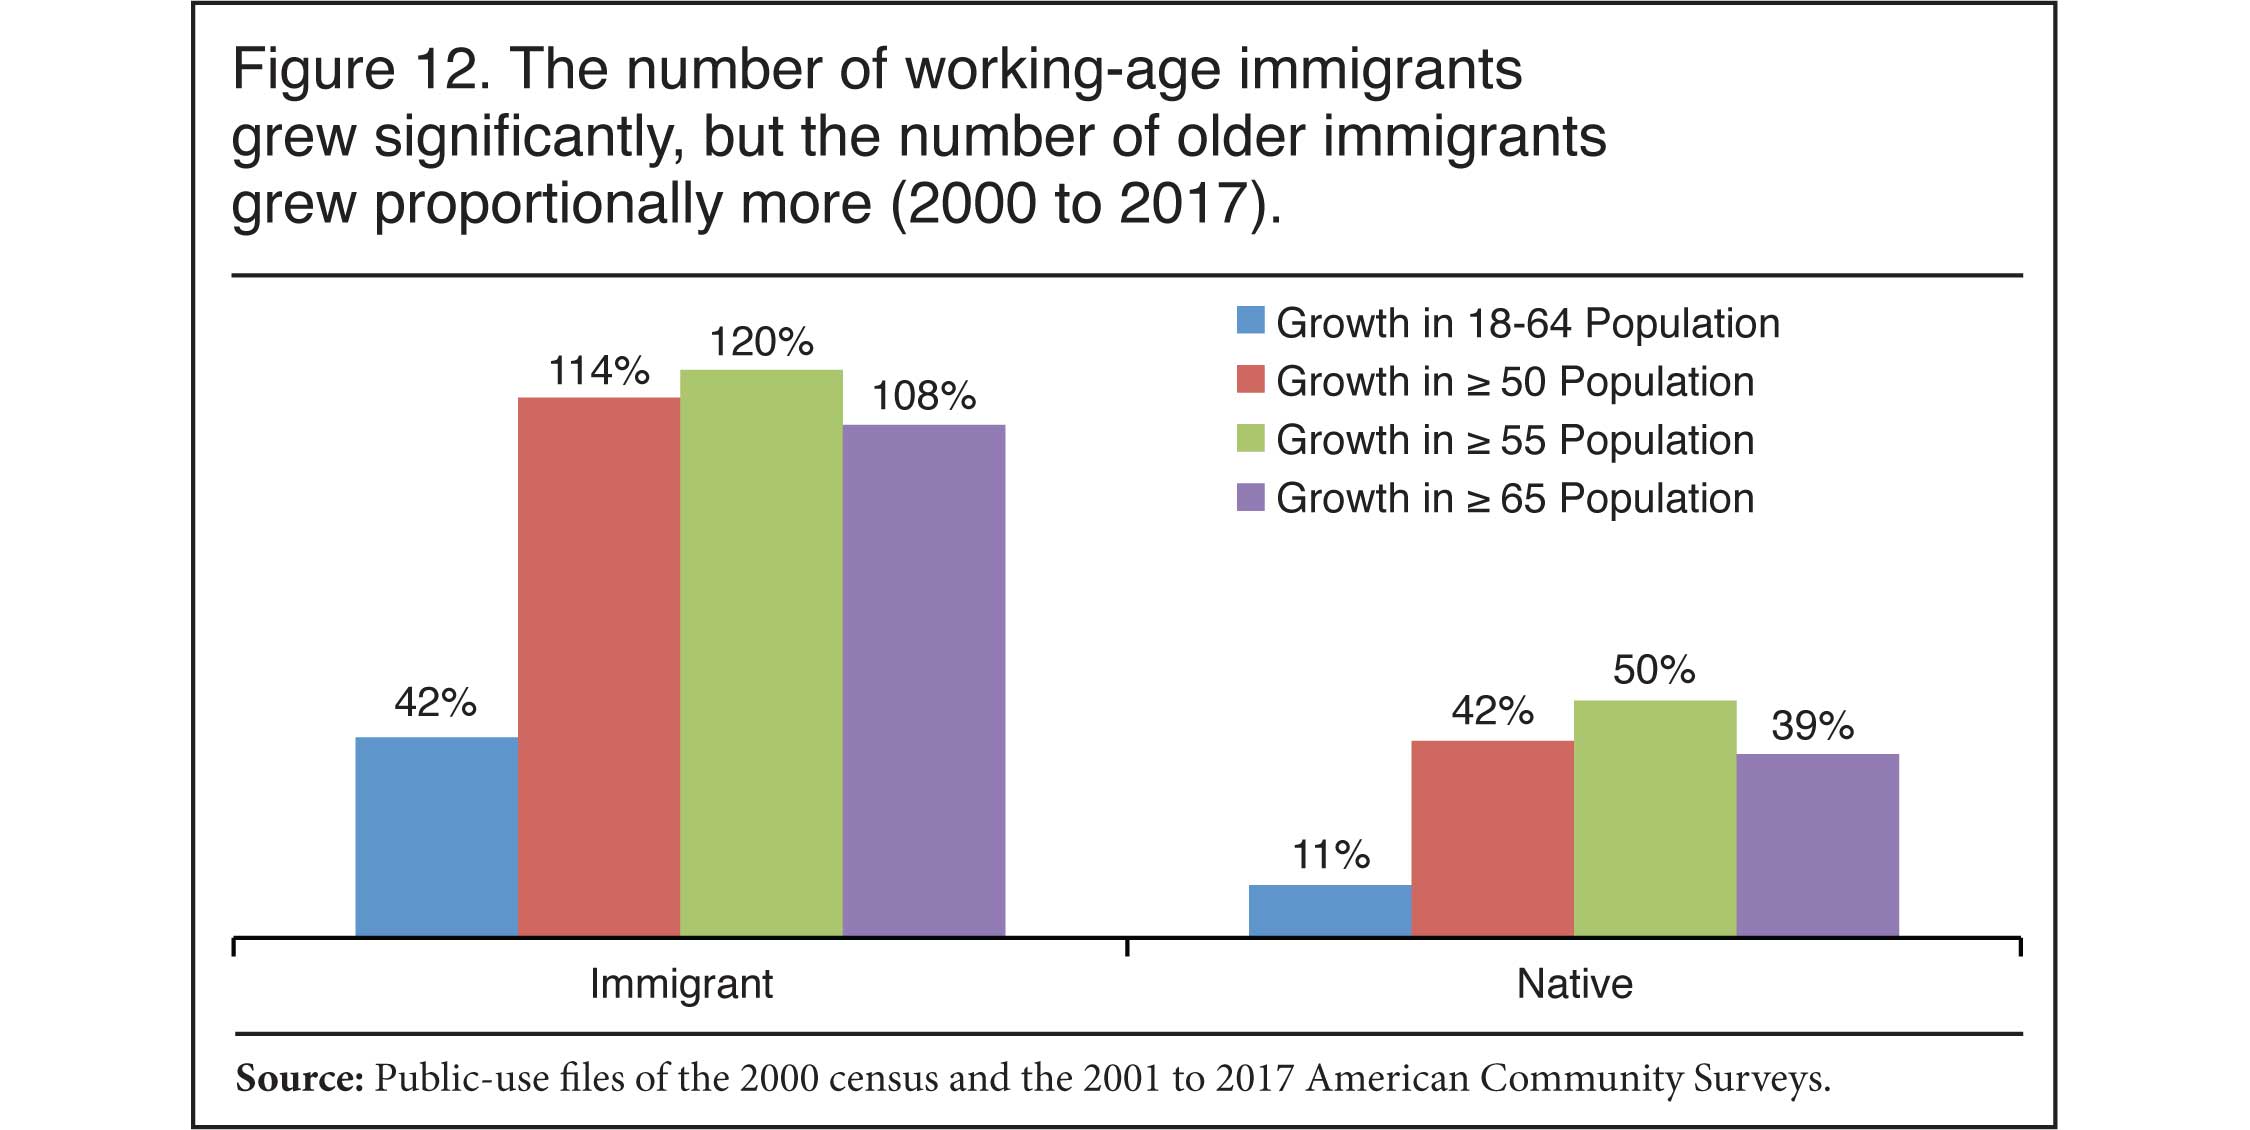
The Increasing Age of Immigrants. Figure 10 shows the average age of all immigrants and the native-born. It is similar to Figure 9, except that Figure 10 is a comparison between all immigrants and natives rather than only new immigrants, as shown in the prior figure. The average age of all immigrants has increased significantly, from 39.2 years in 2000 to 45.2 years in 2017, or about 2.5 times more than the average age of the native-born. Figure 11 shows the percentage of all immigrants who are 50 and older, 55 and older, and 65 and older. The older age groups experienced dramatic growth since 2000.16 Figure 12 shows the percentage increase in the number of immigrants in each age group. Probably the most striking thing in Figure 12 is that the number of immigrants who are of working-age grew by 42 percent between 2000 and 2017; however the number 65 and older grew by 108 percent. This clearly demonstrates how immigration adds to both the pool of workers, but also the pool of retirees. In fact, all the older age groups shown in the figure grew significantly more than the number of working-age immigrants.
 |
 |
 |
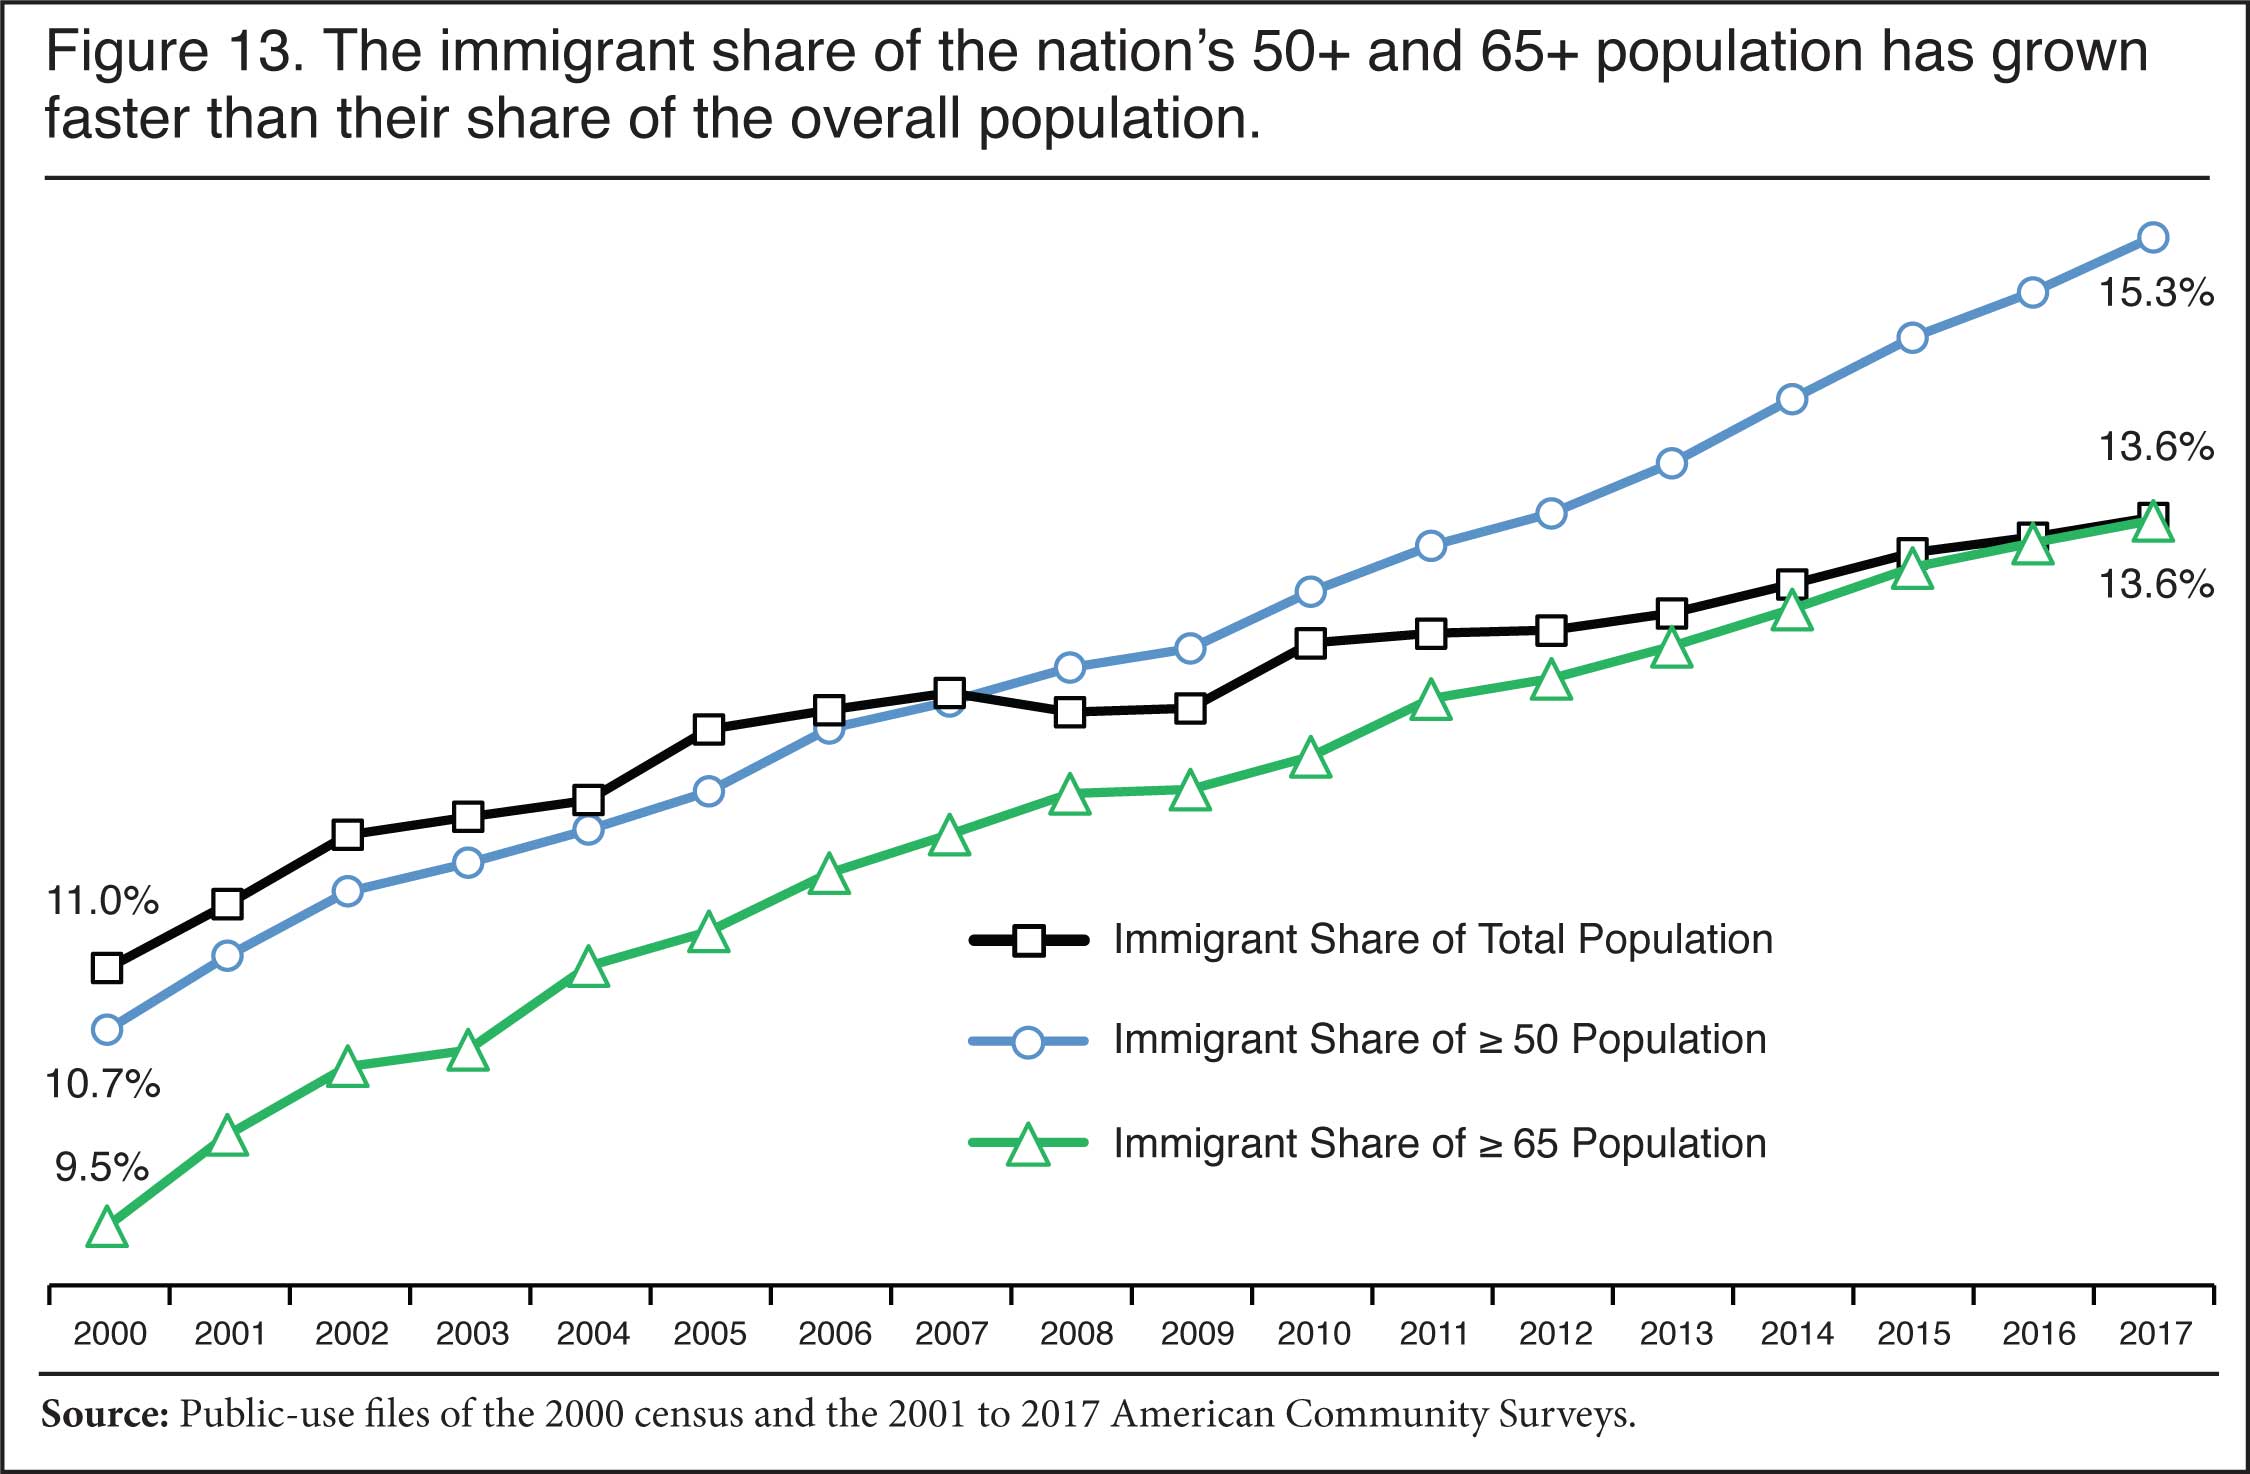
Immigrants as a Share of Older Americans. Population aging among immigrants can also be seen by looking at the share of all persons in older age groups who are immigrants. Figure 13 reports the share of each age group in the United States who are immigrants, not the share of immigrants in these age groups. So Figure 13 reads as follows: In 2000, 9.5 percent of all persons in the country 65 and older were immigrants and by 2017 it was 13.6 percent. In fact, the immigrant share of the total population now matches their share of the 65 and older population. This simply reflects the fact that the nation's immigrant population is aging rapidly.
 |
Births Do Not Add to the Immigrant Population. When thinking about immigration and aging, it is important to keep in mind that births within the United States to immigrants do not add to the immigrant population, but instead are added to the native-born population. This makes the native population more youthful while the lack of births to immigrants is part of the reason the immigrant population ages so quickly. This means it is not enough to simply look at immigrants when thinking about the total long-term impact of immigration on the aging of the U.S. population. Immigrants have descendants who have to be fully accounted for when examining immigration's impact on the nation's age structure. Of course, our Census Bureau-based projections released in February of this year show the modest impact of immigration on the nation's age structure through 2060 when immigrants and all their descendants are accounted for.17 The prior research cited in end note 1 indicating the modest impact on aging also takes into account the descendants of immigrants. In addition, in a forthcoming companion study to this report we will examine the impact of all post-1990 immigrants on population aging, including their U.S.-born descendants. Our projections, prior research, and our companion study all demonstrate that immigration has a modest impact on aging even when the descendants are accounted for.
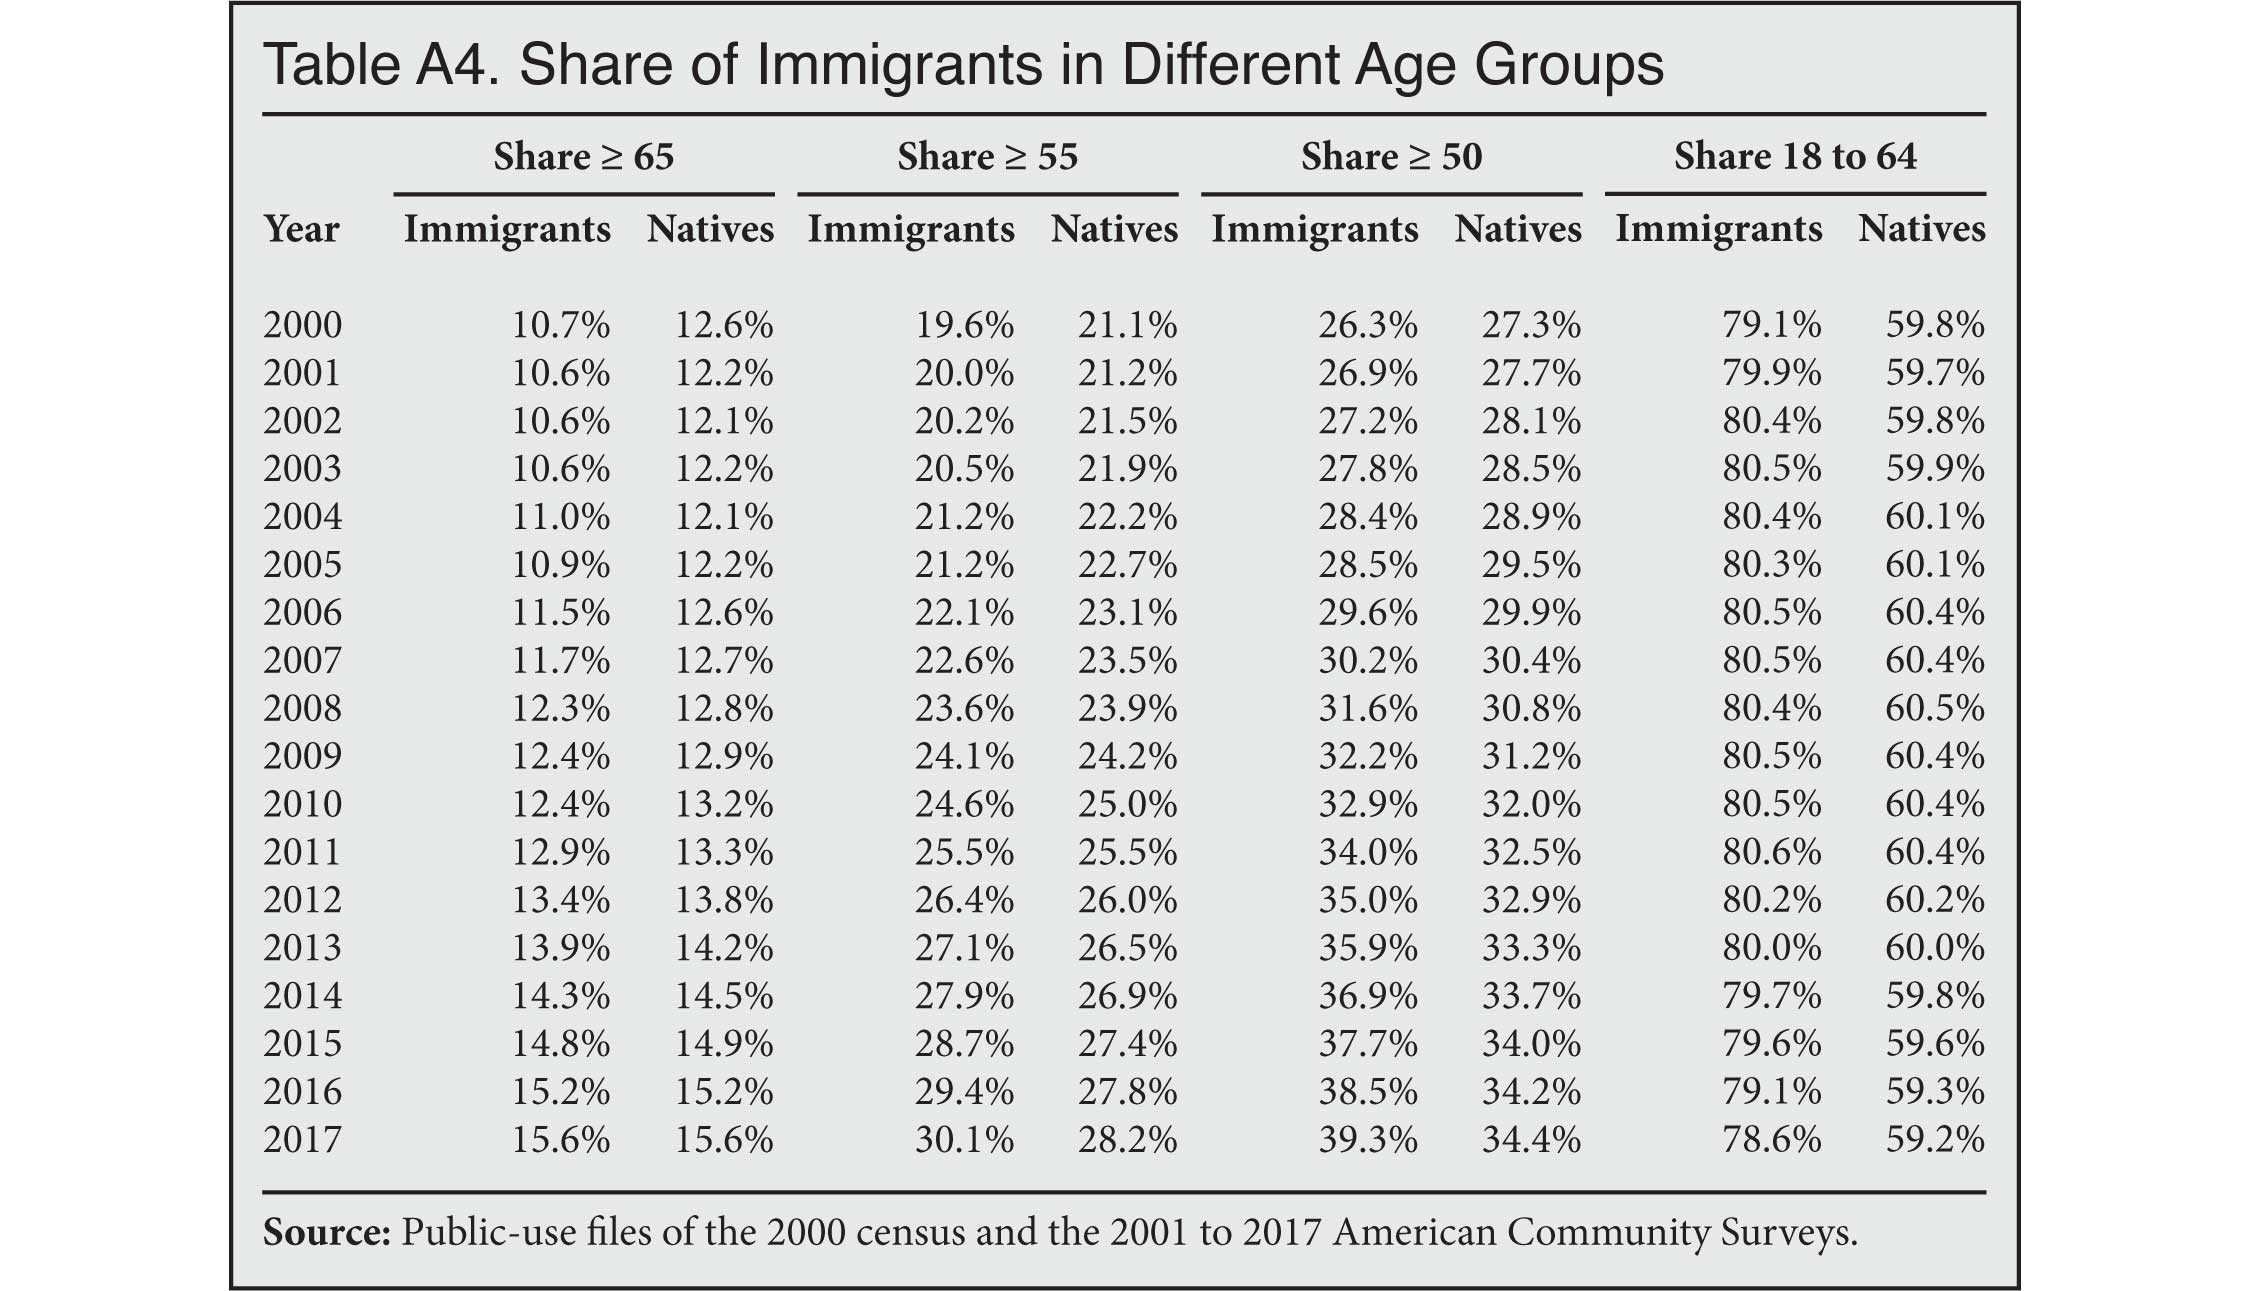
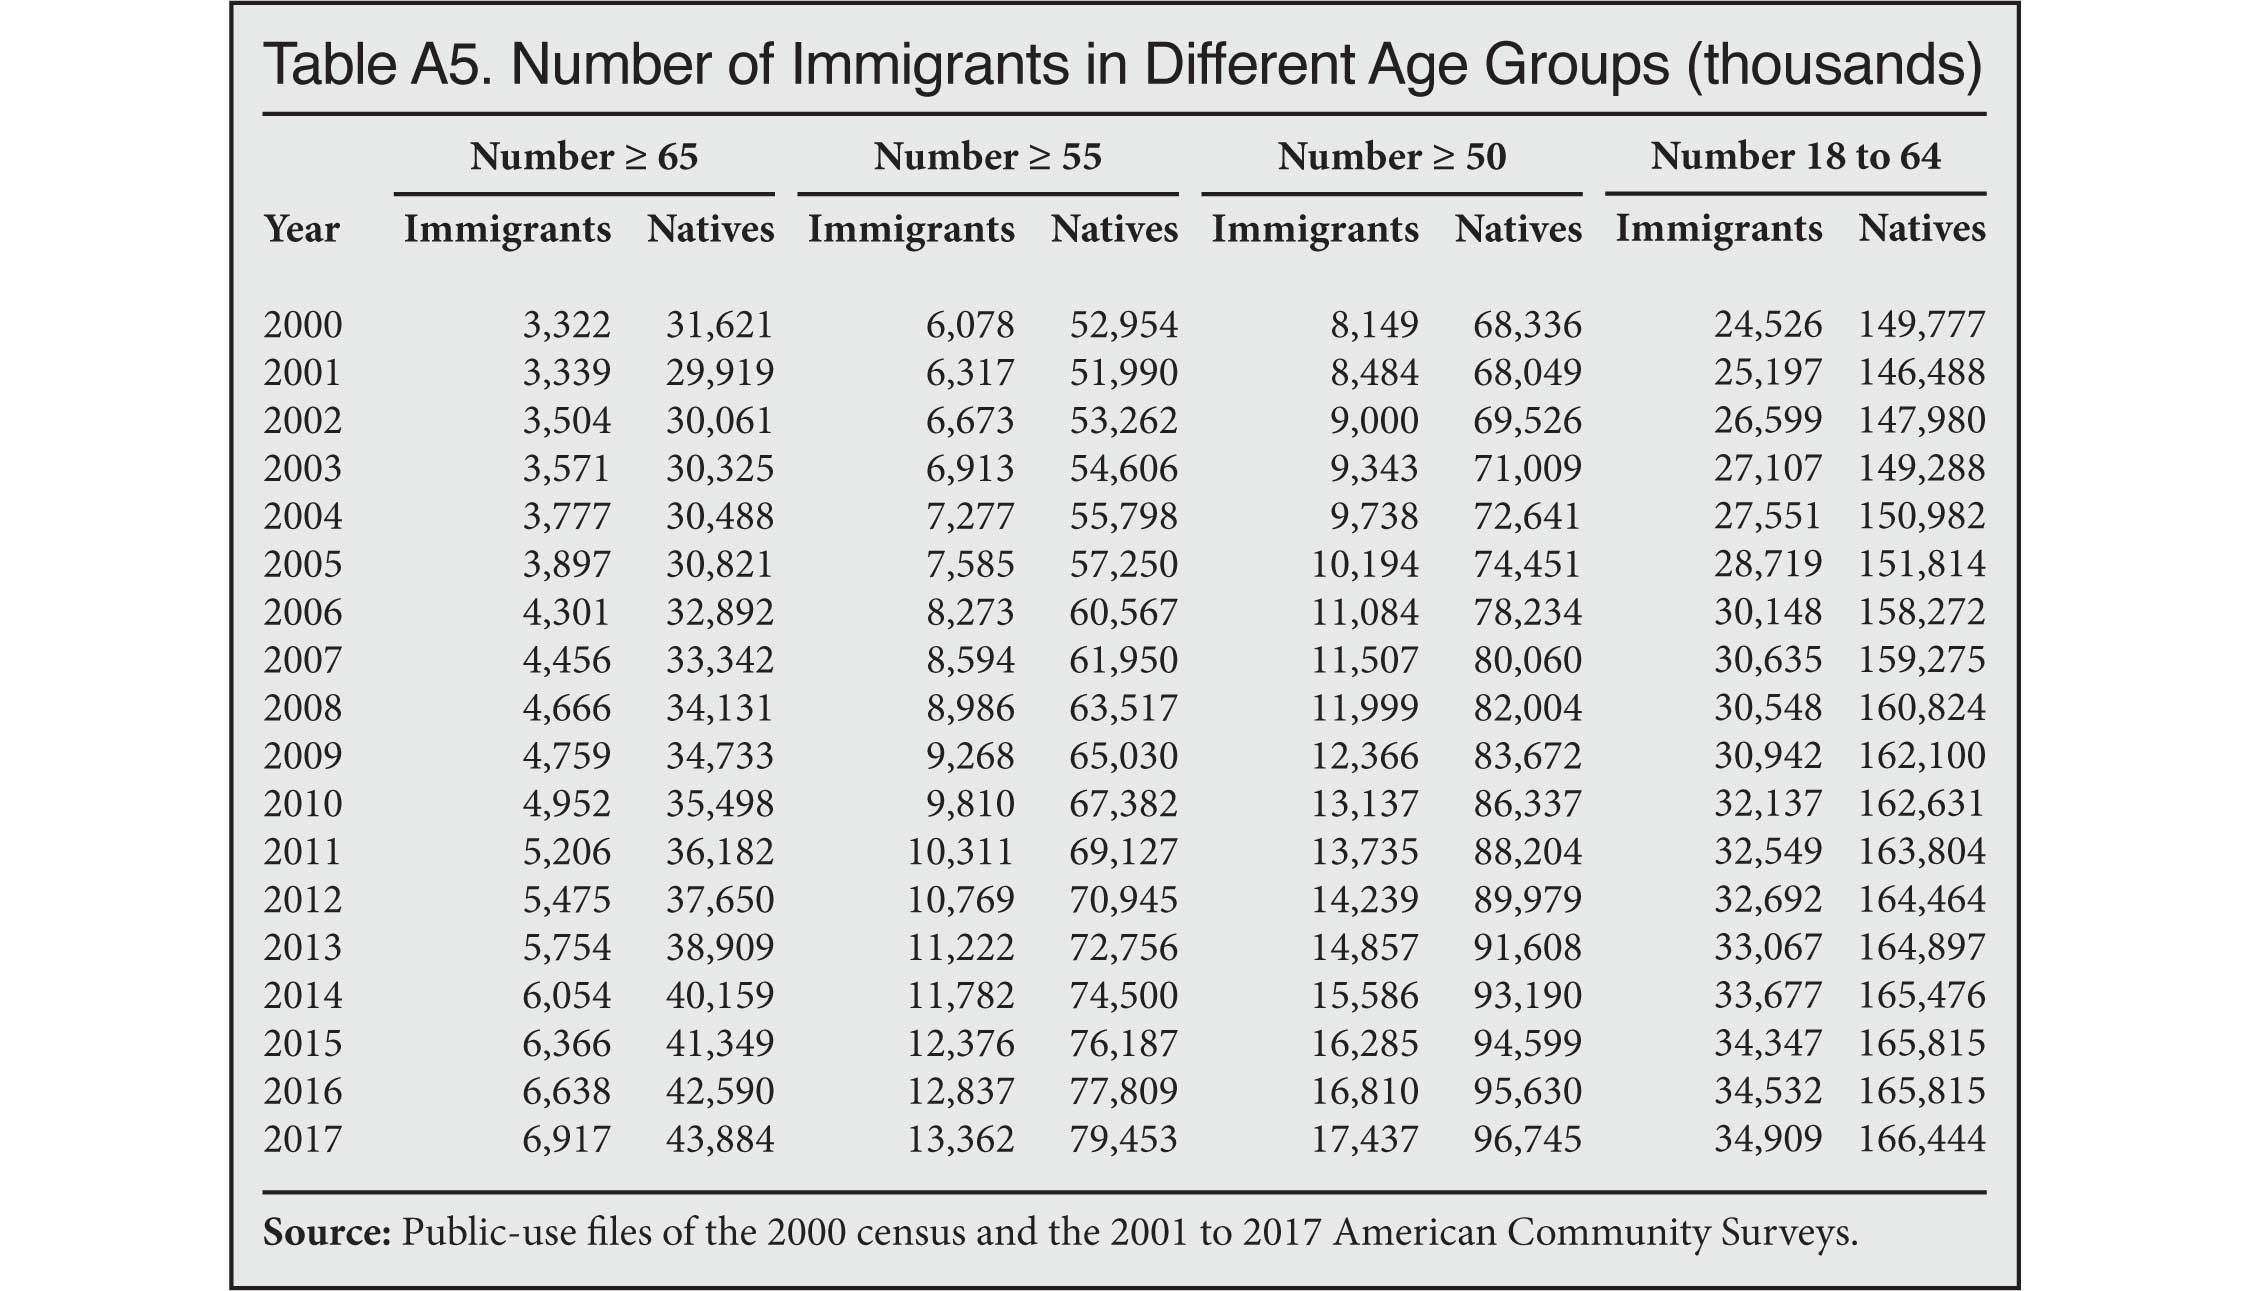
What Figures 10 through 13 (and appendix Tables A4 and A5) do show is that immigration does not simply add potential workers. Immigrants arrive at all ages, as we have seen, and they age over time. Yes, immigrants do increase the number of working-age people, but that is not all they do. Immigrants are now arriving at older ages and all immigrants who remain in the country grow older over time. This simple fact is often overlooked by those who only think of immigrants stereotypically — as only young workers — rather than human beings who are distributed across the age distribution at arrival and then age over time.
Conclusion
Although it is often argued that America needs immigration because it makes the nation so much younger, prior research by demographers has shown that immigration actually has only a modest impact on slowing the aging of lower-fertility countries like the United States. The analysis in this report, based on the Census Bureau's American Community Survey (ACS), shows that between 2000 and 2017, the average age at which immigrants are arriving in the United States has increased significantly. As a result, the modest impact of immigration on aging is becoming smaller.
The ACS shows that the average age of newly arrived immigrants increased by more than five years between 2000 and 2017. The survey also shows that the share of new immigrants 65 and older roughly tripled; and the share 55 and older more than doubled. One in nine newly arrived immigrants in 2017 was age 55 or older — old enough to move directly into most retirement communities. One of the likely reasons for this increase is population aging in all of the primary immigrant-sending countries due to declining fertility and increasing life expectancy around the world. Older populations in other countries mean an older pool of potential new immigrants. The decline in illegal immigration, at least in the years prior to 2017, also likely explains some of the increase in the age of new arrivals. Furthermore, the parent category has grown significantly as the pool of naturalized citizens in the United States who can sponsor their parents has increased. Parents typically arrive in their late 40s or older. All of these factors likely contributed to the significant increase in the age of newly arrived immigrants.
The fact that immigrants are coming at older ages not only reduces their already small positive impact on the age structure of the U.S. population, it also has negative fiscal implications. Research by the National Academies for Sciences, Engineering, and Medicine indicates that immigrants who arrive at older ages tend to create a net fiscal drain, creating more costs for the government than they pay in taxes. Because immigrants are now arriving at older ages, including many at or near retirement, it means that the fiscal impact of immigration will be more negative or at least less positive than would have been the case had the average age of immigrants remained younger.
This analysis also includes a brief look at the aging of immigrants generally. The findings make clear that the average age and the share of all immigrants who are in older age cohorts has increased significantly in recent years. For example, the number of working-age immigrants grew by 42 percent between 2000 and 2017, but the number 65 and over increased by 108 percent. While calculations of this kind do not include births to immigrants and so do not represent a full accounting of the total impact of immigration and population aging, they are a powerful reminder of how immigration adds to both the working-age and the population of retirees.
The most important finding in this report is the dramatic increase in the age at which immigrants are settling in the country. Whatever the reason for the increase in the age of new immigrants, any effort to understand the impact of immigration on American society in the future will need to take into account this profound change in the flow of new immigrants into the country.
Appendix
 |
 |
 |
 |
 |
 |
 |
End Notes
1 In a 1992 article in Demography, the leading academic journal in the field, economist Carl Schmertmann explained that, mathematically, "constant inflows of immigrants, even at relatively young ages, do not necessarily rejuvenate low-fertility populations. In fact, immigration may even contribute to population aging." A UN study two decades ago also found that immigration alone cannot make up for population decline and aging in Western countries. The Census Bureau also concluded in 2000 that immigration is a "highly inefficient" means for increasing the percentage of the population that is of working-age in the long run. See Carl P. Schmertmann, "Immigrants' Ages and the Structure of Stationary Populations with Below-Replacement Fertility", Demography, Vol. 29, No. 4, November 1992, and "Replacement Migration: Is It a Solution to Declining and Ageing Populations?", United Nations Department of Economic and Social Affairs, Population Division, March 2000. The 2000 Census Bureau population projections from 2000 can be found here. The Center for Immigration Studies' most recent population projections based on Census Bureau projections also show the modest impact of immigration on population aging. See Steven A. Camarota and Karen Zeigler, "Projecting the Impact of Immigration on the U.S. Population: A look at size and age structure through 2060", Center for Immigration Studies Backgrounder, February 4, 2019.
2 Immigrants or the "foreign-born" in Census Bureau data are all persons who were not U.S. citizens at birth.
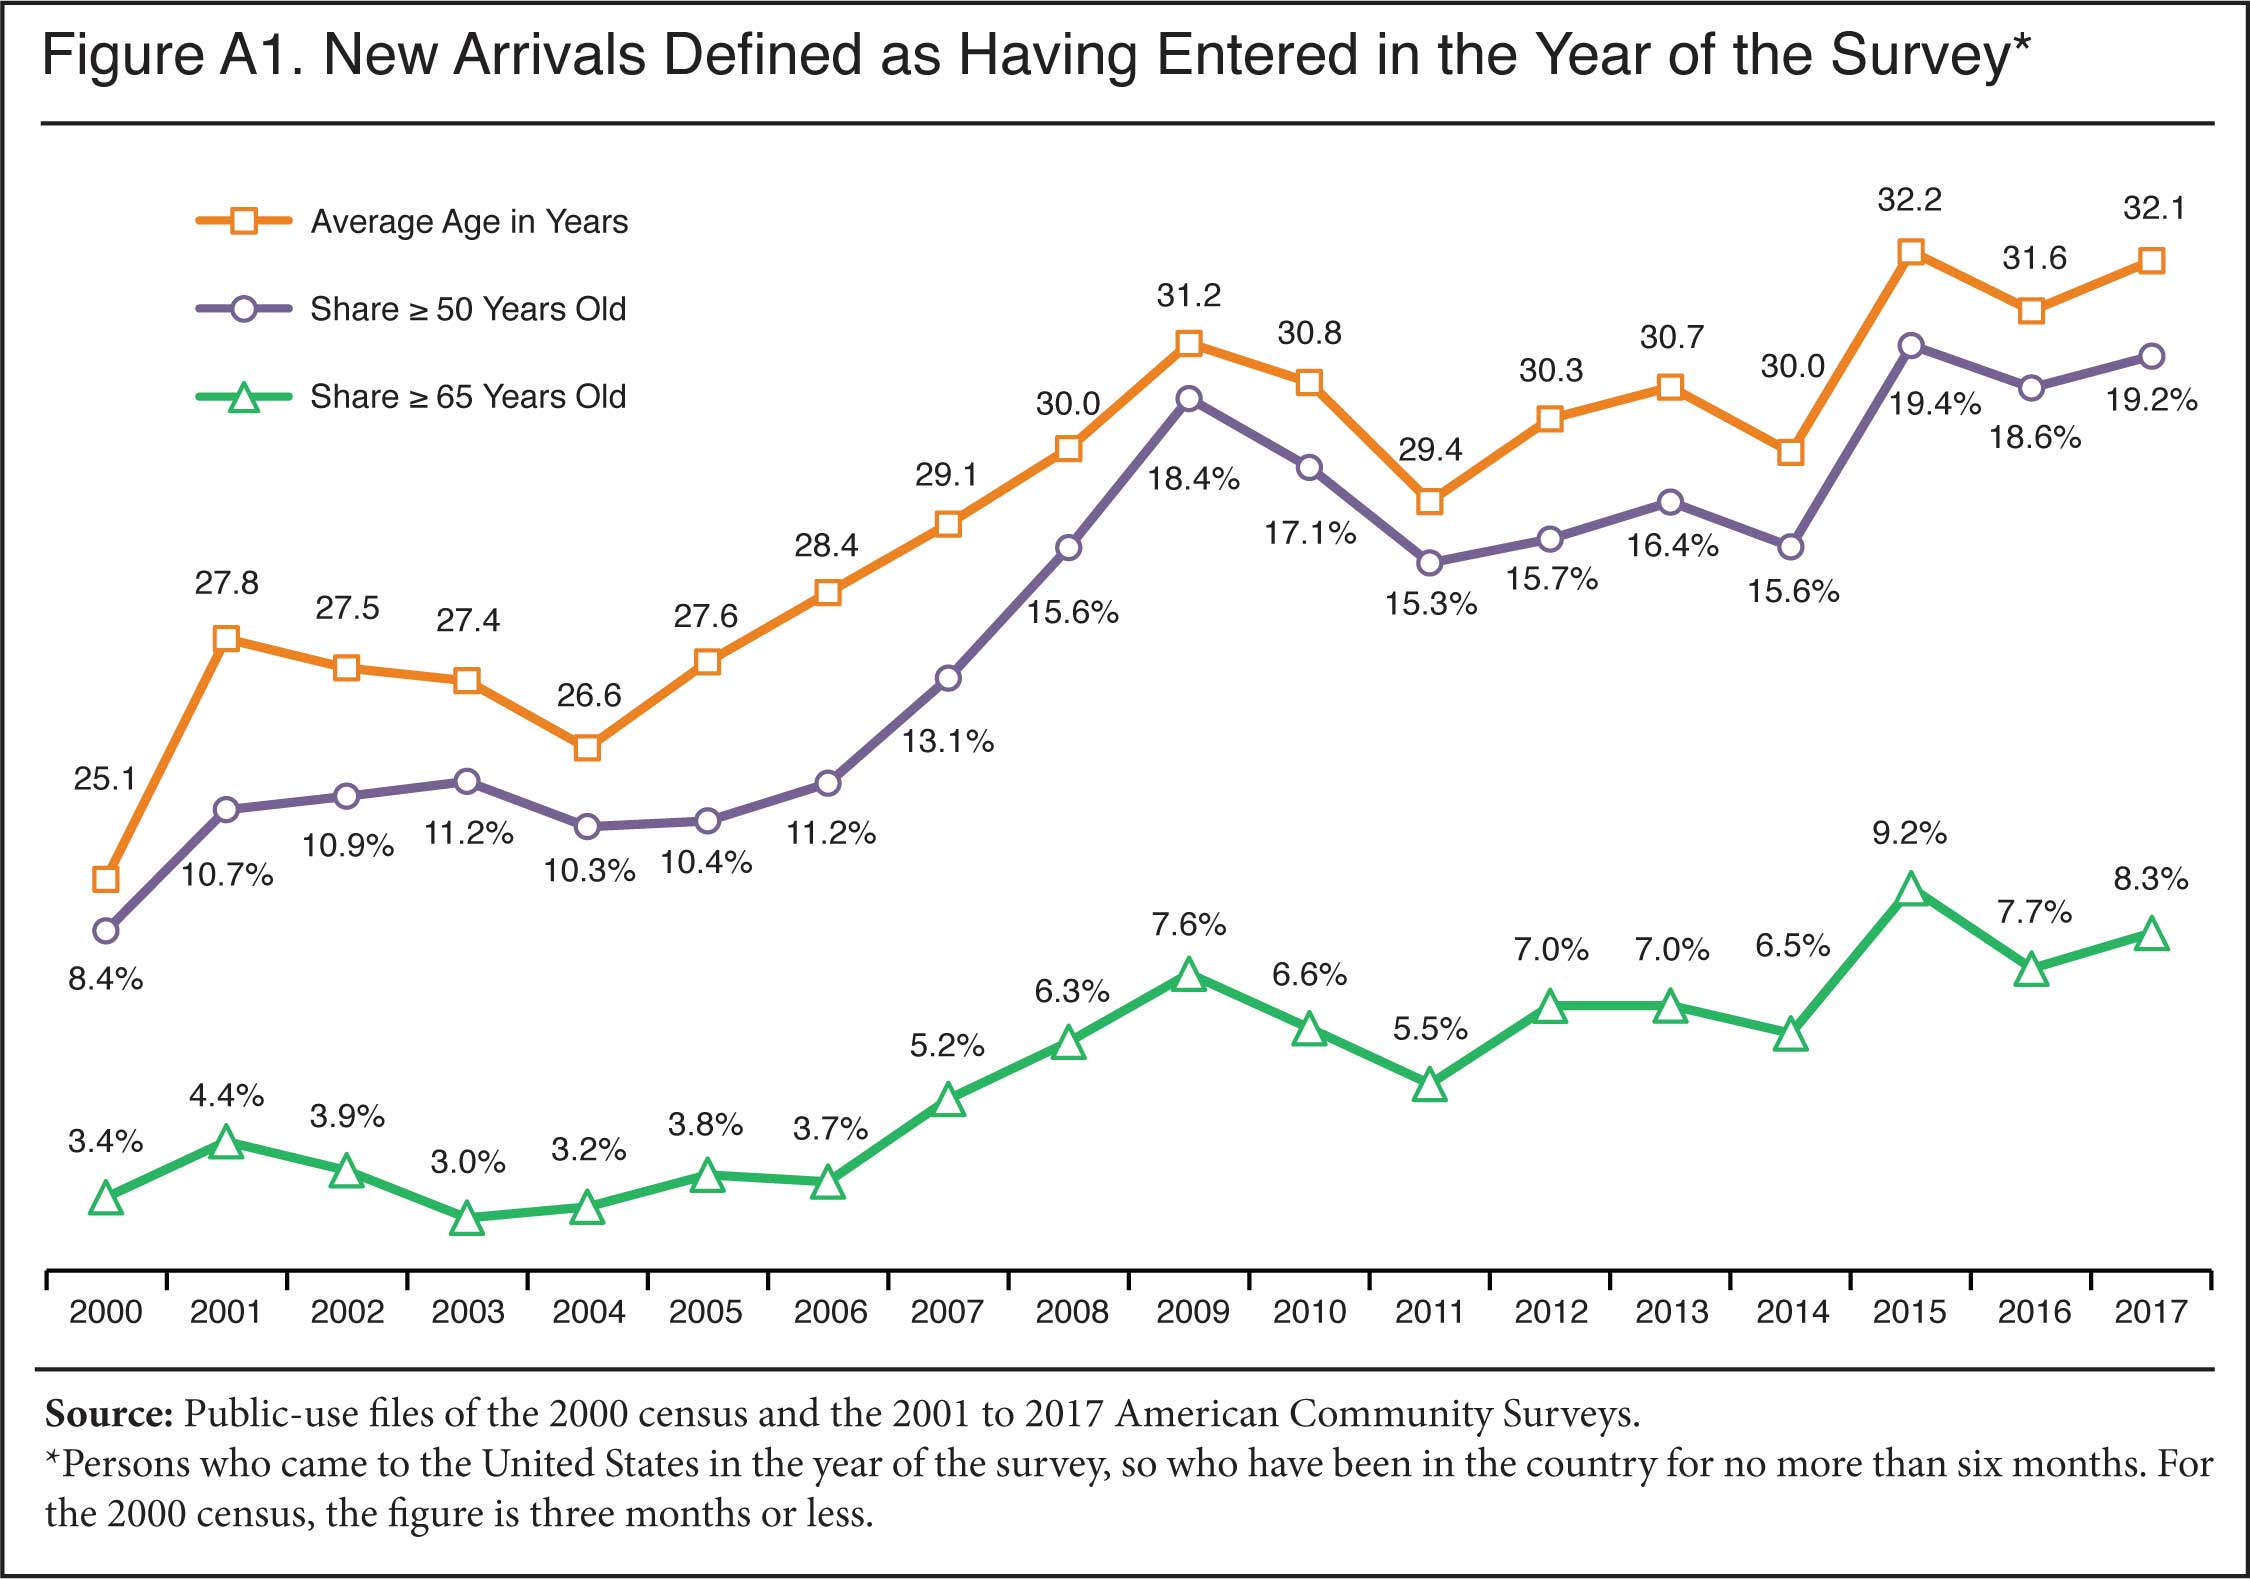
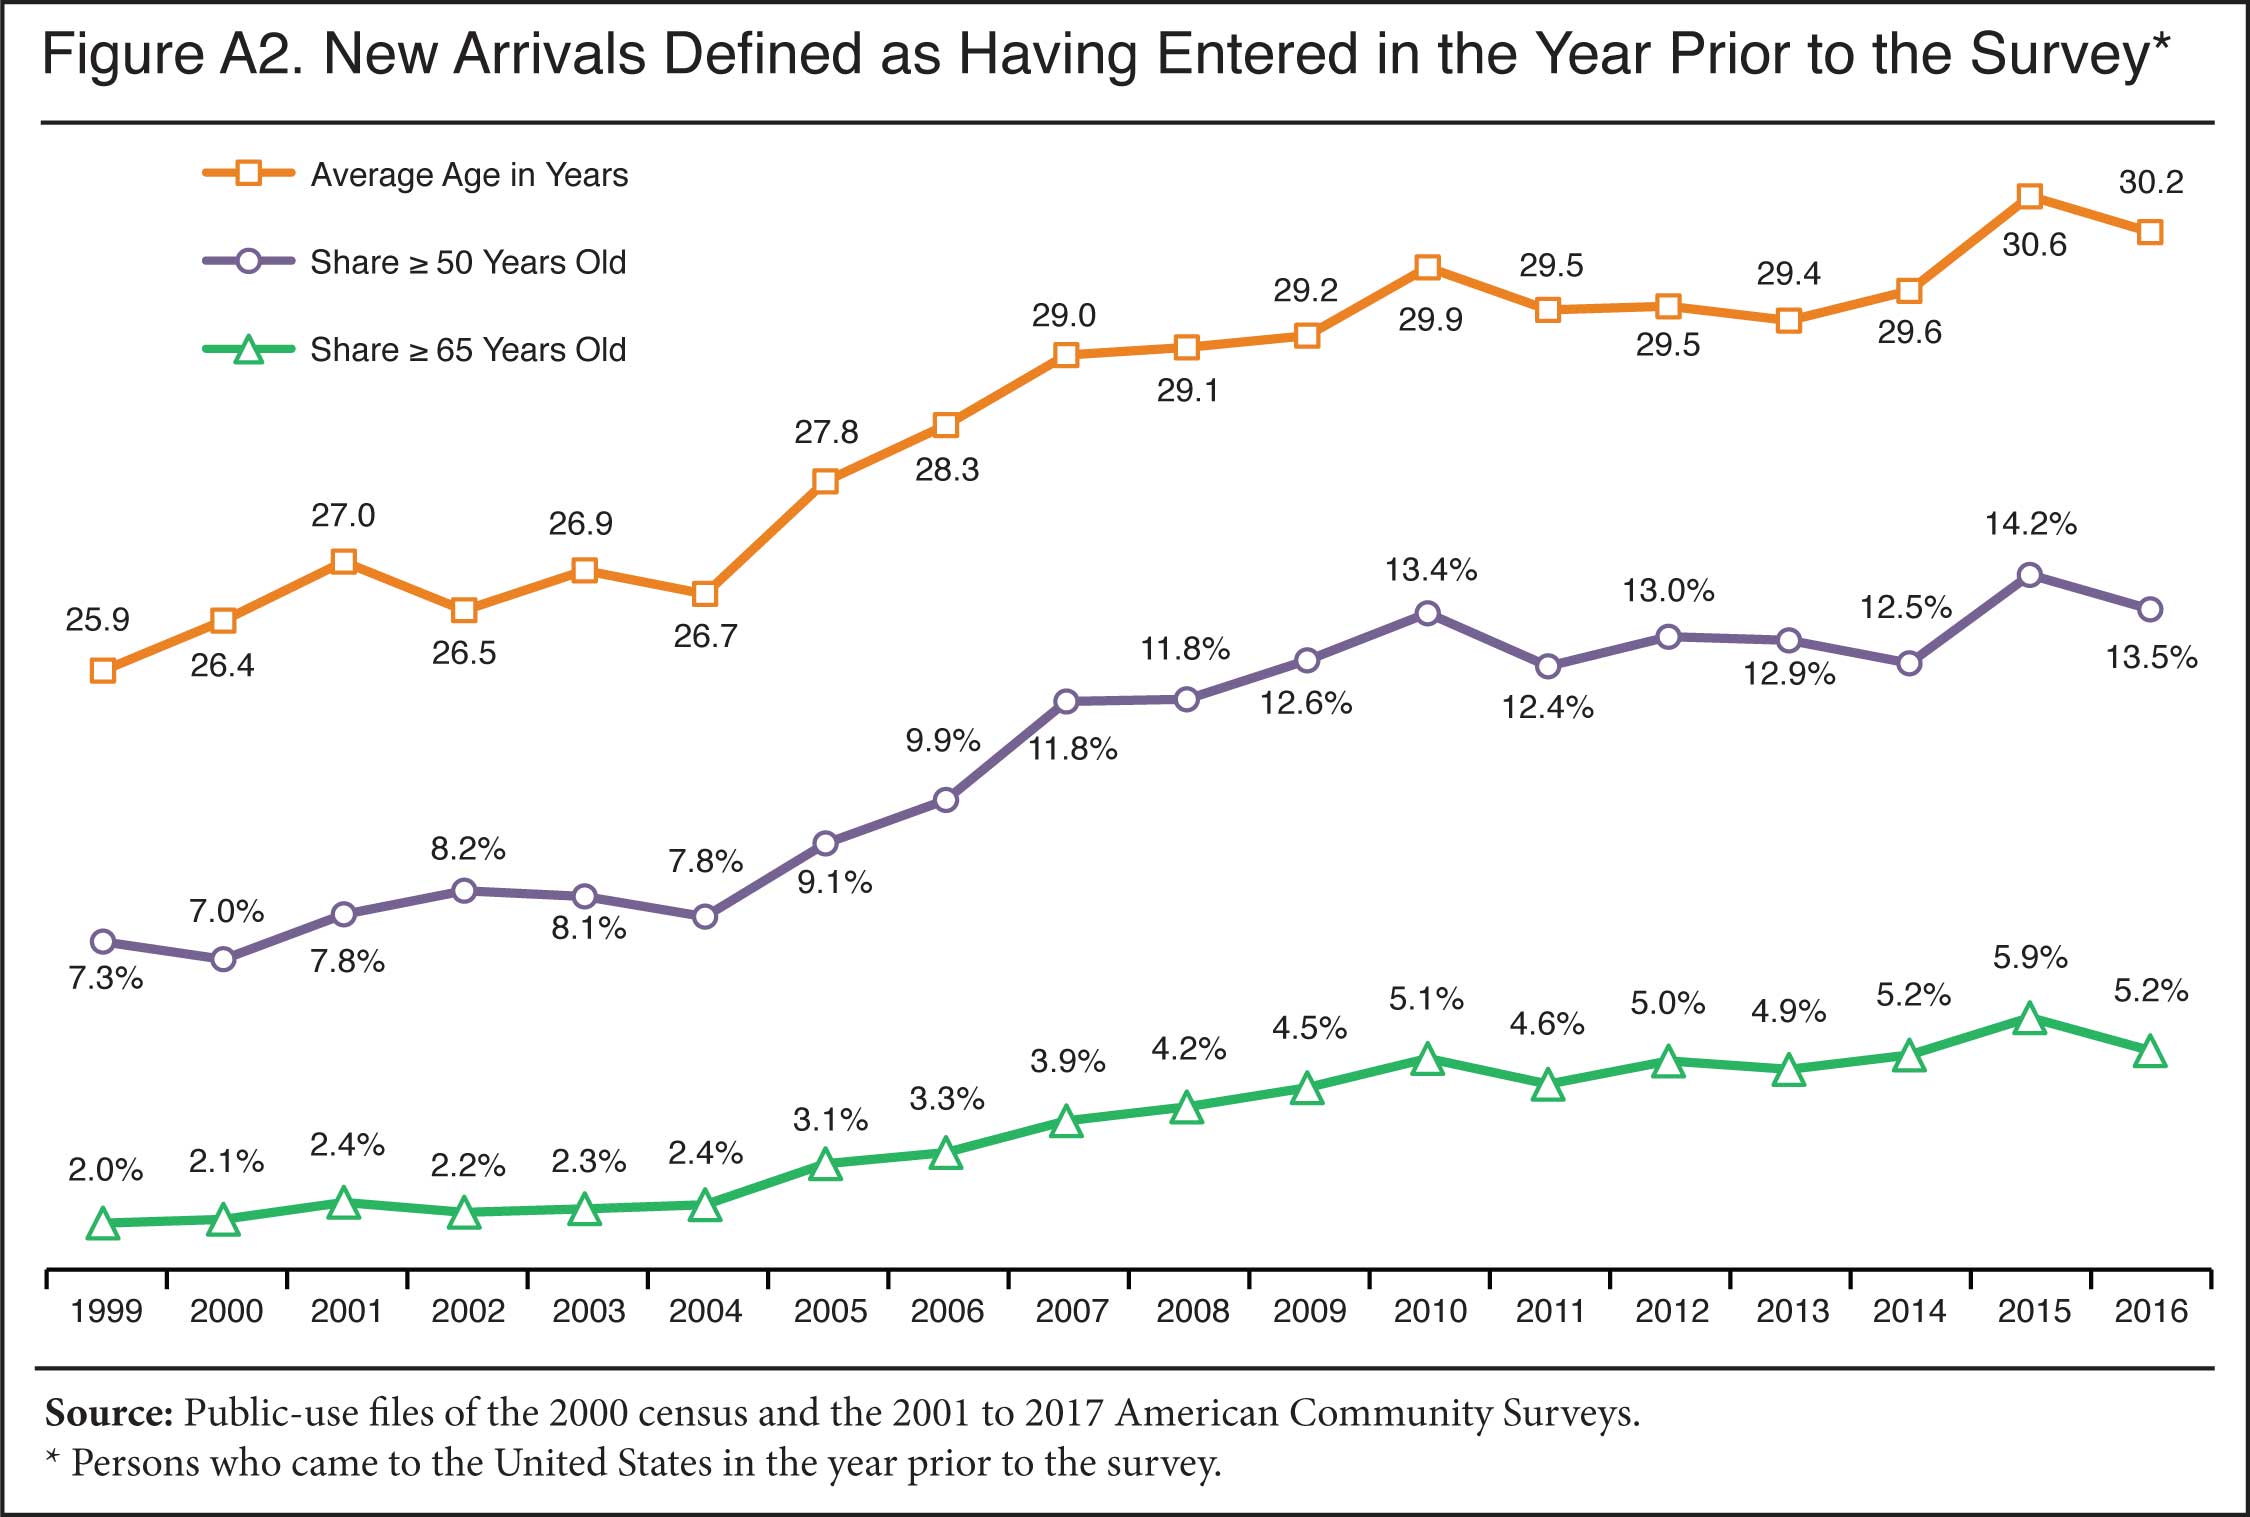
3 Figure A1 in the appendix reports the average age, share 50 and older, and share 65 and older for only those who arrived in the same calendar year as the survey. So data for 2017 in Figure A1 represents new immigrants who came to the United States January 1 to July 1, 2017, data for 2016 represents those who came in the first half of that year, and so on. Figure A1 shows basically the same trends as Figure 1, though the rise in age for new arrivals is somewhat more pronounced than in Figure 1. However, defining new arrivals this way has the disadvantage of not representing a full year of arrival data. It also means the sample size is much smaller than when new arrivals are defined as having come in the prior 1.5 years, making for less robust estimates. Figure A2 shows age at arrival when new arrivals are defined as having come in the calendar year prior to the survey, so the percentages for 2016 are from the 2017 ACS and those for 2015 are from the 2016 ACS and so on. Those who arrived in the first half of year in which the survey took place are excluded in Figure A2. Like Figure A1, Figure A2 shows the same basic pattern as found elsewhere in this report: New immigrants are coming to America at older ages. Defining new arrivals as having come in the prior calendar year does allow us to examine one year at a time, but no figures are possible for 2017 because there is only half a year of data available for that year. Also, the sample size is one-third smaller than when we define new arrivals as those in the country for 1.5 years. For these reasons, we define new immigrants as having come to the United States in the year of the survey or the prior year throughout this report. But as Figures A1 and A2 make clear, defining new arrivals differently does not change our findings — immigrants are coming to America at older ages.
4 As already indicated, in this analysis new arrivals are defined as having lived in the country for 1.5 years or less at the time of the survey or 2000 census. The figures reported in Figure 5 reflect the number of new arrivals divided by 1.5 to provide an annualized level of new immigration.
5 Regions are defined in the following manner: East Asia: China (including Hong Kong and Taiwan), Japan, Korea, Cambodia, Indonesia, Laos, Malaysia, Myanmar, Philippines, Singapore, Thailand, Vietnam, Other South Eastern Asia, Other Eastern Asia, Asia n.e.c. South Asia: Bangladesh, India, Nepal, Pakistan, Sri Lanka. Caribbean: Bahamas, Barbados, Cuba, Dominica, Dominican Republic, Grenada, Haiti, Jamaica, St. Vincent and the Grenadines, Trinidad and Tobago, West Indies, Other Caribbean, Other Northern America. Central America: Belize, Costa Rica, El Salvador, Guatemala, Honduras, Nicaragua, Panama, Other Central America. South America: Argentina, Bolivia, Brazil, Chile, Colombia, Ecuador, Guyana, Peru, Uruguay, Venezuela, Other South America. Middle East: Afghanistan, Iran, Kazakhstan, Uzbekistan, Iraq, Israel, Jordan, Kuwait, Lebanon, Saudi Arabia, Syria, Yemen, Turkey, Egypt, Morocco, Sudan, Other Northern Africa, Other South Central Asia, Other Western Asia. Europe: United Kingdom, Ireland, Denmark, Norway, Sweden, Other Northern Europe, Austria, Belgium, France, Germany, Netherlands, Switzerland, Other Western Europe, Greece, Italy, Portugal, Spain, Albania, Belarus, Bulgaria, Croatia, Czech Republic, Slovakia, Hungary, Latvia, Lithuania, Macedonia, Moldova, Poland, Romania, Russia, Ukraine, Bosnia and Herzegovina, Serbia, Armenia, Other Southern Europe, Other Eastern Europe, Europe, n.e.c. Sub-Saharan Africa: Eritrea, Ethiopia, Kenya, Somalia, Other Eastern Africa, Cameroon, South Africa, Other Southern Africa, Cape Verde, Ghana, Liberia, Nigeria, Sierra Leone, Other Western Africa, Other Middle Africa, Africa n.e.c. Oceania/Elsewhere: Australia, Oceania, Pacific Islands, Fiji, and elsewhere.
6 As a 2015 UN report documenting the dramatic increase in older populations and projecting their continual growth around the world observed, "The world's population is ageing: virtually every country in the world is experiencing growth in the number and proportion of older persons in their population." See "World Population Ageing 2015", United Nations, Department of Economic and Social Affairs, Population Division, 2015. Between 2013 and 2017, 72 percent of new arrivals came from South Asia, East Asia or Latin America. See Table 1 in "Immigration Continues to Surge: A look at arrival data from the American Community Survey", Center for Immigration Studies Backgrounder, October 31, 2018.
7 See Table 20 in the 2017 Yearbook of Immigration Statistics.
8 Figures are based on the 2000 census and 2017 American Community Survey.
9 If a person arrived as a child and has now reached adulthood, the whole family, including the parents, would typically have gotten green cards together so there would be no need for the adult child to sponsor the parents. Though there are exceptions, if a person is sponsoring a parent they almost always came as adults themselves, naturalized, and then would sponsor parents overseas. This process takes time and as a result parents almost always arrive later in life.
10 The federal government's latest estimate is for January 2015 and shows 11.96 million illegal immigrants in the country — with a growth of 500,000 since 2014. The Pew Research Center estimates 10.7 million in 2016 —with a 300,000 decline since 2015. The Center for Migration Studies (CMS) estimates 10.79 million in 2016 — with a 250,000 decline since 2015. See Bryan Baker, "Estimates of the Illegal Alien Population Residing in the United States: January 2015", Department of Homeland Security, December 2018; Jeffrey S. Passel and D'Vera Cohn, "As Mexican share declined, U.S. unauthorized immigrant population fell in 2015 below recession level", Pew Research Center, April 25, 2017; and Robert Warren, "The US Undocumented Population Fell Sharply During the Obama Era: Estimates for 2016", Center for Migration Studies, February 22, 2018.
11 See end note 1.
12 It should be noted that, although there were 7.6 million immigrants who arrived in the prior five years in both 2000 and 2017, they were 2.7 percent of the population in 2000, compared to 2.3 percent in 2017. This means that part of the reason that the effect was smaller in 2017 is that the newcomers were a smaller fraction of the total population. However, if we re-weight the data and assume that those who came in the five years prior to 2017 were also 2.7 percent of the population and still had the same age distribution, then the new immigrants would have reduced the average age by 0.2 years, still less than the 0.24 years in 2000. The reason for this is that the average age of new immigrants was significantly higher in 2017, so their effect is smaller even if they had been the same share of the overall population as in 2000.
13 See p. 329 in The Economic and Fiscal Consequences of Immigration, Francine D. Blau and Christopher Mackie, Eds., Washington, D.C.: National Academies of Sciences, Engineering, and Medicine, 2017.
14 Table 8-12 (p. 430) in the 2017 National Academies' online version of its report, which can be downloaded here, presents the key findings. The shaded row at the bottom of each fiscal scenario in the table shows the net fiscal impact for each age group not controlling for education level. The results on the left of the table are the net fiscal impacts for immigrants plus their dependents, while the results in the center of the table report the net impact on public coffers for only the original immigrant. It should be noted that those who arrived after age 64 are assumed to have no U.S.-born descendants in the United States.
15 The public-use files of the Census Bureau's Annual Social and Economic Supplement to the Current Population Survey show that in 2017, of immigrants who arrived after 2006 and were 65 and older, 10 percent were on SSI compared to 2 percent of natives 65 and older.
16 Table A4 in the appendix shows in detail the shares of immigrants and natives who are working-age and in older age groups. Table A5 shows the number of immigrants who are working-age and in older age groups. In Table A5, the number of natives 65 and older drops between 2000 to 2001 and stays lower until 2006. The reason for this is that the ACS did not include those in institutions, which includes nursing homes, until 2006. This impacts the total for natives 65-plus in the table. It has a much smaller impact on immigrants in this age group because a smaller share of immigrants live in institutions. In terms of the recent arrivals in this report, very few recent immigrants are in institutions so the addition of the institutionalized in 2006 makes very little difference to our findings. Further, the 2000 census did include the institutionalized so the data from 2000 and from 2006 to 2017 reported in the figures in this report all include those in nursing homes.
17 Steven A. Camarota and Karen Zeigler, "Projecting the Impact of Immigration on the U.S. Population: A look at size and age structure through 2060", Center for Immigration Studies Backgrounder, February 4, 2019.