Download a PDF of this Backgrounder.
Steven A. Camarota is the director of research and Karen Zeigler is a demographer at the Center.
This analysis uses 2017 as a starting point and then replicates the Census Bureau's latest population projections. We then vary the immigration component, something the Bureau does not do, and report its impact on the future size and age composition of the U.S. population. While the Bureau foresees a lower level of future immigration than in its prior estimates, the projections still show that immigration (legal and illegal) will add enormously to the U.S. population.1 This analysis shows that, like prior projections, immigration only modestly increases the share of the population that is of working age.
Among the findings:
- The Census Bureau projects that future net immigration (the difference between the number coming and number leaving) will total 46 million by 2060 and the total U.S. population will reach 404 million — 79 million larger than in 2017.
- Varying the immigration component shows that net immigration will add 75 million to the population, accounting for 95 percent of the increase by 2060.
- Zero net immigration in the future is unlikely, but we can gain insight into immigration's impact by comparing the level projected by the Census Bureau to what would happen if immigration was reduced by two-thirds, which would roughly stabilize the U.S. population after 2040 — henceforth referred to as the "stabilization scenario".
- Under a stabilization scenario, net immigration would total 16 million by 2060 (370,000 annually) producing a population of 354 million in 2060 — 50 million less than currently projected by the Bureau — but 29 million larger than in 2017.
- Many argue that without immigration there will not be enough workers to support the government or economy. Yet these projections indicate that in 2060, 59 percent of the population will be of working-age (16-64) compared to a quite similar 58 percent under the stabilization scenario.
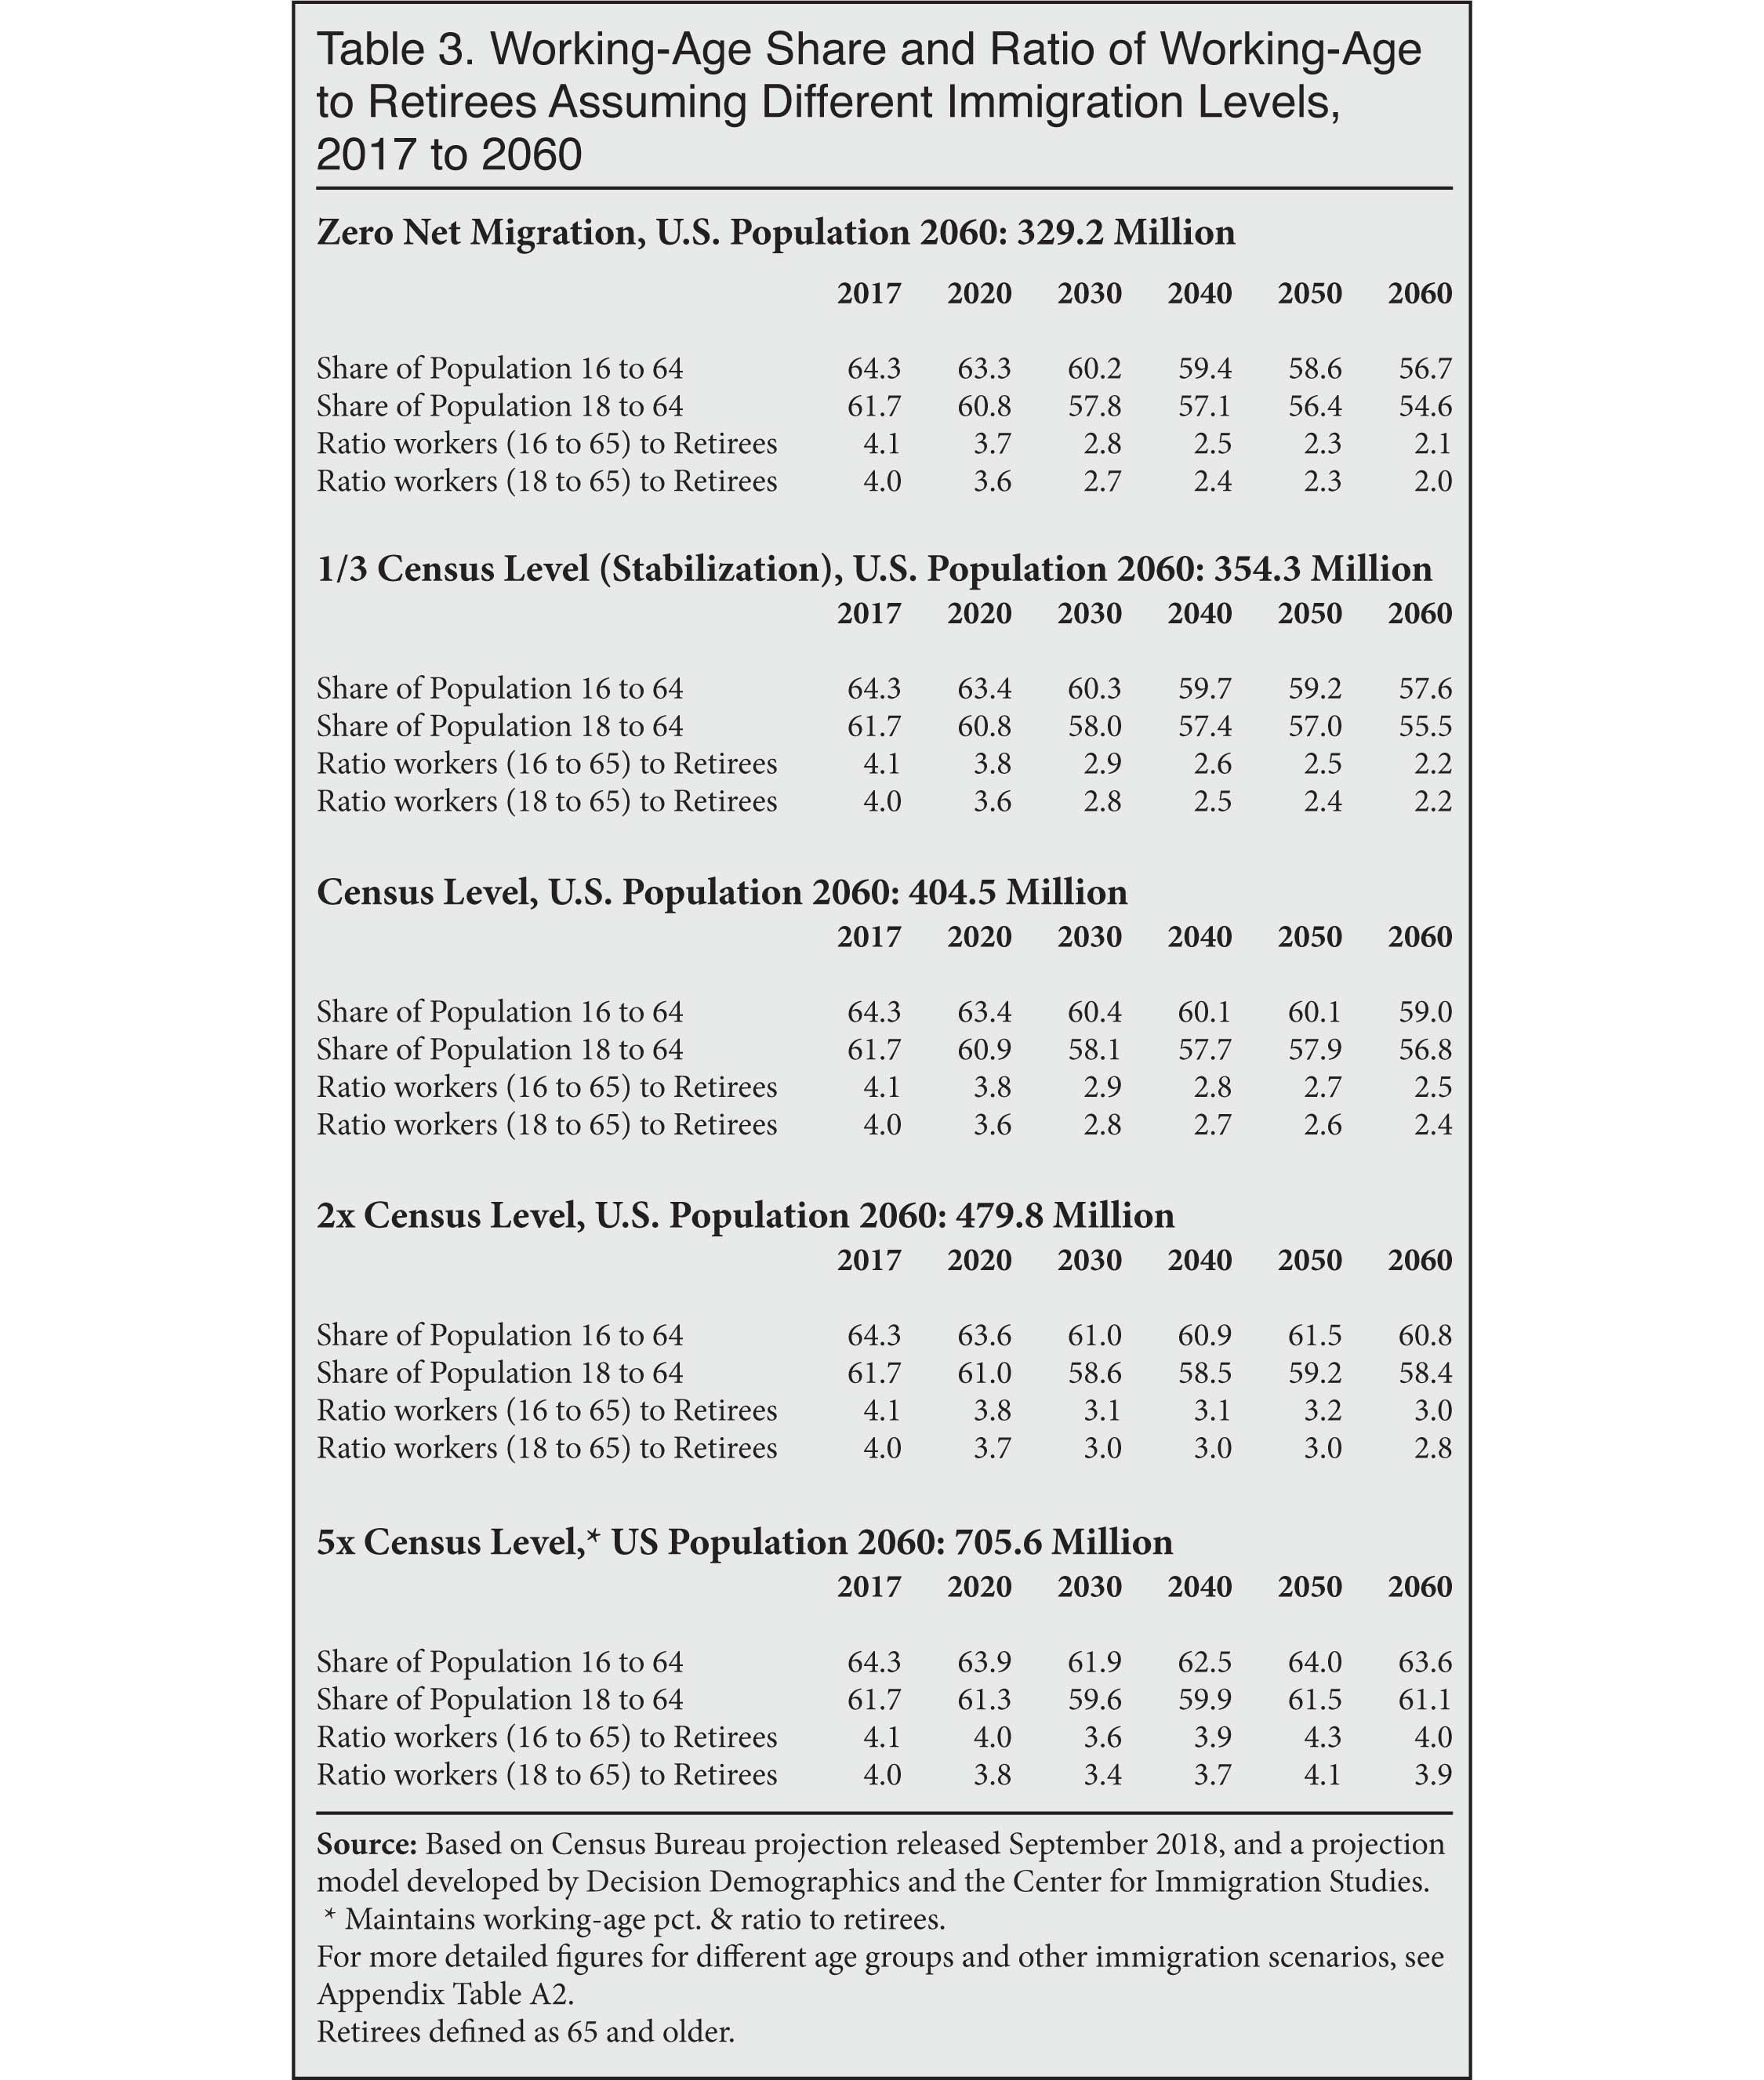
- Looking at the ratio of potential workers (ages 16 to 64) relative to those of retirement age (65-plus) also shows the modest impact of immigration. Under the stabilization scenario there will be 2.2 workers per retiree compared to 2.5 workers assuming the Census Bureau's level of immigration.
- It is possible for immigration to maintain the current working-age share or ratio of workers to retirees, but it would roughly require net immigration five times the level projected by the Census Bureau through 2060. This would create a total population of 706 million in 2060 — more than double the current population.
- Alternately, raising the retirement age two years, even assuming zero net immigration, has about the same impact on the working-age share or ratio of workers to retirees in 2060 as the level of net immigration projected by the Census Bureau.
- Another way to deal with the decline in the working-age population is to increase the share of working-age people who are actually employed — referred to as the employment rate. At present, the employment rate for those 16 to 64 is 70 percent, low by historic standards. Increasing the employment rate to 75 percent would have the same impact on the share of the population who are workers as would the immigration level projected by the Census Bureau.
Introduction
Steven A. Camarota Explains Report at Panel Discussion.
Immigration is a public policy that impacts a receiving society perhaps more than any other. Its impact on the future size of a nation's population is only the most obvious. Moreover, because immigrants tend to arrive at relatively young ages and have larger families on average than the native-born, it should have a positive impact on the nation's age structure. But how big is the effect? By varying the level of immigration in the Census Bureau's most recent projection, this analysis explores the impact of immigration on both the size and age structure of the U.S. population.
Based on the level of immigration the Census Bureau expects, the U.S. population will be 79 million people larger in 2060 than in 2017 (or about 96 million larger than at the time of the last census in 2010). Without any net immigration, the population would be nearly four million larger in 2060 than it is today. While the immigration level projected by the Bureau adds significantly to the future size of the U.S. population, as we will see, the ability of immigration to positively impact the age structure is more limited.
The Methodology Appendix at the end of the report explains in detail how these projections were created. In short, we first replicated the newest Census Bureau projections, released in March 2018 and then re-released in September 2018 due to an error by the Census Bureau in their first set of projections.2 Our projections are based on the revised projections released in September. The revised projections, like those released in March, used 2016 as a starting date. In this analysis we update the start date to 2017. Unfortunately, we cannot exactly replicate the Census Bureau's newest projections because not all of the information that goes into the new projections has been released to the public at the time of this publication. However, what has been released allows us to nearly match the size and composition of the U.S. population foreseen by the Bureau in 2060. We then vary the level of immigration the Census Bureau projects and report the impact.
Throughout this report we refer to the "Census Bureau immigration level" or "Census immigration" to mean the level of immigration the Bureau used in its newest projection, about 1.1 million per year. We also compare that level throughout this report to several different levels using the Census immigration level as a baseline. In particular, we focus on what we refer to as the "stabilization scenario", which is the level of immigration that would roughly lead to stabilization in the U.S. population after 2040. The stabilization scenario is equal to one-third of the level of future immigration projected by the Census Bureau, or about 370,000 net immigrants a year. In several places in the report, we also provide figures and discuss the level of immigration that would be necessary to roughly maintain the percentage of the population that is working-age through 2060. This is the "working-age maintenance scenario" and is five times the level foreseen by the Bureau, or net immigration of 232 million by 2060, or about 5.5 million per year. In this analysis, only immigration is varied; the fertility and mortality assumptions follow the Census Bureau's most recent set of projections. We also do not vary the composition of immigrants arriving; we simply assume the same age, gender, race, and ethnic composition as the Census Bureau.
Immigration and Population Growth
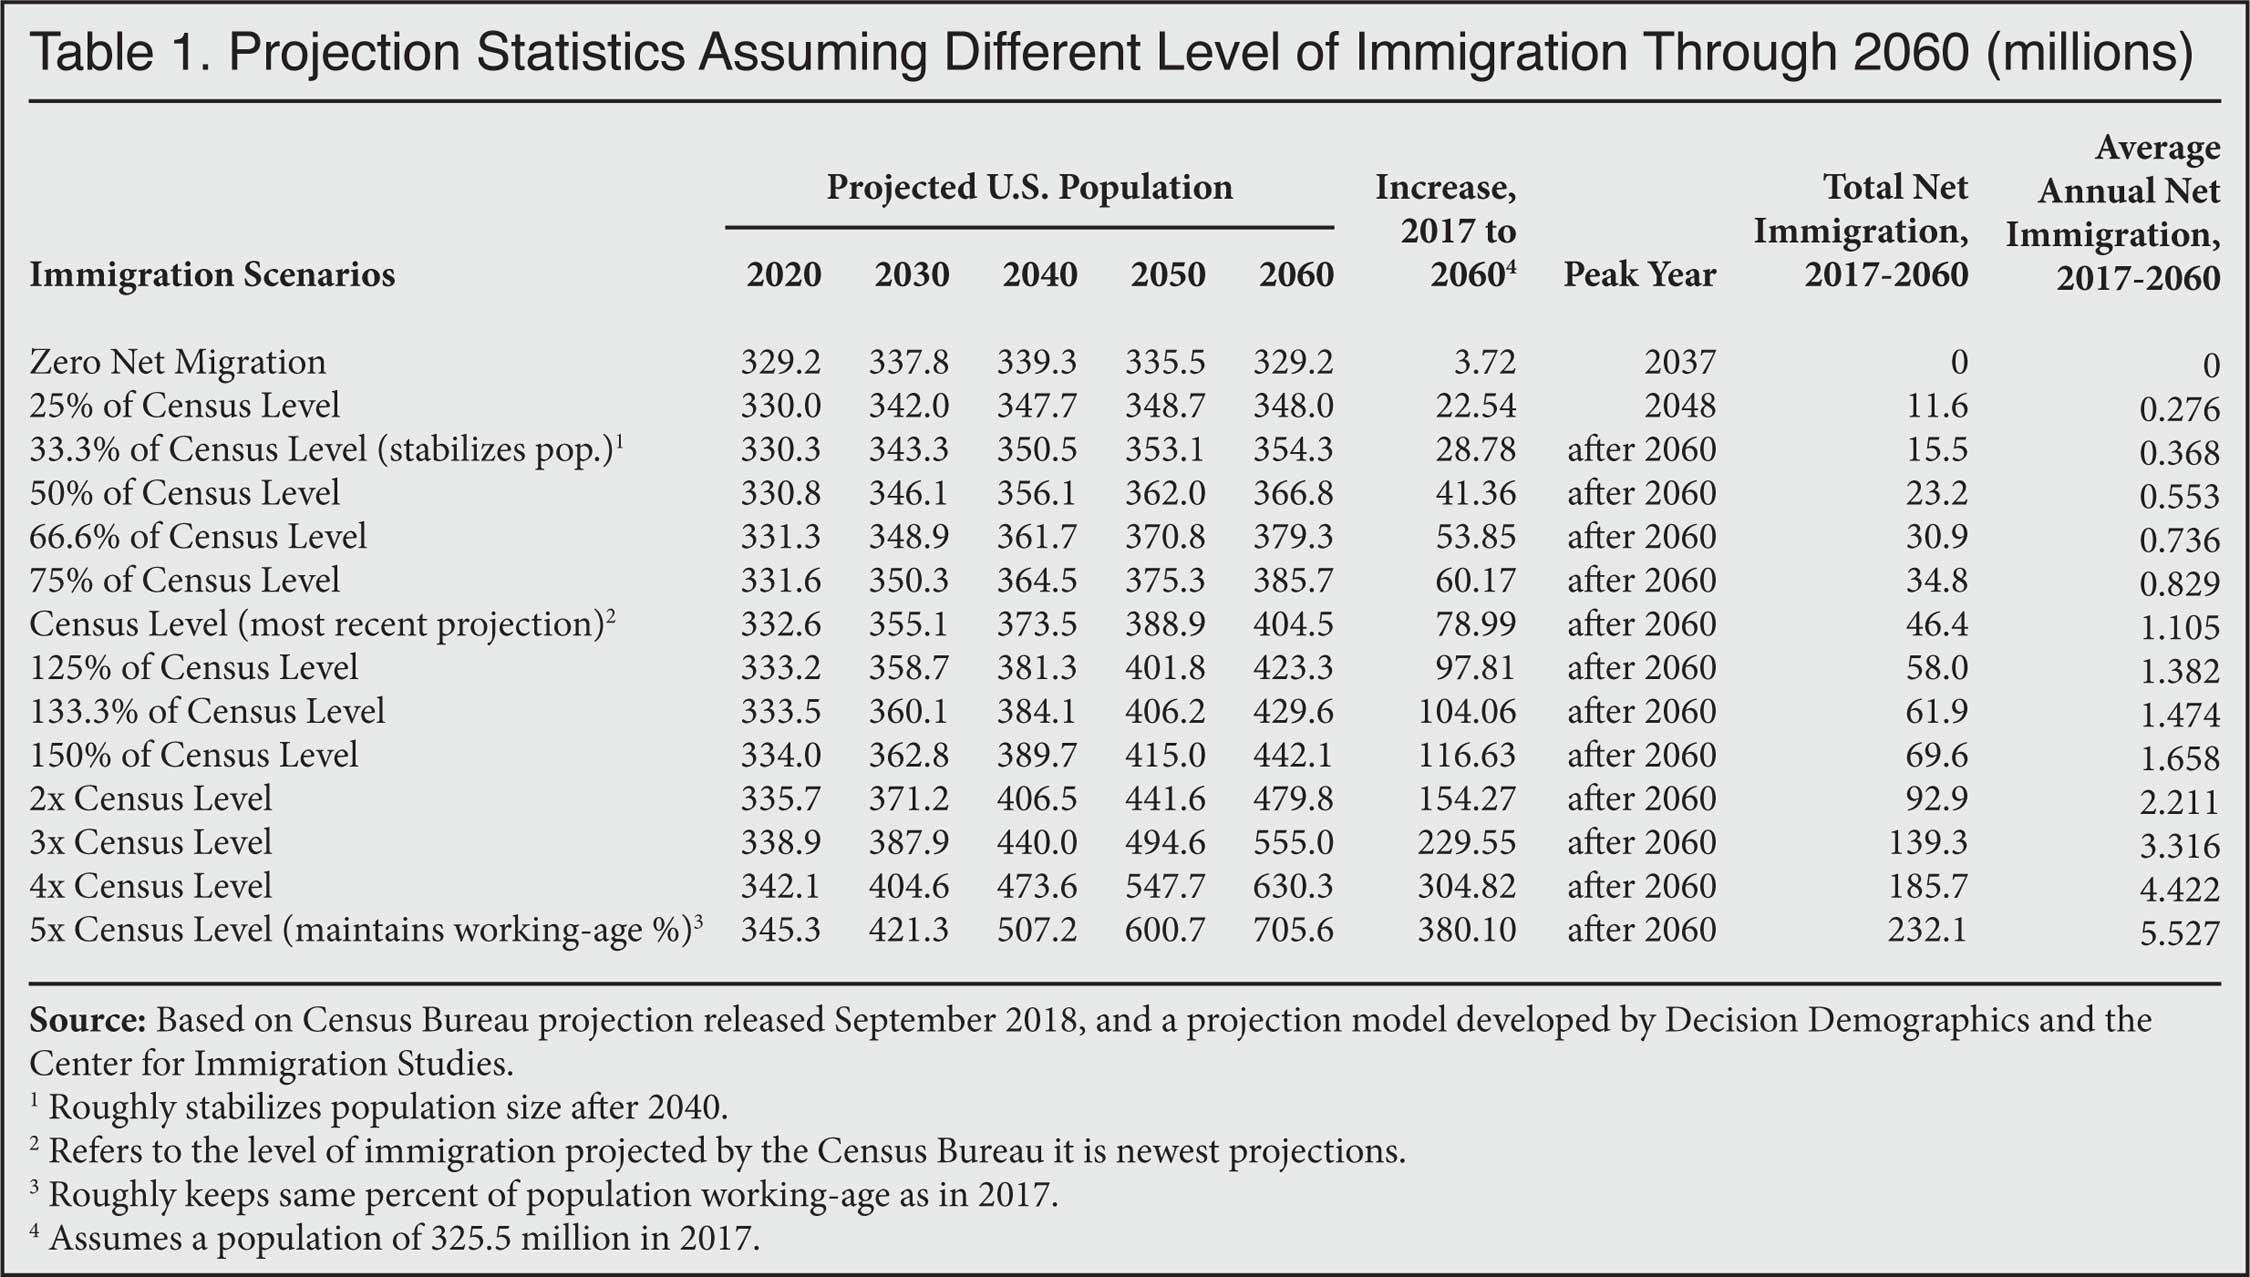
Varying the Level of Immigration. Table 1 reports the size of the U.S. population from 2017 to 2060 under different immigration scenarios using the newest projections from the Census Bureau as a baseline. The table also reports several summary statistics. Figure 1 shows the total U.S. population under a limited number of immigration scenarios graphically. The table and figure show the large impact that immigration will have on population growth in the United States over the next four decades. If immigration unfolds as the Census Bureau expects, the nation's population will increase from 325.5 million in 2017 to 404.5 million in 2060 — a 79 million (24 percent) increase in just four decades. As the table shows, the Census Bureau projects net immigration to total 46.4 million by 2060. If there were no net immigration, the U.S. population would still be 3.7 million larger in 2060 than it is today. In short, 75.3 million, about 95 percent, of the increase in the U.S. population by 2060 will be due to future immigration. That is, immigrants who have not yet arrived but will do so absent a change in policy, plus the children and grandchildren they will have once here, account for most population growth over the next four decades.
|
|
|
|

The alternative immigration scenarios in Table 1 and Figure 1 show that varying immigration does have a large impact on the future size of the U.S. population. To be sure, even if there was a substantial reduction in the level of immigration from what the Census Bureau expects, there would still be significant population growth. The stabilization scenario, for example, shows a U.S. population of nearly 351 million in 2040 and 354.3 million in 2060. The 2060 figure under this scenario is 50.2 million fewer than what is currently projected by the Bureau — but still 28.8 million larger than the current population. As Table 1 reports, under the stabilization scenario net migration from 2017 to 2060 would still total 15.5 million. This equals about 370,000 annually. While significantly less than the number the Census Bureau thinks will arrive, the stabilization scenario still represents a substantial level of net immigration.
Alternately, increasing immigration significantly above the level foreseen by the Census adds enormously to the U.S. population. For example, increasing immigration above the Census level by one-third makes for a population 104 million larger than it is today. Doubling their immigration projection produces a population more than 154 million larger than in 2017. Increasing immigration further, Table 1 reports what we refer to as the work-age stabilization scenario. This is the level necessary to roughly maintain the same working-age share of the population in 2060 as in 2017. We will discuss this scenario in greater detail in the context of the aging of the U.S. population. But at this point it is enough to note that it is possible to roughly maintain the working-age share of the population using immigration, but it would require net immigration of 232.1 million by 2060 — five times the level projected by the Census Bureau. Immigration in the working-age preservation scenario would create a population of nearly 706 million in 2060 — far more than double the current population.
Foreign-Born Share. Table 2 shows the growth in the immigrant or foreign-born population under different immigration scenarios. The table shows only the number of immigrants under each scenario, not the full impact of immigration, as their U.S.-born descendants are not included. The foreign-born are individuals who were not U.S.-citizens at birth, including illegal immigrants and legal immigrants. The table shows that if immigration unfolds as the Census Bureau expects, the nation's foreign-born population will increase from 44.6 million in 2017 to 69.3 million in 2060 — a 56 percent increase. The rate of growth in the foreign-born population is projected to be more than twice the 24 percent increase in the overall population by 2060. As a share of the total population, immigrants will increase from 13.7 percent today to 17.1 percent if things unfold the way the Census Bureau projects. Table 2 also shows that different immigration scenarios produce very different foreign-born populations by 2060.
|
|
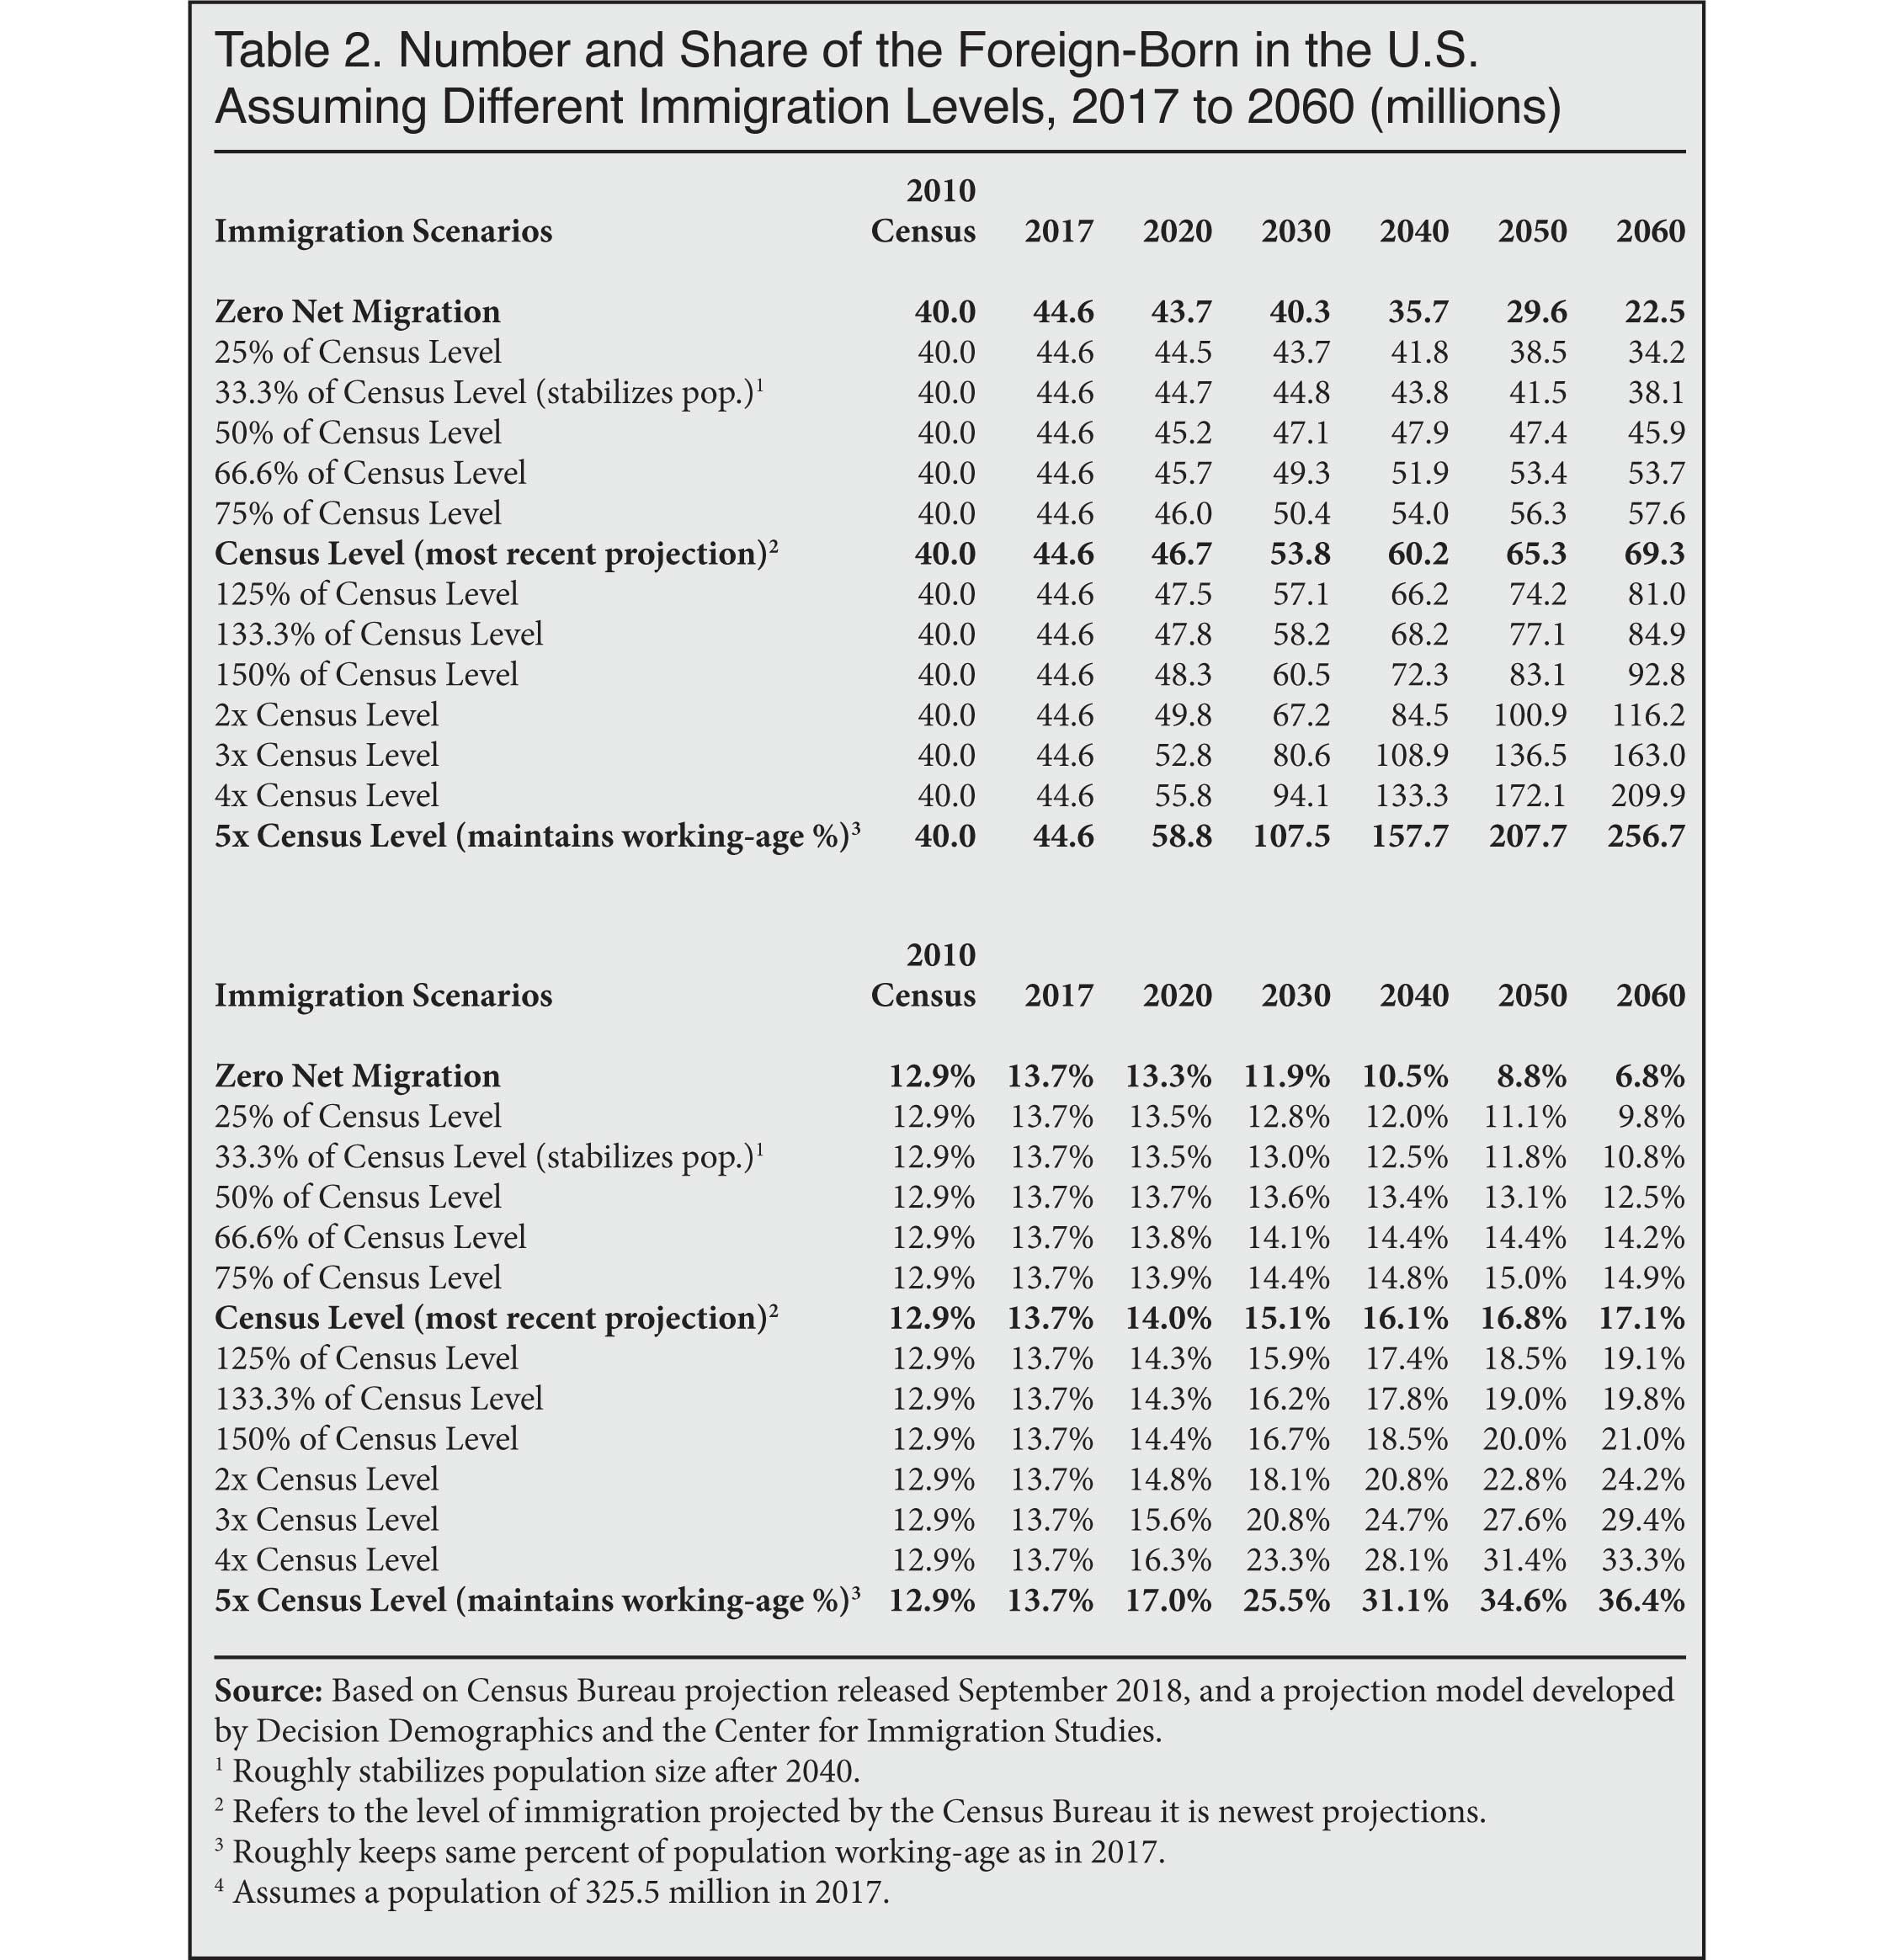
Under the Census Bureau's newest projections, the foreign-born population will hit a record share of the population in 2027 — 14.82 percent. This would be the highest percentage ever in American history.3 As is the case with the overall population, changing the level of immigration has a large impact on the future size of the immigrant population. For example, as Table 2 shows, immigrants will comprise 17.1 percent of the nation's population in 2060 under the Census Bureau's baseline projections, while under a stabilization scenario it would be 10.8 percent in the same year. Not surprisingly, the future level of immigration determines the future size of the immigrant or foreign-born population.
Impact on the Age Structure
Immigration and an Aging Society. By arriving in the United States, immigrants and their descendants impact not just the size of the U.S. population, but also its composition. One of the most important impacts on its composition is the nation's age structure. Many advocates of high levels of immigration argue for it partly on the grounds that societies like the United States, where fertility rates are low relative to historic levels, need immigration or there will not be enough workers to pay for government, particularly retirement programs, or to support the economy. The late Washington Post columnist Charles Krauthammer argued that America has been "saved by immigrants" from the kind of aging taking place in other first-world countries.4 Former Florida governor and presidential candidate Jeb Bush made the case in 2013 for immigration on the grounds that their youth and higher fertility are needed "to rebuild the demographic pyramid."5 Bush and Krauthammer are by no means alone; Olga Khazan made much the same argument in a 2014 Atlantic article, for instance.6 If immigration slows the aging of American society, the question remains: How large is the effect?
It is certainly true that immigrants often arrive in their 20s and have somewhat larger families than native-born Americans. However, this does not necessarily mean that they have a large impact on the nation's age structure in the way that some advocates imagine. By varying the level of immigration in the new Census Bureau Projections, we can gain insight into the actual impact of immigration on the age structure of the U.S. population.
Prior Research on Immigration and Aging. Studies of immigration and its impact on the age structure have generally shown immigration has only a modest impact. In an important 1992 article in Demography, the leading academic journal in the field, economist Carl Schmertmann explained that, mathematically, "constant inflows of immigrants, even at relatively young ages, do not necessarily rejuvenate low-fertility populations. In fact, immigration may even contribute to population aging."7 A UN study two decades ago also found that immigration alone cannot make up for population decline and aging in Western countries.8 The Census Bureau also concluded in projections done in 2000 that immigration is a "highly inefficient" means for increasing the percentage of the population that is of working-age in the long run.9 Our analysis of the newest projections from the Census Bureau confirms these findings.
The Working-Age Population. One of the most common statistics used by demographers to measure the age structure, specifically as it relates to workers vs. non-workers, is the "dependence ratio". The dependence ratio is the number of people in the dependent population (those too young or too old to work) compared to those in their primary working years, often defined as 16 to 64. Demographers also often report the inverse of the dependency ratio because it is easier to understand. The inverse dependence ratio can be stated as either the percentage of the population that is of working-age or the number of workers relative to the dependent population.10
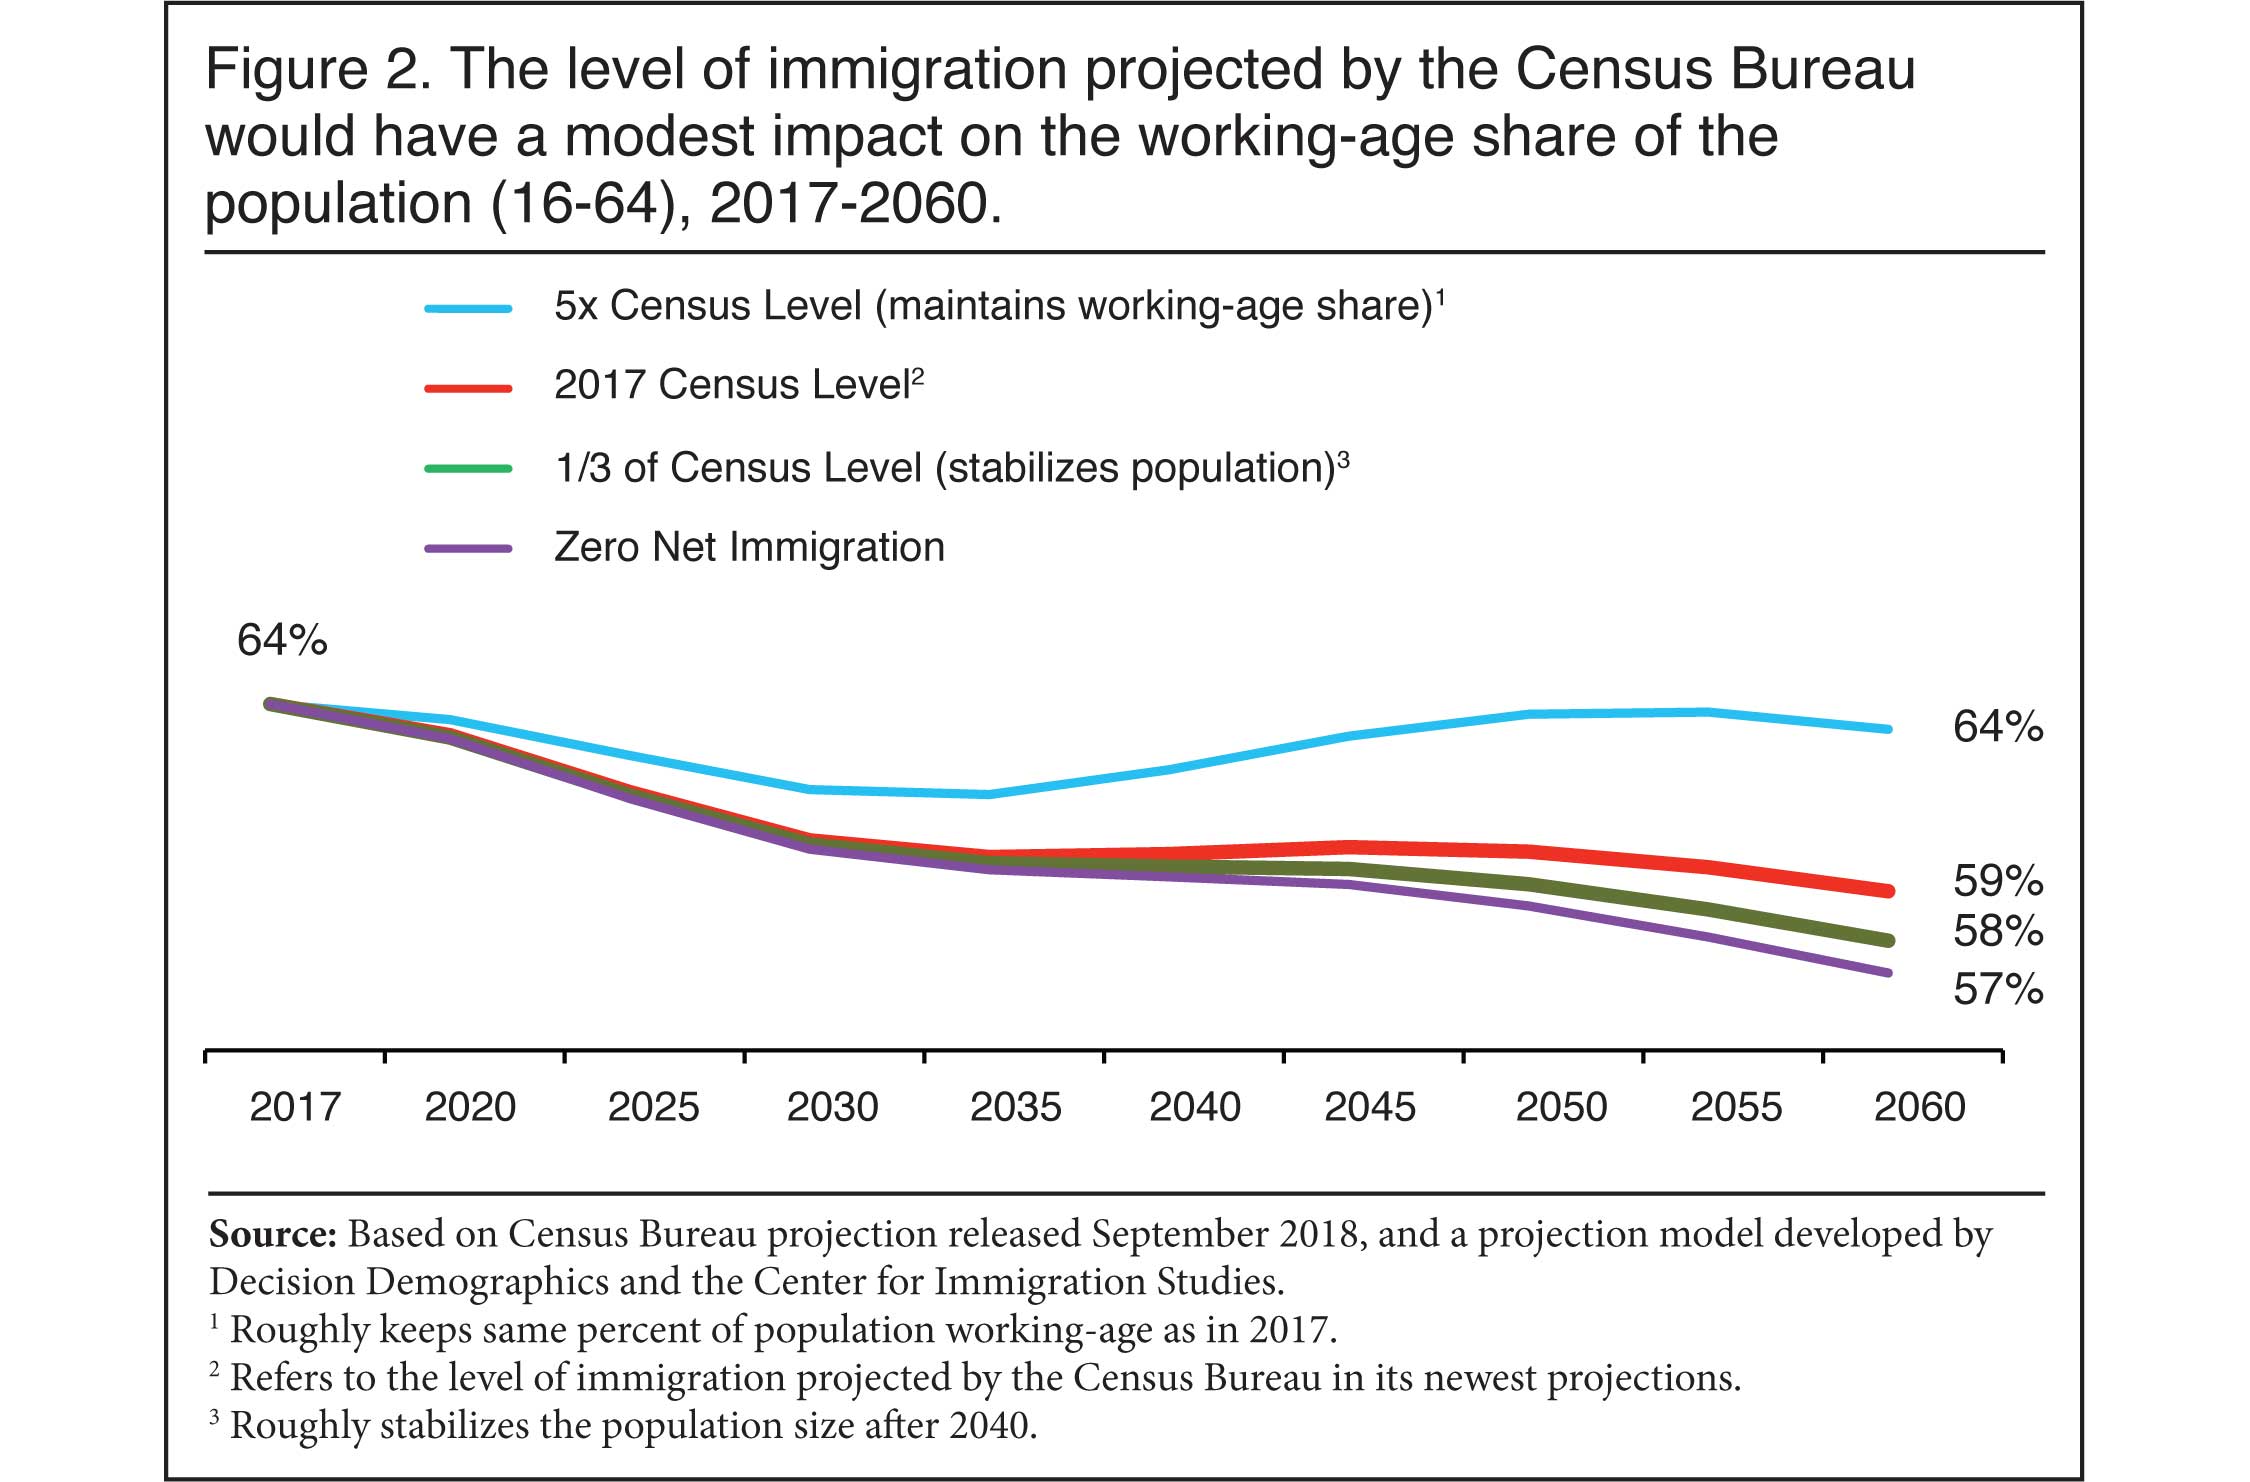
Table 3 reports the inverse of the dependence ratio as a percentage of the population who are of working age. The table uses 16 to 64 and 18 to 64 as the working age. Figure 2 shows some of the same information using 16 to 64 as the working age.11 Table 3 and Figure 2 show that if net immigration unfolds as the Census Bureau expects, 59 percent of the population will be of working age (16 to 64) in 2060. However, if immigration was reduced by two-thirds — the stabilization scenario — then 57.6 percent of the population would be of working age. Although reducing immigration by two-thirds would certainly be a significant change in policy, the impact on the share of the population that is of working-age would be modest. Turning to zero net immigration, Table 3 shows that even under that improbable scenario, the working-age share of the population would still be 56.7 percent — just 2.3 percentage points less than under the Census Bureau level of immigration. Put a different way, the 46.4 million immigrants the Bureau projects will arrive by 2060 only shift the working-age share of the population by roughly two percentage points. This means that the overwhelming share of the decline in the working-age share will occur with or without Census-level immigration.
|
|
|
|
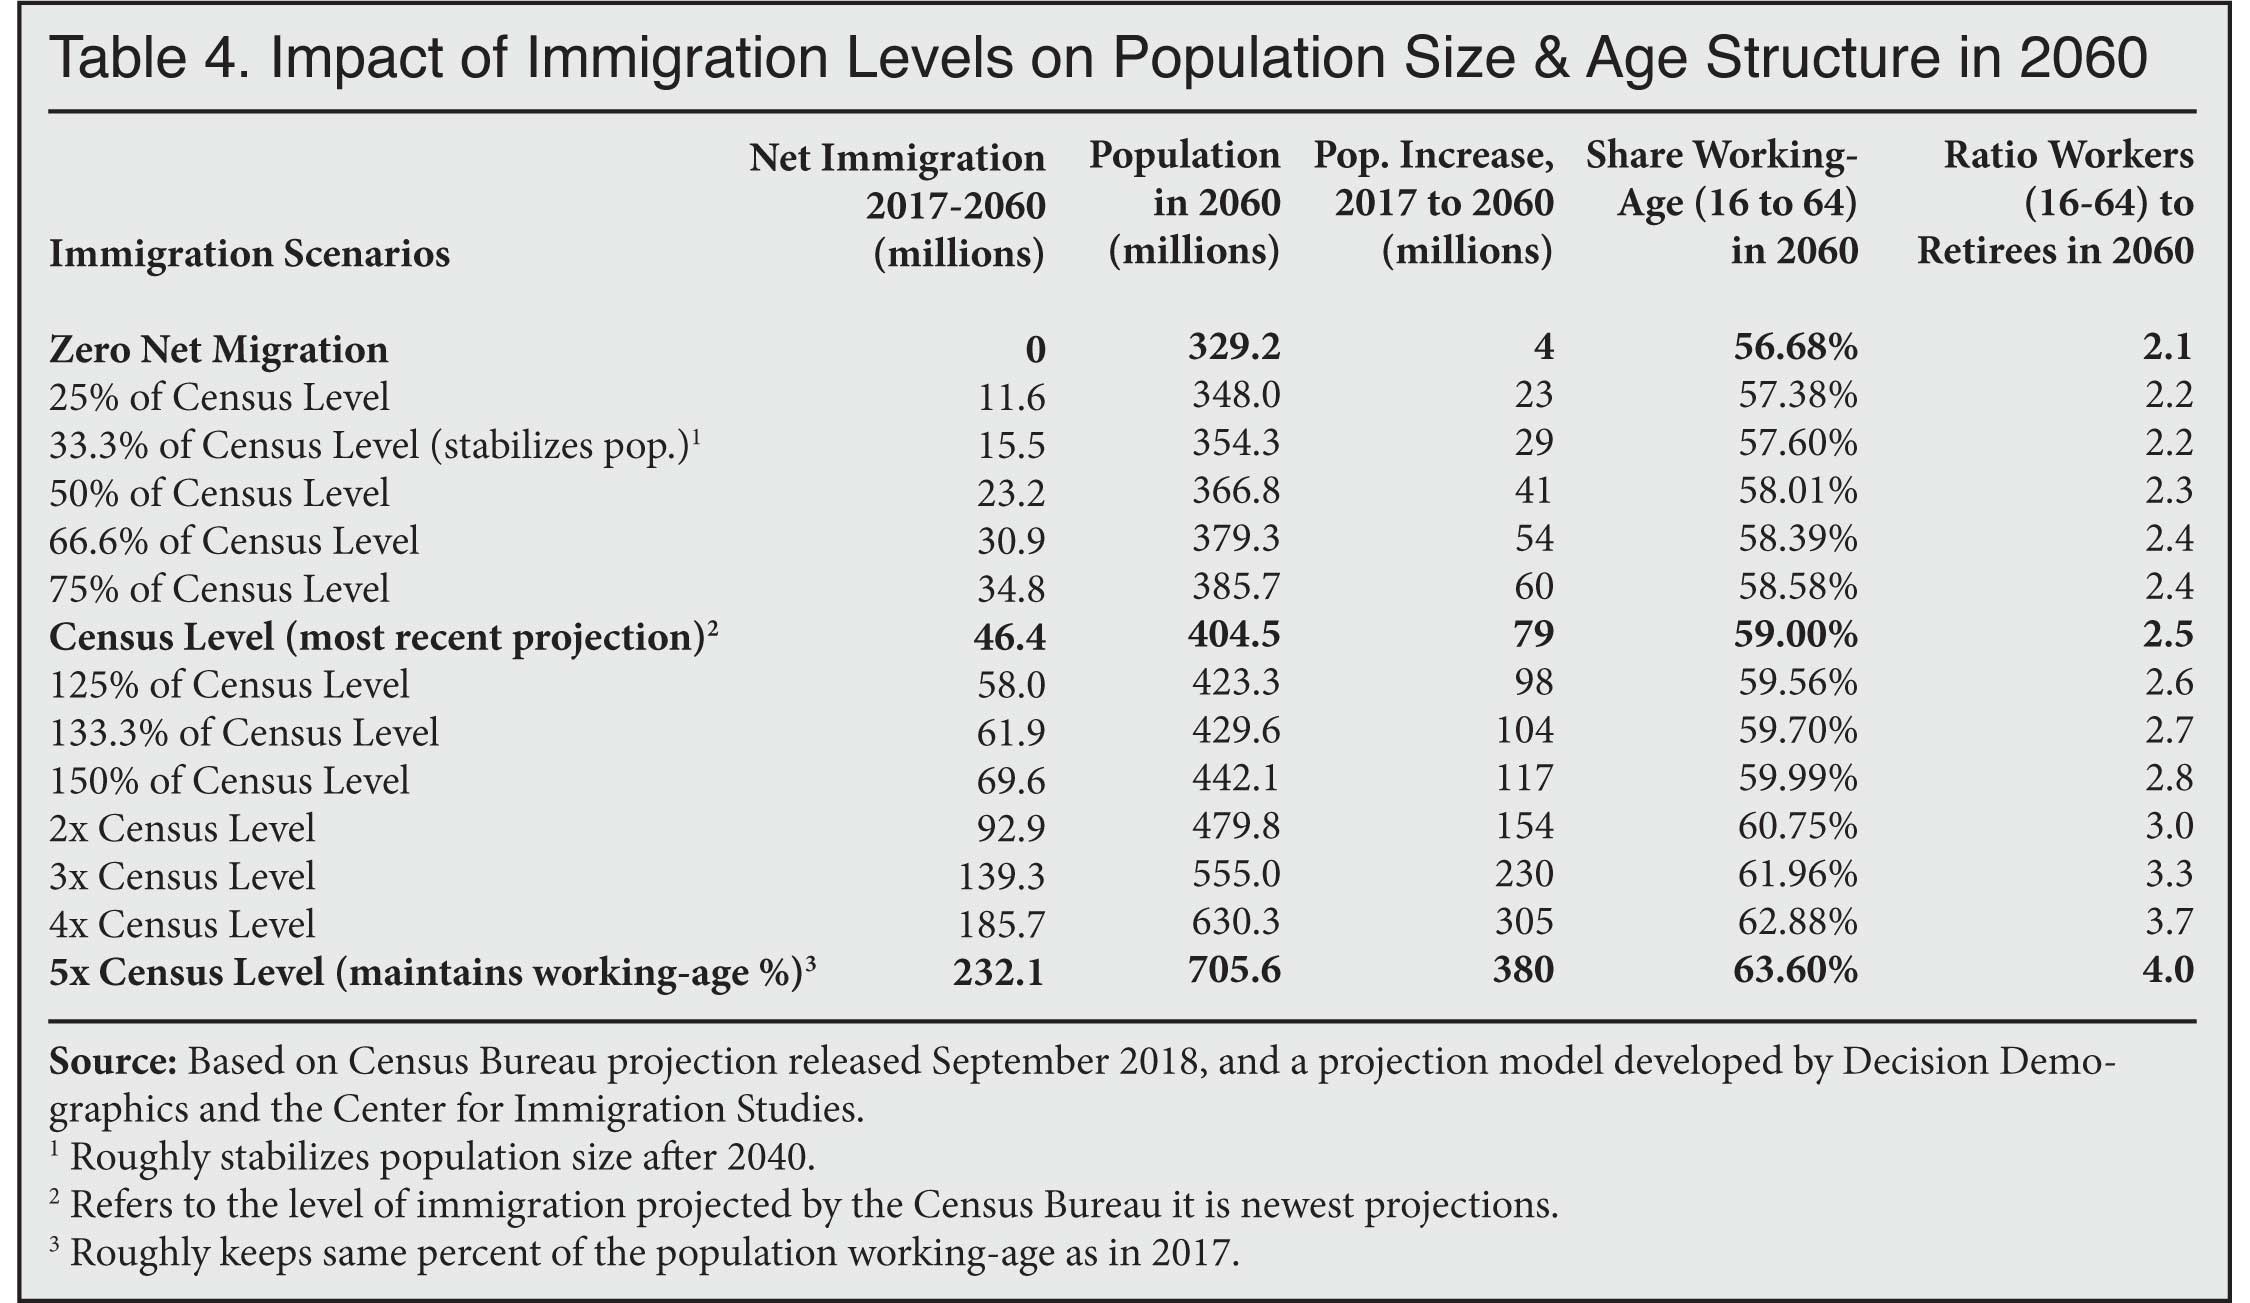
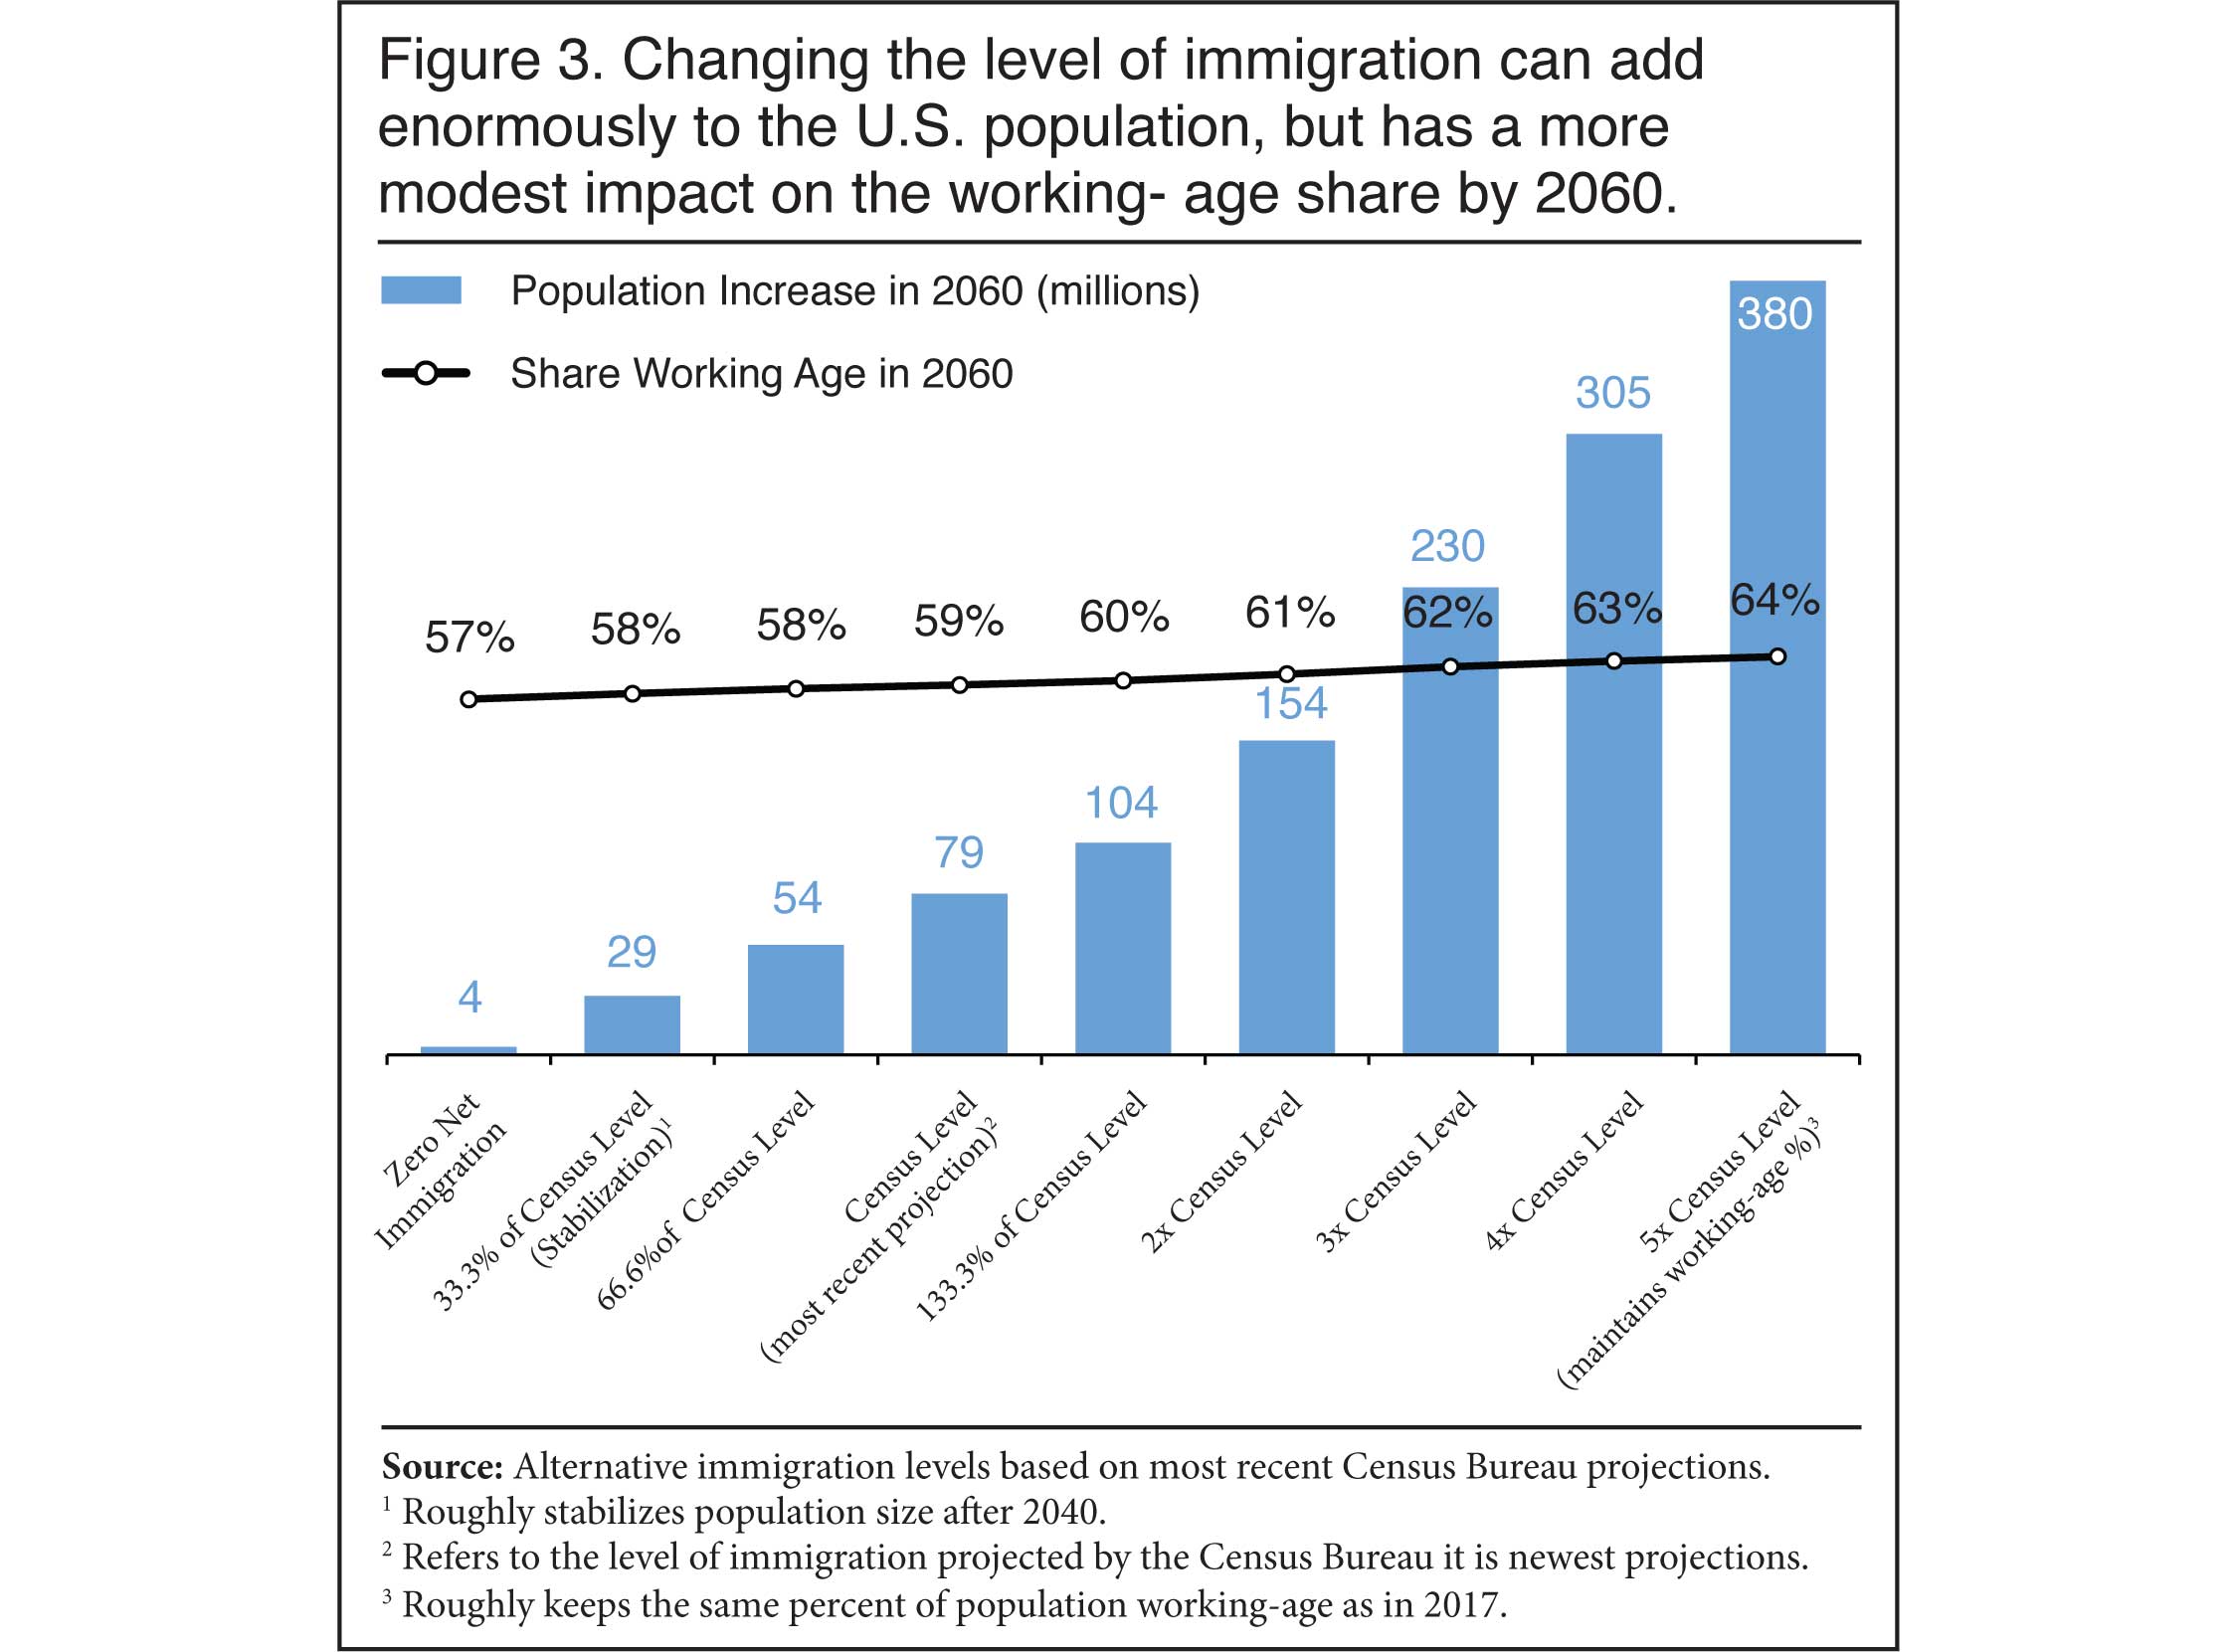
Stopping the Decline Entirely. It is mathematically possible to use immigration to maintain the working-age share of the population. But it would require a dramatic increase in new immigration, well above the level foreseen by the Census Bureau. Table 4 shows the increase in the U.S. population under different immigration scenarios and the resulting working-age share in 2060. Figure 3 presents some of the same information graphically. Table 4 and Figure 3 demonstrate that even adding enormously to the U.S. population does not change the working-age share that much. However, if net immigration was increased to five times the level the Census Bureau projects so that it totaled 232 million by 2060, it would roughly preserve the working-age share of the population. Doing so would mean a total U.S. population in 2060 of 706 million — more than double its current size.
|
|
|
|
More than doubling the U.S. population in just four decades, as would be required to maintain the working-age share, would certainly create significant political and social challenges — to say nothing of the impact on the environment or physical infrastructure of the country. It would also mean a foreign-born population of almost 257 million in 2060, representing 36.4 percent of the population (Table 2). These figures are without any precedent in American history. While a five-fold increase in immigration is not really a practical policy proposal, it does help to demonstrate just how inefficient immigration is at preserving the working-age share of the population.
Why Immigration Has a Modest Impact on the Working-Age Share. To understand why the level of immigration projected by the Census Bureau does not impact the working-age share all that much, it may be helpful to remember several basic facts. While most, but by no means all, immigrants arrive in their primary working years, they grow old over time just like everyone else. They also have children who, like the elderly, typically do not work and have to be supported by the efforts of others. As a result, immigration over time adds to the working-age population, but it also adds to the number of children and the elderly. Under a zero-immigration scenario, for example, there will be 89.8 million people 65 and older in 2060. But assuming the level of immigration expected by the Census Bureau, there will be 94.7 million people 65 and older in 2060. Of course, there will also be more workers under the Census Bureau's immigration level, but immigration does not simply add to the working-age population. Immigrants are not a demographic abstraction or just workers. They are human beings who arrive at different ages, have children, and grow older over time. Because of this, they add to the population across the age distribution. This is the reason immigration, in the words of a Census Bureau report in 2000, is a "highly inefficient" means for maintaining the working-age share of the population.
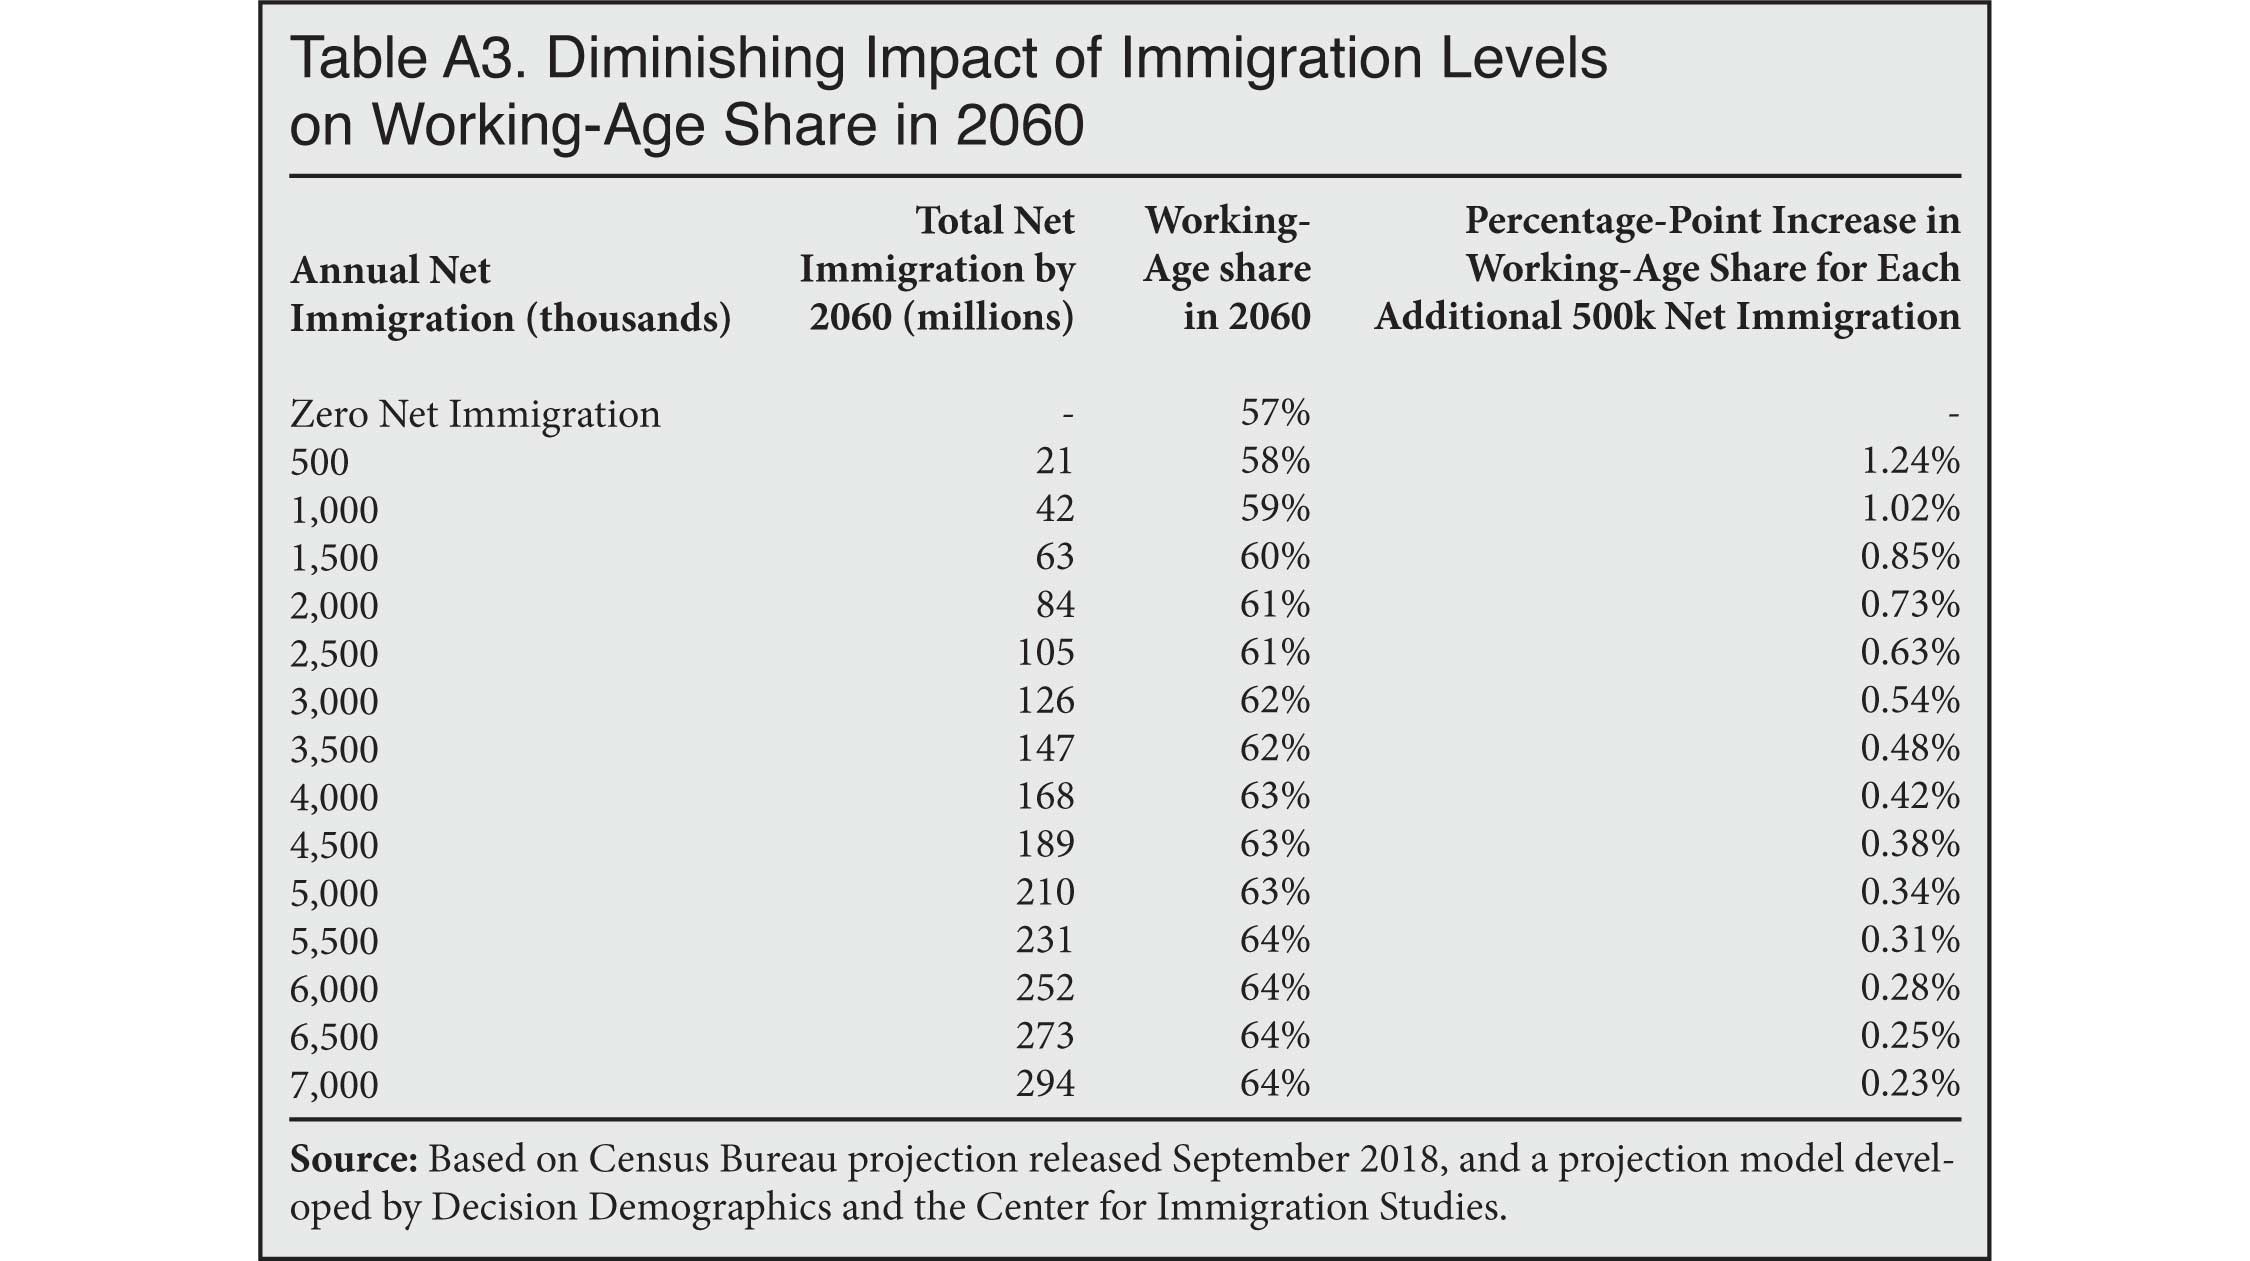
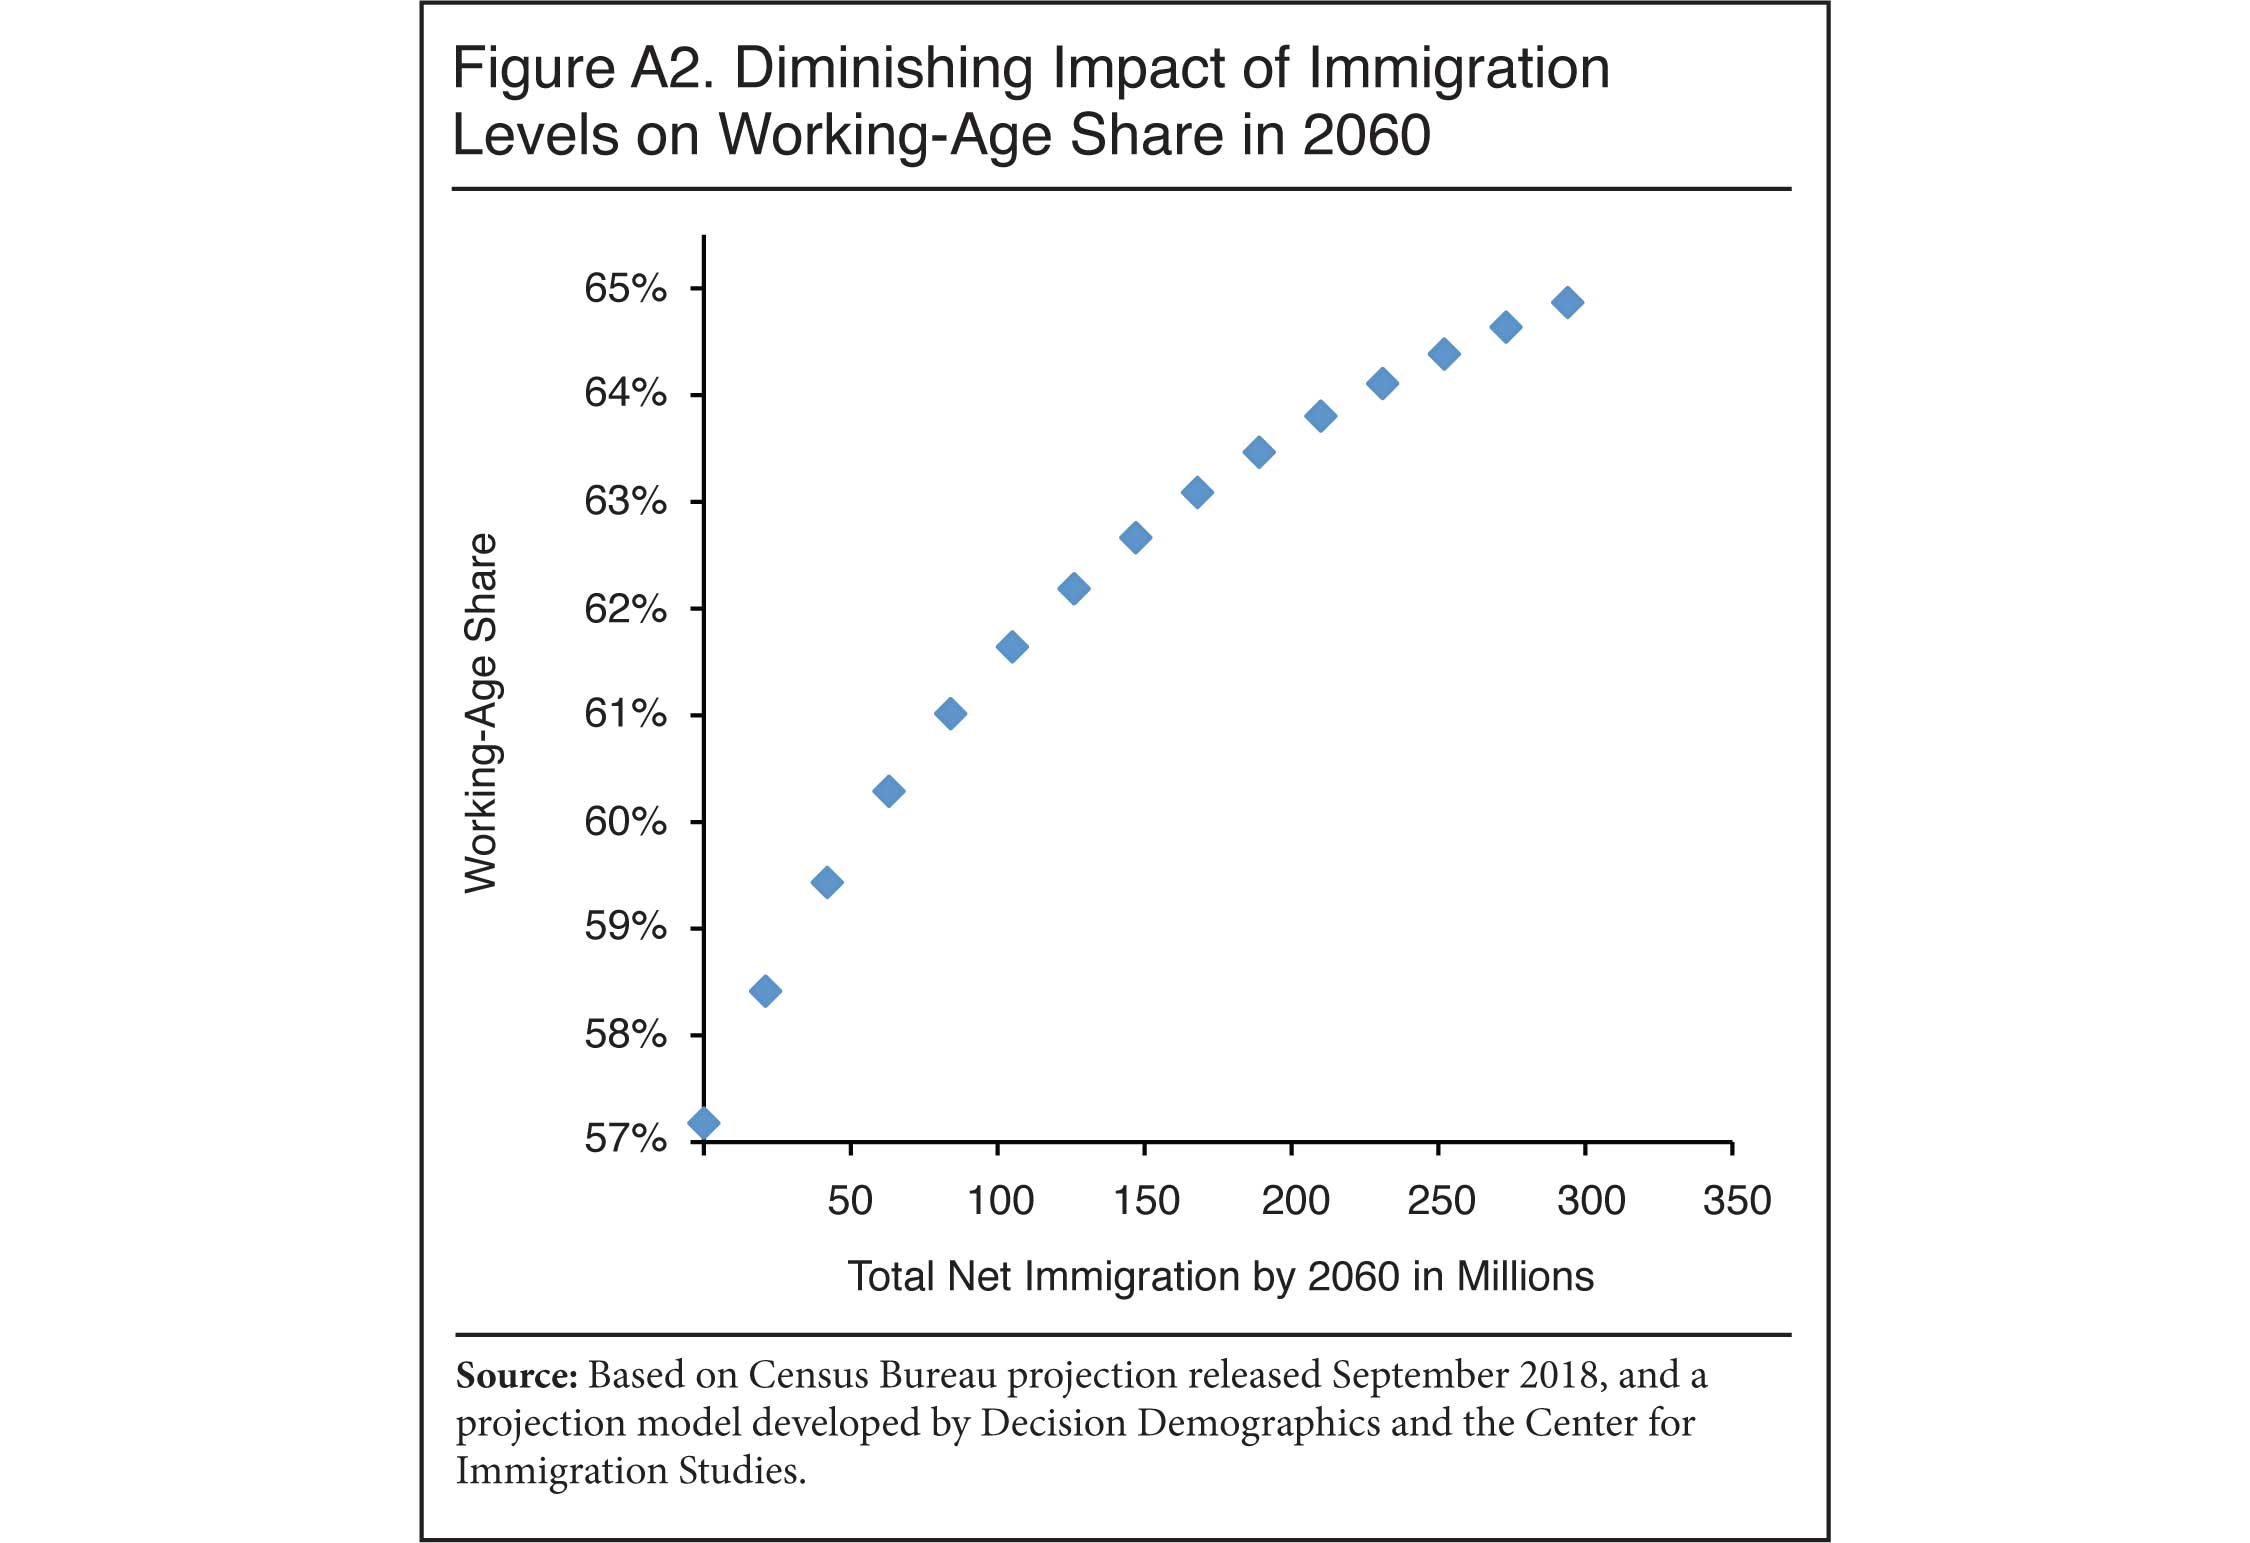
Because of this demographic reality, when it comes to increasing the working-age share of the population, immigration produces diminishing returns. For example, looking at Table 4, the working-age share in 2060 improves by 2.32 percentage points when we compare zero net migration to the Census Bureau's immigration level (46.4 million). But if immigration is doubled again to nearly 93 million, it would only increase the working-age share by an additional 1.75 percentage points in 2060. That is, the same numerical increase in net immigration produces a smaller change in the working-age share of the population in 2060. If we increased net immigration again by another 46.4 million so that it is triple the Census Bureau level, it only improves the working-age share by an additional 1.21 percentage points. Figure A2 in the Appendix shows the diminishing returns from even-higher levels of immigration on the working-age share, with the working-age percentage of the population in 2060 on the vertical axis and the total level of net immigration by 2060 on the horizontal axis.
Changing the Retirement Age
Societies such as the United States with below-replacement-level fertility will likely have to adopt a host of policies to deal with the decline in their working-age share. One of the most obvious is to increase the age of retirement. This makes sense given how much life expectancy has increased since most retirement programs and pensions were originally created. At present, there really is no one single retirement age in America. In theory, a person can retire at any age, though the vast majority of the population cannot do so until they are older. In terms of public policy, there are many different ages at which one can receive or access old-age benefits or savings. Some private pensions can be collected before age 60, as can active-duty military pensions. Withdrawals from saving plans like the 401(k), 403(b), and IRA plans can be made without penalty at age 59.5, while early Social Security benefits can be claimed beginning at 62. One must have turned 66 in 2018 to get full Social Security retirement, while all those born after 1959 will need to wait until age 67 to collect full benefits. Working until age 70 before retiring significantly increases your payment, regardless of when you were born. For Medicare, the nation's health insurance program for the elderly, everyone who has paid into the system is eligible at age 65. In some sense, there are multiple retirement ages in the United States, most of which reflect policy choices made by Congress that can be changed.
Defining the Working-Age. Demographers may often define the working-age as either 16 to 64 or 18 to 64, but this is merely a matter of convention. In developed countries like the United States those under age 16 typically do not work outside of family businesses. But the share and number of people 65 and older working is already significant, and has been increasing. In the first quarter of this year, 9.7 million people 65 and older were in the labor force; in the first quarter of 2007 (before the Great Recession), it was 5.6 million; and it was 4.3 million in 2000. Looking at people aged 65 to 69, 32.0 percent were in the labor force in 2018 compared to 28.7 percent in 2007 and 24.4 percent in 2000. Labor force participation among those 70 to 74 rose from 13.3 percent in 2000 to 16.9 percent in 2007 to 19.7 percent in 2018.12 Raising the age at which people can receive publicly funded retirement benefits or access a savings plan without penalty is certainly possible. Doing so would increase the number of workers in the economy and help improve the solvency of public programs. It would also better reflect the modern reality of people being more active after age 64.
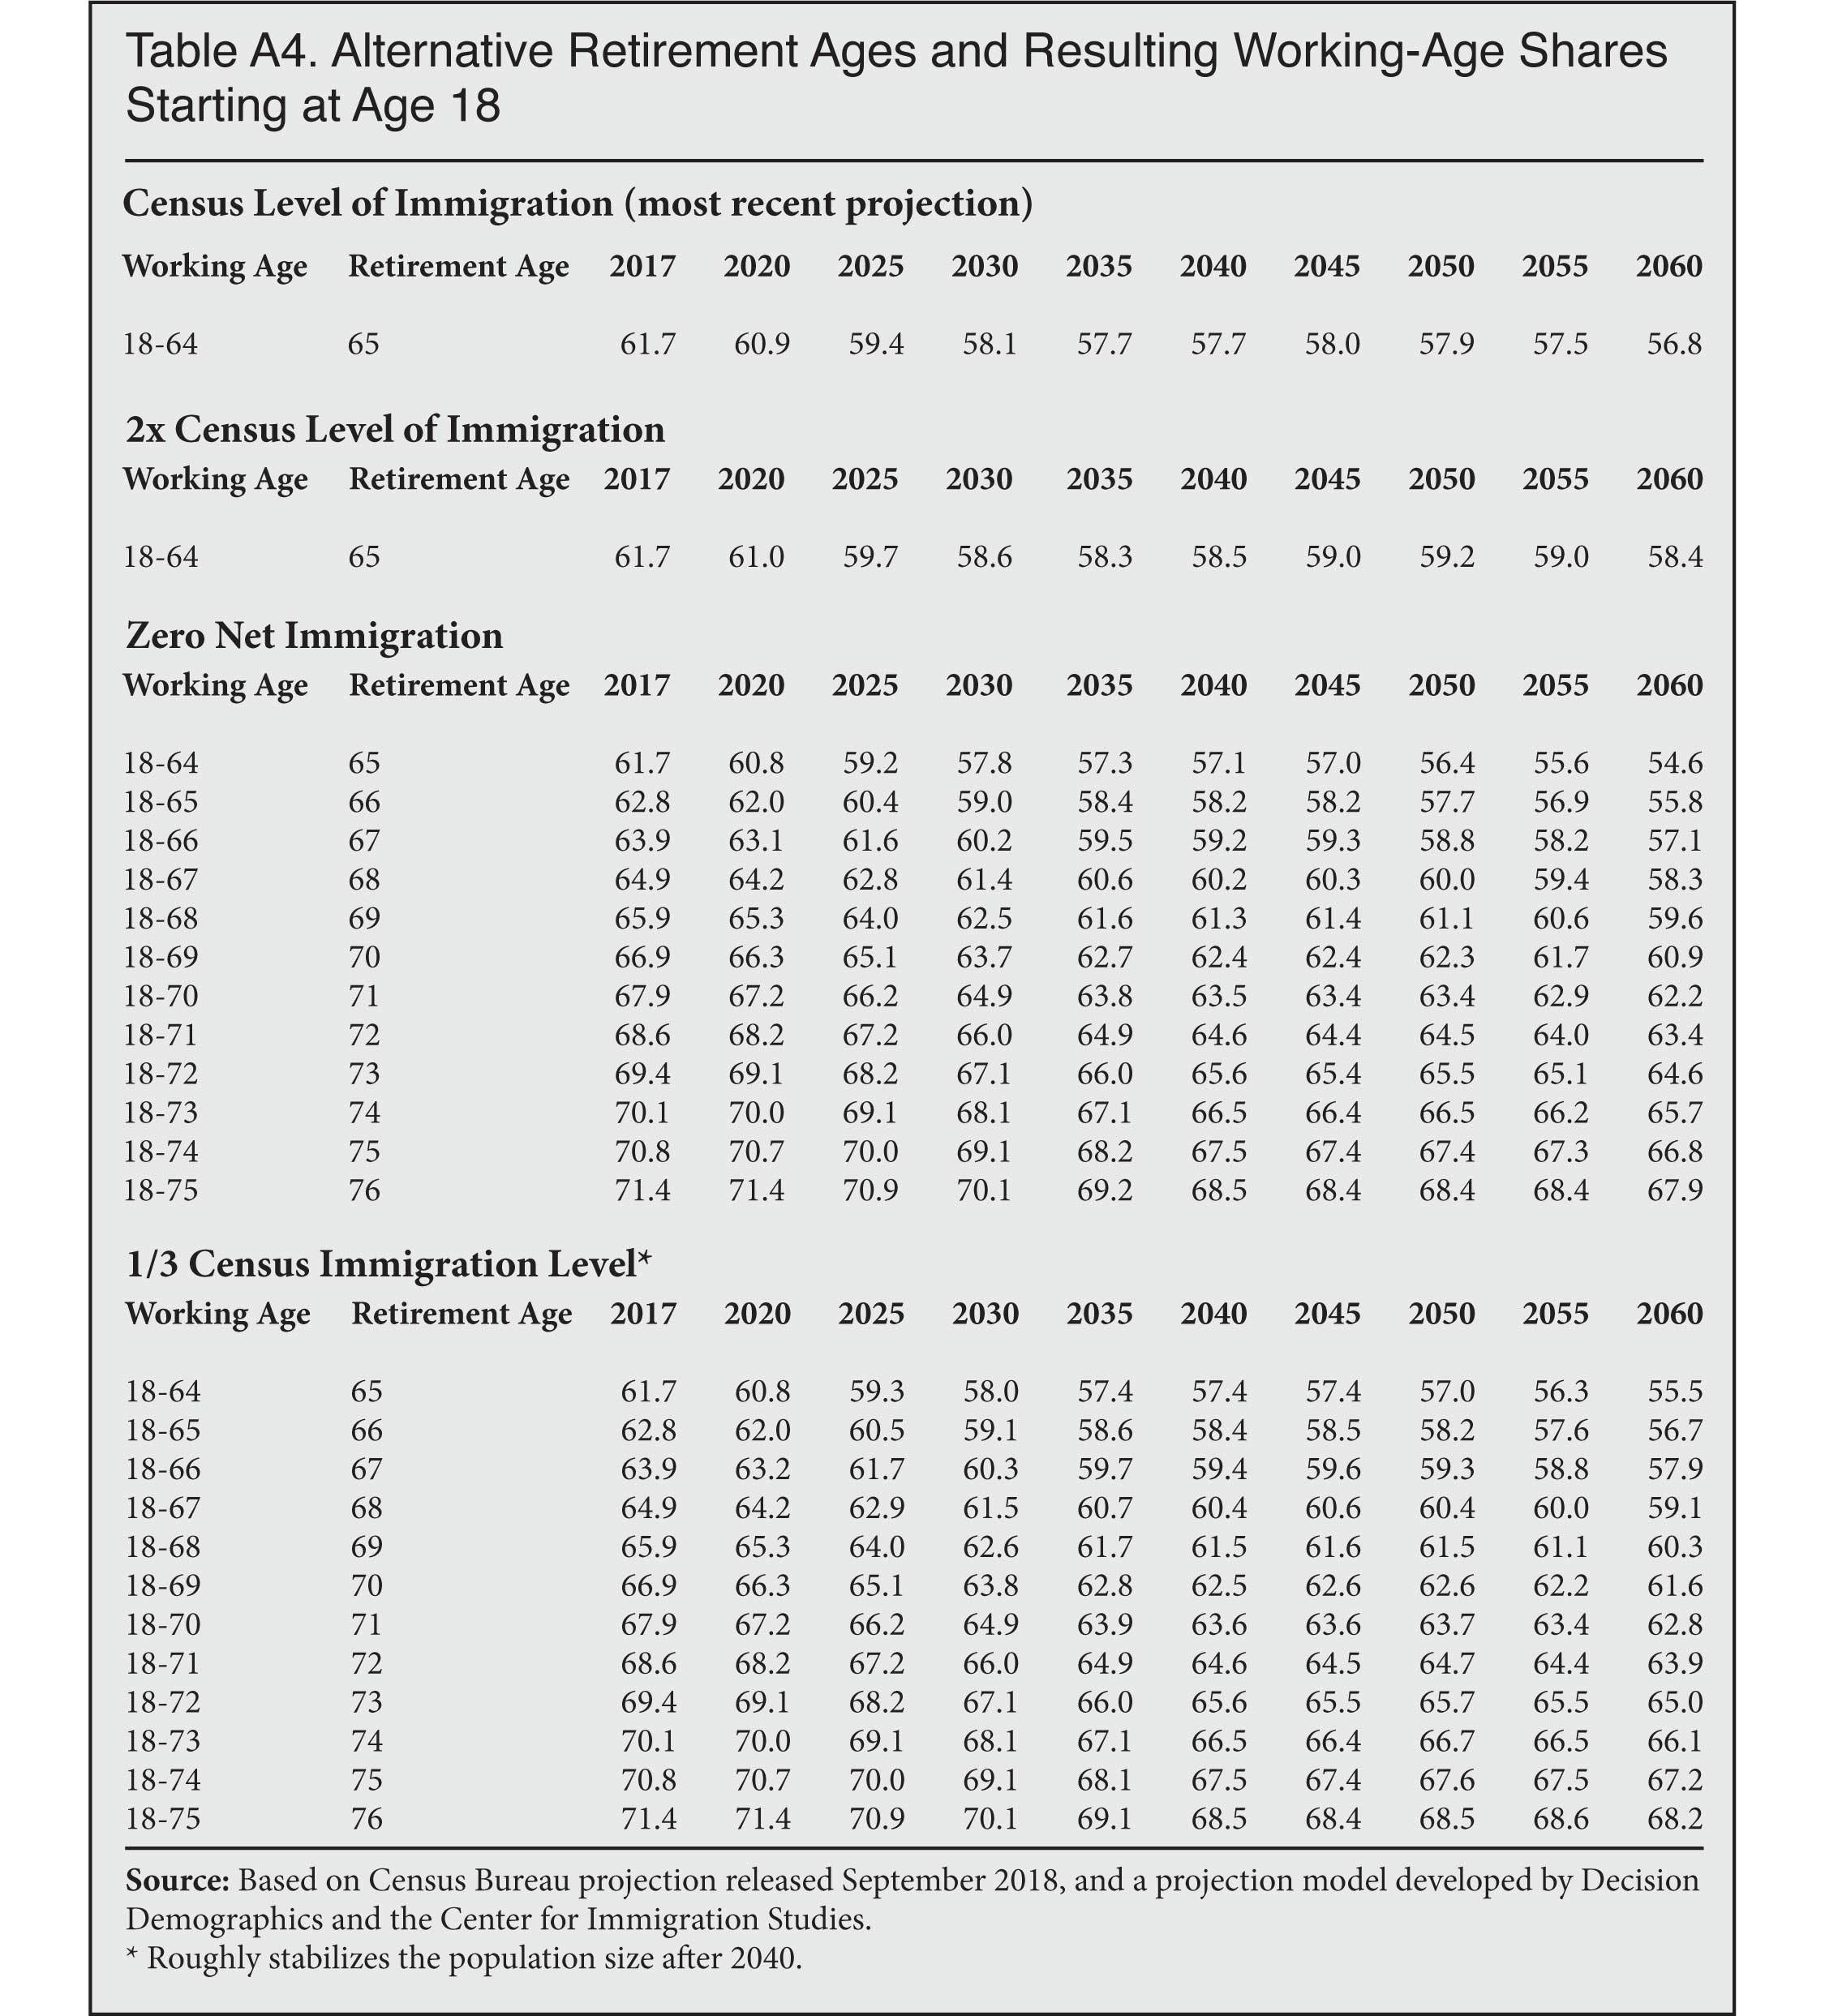
Retirement Age and the Working-Age Share. Table 5 reports the working-age share assuming different retirement ages with 16 as the starting age. As we have seen, 59 percent of the population will be of working age in 2060 assuming the Census Bureau level of immigration and the working-age defined as 16 to 64. (Table A4 in the Appendix reports the same information as Table 5 except that it assumes the working age begins at 18 rather than 16.) As we have also seen, if there is zero net immigration and the retirement age is 65, then the table shows 56.7 percent of the population will be of working age. To be clear, if the working-age is defined as 16 to 64, then it means the retirement age is 65. If the working-age population is 16 to 65, then 66 is the retirement age, and so on. Table 5 shows that assuming zero net immigration and a retirement age of 67 — a two-year increase over a retirement age of 65 — then 59.2 percent of the population will be of working-age (16 to 66). This is slightly higher than the 59 percent that the Census level of immigration produces in 2060, assuming a retirement age of 65. Put a different way, assuming zero net migration and raising the retirement age by just two years increases the working-age share 2.5 percentage points by 2060, which is more than the 2.3 percentage point increase from 46.4 million net immigration the Census Bureau projects by 2060.
|
|
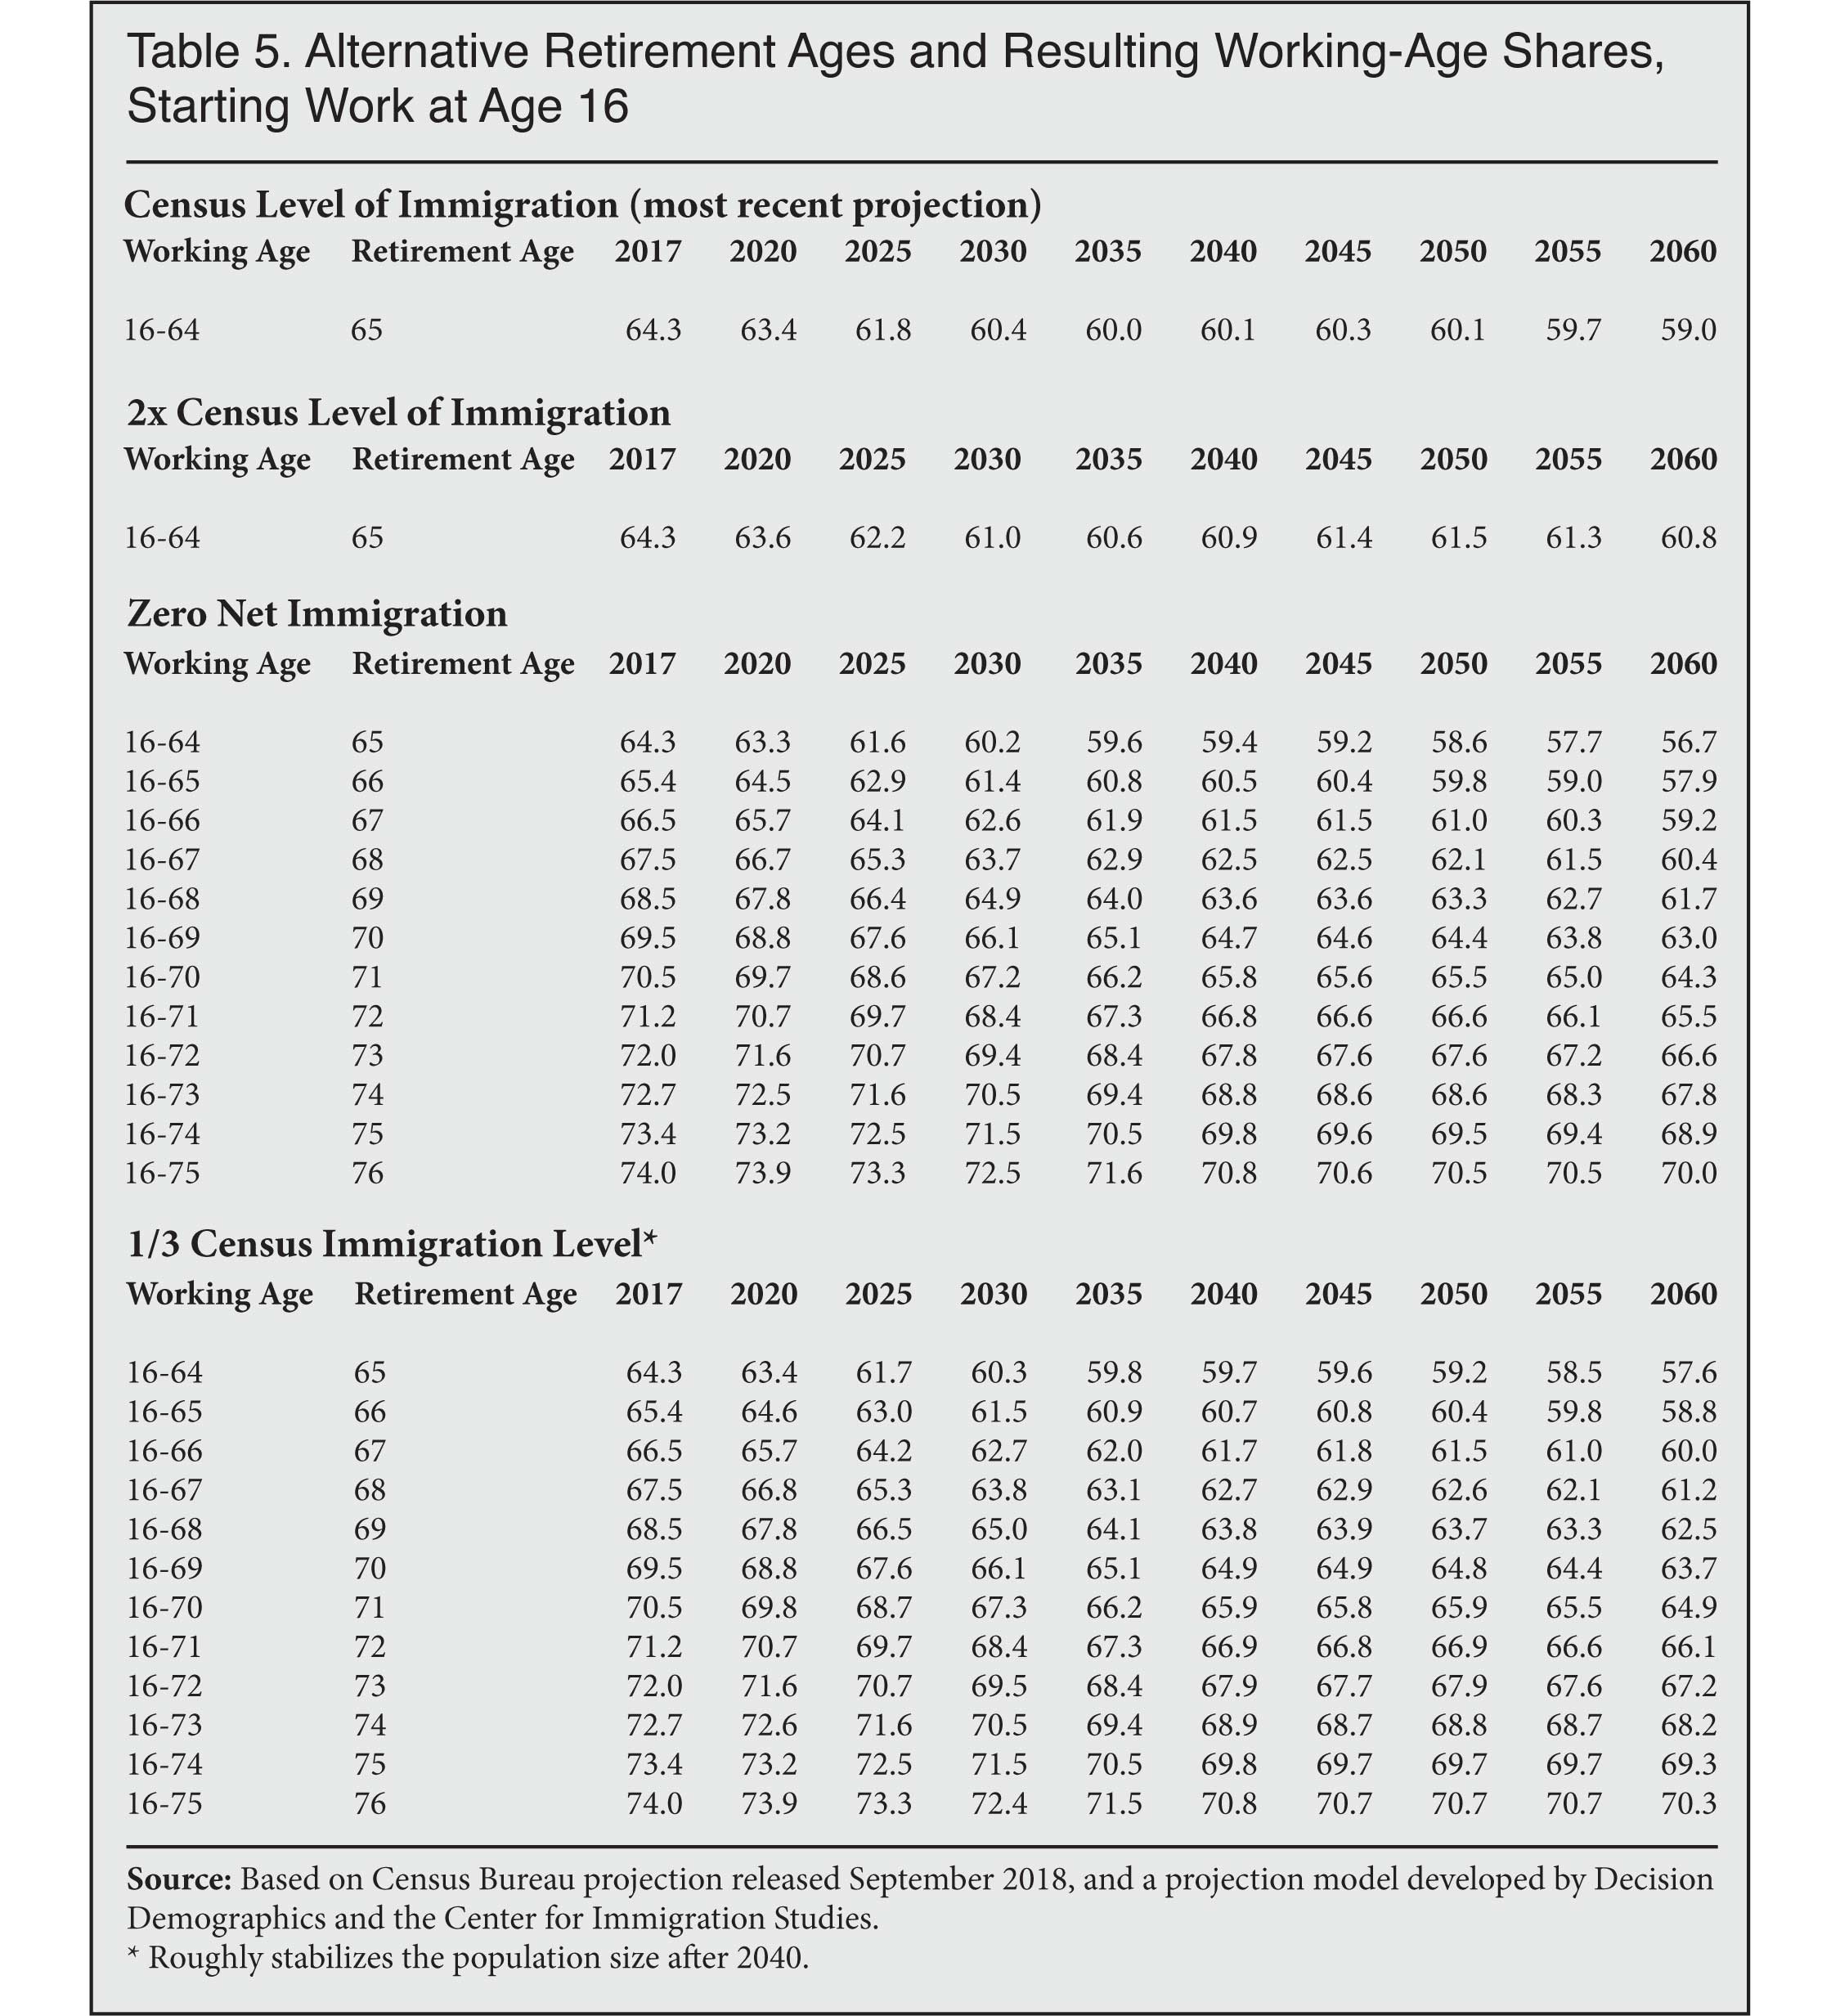
Another way to think about the impact of raising the retirement age is that, assuming zero net immigration, each one-year increase improves the working-age share by 1.2 to 1.3 percentage points in 2060 until the age is set at 72. Each one-year increase thereafter increases the working-age share by 1.1 to 1.2 percentage points until the age is set at 76. How much immigration would it take to equal an increase in the working-age share of this size? Making all the demographic assumptions that the Census Bureau makes for immigration, deaths, and births, it would require net immigration of 21 million (500,000 annually) by 2060 to improve the working-age share by 1.2 percentage points. Immigration of this level would make the population in 2060 35 million residents larger than if there was zero net immigration. This means that it takes nearly 21 million net immigrants and adding slightly more than 35 million people to the population in 2060 to have the same impact on the working-age share as raising the retirement age by just one year.
The diminishing returns mentioned above must be kept in mind when thinking about immigration and the working-age share. While the first 21 million net immigrants by 2060 increases the working-age share by 1.2 percentage points, the second 21 million increase the working-age share by one percentage point by 2060, with the impact fading as you add more people. Raising the retirement age would seem to be a more effective means of changing the share of the population that is of working age than is immigration.
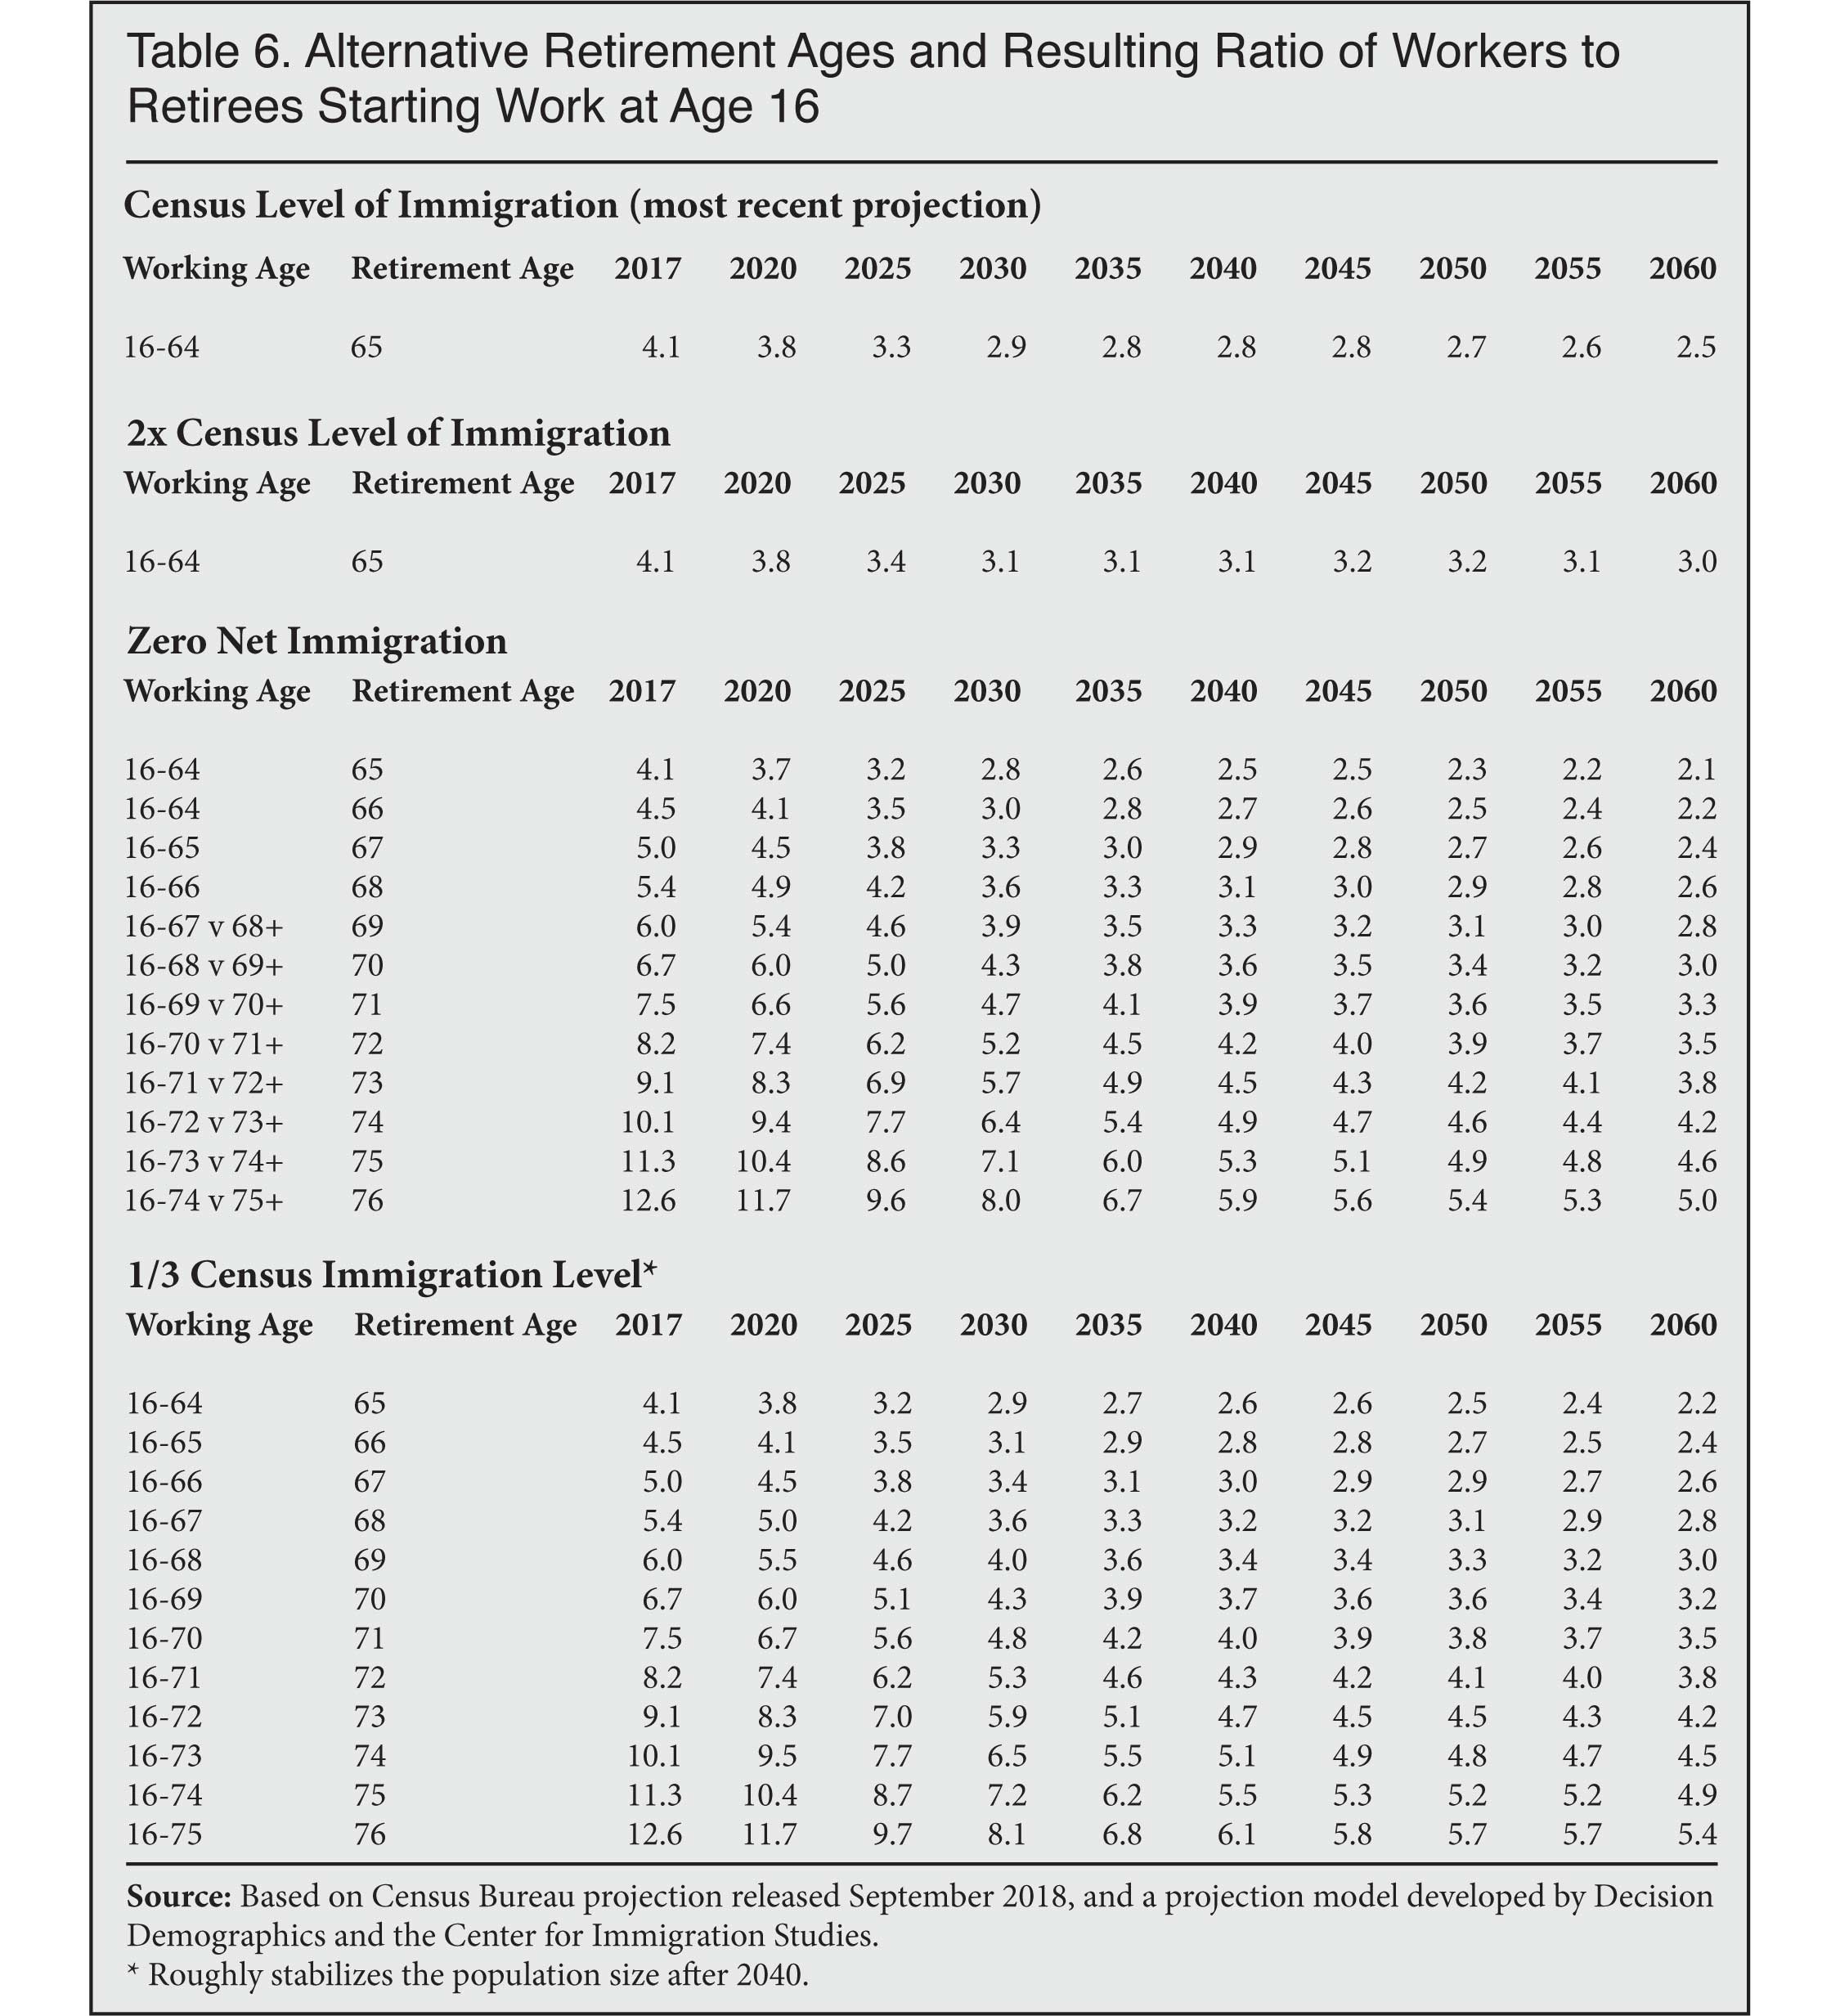
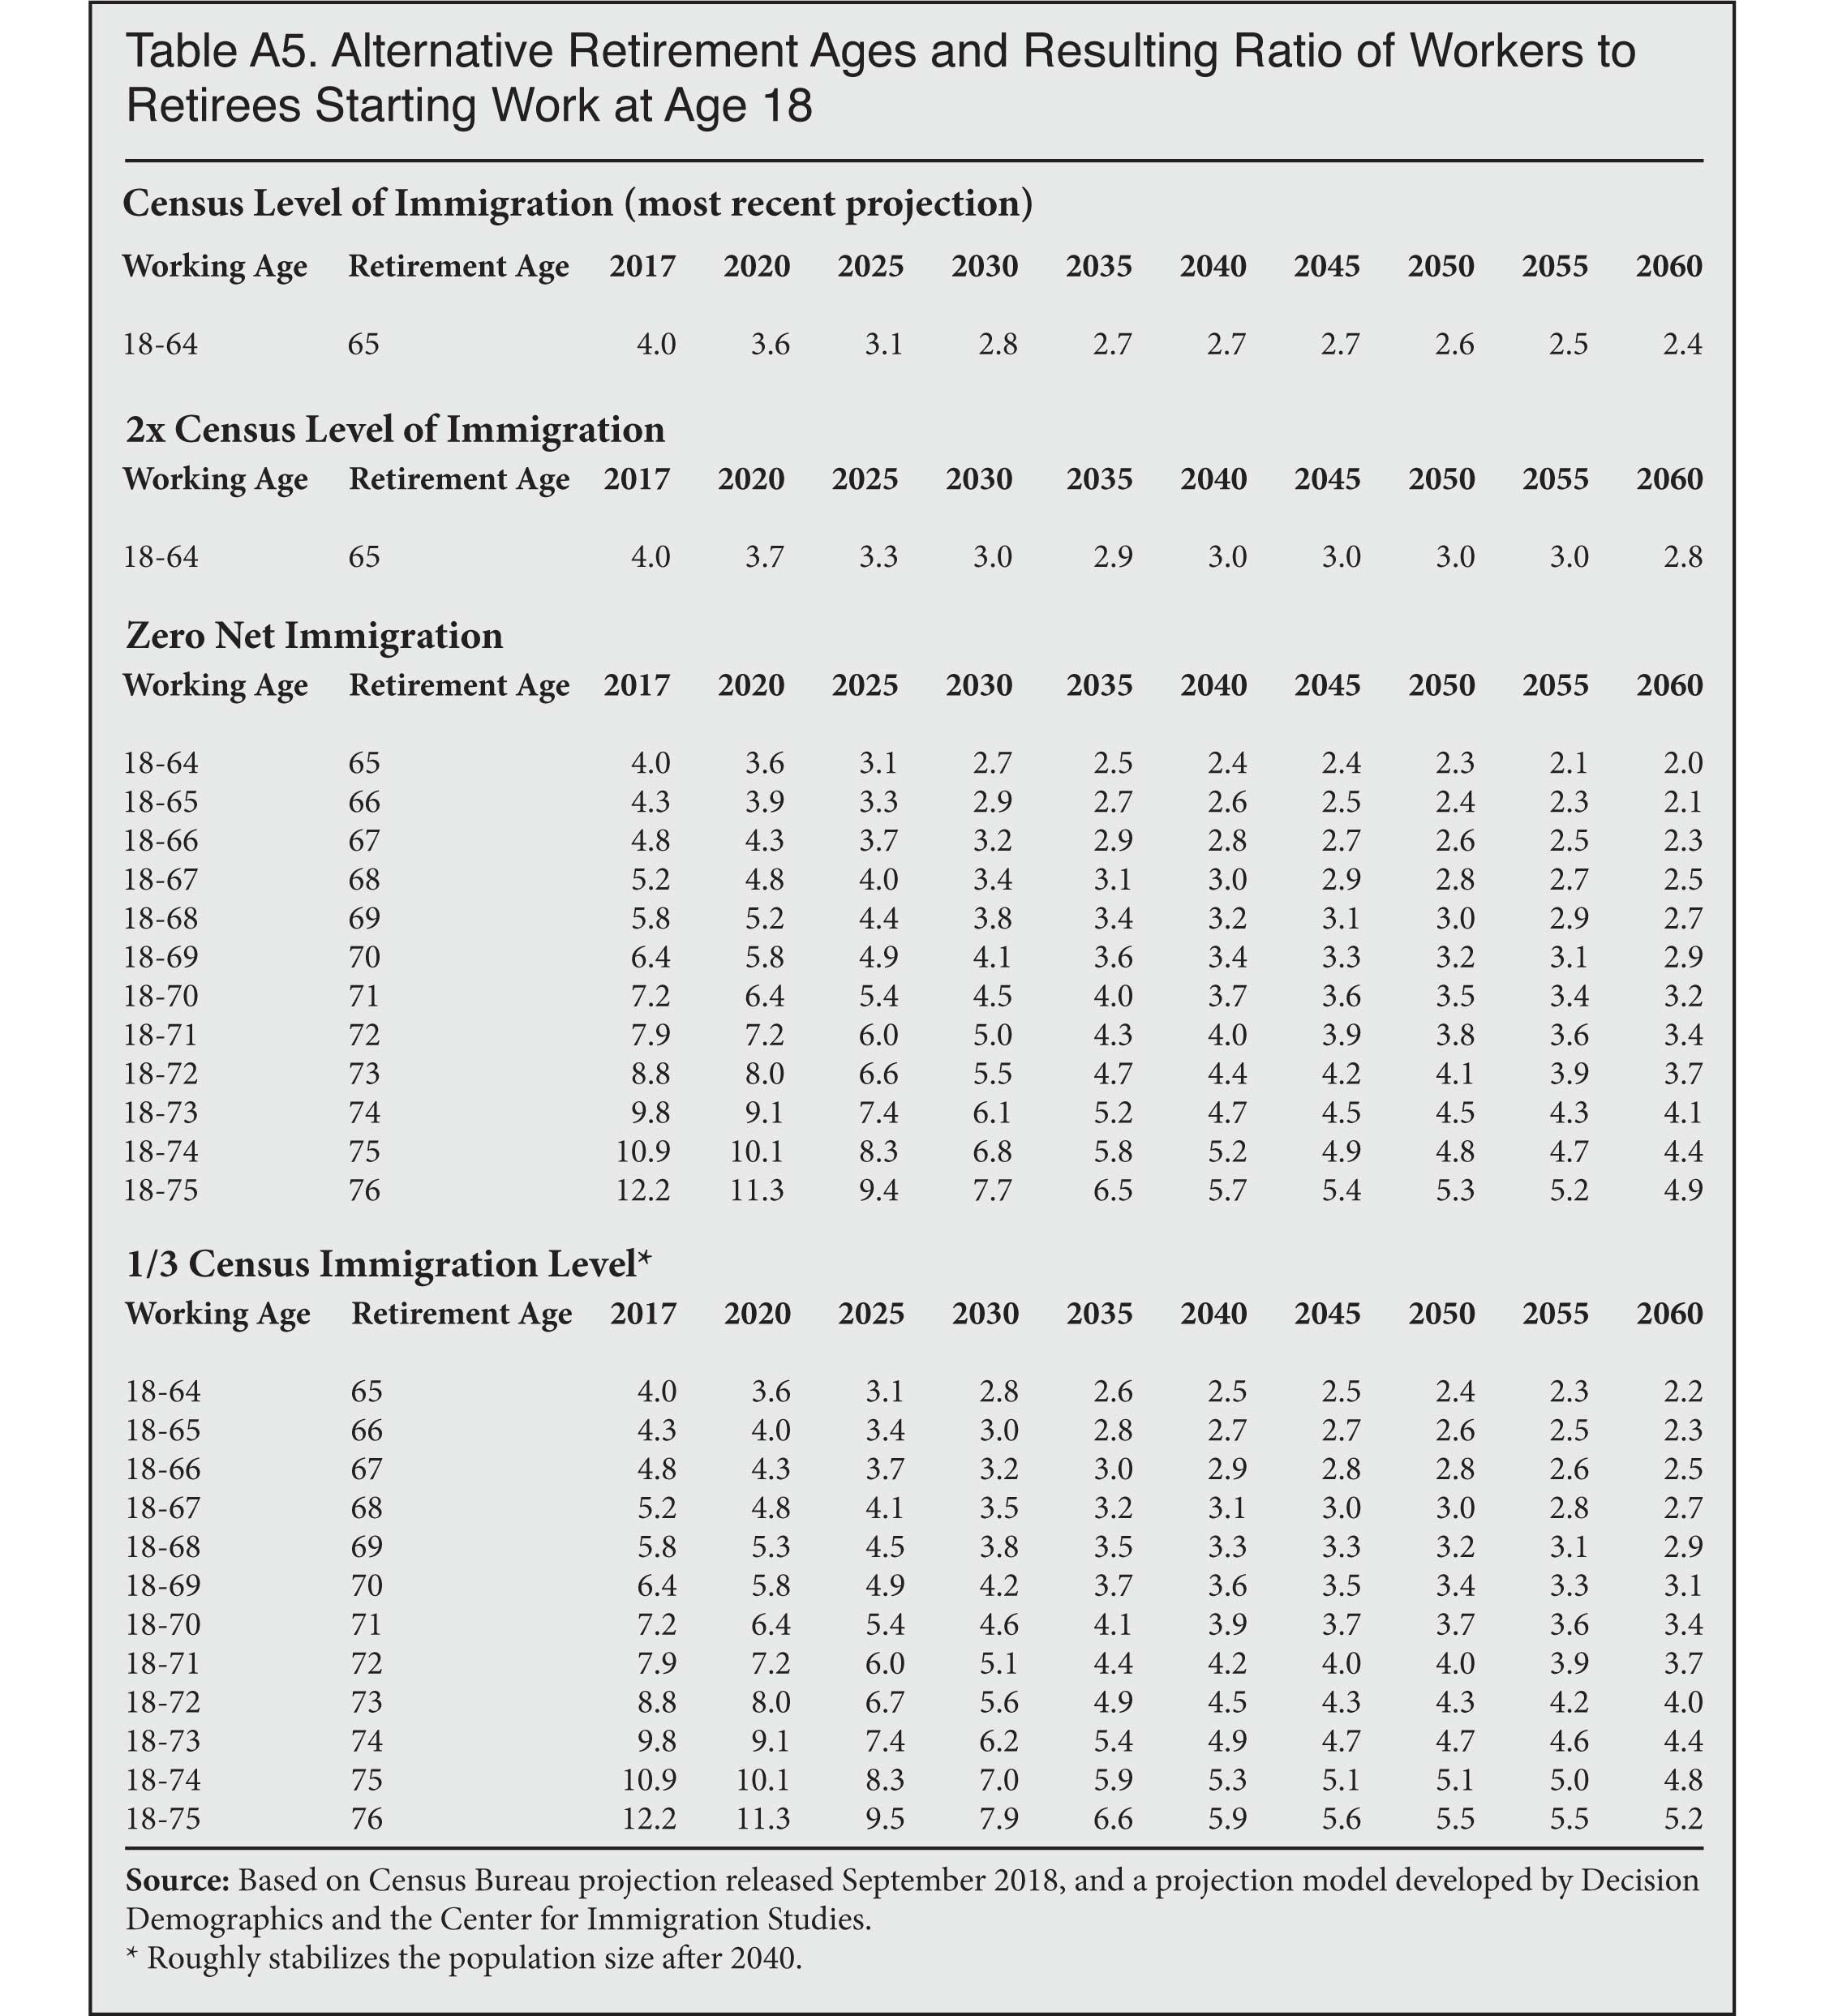
Retirement Age and the Ratio of Workers. Table 6 shows the same basic analysis as Table 5, except instead of examining the share of the population of working age it reports the ratio of working-age people to those of retirement age. (Table A5 in the Appendix reports the same information as Table 6 except that it assumes the working-age begins at 18 rather than 16.) Table 6 shows that, assuming zero net immigration, a two-year increase in the retirement age increases the ratio of workers to retirees by 0.3 workers, compared to the Census level of immigration, which increases it by 0.4 workers. If the retirement age is increased three years, from 65 to 68, the impact is a 0.5 worker increase, which is larger than the impact of the Census level of immigration. In short, a two-year increase in the retirement age has a slightly smaller impact than the Census level of immigration, while a three-year increase has a slightly larger impact. It is reasonable to see these results as indicating that raising the retirement age by 2.5 years would have the same impact as immigration on the ratio of workers to retirees. It is worth adding that Table 6 shows that under the population stabilization immigration scenario, if the retirement age was increased two years, it would raise the ratio by .5 workers, which is slightly more than the Census level of immigration. This might represent a reasonable way of dealing with the issue of aging as it would mean a moderate level of immigration and a modest increase in the retirement age.
|
|
The Share Who Actually Work
Theoretical vs. Actual Workers. The prior analysis of the working-age share or ratio of workers to retirees is theoretical in that it does not project actual workers, only potential workers by looking at the size of the working-age population. At present, 70 percent of those 16 to 64 are employed — referred as the employment rate.13 In addition to the unemployed, who are actively looking for work, there are always working-age people entirely out of the labor force, such as the disabled, parents staying home with young children, and those who for whatever reason are not looking for a job. Because of this, the actual share of the population who are workers or the ratio of workers to retirees is somewhat less than reported earlier in this report when only age, not employed workers, was considered.
Raising the share of working-age people who are employed would by itself be desirable, as non-work is associated with significant social problems such as substance abuse, crime, and broken families. Moreover, if we are concerned that there are not enough workers to support the economy, then increasing the share of working-age people who actually work, which in 2018 was still low by historical standards, could have the same impact as increasing the size of the working-age population from immigration while holding the employment rate constant. In the analysis below, we look at workers relative to the total population or to those of retirement age. As already discussed, some people over age 64 do, in fact, work, so the actual share of the population working or the ratio of workers to retirees is actually slightly better than reported below.
Impact of Increasing Work. The top of Table 7 shows the impact of increasing the share of working-age people (16 to 64) who are employed. The table shows that under the Census level of immigration, the share of the population who will be workers, assuming a 70 percent employment rate (the current rate), will be 41.3 percent in 2060. The table also shows that if there is zero net immigration, but the employment rates rises to 75 percent, the worker share of the population would be 42.5 percent in 2060 — 1.2 percentage points higher than under the Census Bureau projection. If we look at the more realistic population stabilization scenario and increase the employment rate to 75 percent it would result in 43.2 percent of the population working in 2060, significantly above the share shown in the baseline Census Bureau projection at the top of the table. Additionally, we can model the impact of increasing the retirement age by two years so that the working-age is 16 to 66. Table 7 shows that the stabilization scenario along with an increase in the retirement age and employment rates would mean that 45 percent of the population would be workers in 2060 — well above the 41.3 percent that immigration alone creates.
|
|
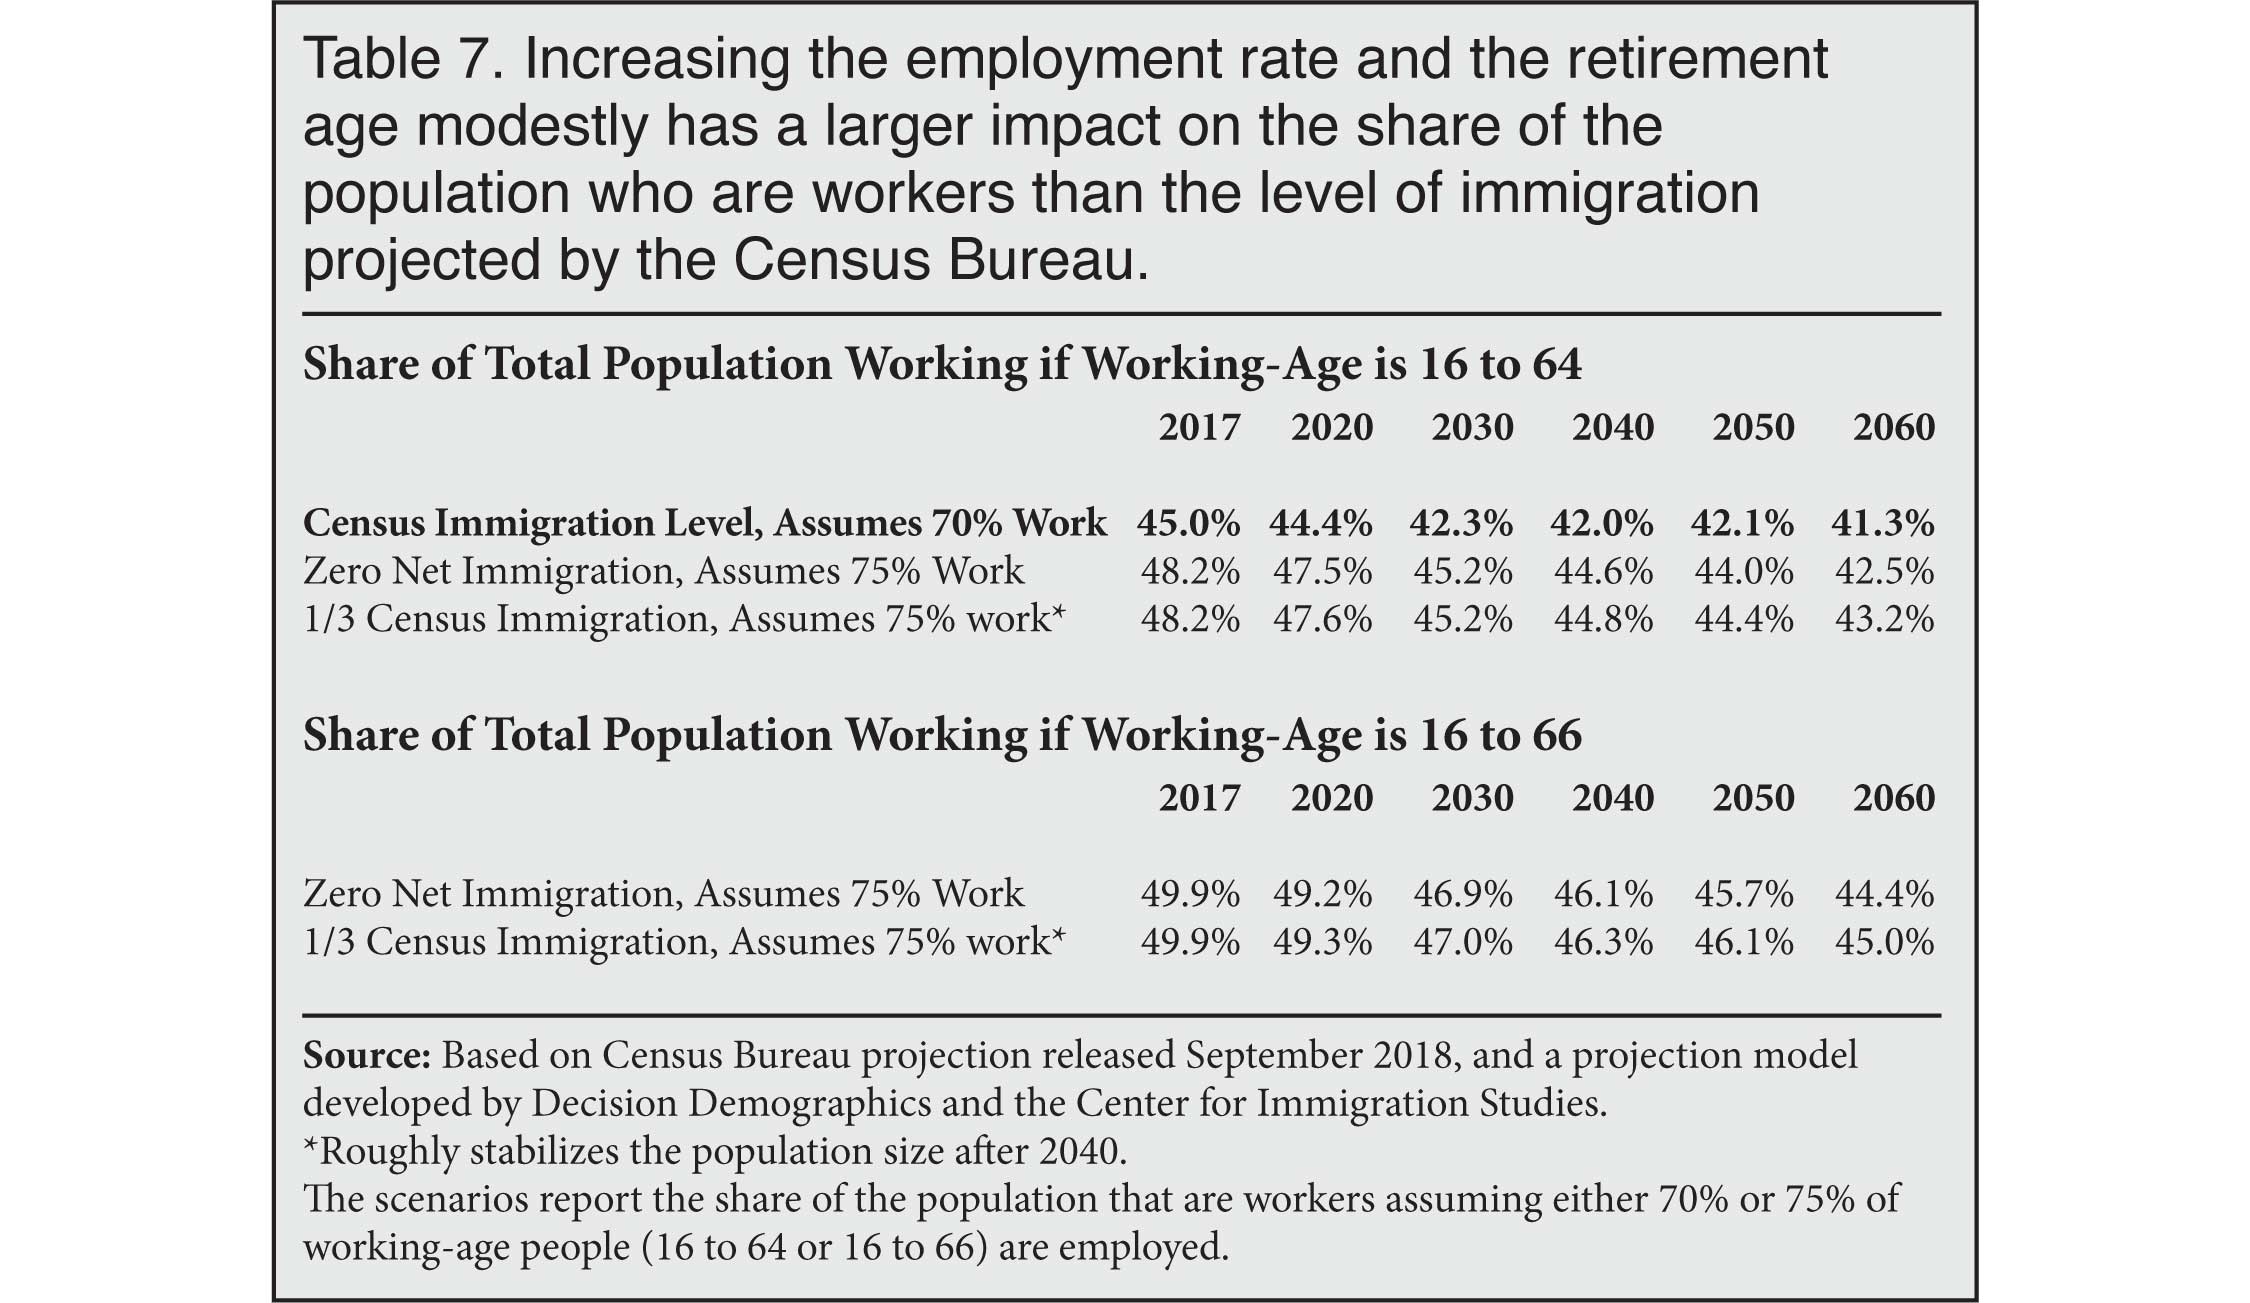
Table 8 shows the same set of calculations as Table 7 except that the focus is on the ratio of workers to retirees. The findings show that increasing the employment rate also improves the ratio of workers to retirees. Looking at the stabilization scenario and assuming an employment rate of 75 percent results in 1.7 workers per retiree in 2060, slightly below the 1.8 ratio assuming the Census Bureau's projected level of immigration. If we again use the stabilization scenario and raise the retirement age to 67 and the employment rate to 75 percent, then the ratio in 2060 would be 1.9 workers per person of retirement age, slightly above the ratio of 1.8 the Census level of immigration by itself produces.
|
|
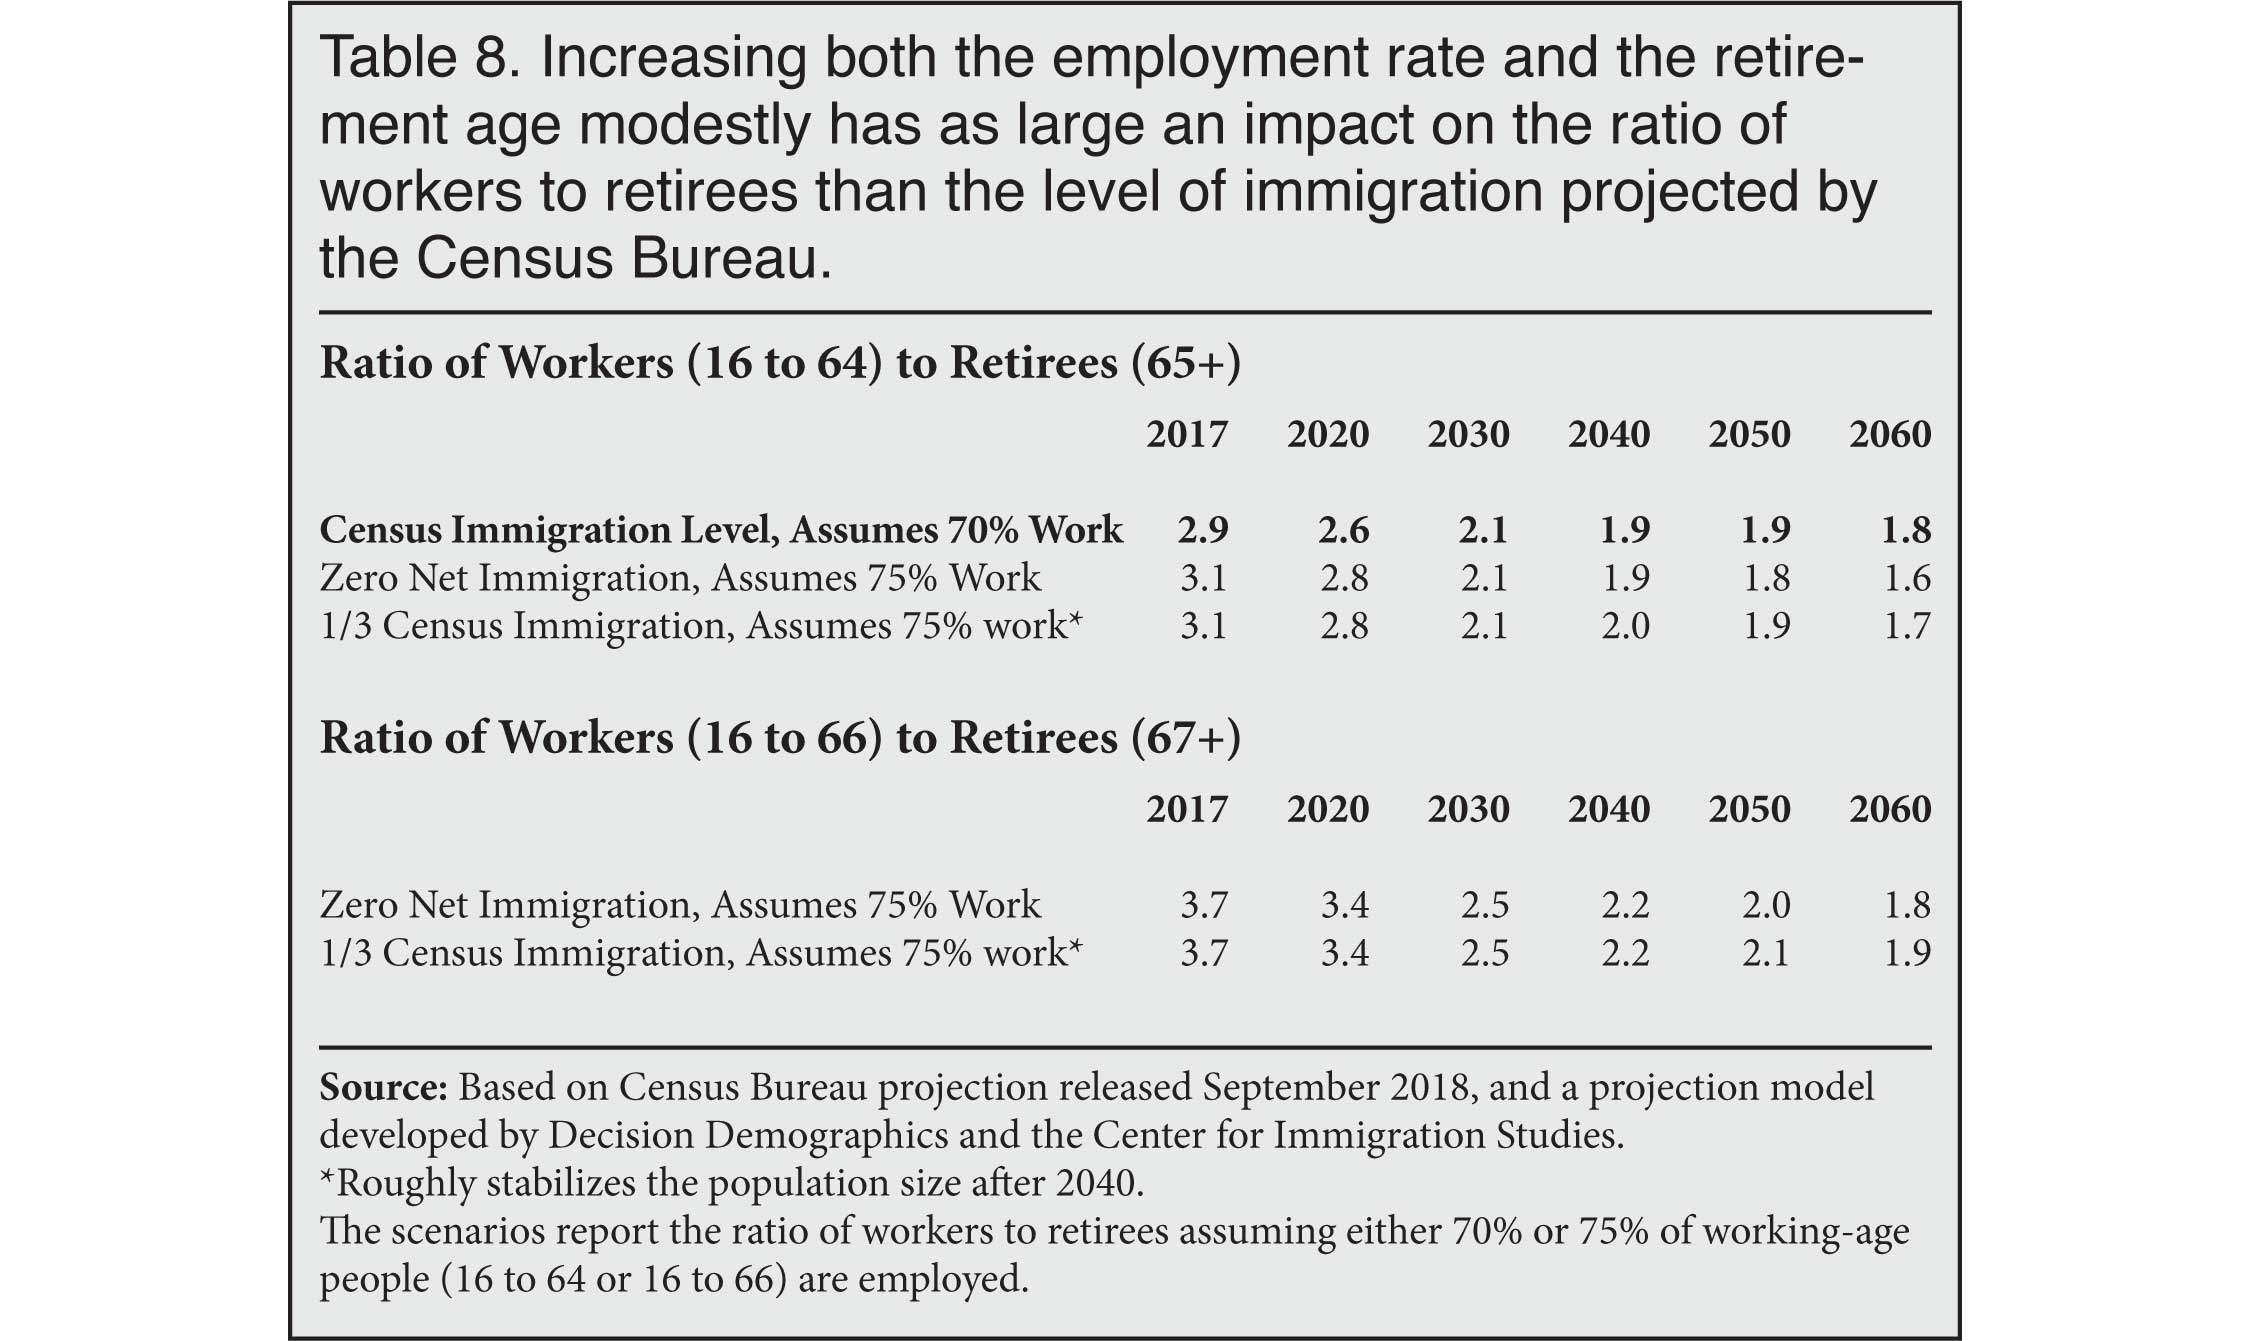
Tables 7 and 8 show that moderately raising the retirement age and the employment rate would increase the share of the total population who are workers or the ratio of workers to retirees as much as or even more than the level of immigration projected by the Census Bureau by 2060. Dealing with the aging of society will almost certainly involve several different approaches. Immigration, raising the retirement age, and increasing the share of working-age people working can all be part of a solution.
Conclusion
This analysis first recreates the newest Census Bureau projections and then varies the immigration level, which the Census Bureau does not do in its projections. The Center for Immigration Studies, as well as other researchers, have reported that immigration levels fell significantly after 2007. To that end, the most recent Census Bureau projections on which this analysis is based assume a lower level of net immigration than did the projections from 2012 and 2014. However, it is also the case that the most recent data indicates that immigration has surged recently.14 While there is no way to know with any certainty what the future level of immigration will be, this analysis provides many different immigration scenarios to discern its impact.
We find that varying the immigration component has a very large impact on the future size of the U.S. population. The Census Bureau projects net immigration of 46.4 million between 2017 and 2060, creating total a population of 404 million in that year — 96 million larger than in the last Census in 2010 and 79 million larger than in 2017. The addition is roughly equal to the combined populations of France and Belgium. Almost all (75 million) of the post-2017 increase is due to future immigration. That is, immigrants who have not yet arrived, but who will do so absent a change in policy, plus their descendants.
Although immigration makes for a much larger population, immigration does not have a large impact on increasing the share of the population that is of working age. Assuming the Bureau's immigration level, 59 percent of the population will be working-age adults (16 to 64) in 2060, compared to 57.6 percent if immigration was reduced by two-thirds to the level that would roughly stabilize the population. Even if there was no net immigration, the working-age share would still be 56.7 percent in 2060. In contrast, raising the retirement age would seem to be a much more effective way of increasing the share of the population who are potential workers. We find that raising the retirement age by two or three years would increase the working-age share of the population more than the level of immigration projected by the Census Bureau through 2060. It would also have a similar impact on the ratio of workers to retirees. While immigrants do tend to arrive relatively young, and have somewhat higher fertility than natives, they age just like everyone else, and some actually arrive at or near retirement. Further, the children of immigrants also add to the dependent population, at least until they reach adulthood. For all of these reasons, immigration does not have the large impact that some imagine on increasing the share of the population who are workers. It would require a truly dramatic increase in immigration levels, many times that projected by the Census Bureau, to maintain the current working-age share of the population.
The debate over immigration should not be whether it makes for a much larger population — it does. The debate over immigration should also not be whether it has a large impact on increasing the working-age share of the population or the ratio of workers to retirees — it does not. The key question for the public and policy-makers is what costs and benefits come with having a much larger population and a more densely settled country. Some foresee a deteriorating quality of life with a larger population, including its impact on such things as pollution, congestion, loss of open spaces, and sprawl. Others may feel that a much larger population will create more opportunities for businesses, workers, and consumers. These projections do not resolve those questions. What the projections do tell us is where we are headed as a country in terms of the size and density of our population. The question for the nation is: Do we wish to go there?
Methodology Appendix
Overview. Our population projection model replicates as closely as possible the assumptions and methods used in the U.S. Census Bureau's 2017 National Population Projections issued in March 2018 and then re-released after slight adjustments in September 2018.15 However, the Bureau has not released all of the data necessary to exactly replicate their projections. Thus, by necessity, replication of the 2018 Census projection model required, at each step, adjustments of available data to track components of change control totals. For some parts of the model, more detailed data available from the 2014 projections was used as a starting point and then adjusted to meet 2018 control totals. In addition, the 2017 American Community Survey Public-Use Microdata Sample (ACS PUMS) file was used to guide some allocation of race/ethnicity by nativity for the model's starting population. Our model also adjusts and re-aggregates the data of the nine race/ethnicity groups detailed in the Census Bureau's projection model to five race/ethnicity groups. Using these data resources, the Census Bureau's cohort-component projection model can be nearly recreated.
Our recreation of the Census Bureau projections comes within 0.2 percent of the Census Bureau's projection for the total population and for other important characteristics. Once the Bureau's projection is recreated, it is then possible to change the immigration component of the projections and discern its impact on the future size and compositions of the U.S. population.
Replicating the 2017 Census Projections. The 2017 National Population Projections released by the Bureau so far included data on the number of deaths and net migrants by gender and age. In addition, counts of births were provided. The data for all three of these components of change were provided for nine race/ethnic group combinations. As shown in Table A1, this information was recombined into five race groups. Because of the limited data available compared with previous Census projection models, in this model non-Hispanics of two or more races were combined with the non-Hispanic American Indian/Alaska Native (AIAN) group.
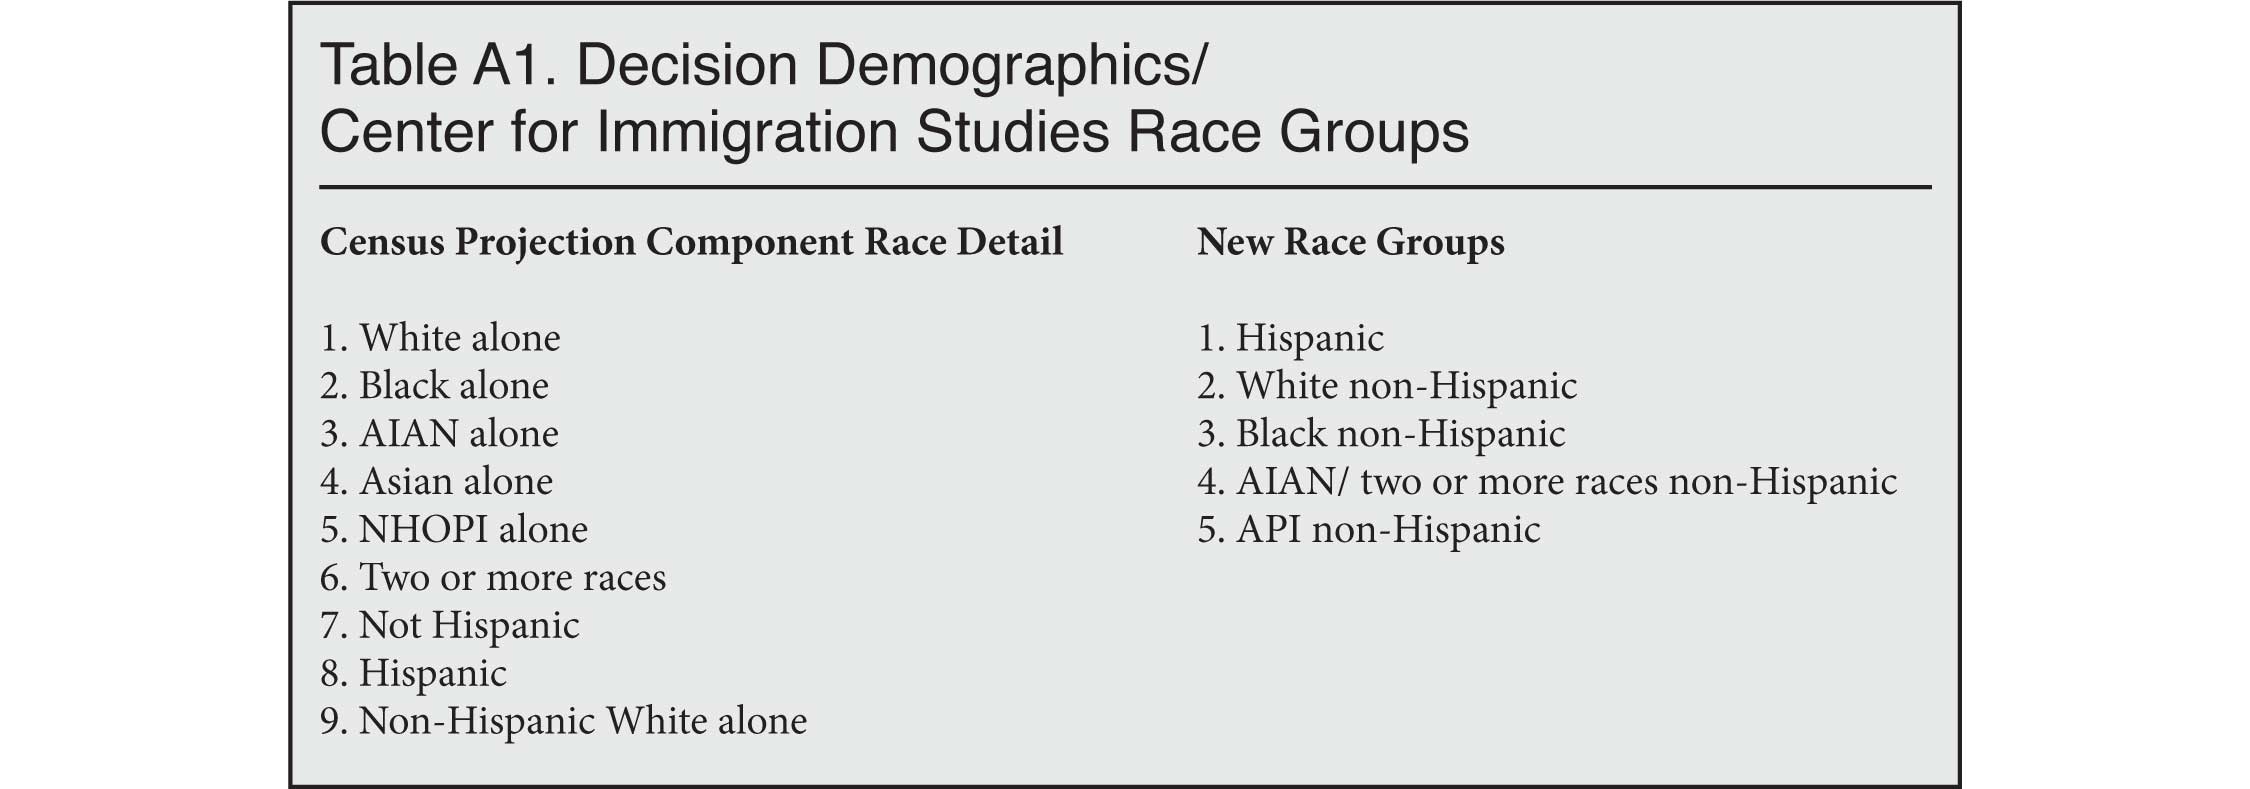 |
Racial and Hispanic Origin. Converting the nine Census groups into our five race groups included several steps. The first step was to determine the non-Hispanic portion of each race group (groups 1, 2, 3, 4, and 5 listed in the left panel of Table A1). Note that after determining the non-Hispanic portion, Asian and NHOPI (Native Hawaiian and Other Pacific Islander, groups 4 and 5 in the left panel) were combined to create the race group API (Asian and Pacific Islander) non-Hispanic in this process.
To derive a non-Hispanic share of each Census race group, a key resource was the published projections dataset. The Census provided the single year of age population projection by sex for each race by Hispanic and Non-Hispanic origin. Thus, the share of Hispanics in each of the "race alone" as well as the "two or more races" groups could be calculated cell-by-cell for each year and each single year of age for all years of the projections. These ratios were calculated and then applied to create non-Hispanic race group estimates of births, deaths, and net migrants. Since the Census Bureau provided complete information for non-Hispanic whites alone, those data were used as provided rather than derived.
Race by Nativity. The Census Bureau provided somewhat condensed race and age details on the population by nativity status. Hispanic and non-Hispanic white details were provided and required no adjustments. However, non-Hispanic counts for blacks, AIAN/two-plus races, and the API race groups needed to be derived from counts including Hispanics and then adjusted to be consistent with the full-population counts available in full race/ethnicity detail. Initial attempts at allocation revealed substantial nativity differences for these three groups in terms of their individual representations of Hispanics. To aid in the allocation of Hispanics, the share of Hispanics in each race was calculated by nativity by age group and sex from tabulations of the 2017 American Community Survey Public-Use Micro data. (ACS PUMS). The terminal age group by nativity was age 85 and over. The single year of age detail by nativity for age 85 and over was derived guided by the ACS PUMS and the distribution derived from the 2014 CIS model of the Census Bureau population projection. This was done to ensure each age and race group total was consistent with the age and race total population provided with the 2017 projection model.
Births and Age-Specific Fertility Rates (ASFR). The Census Bureau only provided counts of births by race, not by nativity. To generate births by nativity and race, we used information from the Bureau's prior projection (2014) to adjust births, combining it with the information that has been released.16 A smaller adjustment inherent in using the 2014 model's ASFR by nativity data is that the Census Bureau ASFR data builds in details for assignment of race for births. The Census Bureau has invested significant research and methods to assign race to births. The result is that simply applying the ASFR for each race group does not exactly result in the published number of births for that age group. The ASFR data from 2014 includes adjustments for this. The 2014 model's ASFR used as a starting point in generating birth numbers was actually two sets of ASFR with one set generating male births and the complementary set generating female births. Based on these rates it is possible to determine the sex ratio of births. Taken together, all this information allows us to match births in the 2017 projections.
Deaths. While the 2014 Census projection model provided survival ratios, the 2017 projection model only included counts of deaths. The age-specific death rates calculated and used in our model were like our fertility analysis — based on the 2014 Census projections as a starting point. However, additional ratio adjustments were applied to the survival rates to not only align with the published number of deaths but to accommodate the differences in death rates by nativity.
Net Migration. The net migration counts provided by the Census Bureau were adjusted to our five race groups using the methods similar to those used in deriving the 2017 starting population. The share of Hispanics in the non-white race groups were determined based on the ACS PUMS tabulations for the foreign-born population as described in the development of the starting populations.
|
|
|
|
|
|
|
|
|
|
|
|
|
|
 |
|
|
|
|
End Notes
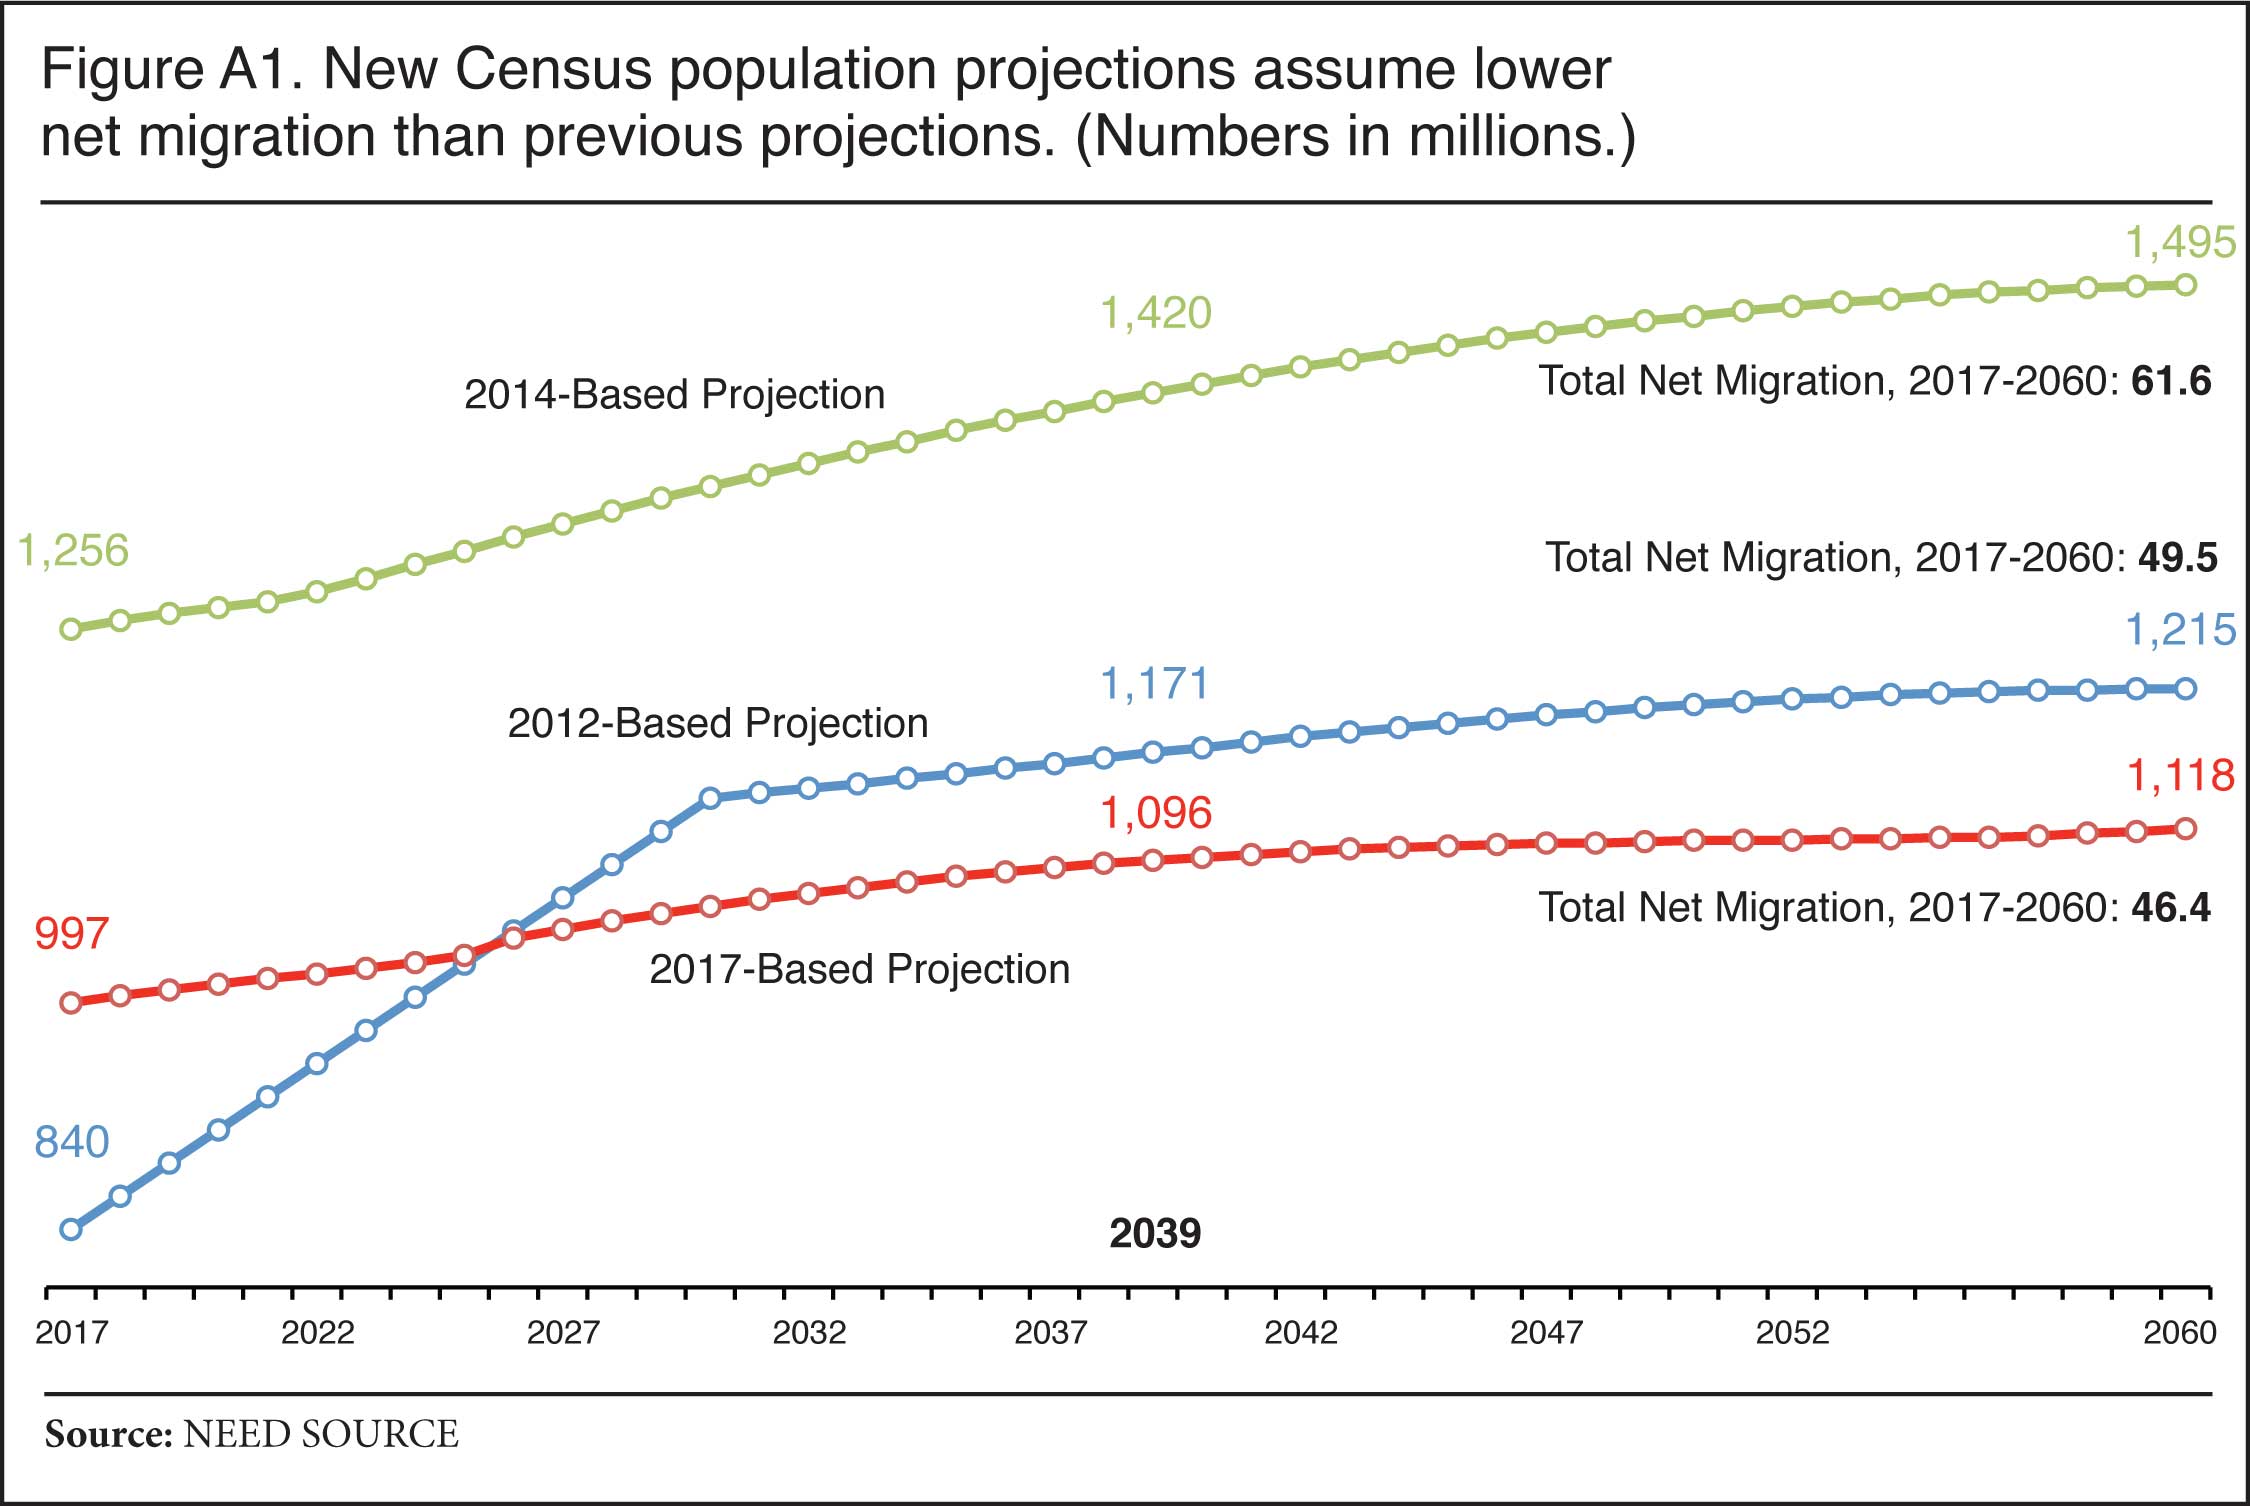
1 Figure A1 in the Appendix reports the level of net migration assumed by the Census Bureau from 2017 to 2060 in its projections from 2012, 2014, and 2017.
2 For more discussion of the problem in the original projections, see the errata statement in "Methodology, Assumptions, and Inputs for the 2017 National Population Projections", Census Bureau, September 2018.
3 Table 8 of the Census Bureau's newest projections reports the foreign-born population for every year, 2017 to 2060. Table 8 shows a share of 14.82 percent in 2027, the highest level ever recorded in American history. Historical numbers from the decennial censuses can be found at the Census Bureau's website. They show that, in 1890, the foreign-born share reached 14.77 percent of the U.S. population and fell for a time, but again reached 14.70 percent in 1910. These two figures represent the highest shares ever recorded.
4 Charles Krauthammer, "Saved by Immigrants", The Washington Post, July 17, 1998, p. A21.
5 Bill Chappell, "'Immigrants Are More Fertile,' Jeb Bush Says In Reform Speech", NPR, June 14, 2013.
6 Olga Khazan, "Immigration Is the Only Reason the U.S. Doesn't Have an Aging Crisis", The Atlantic, January 30, 2014.
7 Carl P. Schmertmann, "Immigrants' Ages and the Structure of Stationary Populations with Below-Replacement Fertility", Demography, Vol. 29, No. 4, November 1992.
8 "Replacement Migration: Is It a Solution to Declining and Ageing Populations?", United Nations, 2001.
9 The 2000 Census Bureau population projections from 2000 can be found here.
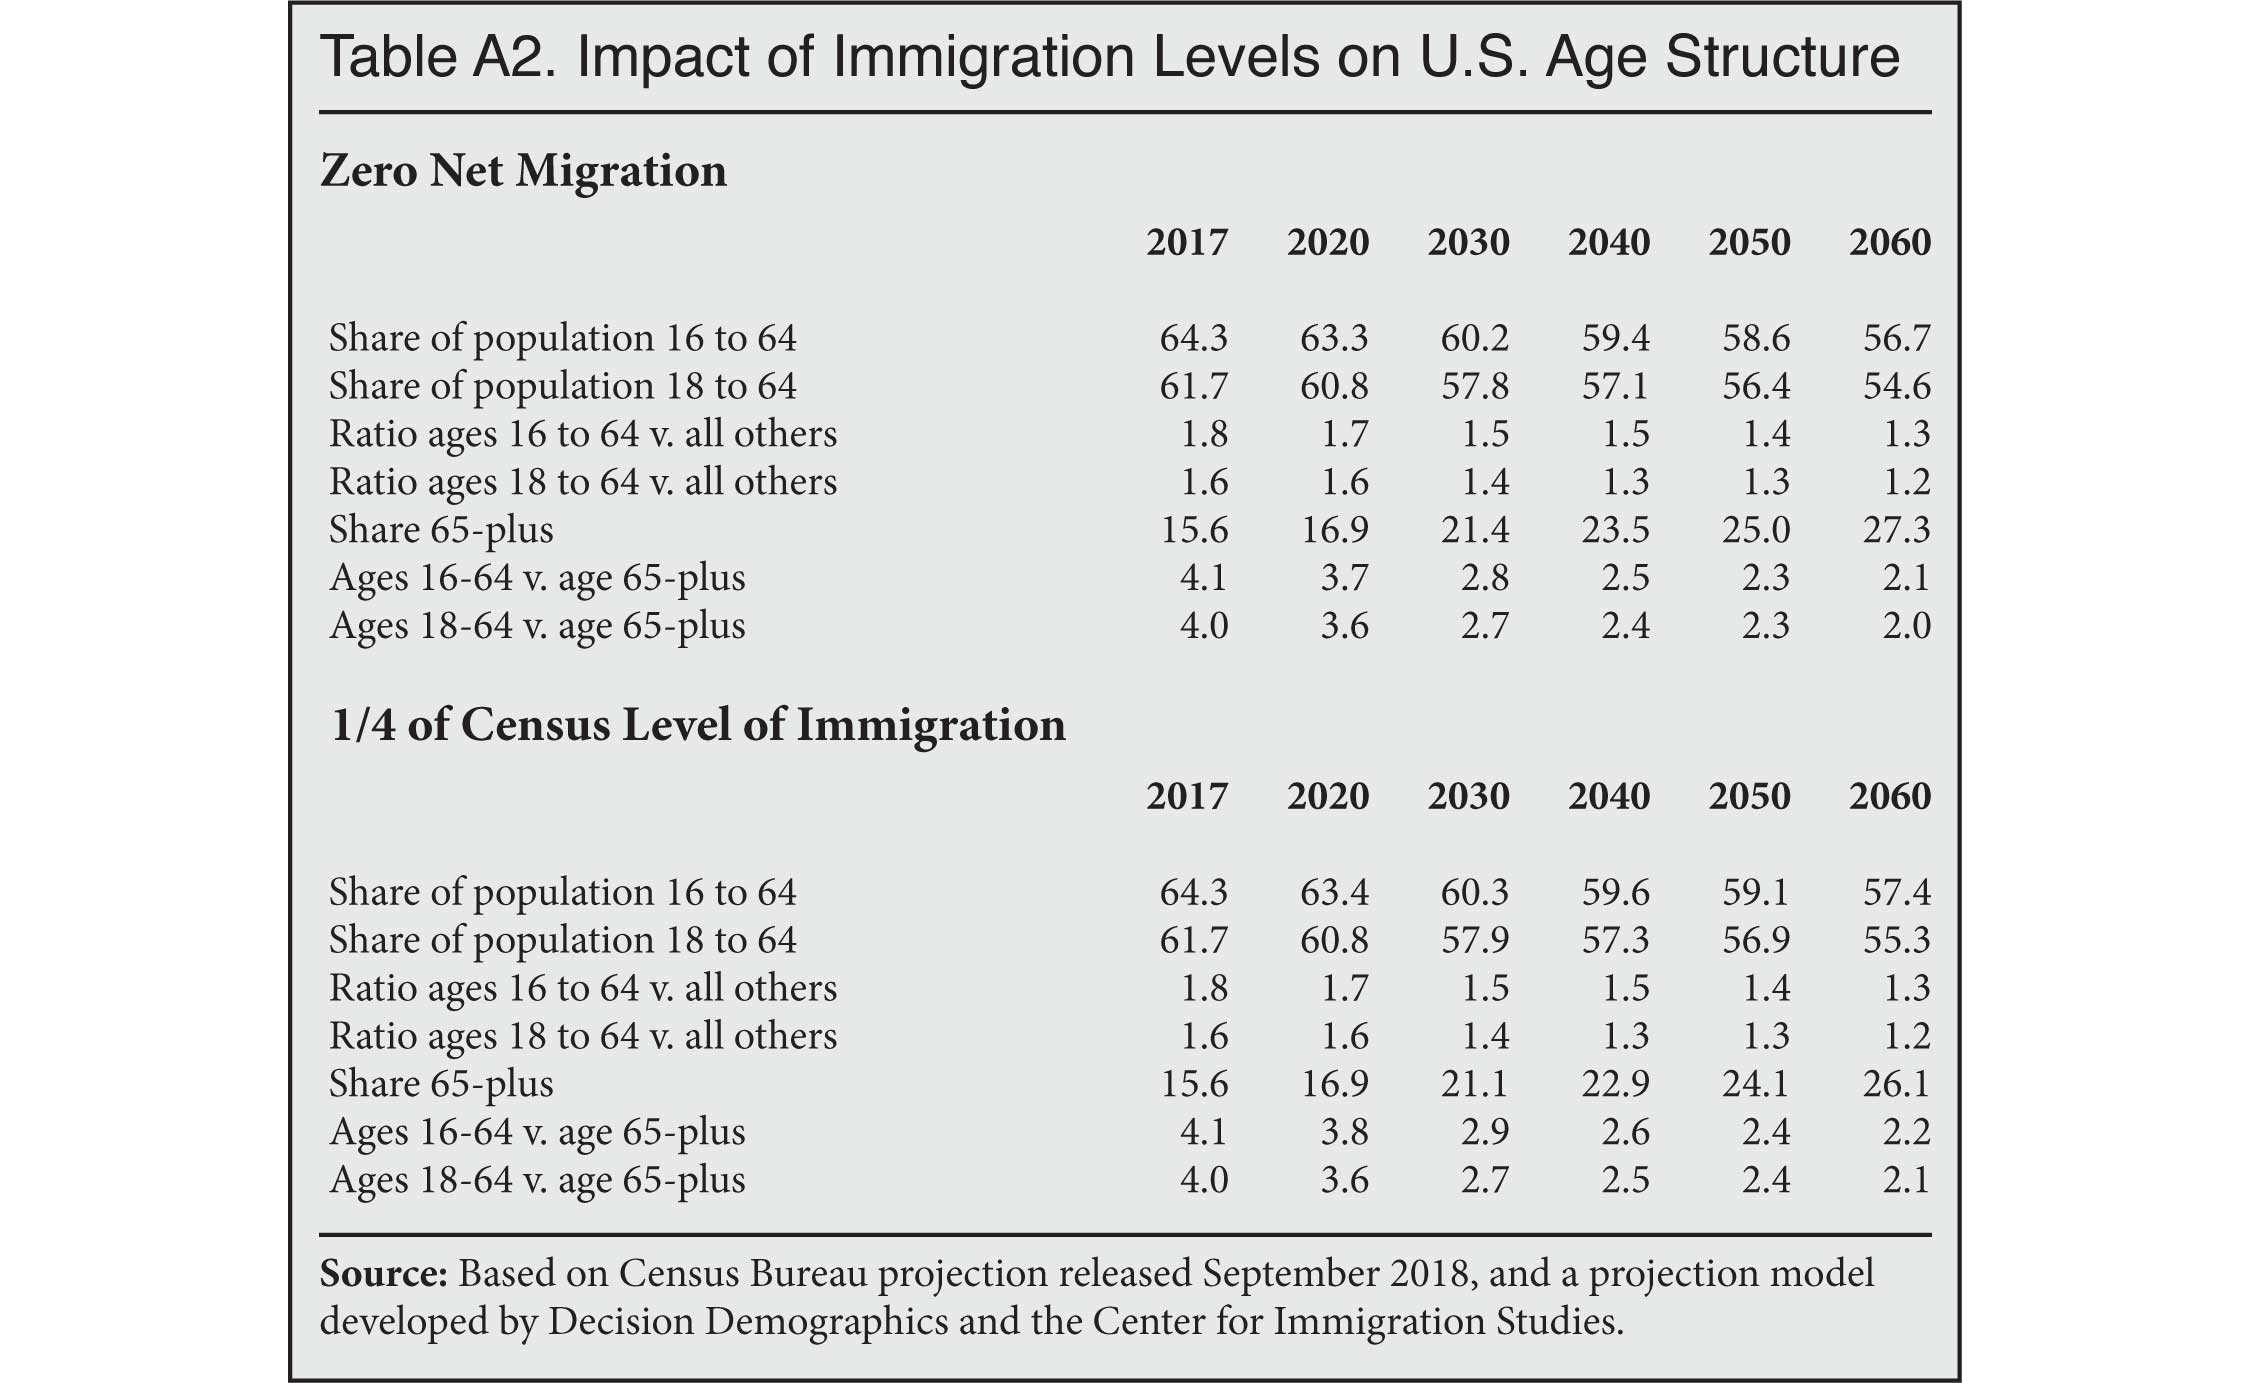
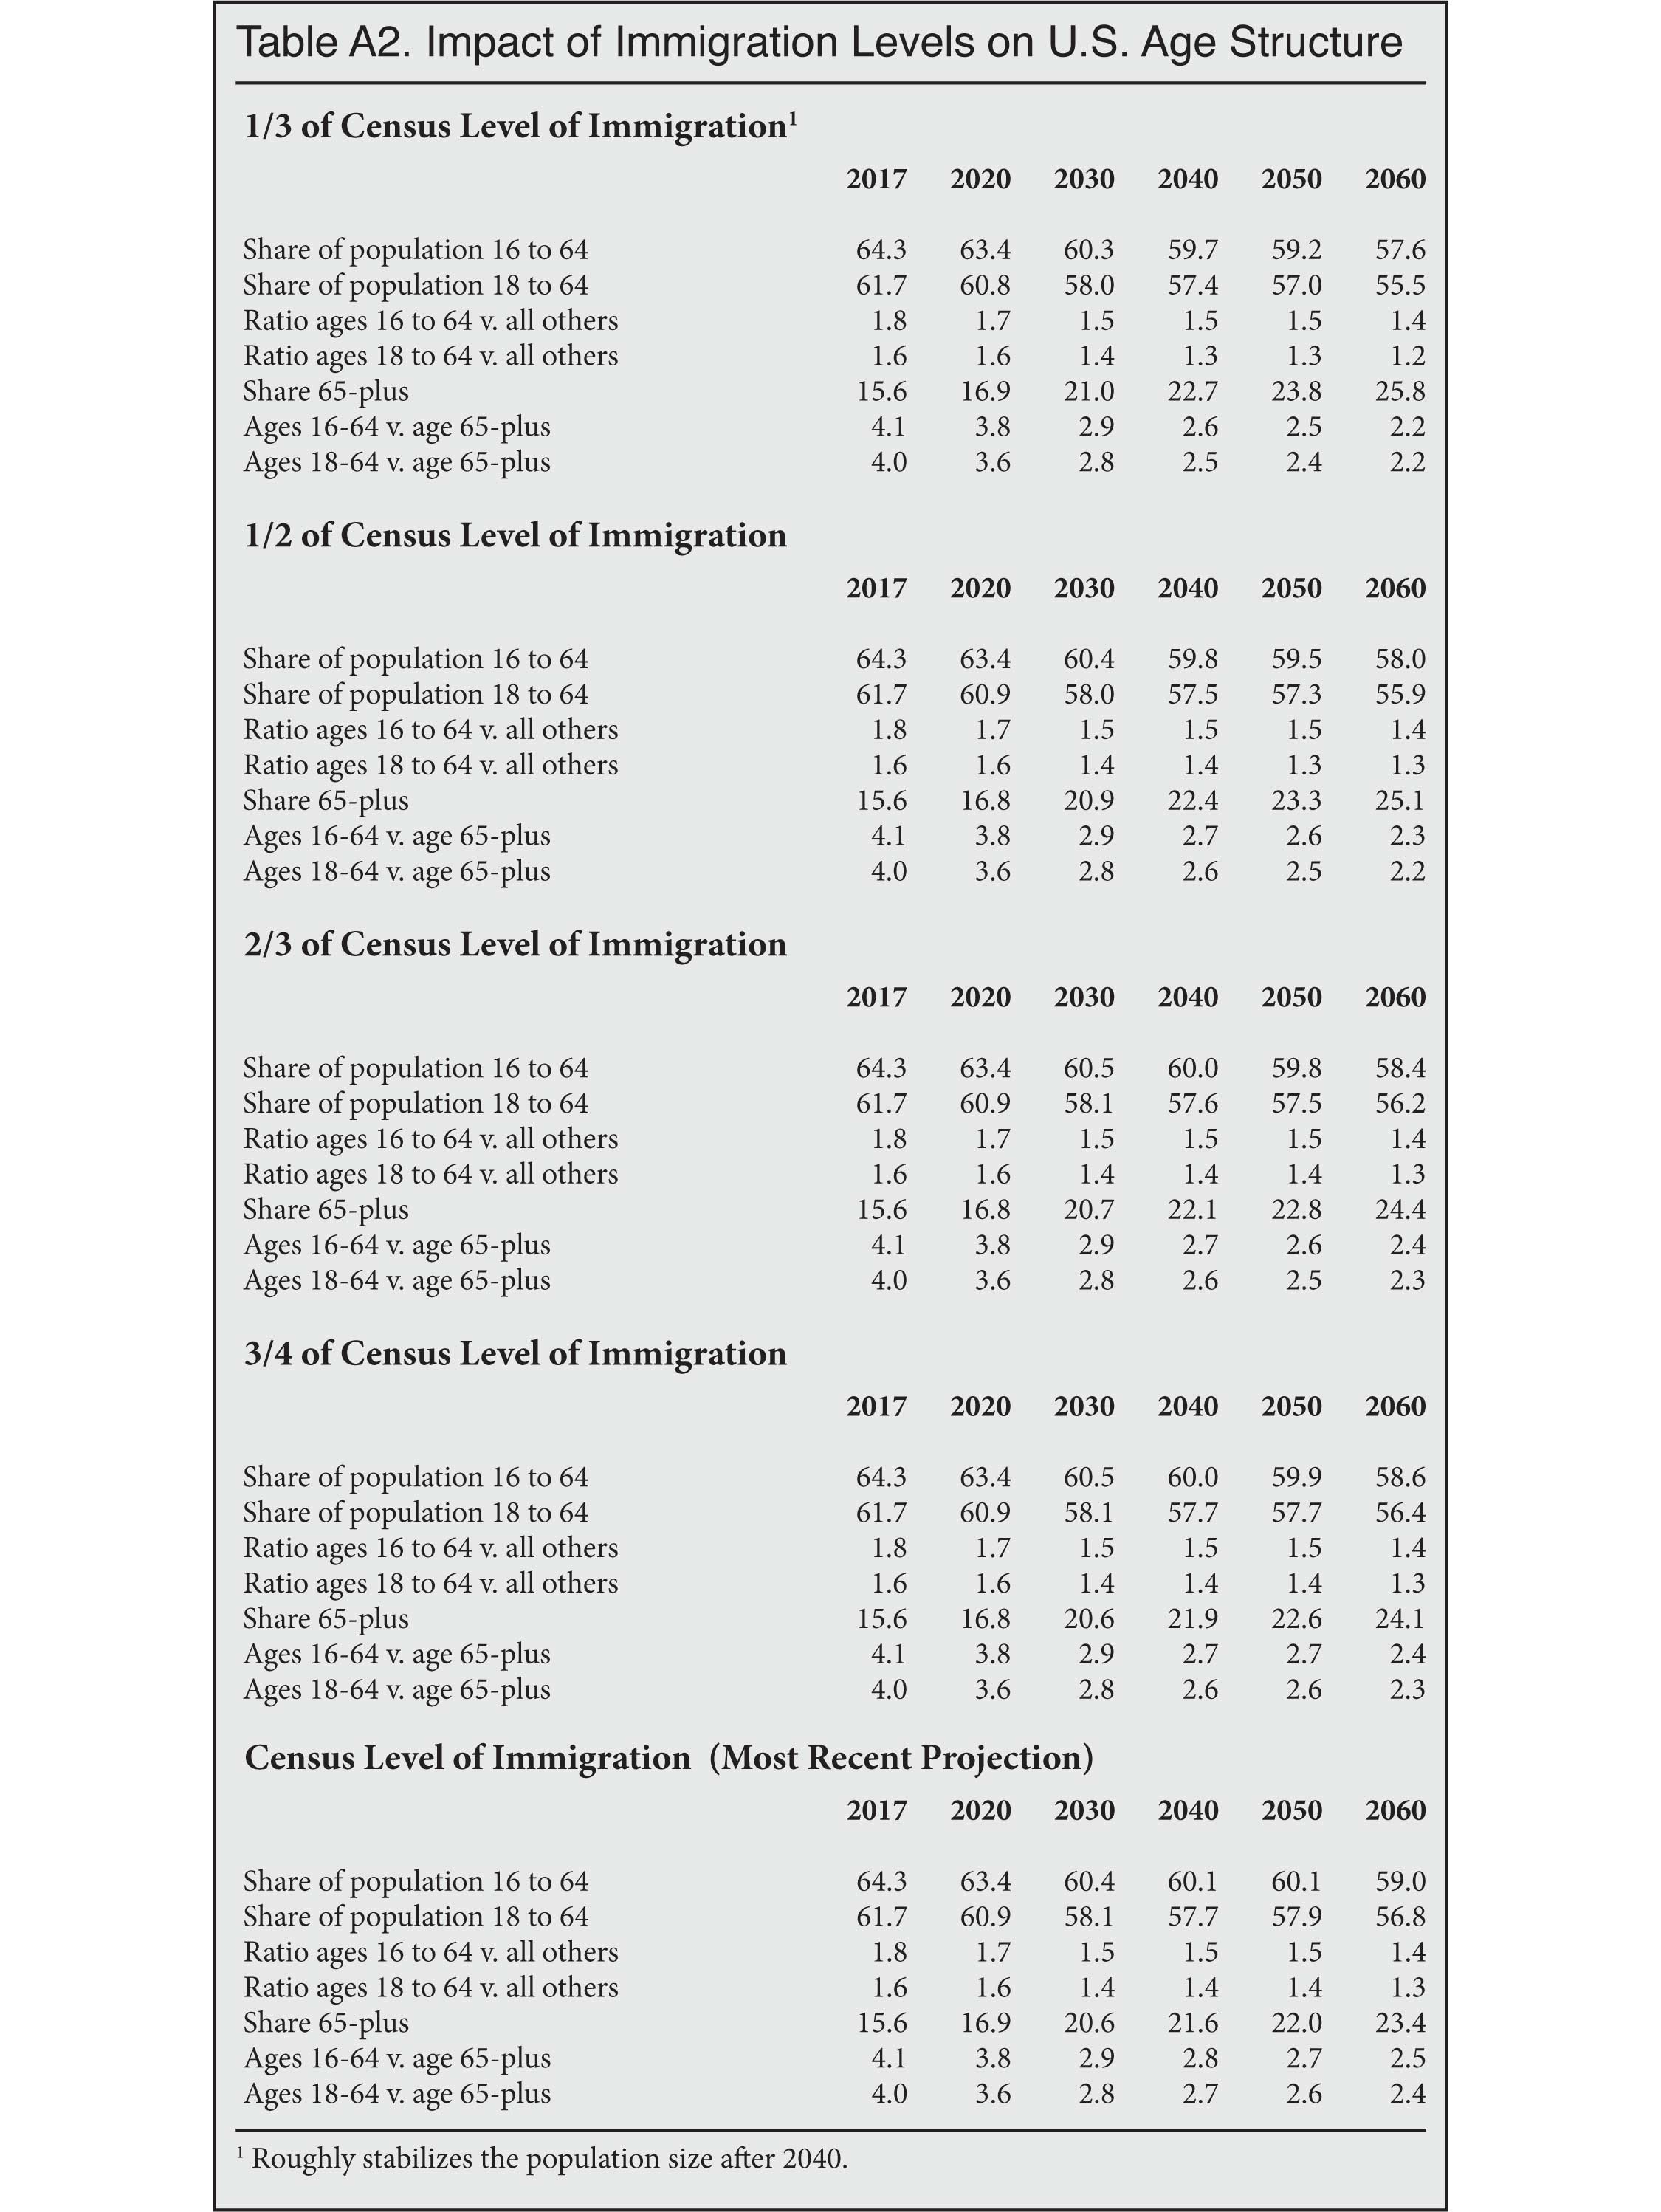
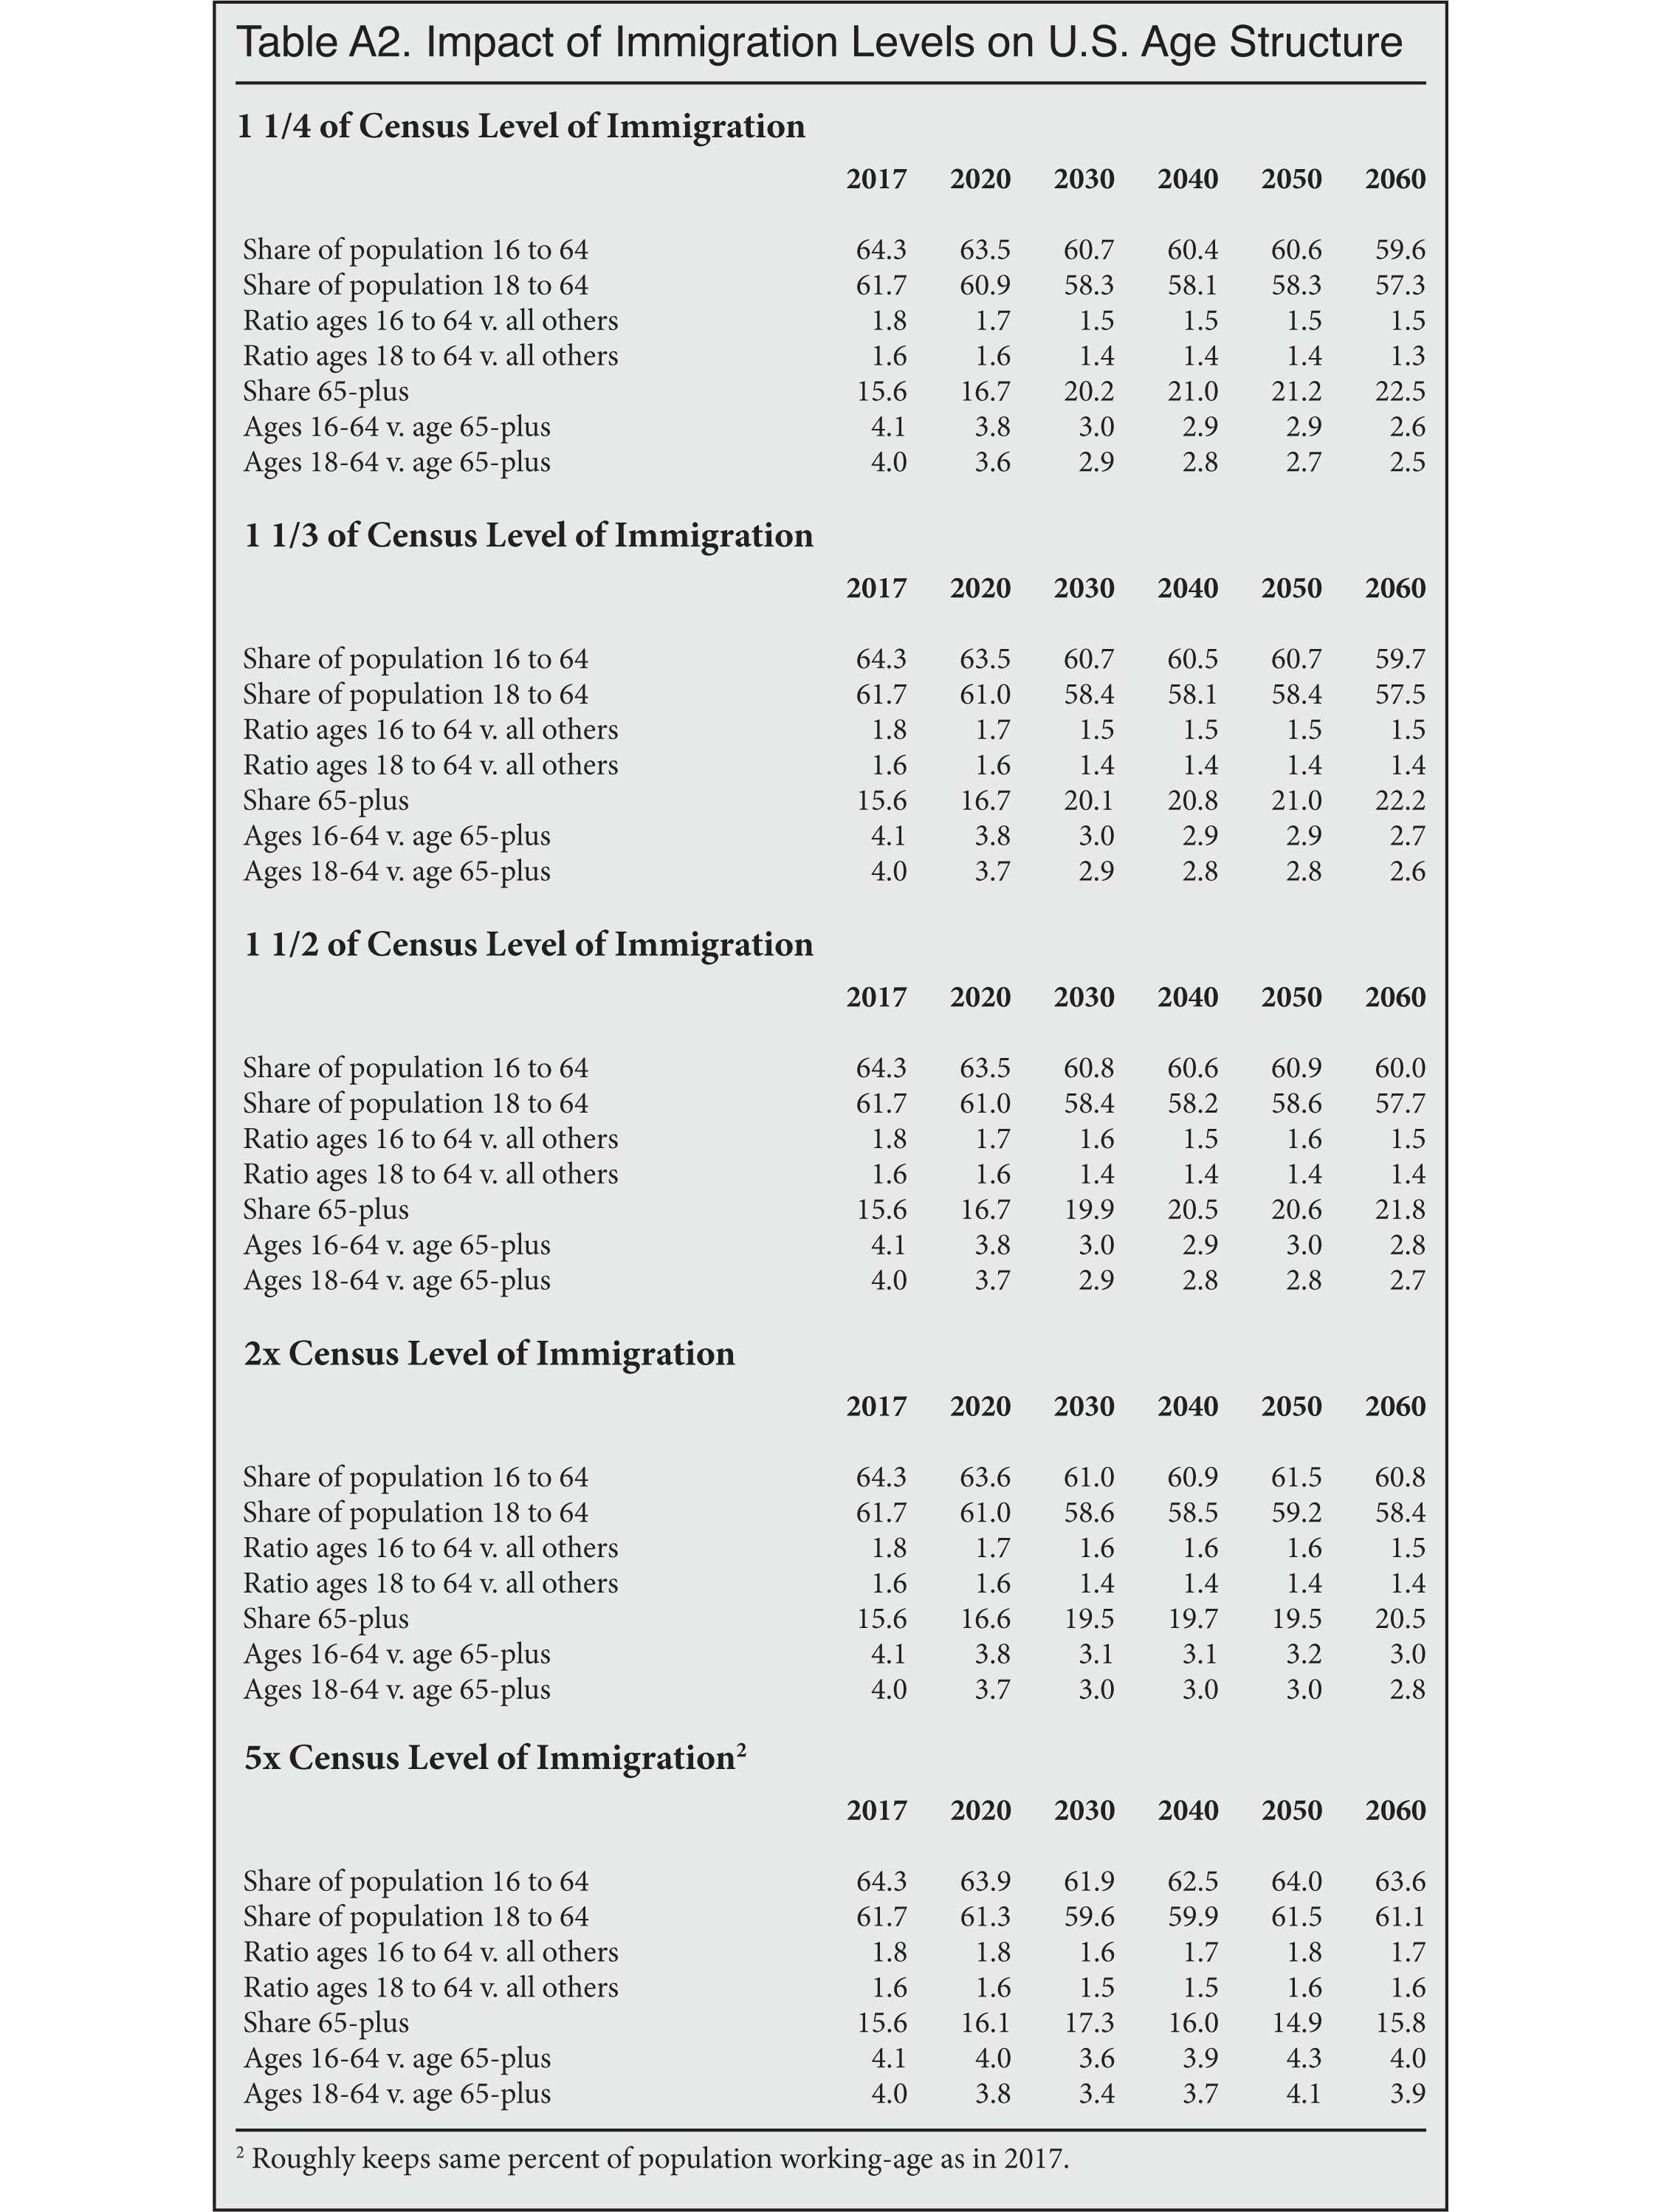
10 In this analysis we focus on the working-age share of the population. However Table A2 in the appendix shows many different measures of the nation's age structure under different immigration scenarios.
11 Table A2 in the appendix reports the working-age share of the population assuming different levels of immigration and the number of potential workers relative to the dependent population. It also reports other measures of the nation's age structure.
12 All figures are from the first quarter (January, February, and March) of the 2000, 2007, and 2018 Current Population Surveys.
13 The public-use files of both the American Community Survey and the Current Population Survey show very similar percentages of working-age people employed.
14 Steven A. Camarota and Karen Zeigler, "Immigration Continues to Surge: A look at arrival data from the American Community Survey", Center for Immigration Studies Backgrounder, October 2018.
15 "2017 National Population Projections Tables", U.S. Census Bureau, last revised: September 6, 2018. Accessed December 10, 2018.
16 "2014 National Population Projections Datasets", U.S. Census Bureau, last revised April 6, 2017. Accessed November 29, 2017.
These projections were developed by Decision Demographics in consultation with the Center for Immigration Studies. The Center would like to thank the researchers at Decision Demographics for their contributions.