Download a PDF of this Backgrounder.
Steven A. Camarota is the director of research and Karen Zeigler is a demographer at the Center.
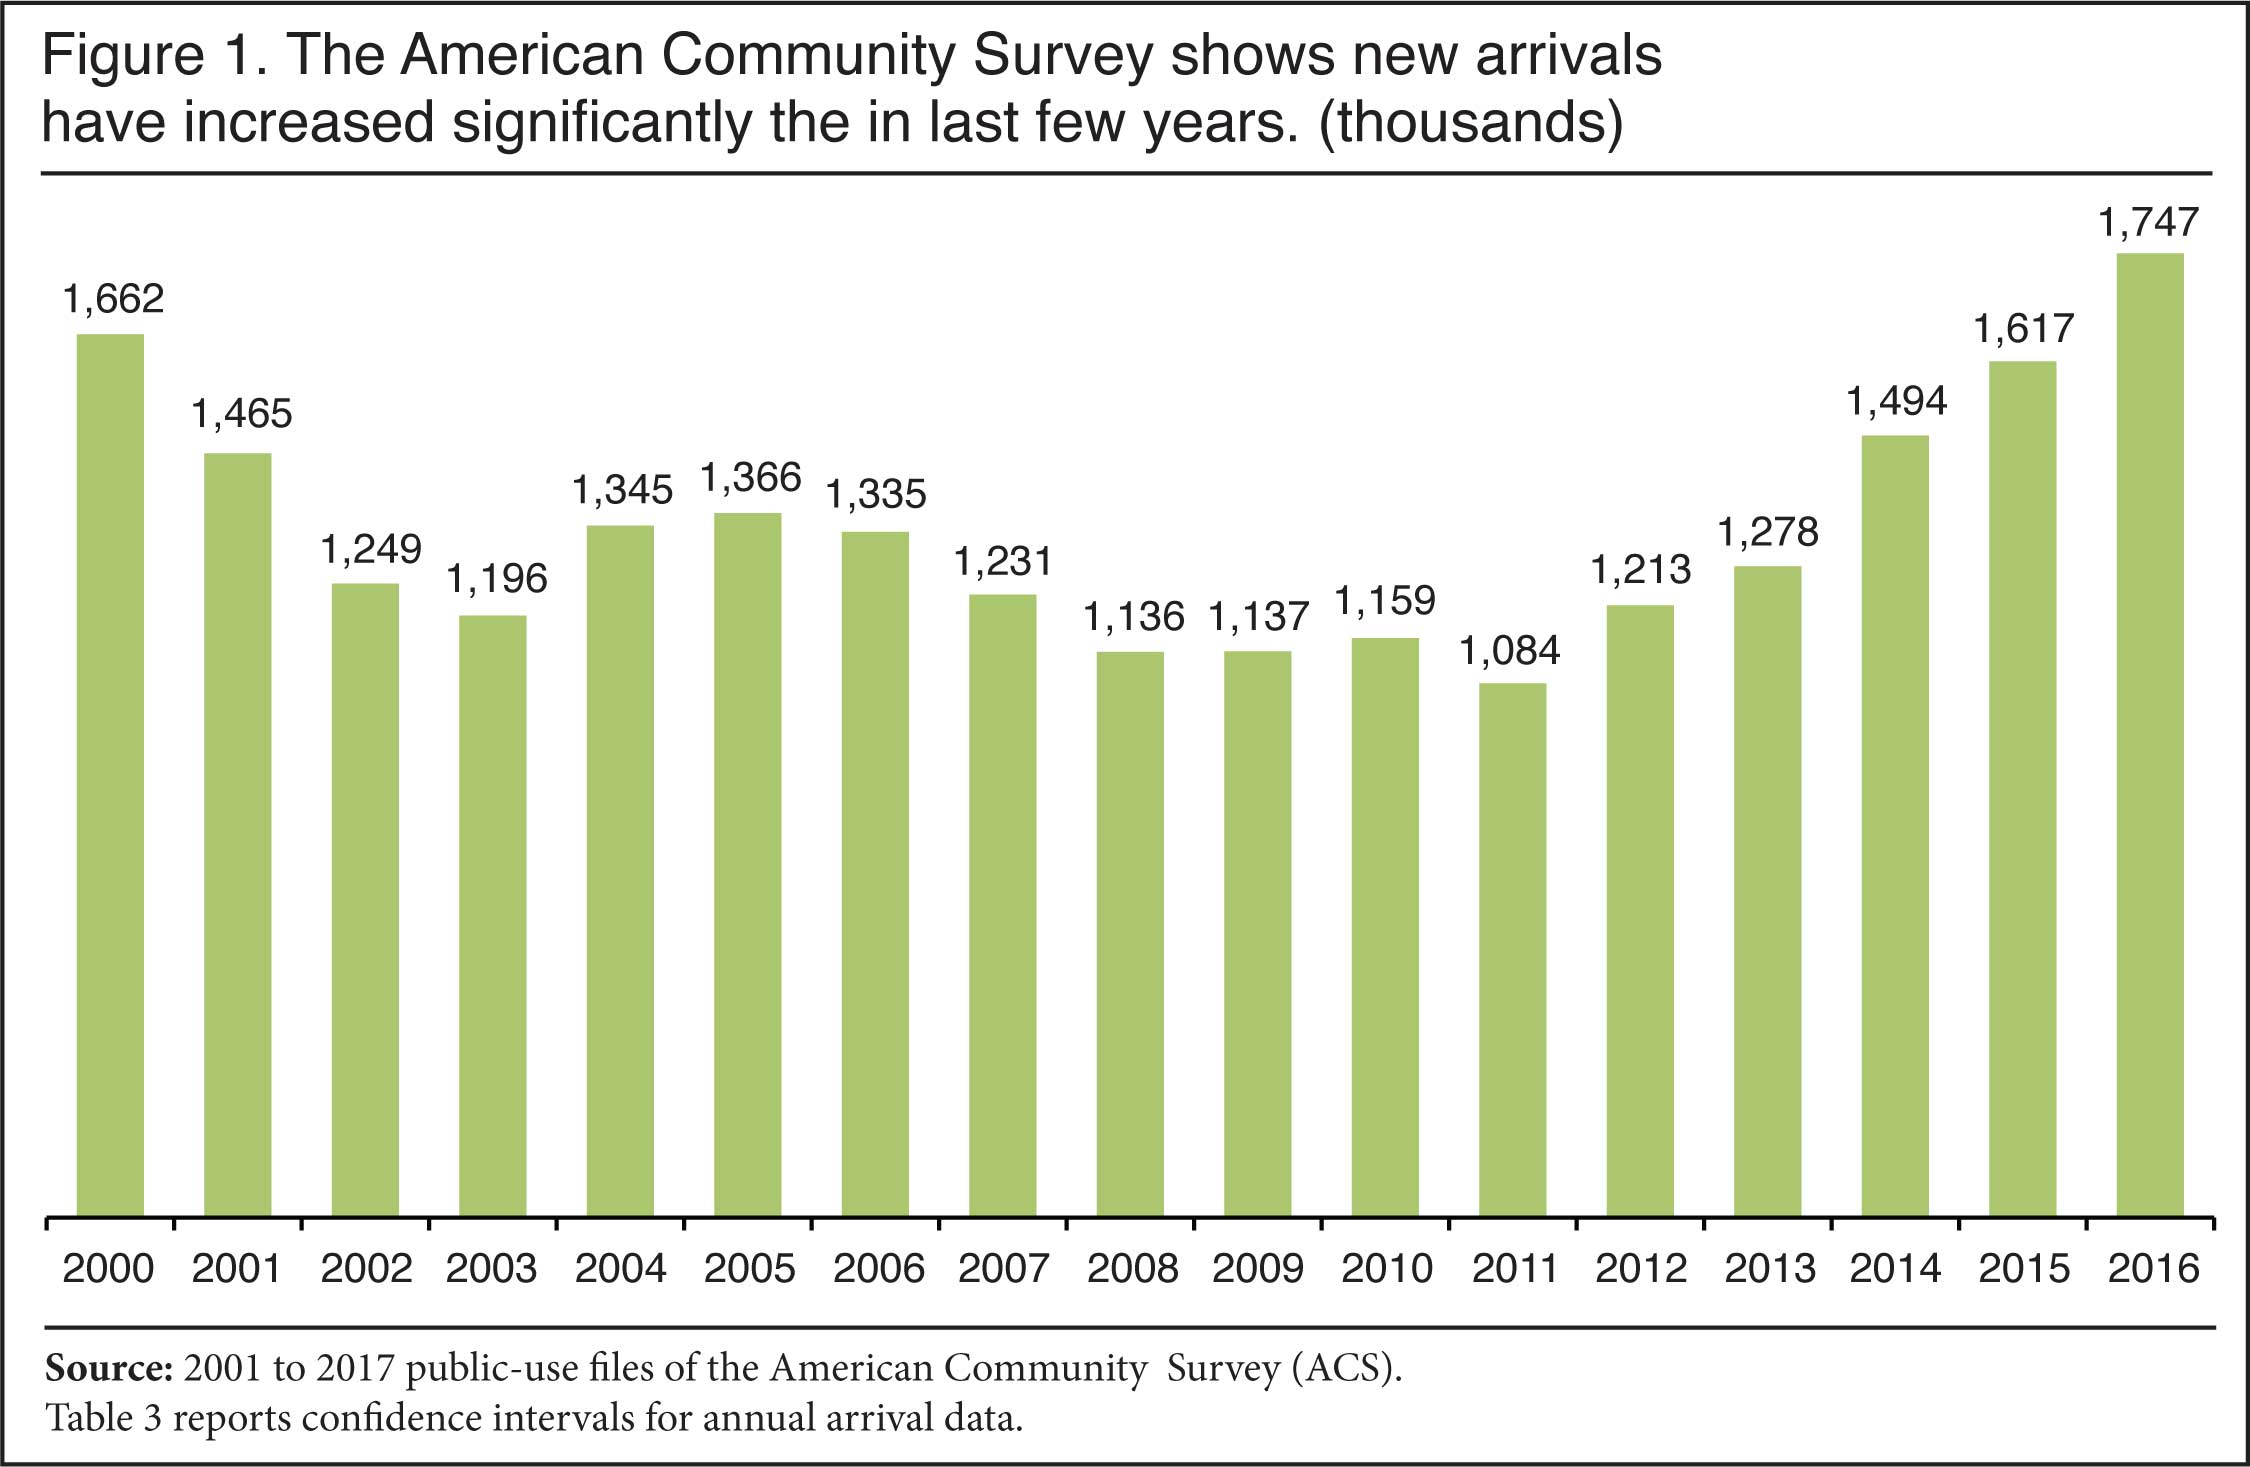
Newly released data show that 2016 tied with 1999 as the highest single year of immigration in U.S. history, with the arrival of 1.75 million new immigrants (both legal and illegal).1 The new numbers represent a continuation of the dramatic rebound in new arrivals since 2011, when annual immigration bottomed out after the Great Recession. Newly arrived immigrants include new green card recipients (permanent residents) and long-term "temporary" visitors (e.g. guestworkers and foreign students), many of whom eventually become permanent residents. They also include new asylum seekers, as well as new illegal immigrants who sneak into the country or overstay a temporary visa.
Among the findings:
- The arrival of 1.75 million immigrants (legal and illegal) in 2016 continues the post-2011 surge in immigration. In 2011 it was 1.08 million; in 2012 it was 1.21 million; in 2013 it was 1.28 million; in 2014 it was 1.5 million; and in 2015 it was 1.62 million. (Figure 1)
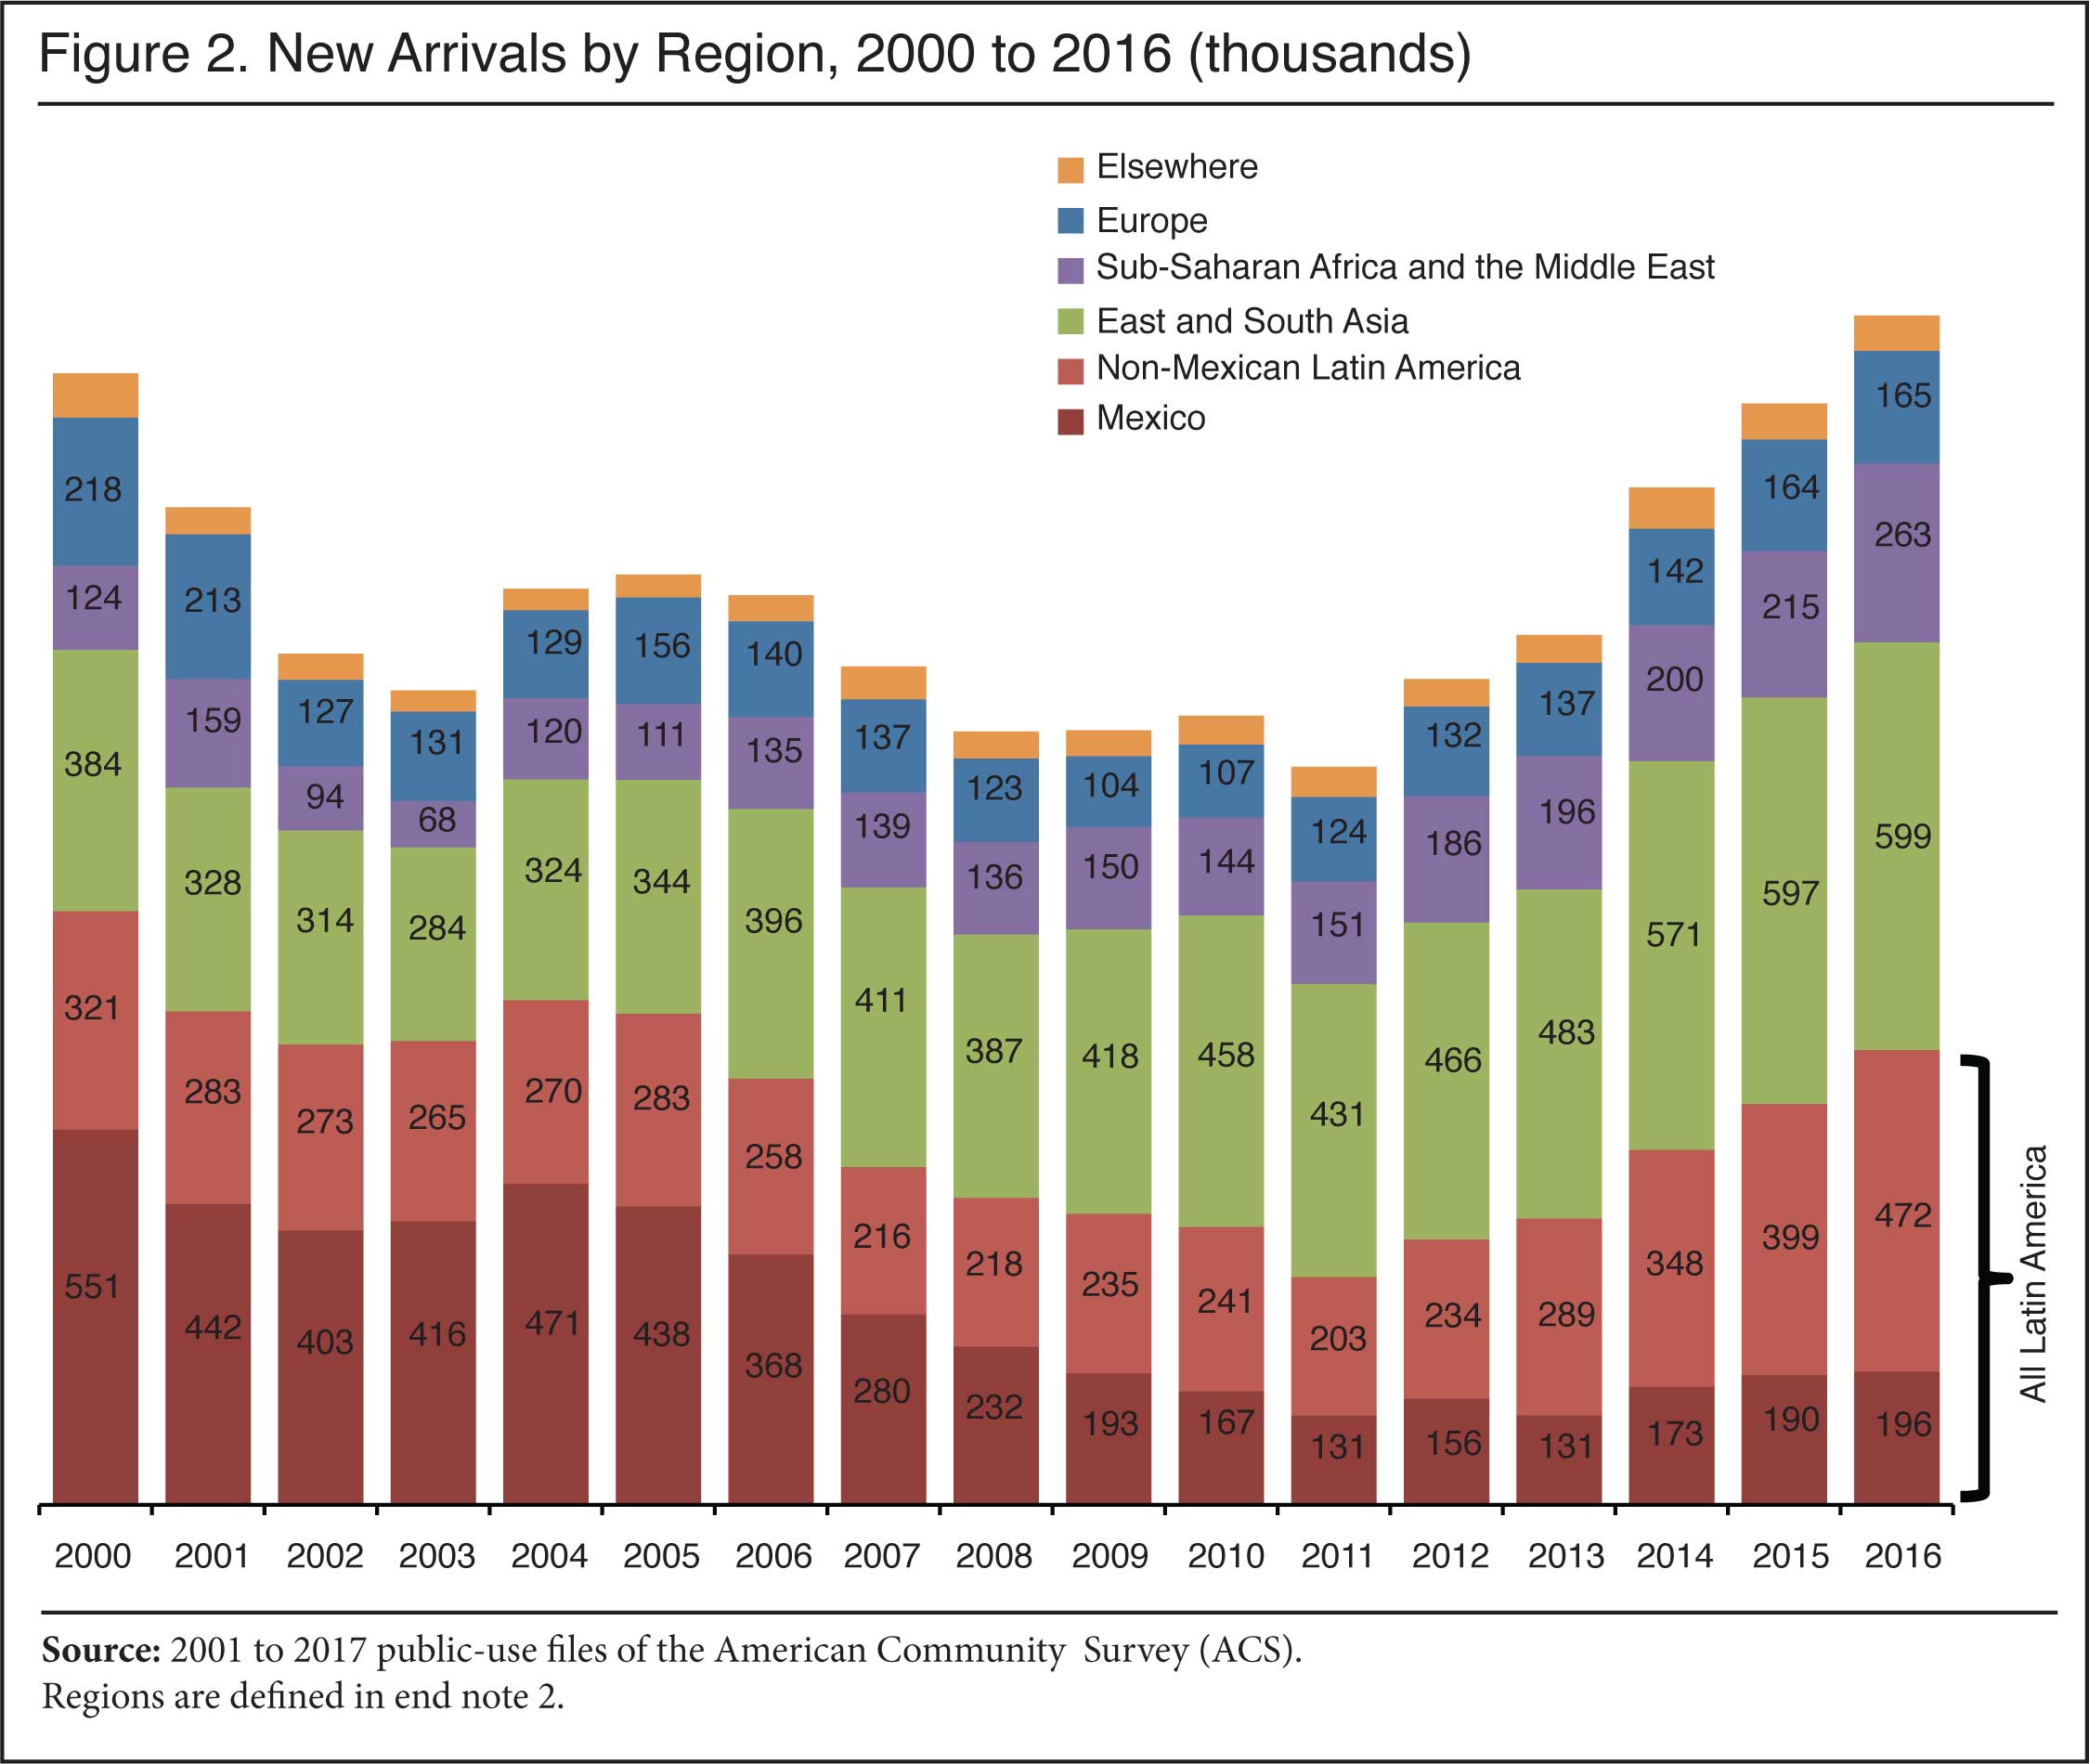
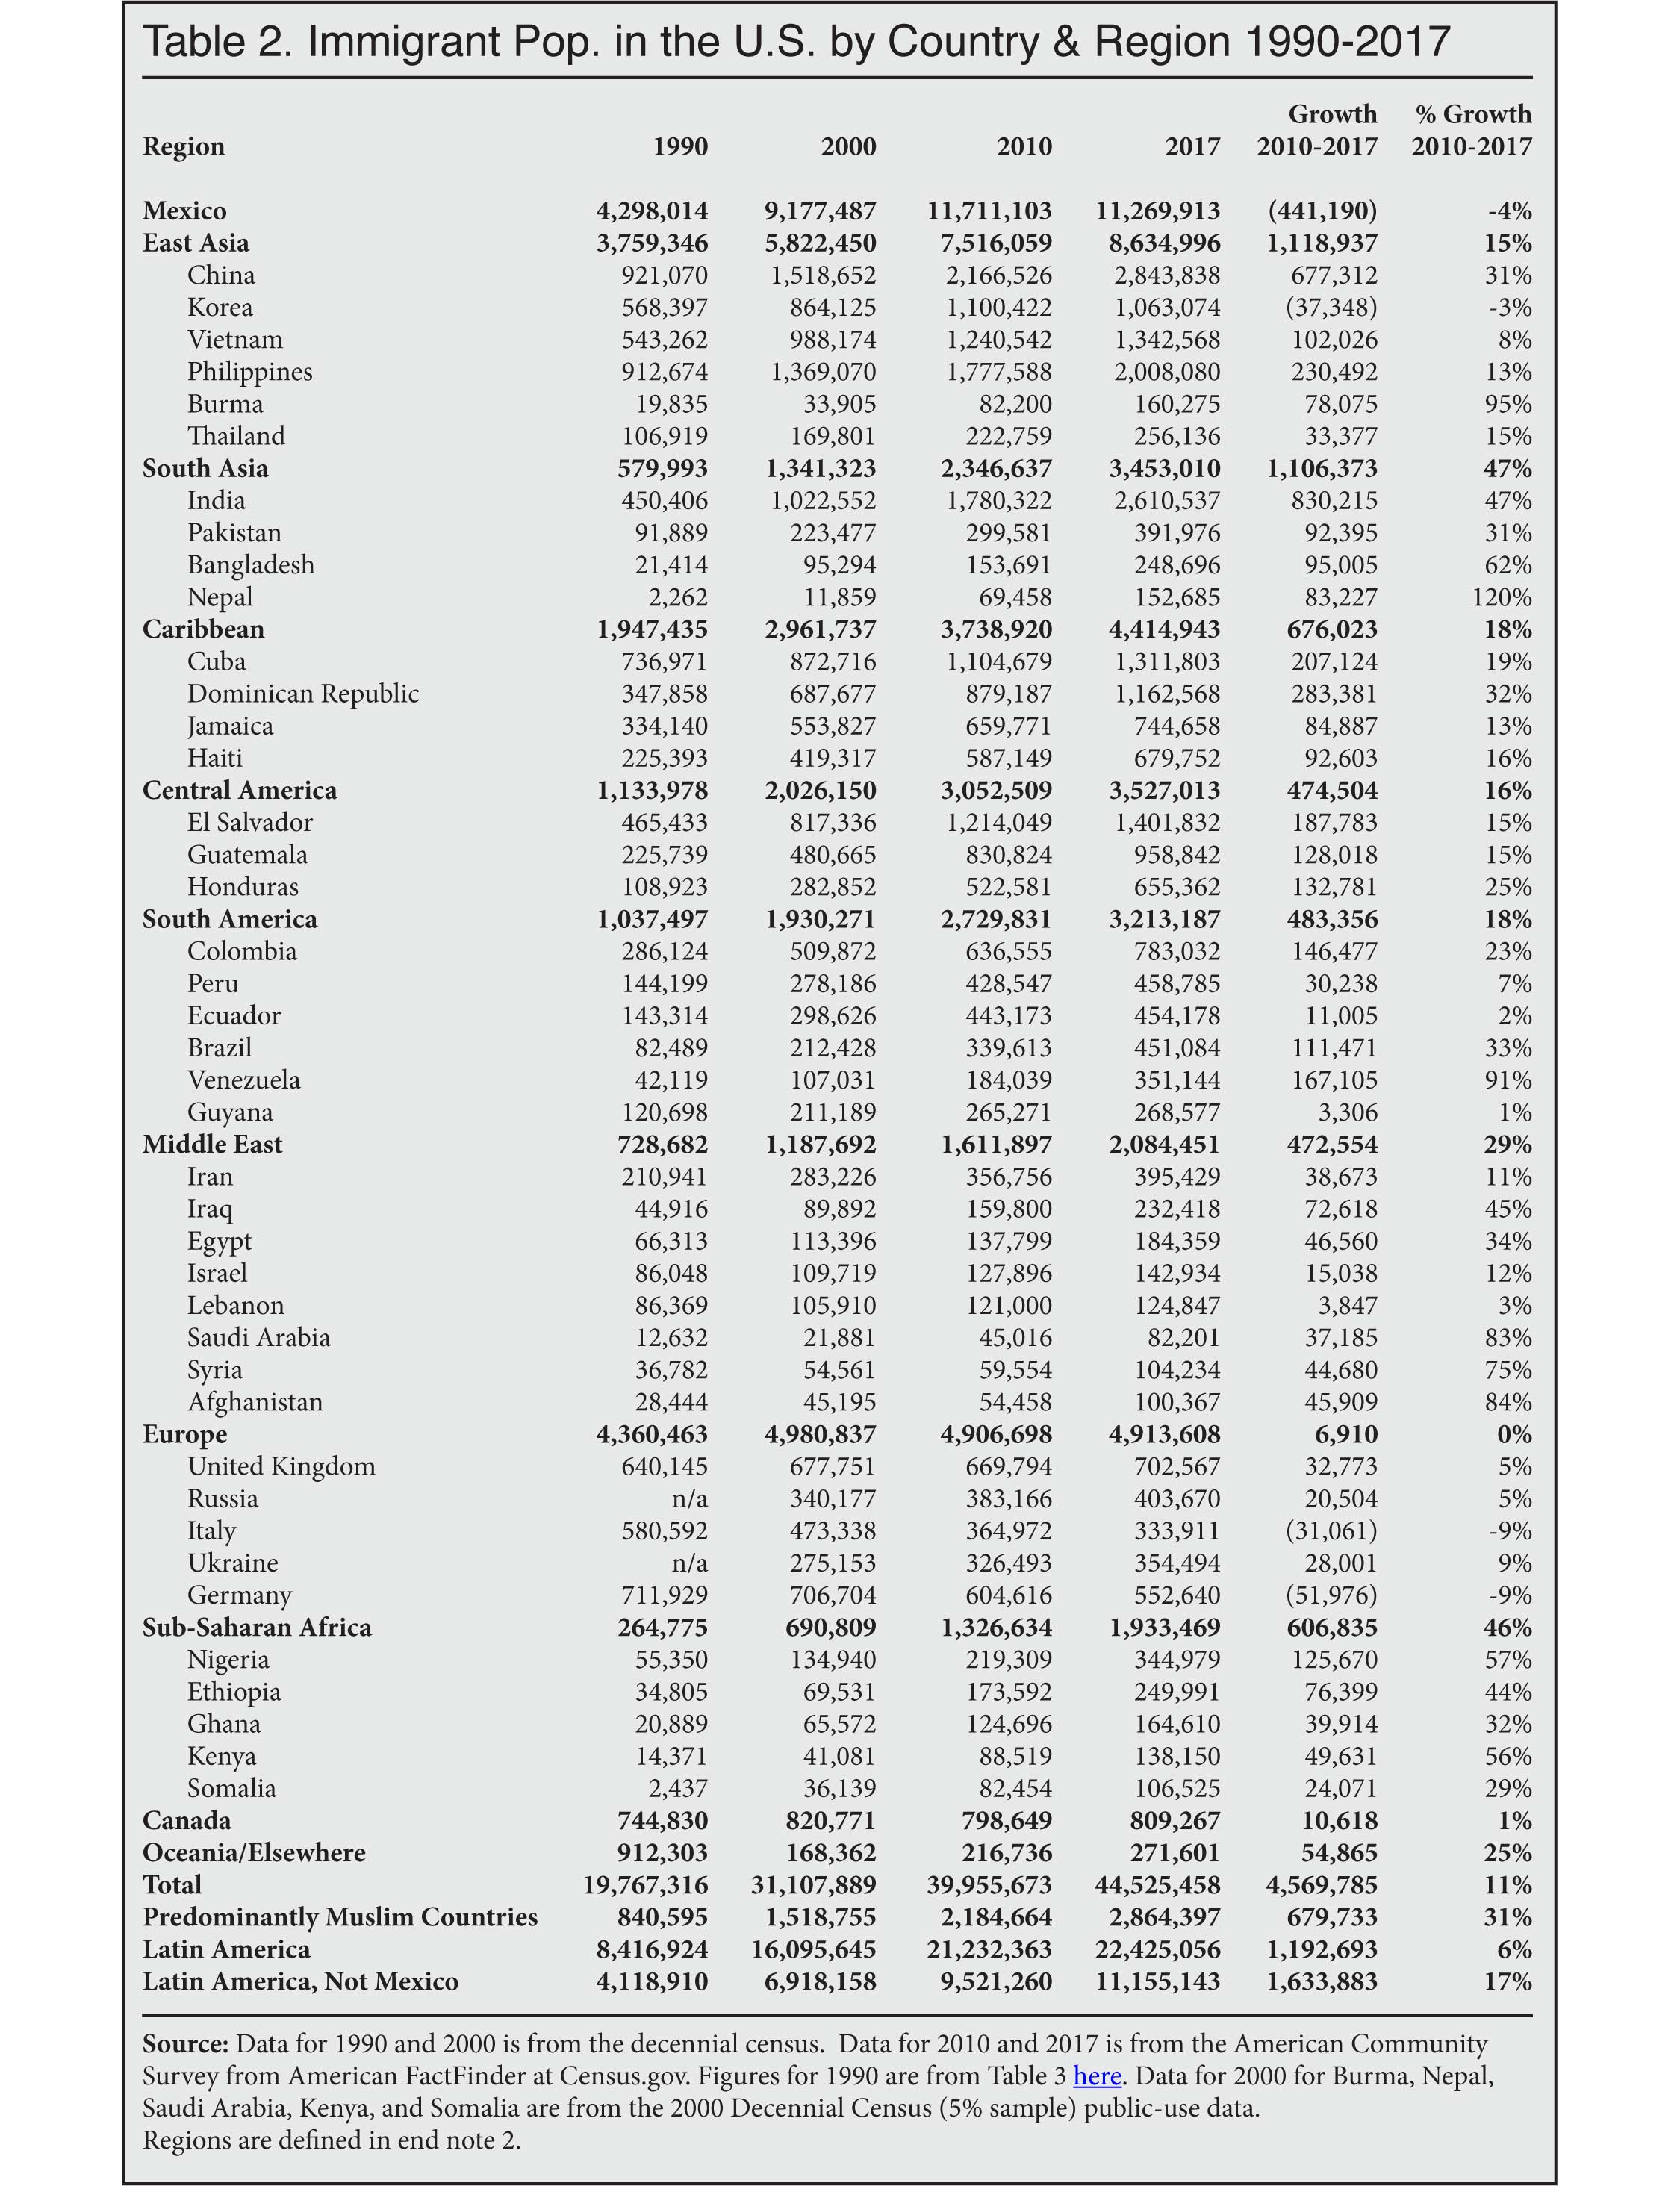
- Half of the increase in new arrivals (legal and illegal) since 2011 has been from Latin America, which doubled from 335,000 in that year to 668,000 in 2016. (Figure 2, Table 1)
- Latin America surpassed Asia (East Asia and South Asia combined) as the top sending-region in 2016. Asia had been the top sending-region since 2010. (Figure 2, Table 1)
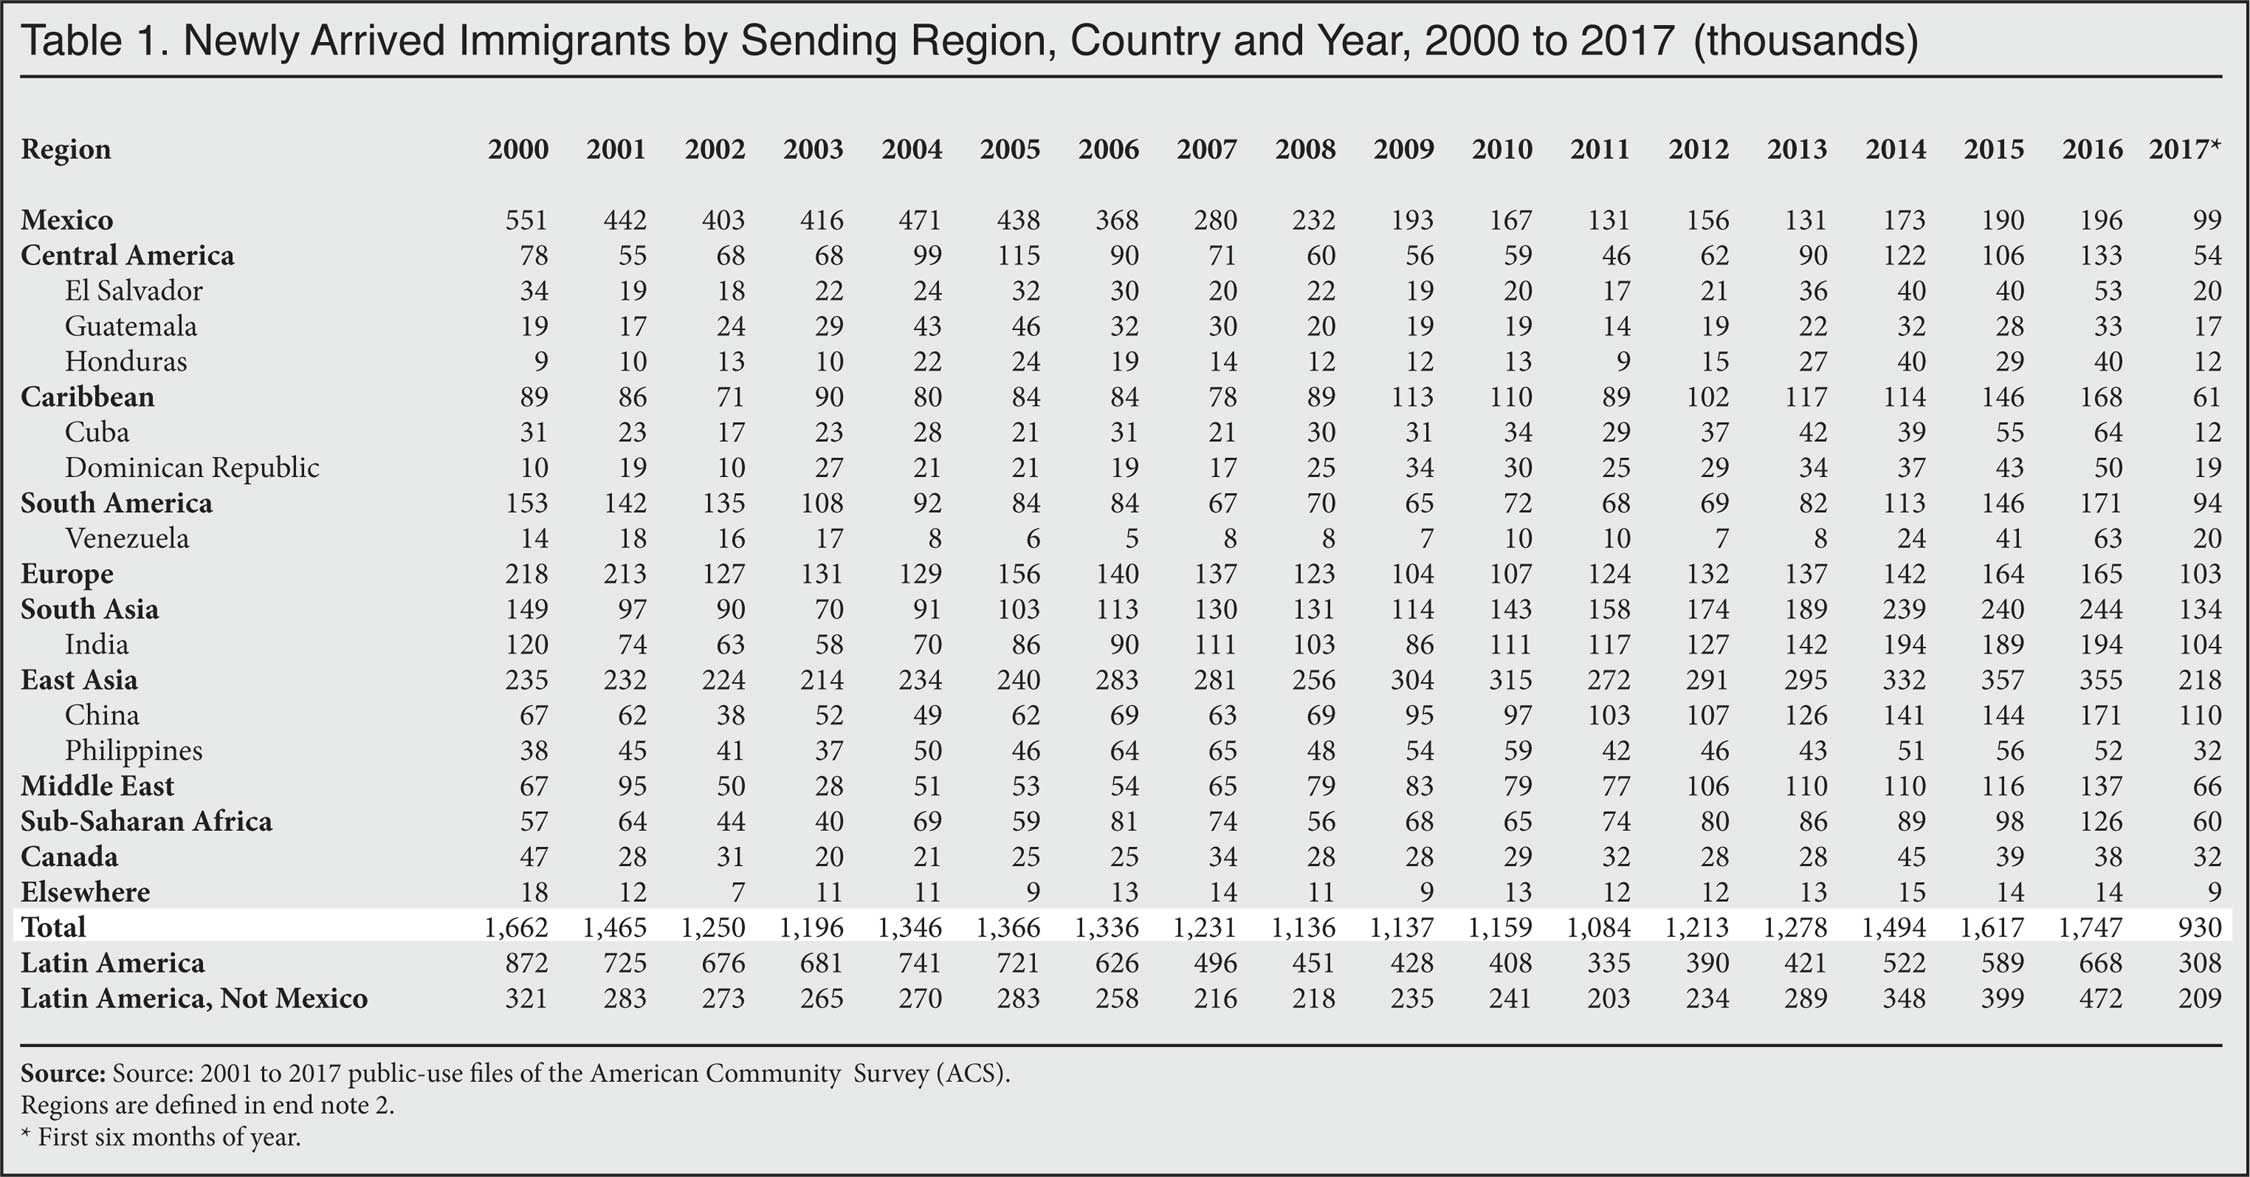
- Annual immigration from Central America alone has nearly tripled, from 46,000 in 2011 to 133,000 new arrivals in 2016. This reflects in part the dramatic increase in illegal immigrant families from Central America crossing the southern border. (Table 1)
- Compared to 2011, new immigration (legal and illegal) from South America is up by 250 percent, to 171,000 in 2016, and new arrivals from the Caribbean roughly doubled to 168,000 over the same time period. (Table 1)
- Other regions showing a large increase in new annual arrivals since 2011 are South Asia (Indian subcontinent), up 54 percent to 244,000 in 2016; East Asia, up 30 percent to 355,000 in 2016; and the Middle East, up 78 percent to 137,000.2 (Table 1)
- Mexico and India are in a statistical tie as the top sending countries, with 196,000 and 194,000, respectively, arriving in 2016. China was third, with 171,000 new immigrants. (Table 1)
- While the number of new arrivals from Mexico has increased nearly 50 percent since 2011, the number coming remains well below the annual level of more than a decade ago, when 400,000 to 500,000 new arrivals (legal and illegal) came from our southern neighbor each year.
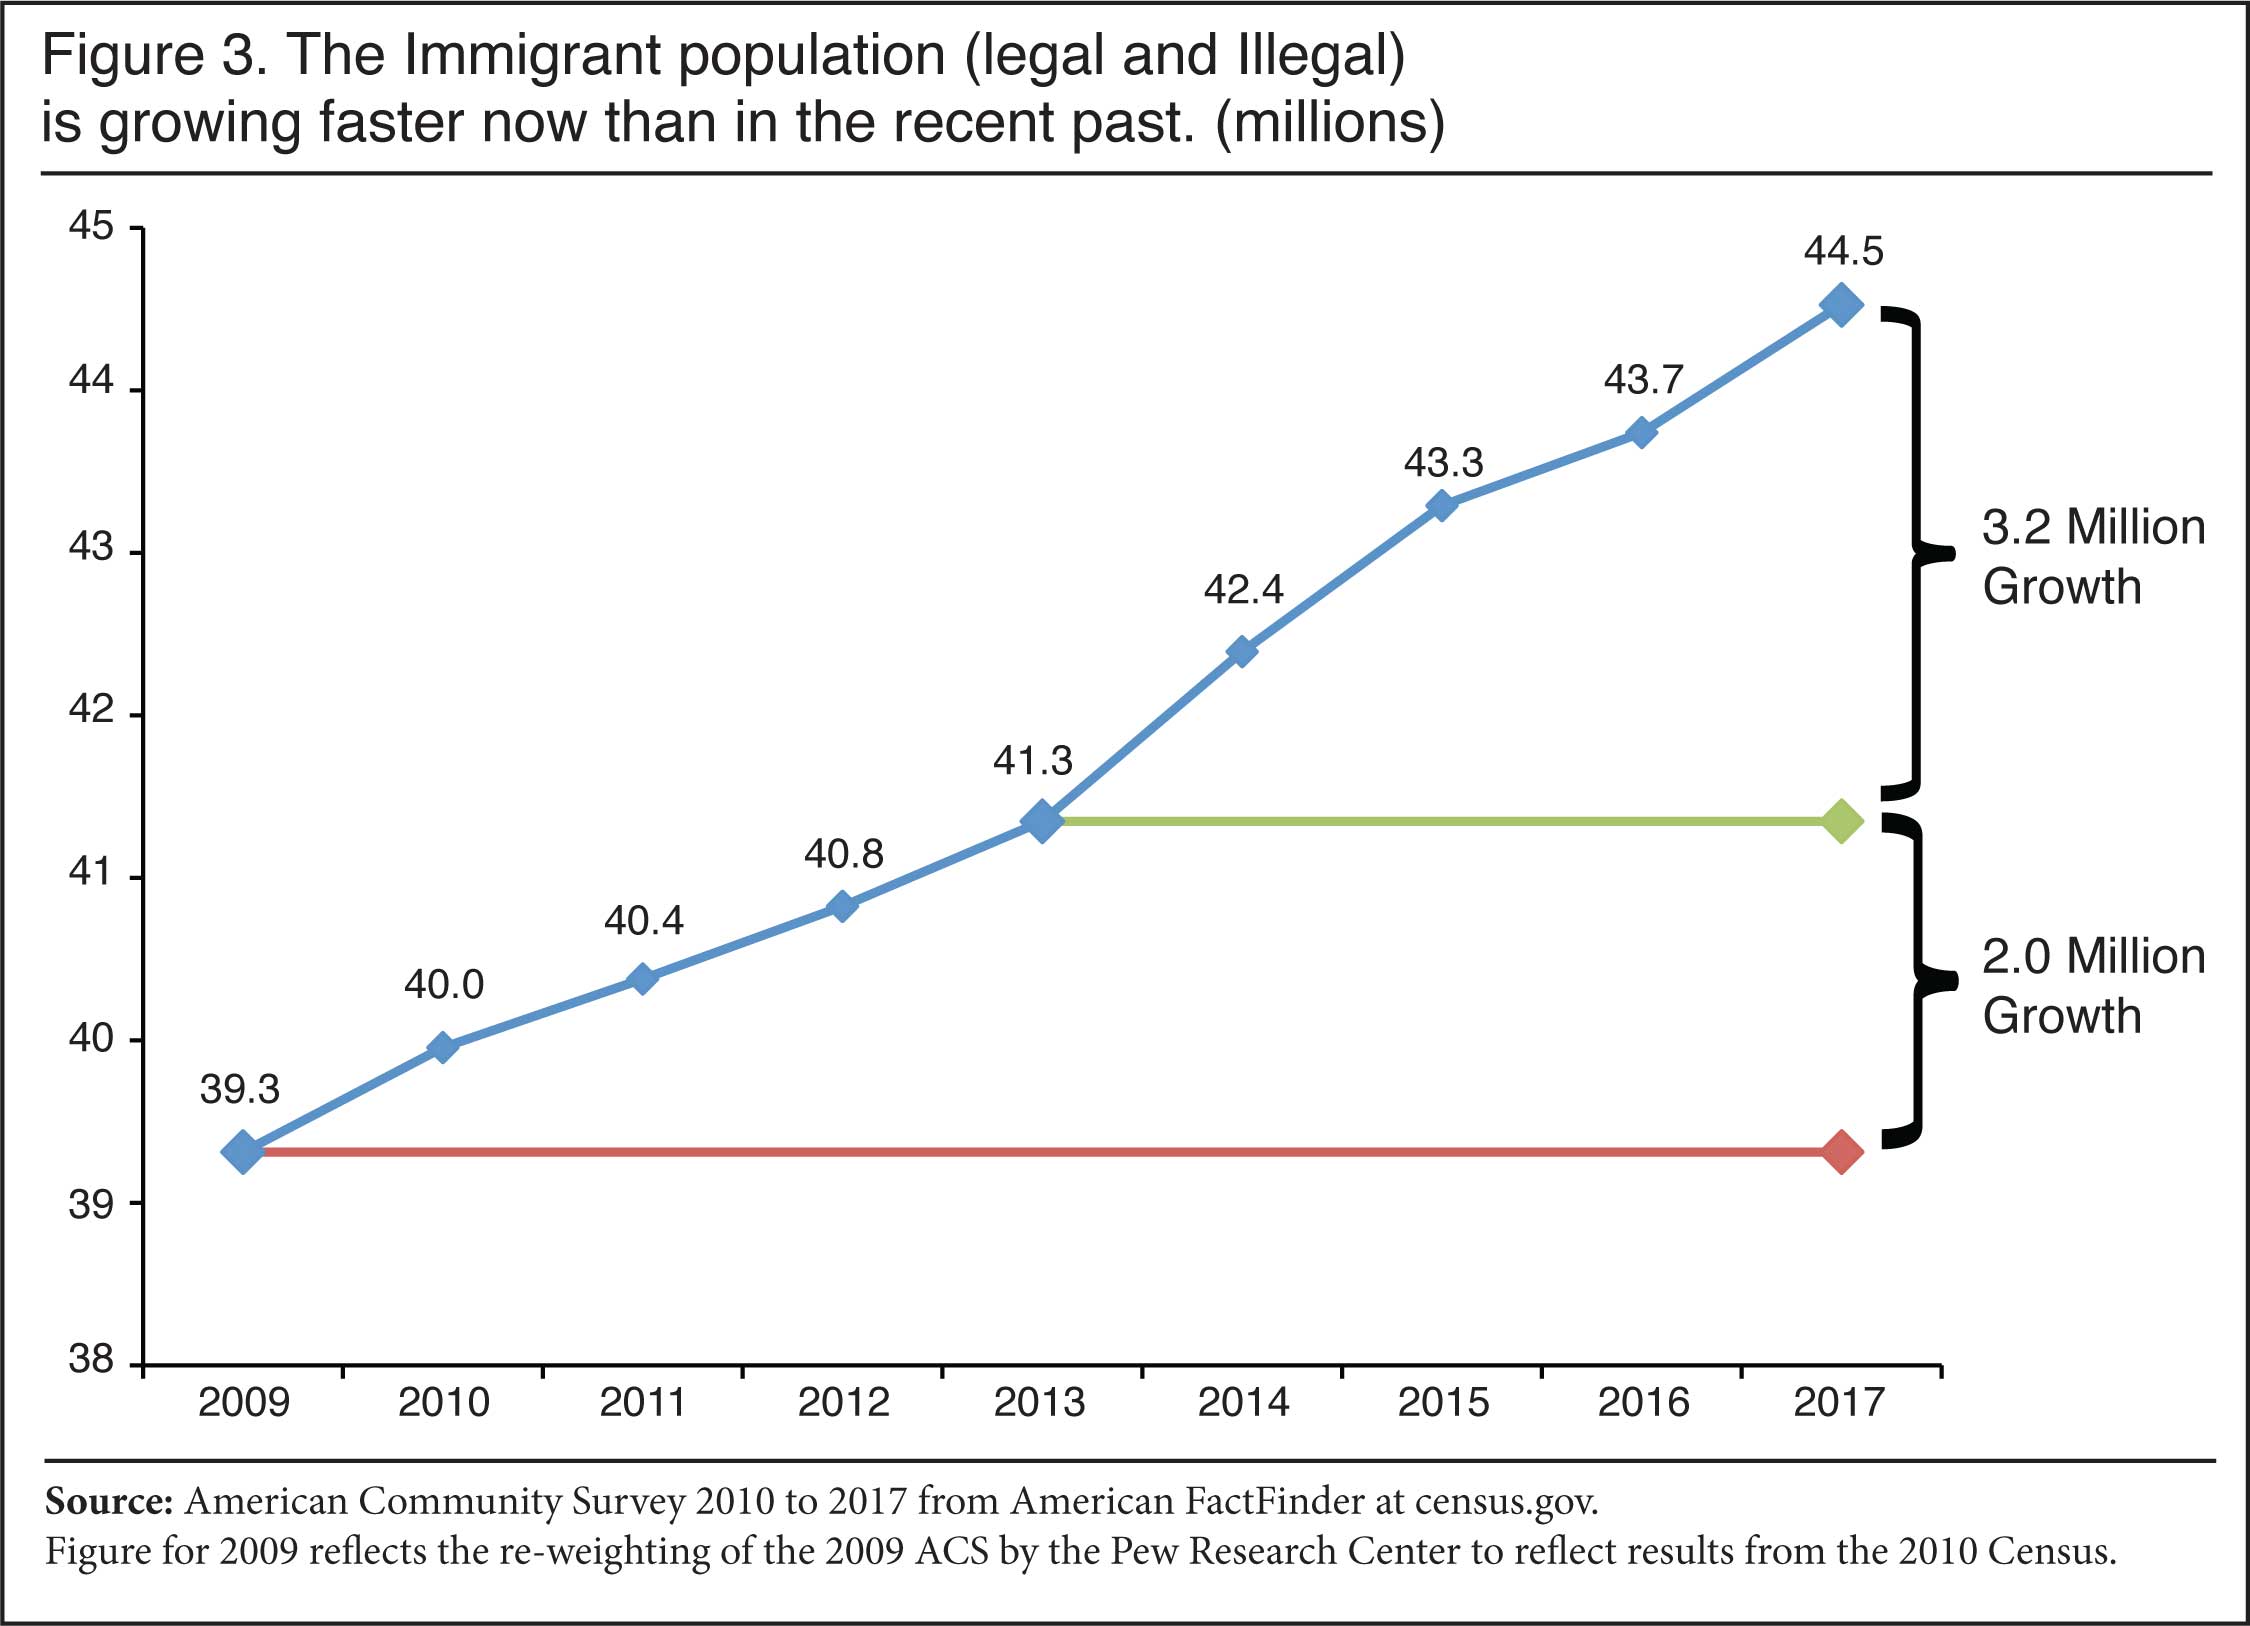
- The dramatic increase in new immigrants settling in the United States in recent years is primarily driven by the nation's generous legal immigration system, both long-term temporary visa holders (e.g. guest workers and foreign students) and new permanent residents (green cards).
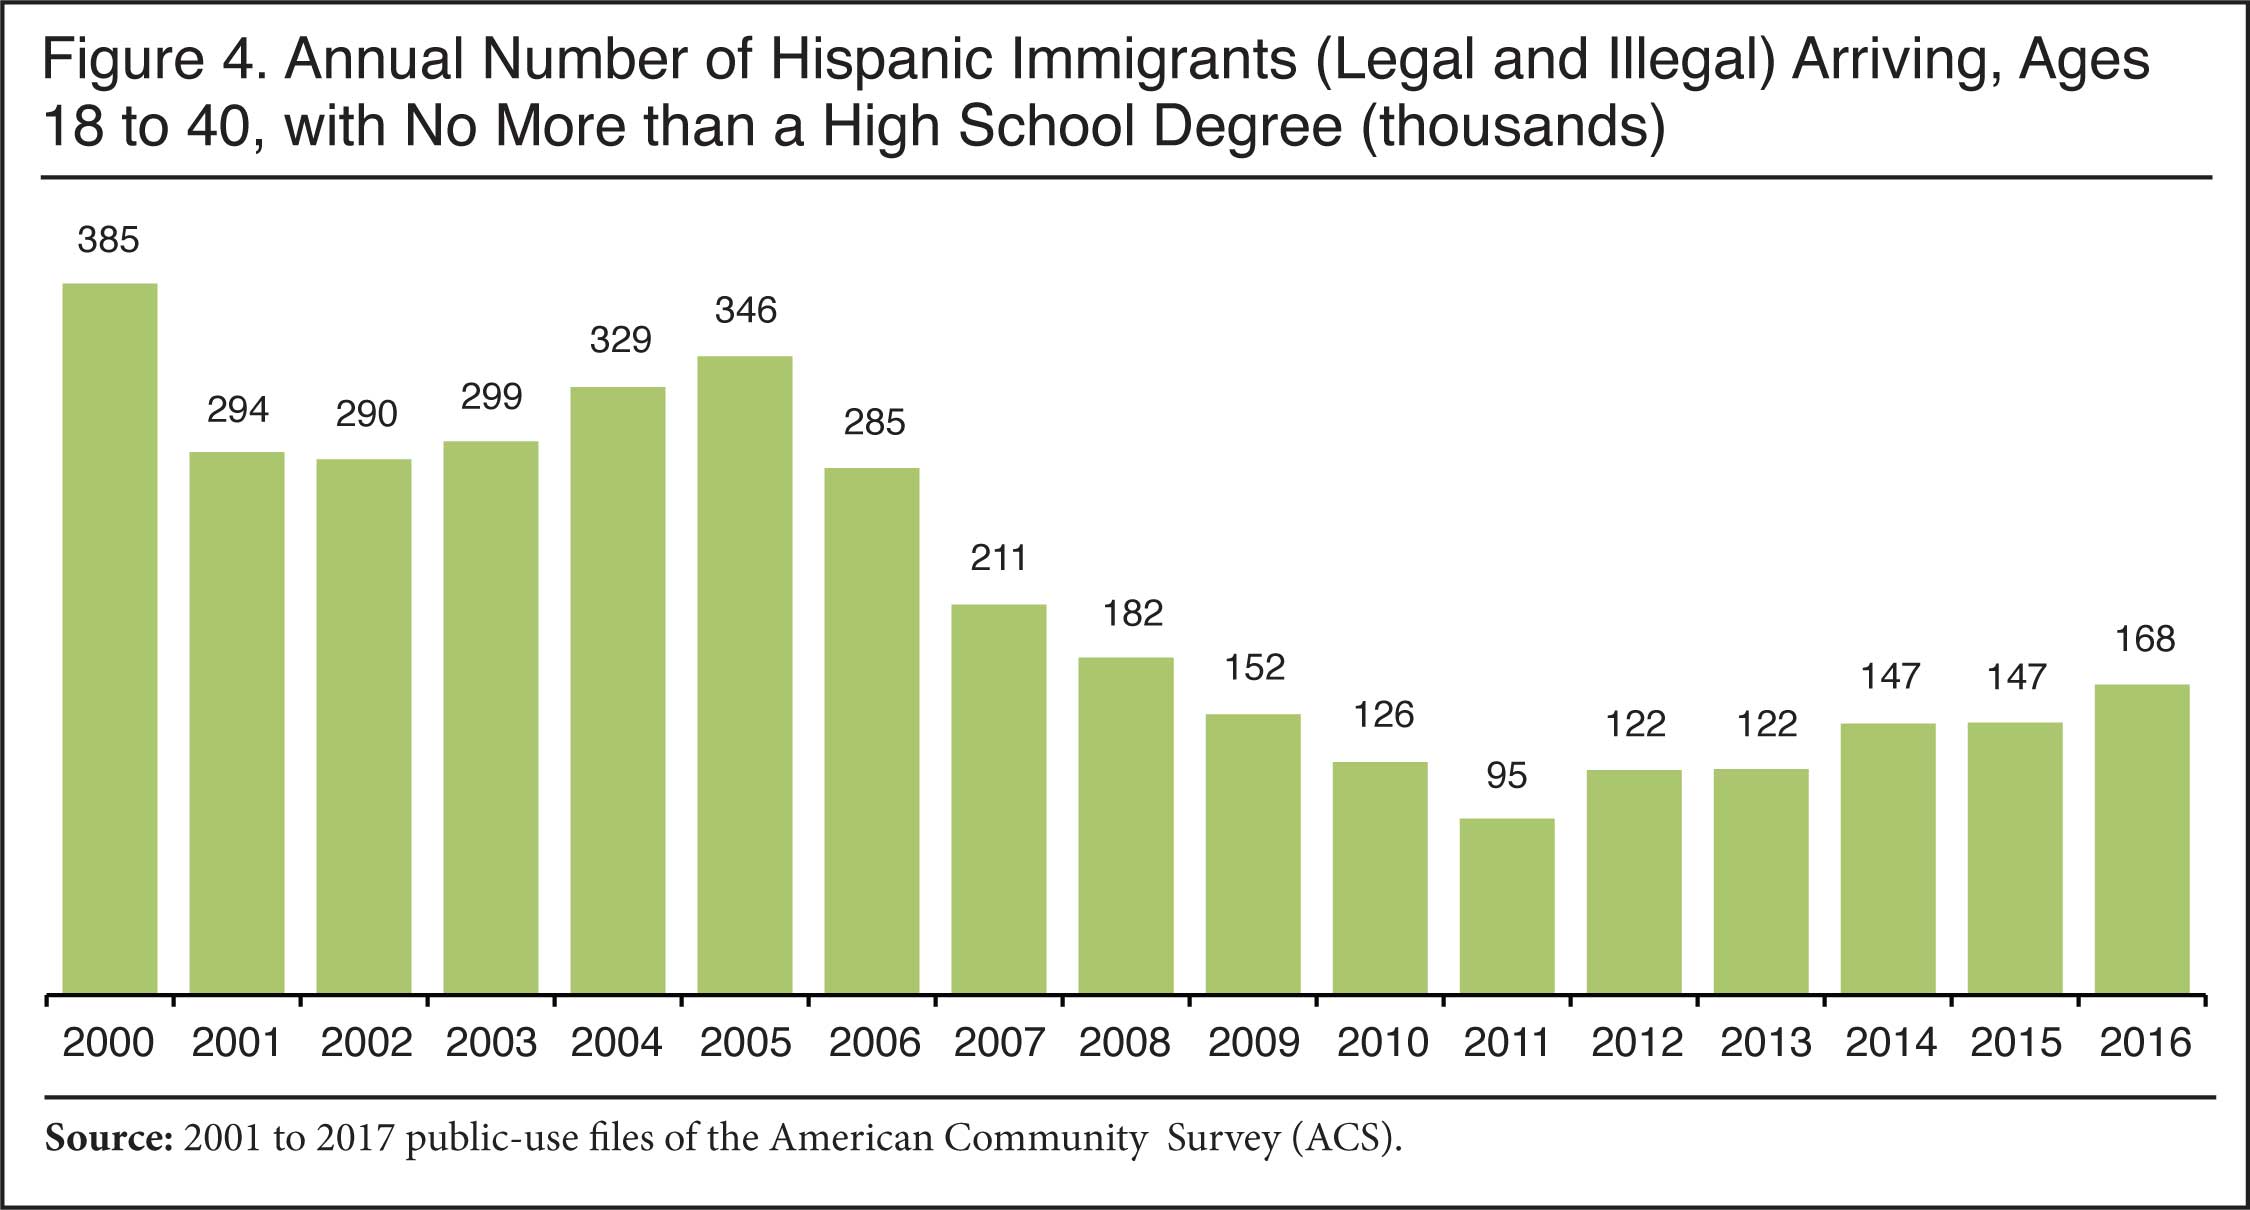
- There is evidence that the arrival of new illegal immigrants may also have rebounded in the last few years. The number of new less-educated Hispanic immigrants increased 76 percent between 2011 and 2016. However, the level remains well below what it was before the Great Recession.3 (Figure 4)
- The decision to admit large numbers of unaccompanied minors and families at the southern border likely accounts for some of the increase in new illegal immigration since 2011, particularly from Central America.
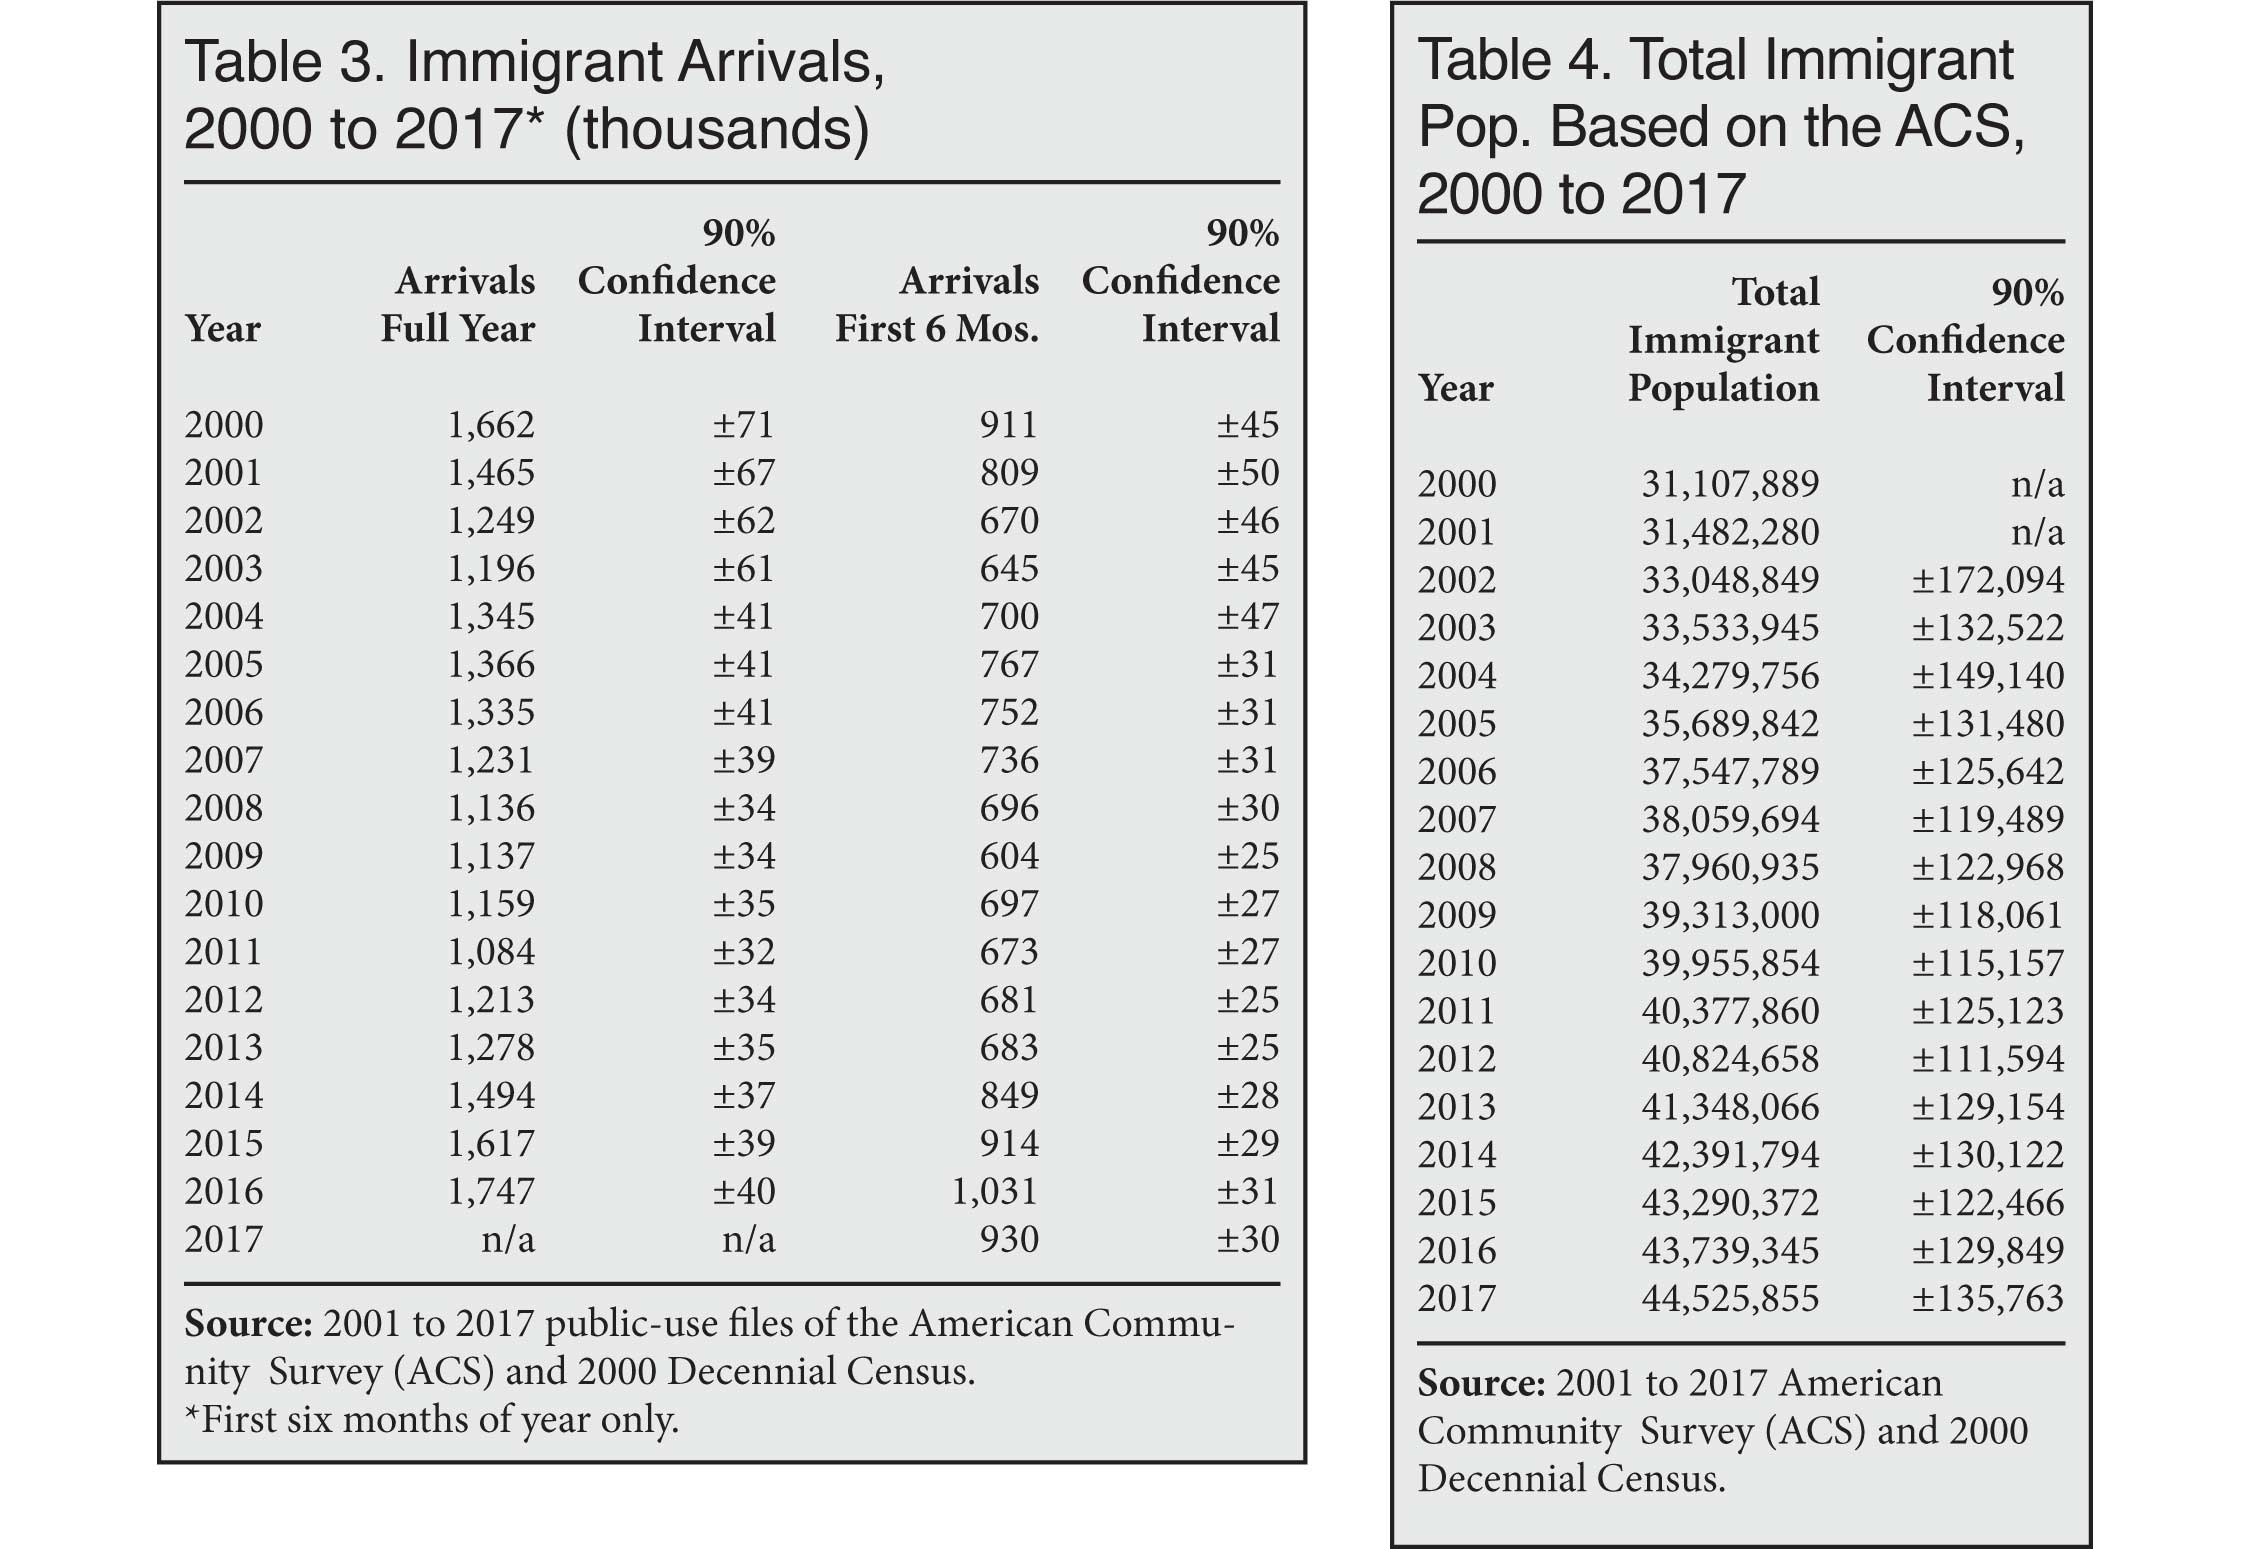
- While complete data for 2017 will not be released until next year, in the first six months of 2017, 930,000 new immigrants settled in the country. This is less than in the first six months of 2016, and may indicate that new immigration fell somewhat between 2016 and 2017. (Table 3)
- The falloff in arrivals in the first part of 2017 may reflect increased enforcement, lower refugee admissions, and more robust vetting of applicants undertaken by the Trump administration.
- Based on past patterns, when the data becomes available for all of 2017, it may show 1.61 million new immigrants arrived in all of 2017, though that projection is only preliminary. If correct, it would mean that new arrivals in 2017 were lower than in 2016, but still higher than any year since 2000, with the exception of 2016.4
Data Source. In October of this year, the Census Bureau released the public-use data from the 2017 American Community Survey (ACS). The survey reflects the U.S. population as of July 1, 2017. The ACS is by far the largest survey taken by the federal government each year and includes over two million households.5 The Census Bureau posted some of the results from the ACS in September to its American FactFinder system. However, only by analyzing the public-use micro data from the ACS, not the tables generated from Factfinder, can we measure individual years of arrival, as shown in Figures 1 and 2. To measure the number of new arrivals, we use what is often referred to as the "year of arrival" question in the ACS. The survey asks respondents what year they came to the United States to live.
Immigrants, including recent arrivals, are typically referred to as the "foreign-born" by the Census Bureau. These are individuals who were not U.S. citizens at birth. They include naturalized citizens, legal permanent immigrants (green card holders), temporary workers, and foreign students. They do not include those born to immigrants in the United States, including to illegal immigrant parents, or those born in outlying U.S. territories such as Puerto Rico. Prior research by the Department of Homeland Security and others indicates that some 90 percent of illegal immigrants respond to the ACS.6 Thus, all of the figures reported above are for both legal and illegal immigrants.
Newly arrived immigrants captured in the Census Bureau's ACS include the foreign-born as described above. It does not include those who come to the United States for short stays, such as tourists or business travelers. The ACS uses a two-month rule to determine who will be included in the survey. That is, the survey counts anyone residing for at least two months at an address. While there are very few newly arrived immigrants in institutions, the ACS includes that population as well, which includes prisons and nursing homes.7 Since the survey represents the population at mid-year, it is necessary to wait until next year's ACS is released to get a complete picture of the total number of immigrants in 2017. So, for example, the total number of new arrivals in 2016 only became available once the 2017 ACS was released in October 2018. However, the number of new arrivals in the first six months of the previous year is available when the new data is released.
End Notes
1 The 2000 Census showed that 1.797 million new immigrants settled in the country in 1999, compared to 1.747 million in 2016. The margin of error in the public-use ACS for new arrivals in 2016 is ±40,000 using a 90 percent confidence interval (see Table 3), so it is possible the number who came in that year was as high as 1.787. (Using a 95 percent confidence interval it would be ±48,000 for a possible high range of 1.795 million.) This range, coupled with the small margin of error in Census Long Form data from 2000, means that, statistically, 1999 and 2016 are the same. It must be pointed out that the ACS was not collected nationally on an annual basis before 2000 and the decennial census data is only available every 10 years so we cannot be certain of the annual number of new arrivals in 1990s. (Note: 2000 was the last time a decennial census distinguished the foreign-born population, including years of arrival.) So there is no way to directly measure the number of immigrants arriving in the 1990s by individual year. It is possible that new arrivals exceeded 1.8 million a year at some point between 1990 and 1998. That said, growth in the total foreign-born population between 1990 and 2000, based on the decennial census, as well as arrival data in another smaller survey collected by the Census Bureau called the Current Population Survey (CPS), does not indicate that annual immigration (legal and illegal) ever reached the 1999 or 2016 levels in the 1990s. In 2005, the Pew Research Center attempted to estimate individual year of arrival data from 1990 to 2004 by averaging results from the 2000 census, the ACS, and the CPS. After making allowances for out-migration and mortality, their research shows that, other than 1999, the highest year of new immigration was 1998 when 1.462 million immigrants arrived. Pew's findings confirm that new arrivals did not exceed the 1999/2016 level at any point in the 1990s. See Table 1a in Jeffrey S. Passel and Roberto Suro, "Rise, Peak, and Decline: Trends in U.S. Immigration 1992 – 2004, 2005", Pew Hispanic Center, September 27, 2005.
In addition to Census Bureau data, there is also yearly admission data on new legal immigrants going back to 1820, which shows that the largest number of new legal immigrants admitted in a single year in American history prior to 1999 was 1.218 million in 1914. It may be worth adding that during the IRCA legalizations in both 1990 and 1991 the number of new green cards each year was higher than 1.218 million, though these were illegal immigrants already here receiving amnesty, not new arrivals. The figures also include non-illegal immigrants receiving green cards who were adjusting status from within the United States, so they, too, were not new arrivals. In short, the number of new arrivals for 2016 roughly matched the level in 1999, making it almost certain that 2016 and 1999 are tied for the two highest years of immigration in American history.
2 The regions in this report are defined in the following manner: Countries that can be identified in the public-use 2017 ACS file are coded as the following regions: Mexico; Central America: Belize, Costa Rica, El Salvador, Guatemala, Honduras, Nicaragua, and Panama; South America: Argentina, Bolivia, Brazil, Chile, Colombia, Ecuador, Guyana, Paraguay, Peru, Uruguay, Venezuela, and South America not specified; Caribbean: Bermuda, Cuba, Dominican Republic, Haiti, Jamaica, Antigua-Barbuda, Bahamas, Barbados, Dominica, Grenada, St. Lucia, St. Vincent, Trinidad and Tobago, and Caribbean and West Indies and Americas not specified; South Asia: India, Bangladesh, Pakistan, Sri Lanka, Bhutan, and Nepal; East Asia: China, Hong Kong, Taiwan, Japan, Korea, Cambodia, Indonesia, Laos, Malaysia, Philippines, Singapore, Thailand, Vietnam, Burma, Mongolia, Asia not specified; Europe: Denmark, Finland, Iceland, Norway, Sweden, England, Scotland, United Kingdom, Ireland, Belgium, France, Netherlands, Switzerland, Albania, Greece, Macedonia, Italy, Portugal, Azores, Spain, Austria, Bulgaria, Czechoslovakia, Slovakia, Czech Republic, Germany, Hungary, Poland, Romania, Yugoslavia, Croatia, Bosnia, Serbia, Montenegro, Cyprus, Latvia, Lithuania, Byelorussia, Moldova, Ukraine, Armenia, Georgia, Russia, USSR not specified, and Europe not specified; Middle East: Afghanistan, Azerbaijan, Kazakhstan, Kyrgyzstan, Uzbekistan, Iran, Iraq, Israel/Palestine, Jordan, Kuwait, Lebanon, Saudi Arabia, United Arab Emirates, Syria, Turkey, Yemen, Algeria, Egypt, Morocco, Libya, Sudan, and North Africa not specified; Sub-Saharan Africa: Cape Verde, Ghana, Guinea, Liberia, Nigeria, Senegal, Sierra Leone, Ethiopia, Kenya, Somalia, Tanzania, Uganda, Zimbabwe, Eritrea, Cameroon, South Africa, Zaire, Congo, Zambia, Togo, Gambia, South Sudan, and Africa and Western and Eastern Africa not specified; Canada; Oceania/Elsewhere: Australia, New Zealand, Fiji, Tonga, Marshall Islands, Micronesia, Elsewhere. The above list is for 2010 to 2017, in prior years several smaller sending countries cannot be identified individually in the ACS.
3 Additional analysis is necessary to confirm this tentative conclusion. However, Figure 4 shows the number of Hispanic immigrants with only a high school education or less ages 18 to 40 arriving each year based on the ACS. Based on prior research, about three-fourths of this population has traditionally been illegal immigrants. (See Steven A. Camarota and Karen Zeigler, "Homeward Bound: Recent Immigration Enforcement and the Decline in the Illegal Alien Population", Center for Immigration Studies, July 30, 2008.) Figure 4 shows that the number of such immigrants entering each year has increased by 76 percent since 2011, when it hit a low point after the Great Recession. This increase makes it very likely that new illegal immigration has increased somewhat in recent years and may again match the number arriving in 2008 or even 2007, though the level is still well below the number who came annually in earlier years. It should also be remembered that new arrivals are offset by those in the existing population of illegal immigrants who return home or get legal status each year. Thus, an increase in new arrivals may not translate into a larger illegal immigrant population in the country because the overall size of that population reflects both new arrivals and those leaving the illegal population each year.
4 This projection is based on the ratio of new arrivals for the first six months of each year from 2010 to 2016 to the number of new of arrivals for the full year once the full-year data is released. In past years, that ratio has been 1.735 so we make the same assumption for 2017 — 930,000 new arrivals in the first half of 2017 multiplied by 1.735.
5 Detailed information on the survey methodology, questions, and other information on the American Community Survey can be found here.
6 The Department of Homeland Security uses the ACS as the basis for its estimates of illegal immigrants. See their most recent estimate of the unauthorized immigrant population: Bryan Baker and Nancy Rytina, "Estimates of the Unauthorized Immigrant Population Residing in the United States: January 2012", Office of Immigration Statistics, U.S. Department of Homeland Security, March 2013.
7 The ACS began to include those in institutions in 2006. See "Group Quarters/Residence Rules", U.S. Census Bureau, last updated May 12, 2016.