Download a PDF of this Backgrounder.
Steven A. Camarota is the director of research and Karen Zeigler is a demographer at the Center.
Recently released Census Bureau data from the 2019 American Community Survey (ACS) shows the number of immigrants (legal and illegal), referred to by the Census Bureau as the "foreign-born", grew more slowly from 2017 to 2019 than in prior years.1 Growth in the total number of immigrants does not simply reflect new arrivals, rather it represents the combined effect of mortality, out-migration, and the number of newcomers. Analysis of the new data indicates that net migration — the number coming vs. those leaving — fell considerably between 2017 and 2019. The lower level of net migration likely reflects efforts by the Trump administration to enforce immigration laws and other changes. The new ACS numbers show immigration through mid-2019 and are therefore unaffected by Covid-19.
Among the key findings in the new data:
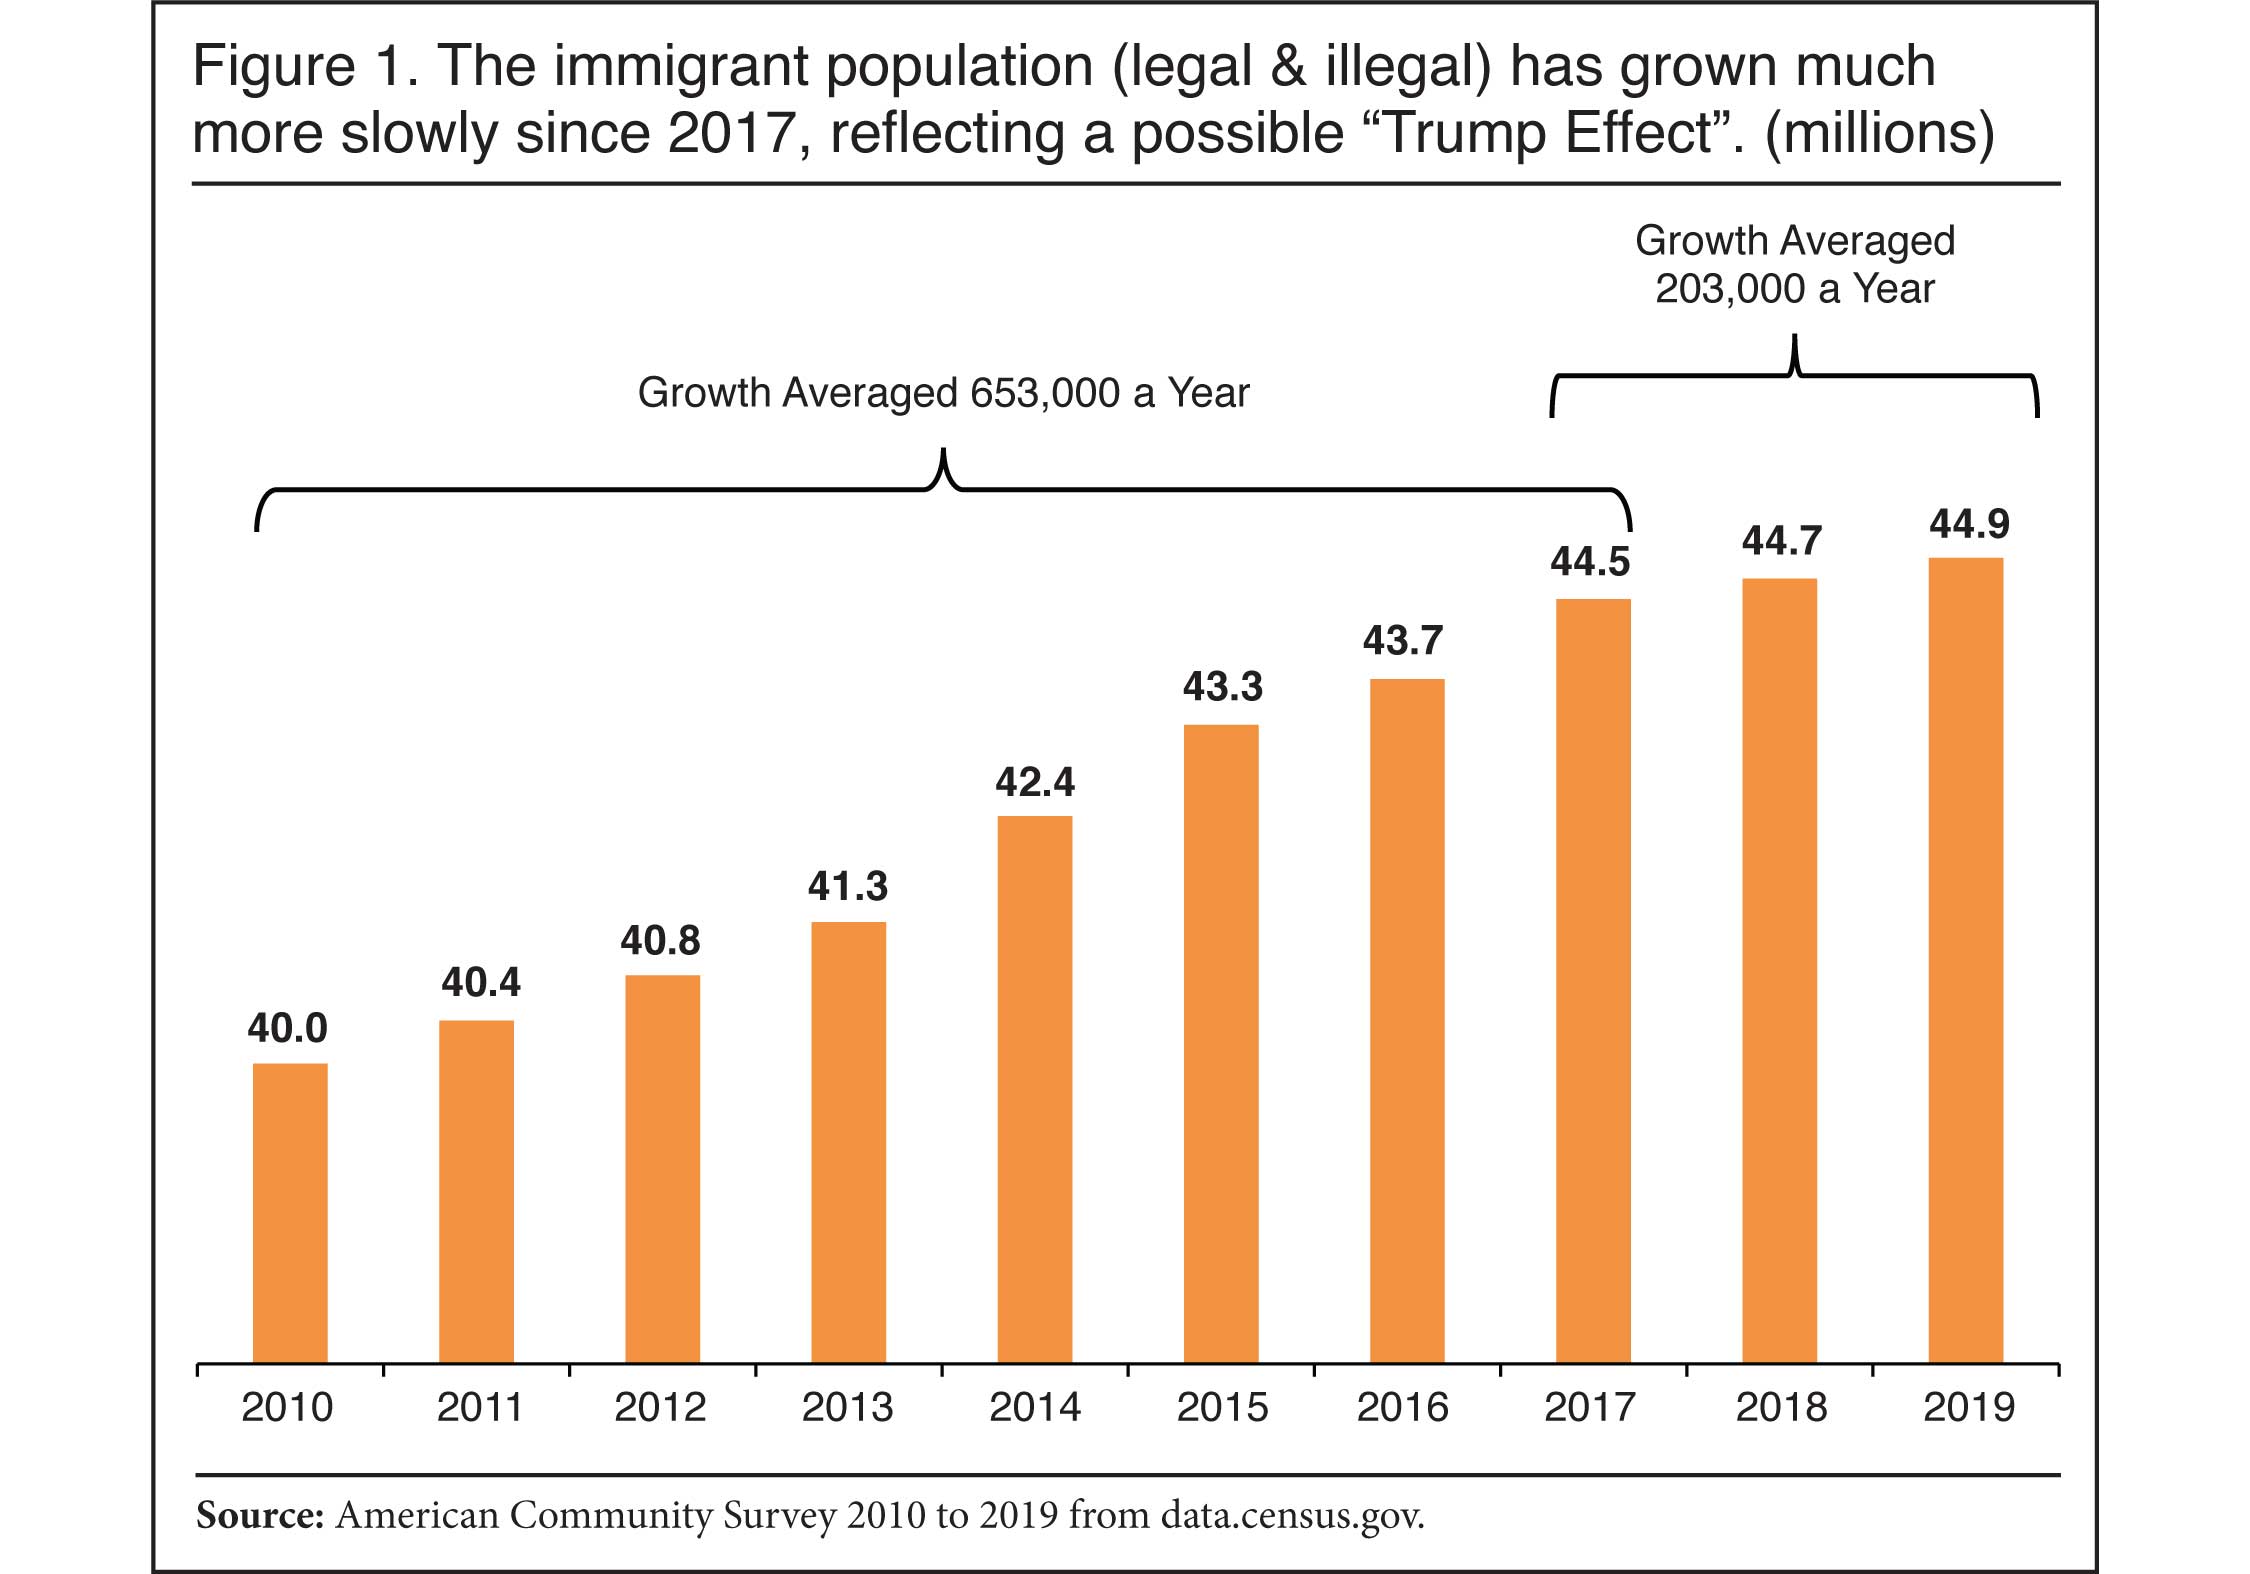
- In the first two years of the Trump administration (2017 to 2019), growth in the immigrant population (legal and illegal) averaged only about 200,000 a year, in contrast to 650,000 a year from 2010 to 2017.2 (Figure 1)
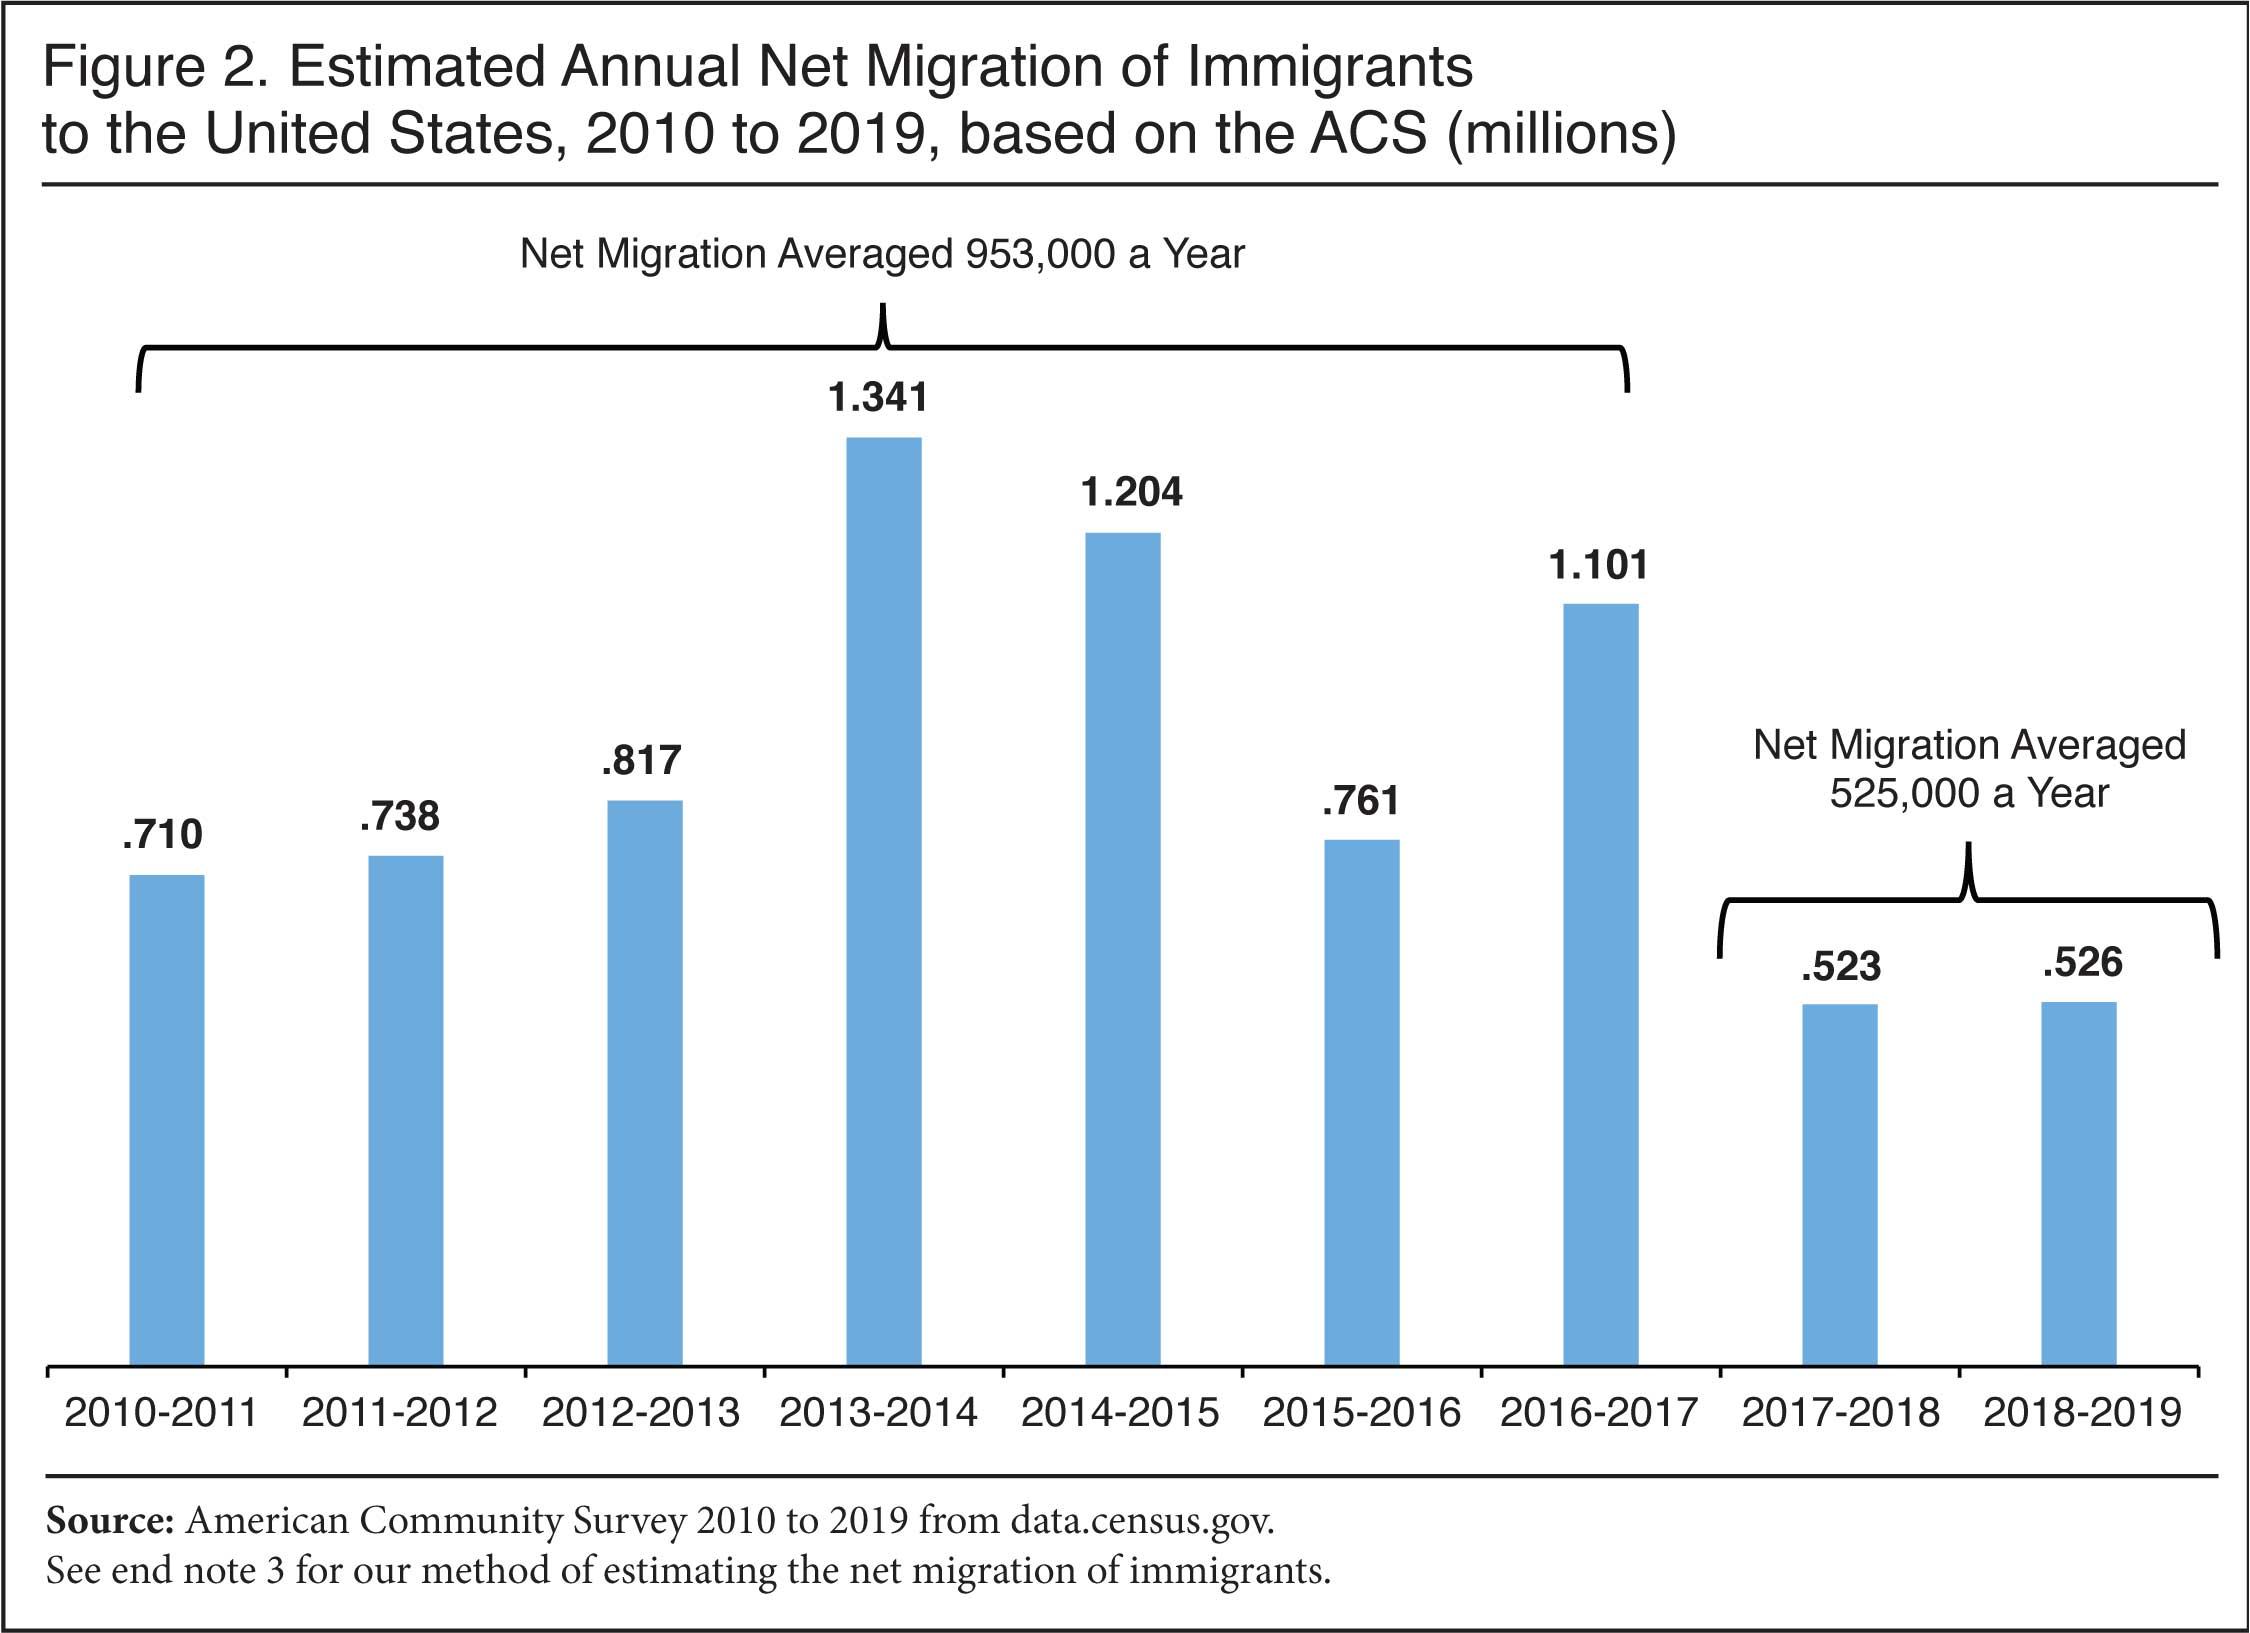
- The data released so far indicates that net migration among immigrants — the difference between the number of immigrants coming vs. those leaving — averaged 525,000 a year between 2017 and 2019, compared to about 953,000 a year between 2010 and 2017.3 (Figure 2)
- The slowdown in growth and net migration almost certainly reflects policy changes rather than a deterioration in the economy, as unemployment was low and job creation reasonably strong from 2017 to 2019.4 Covid-19 did not have an impact until 2020.
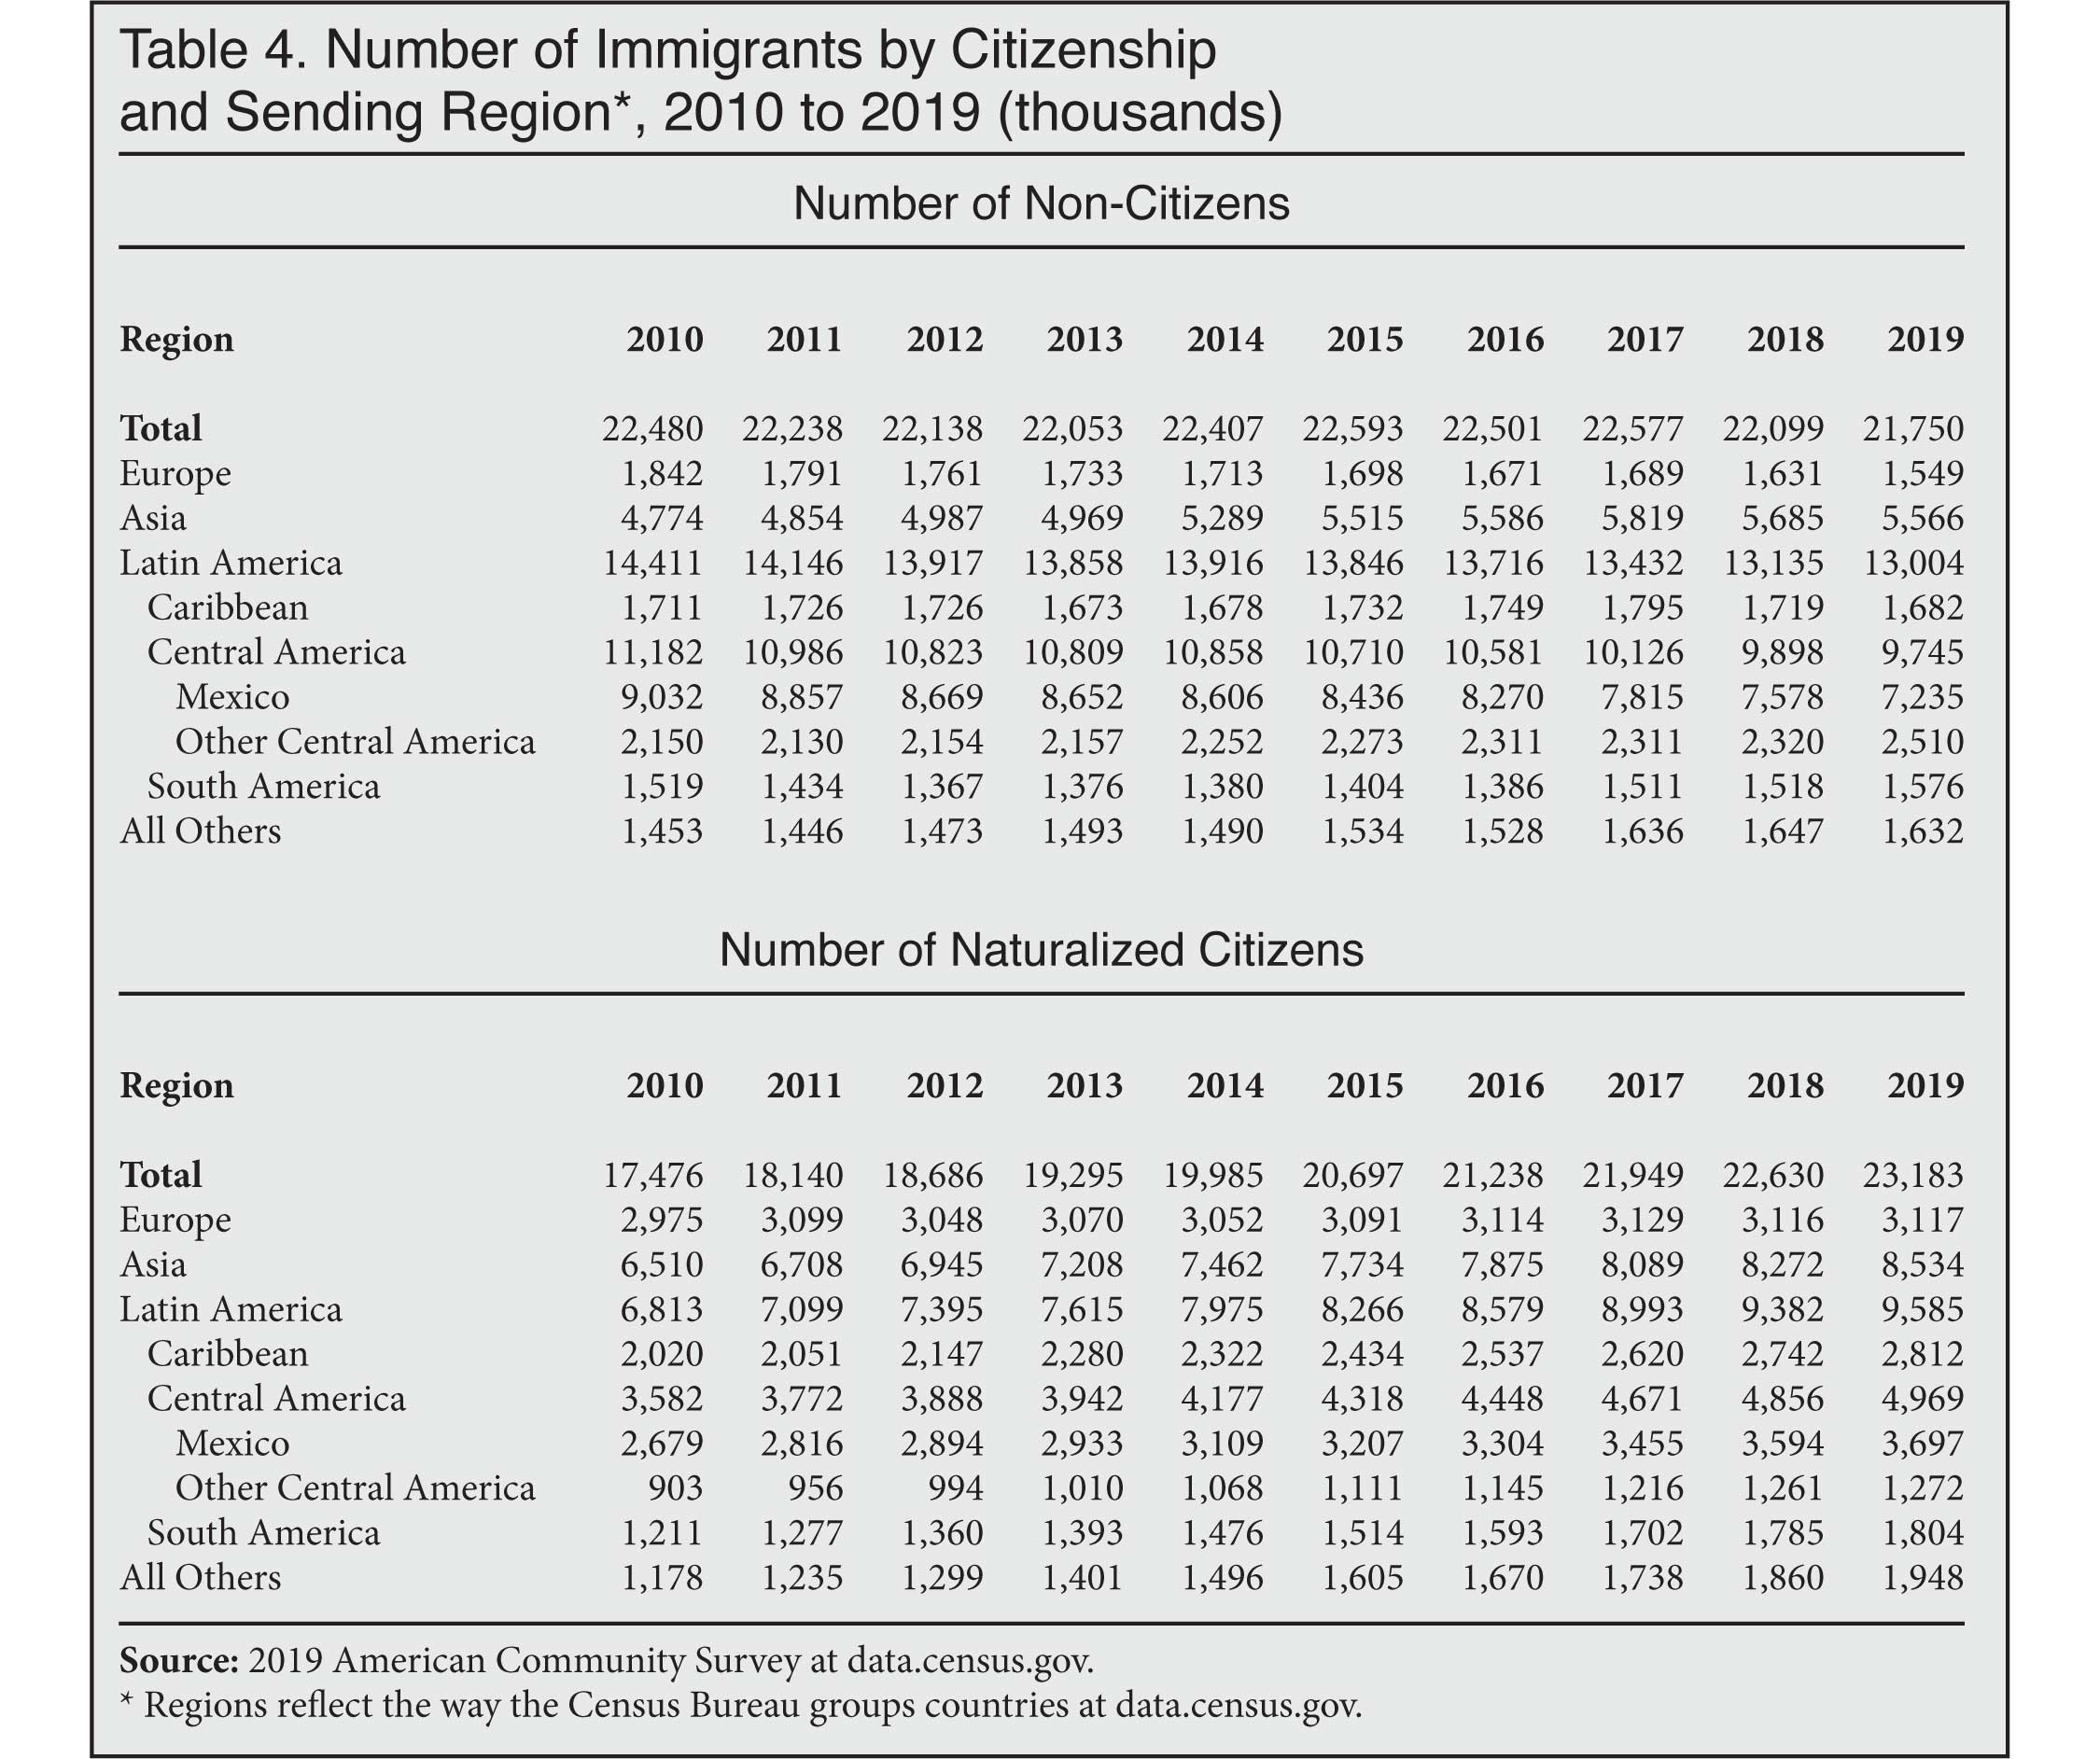
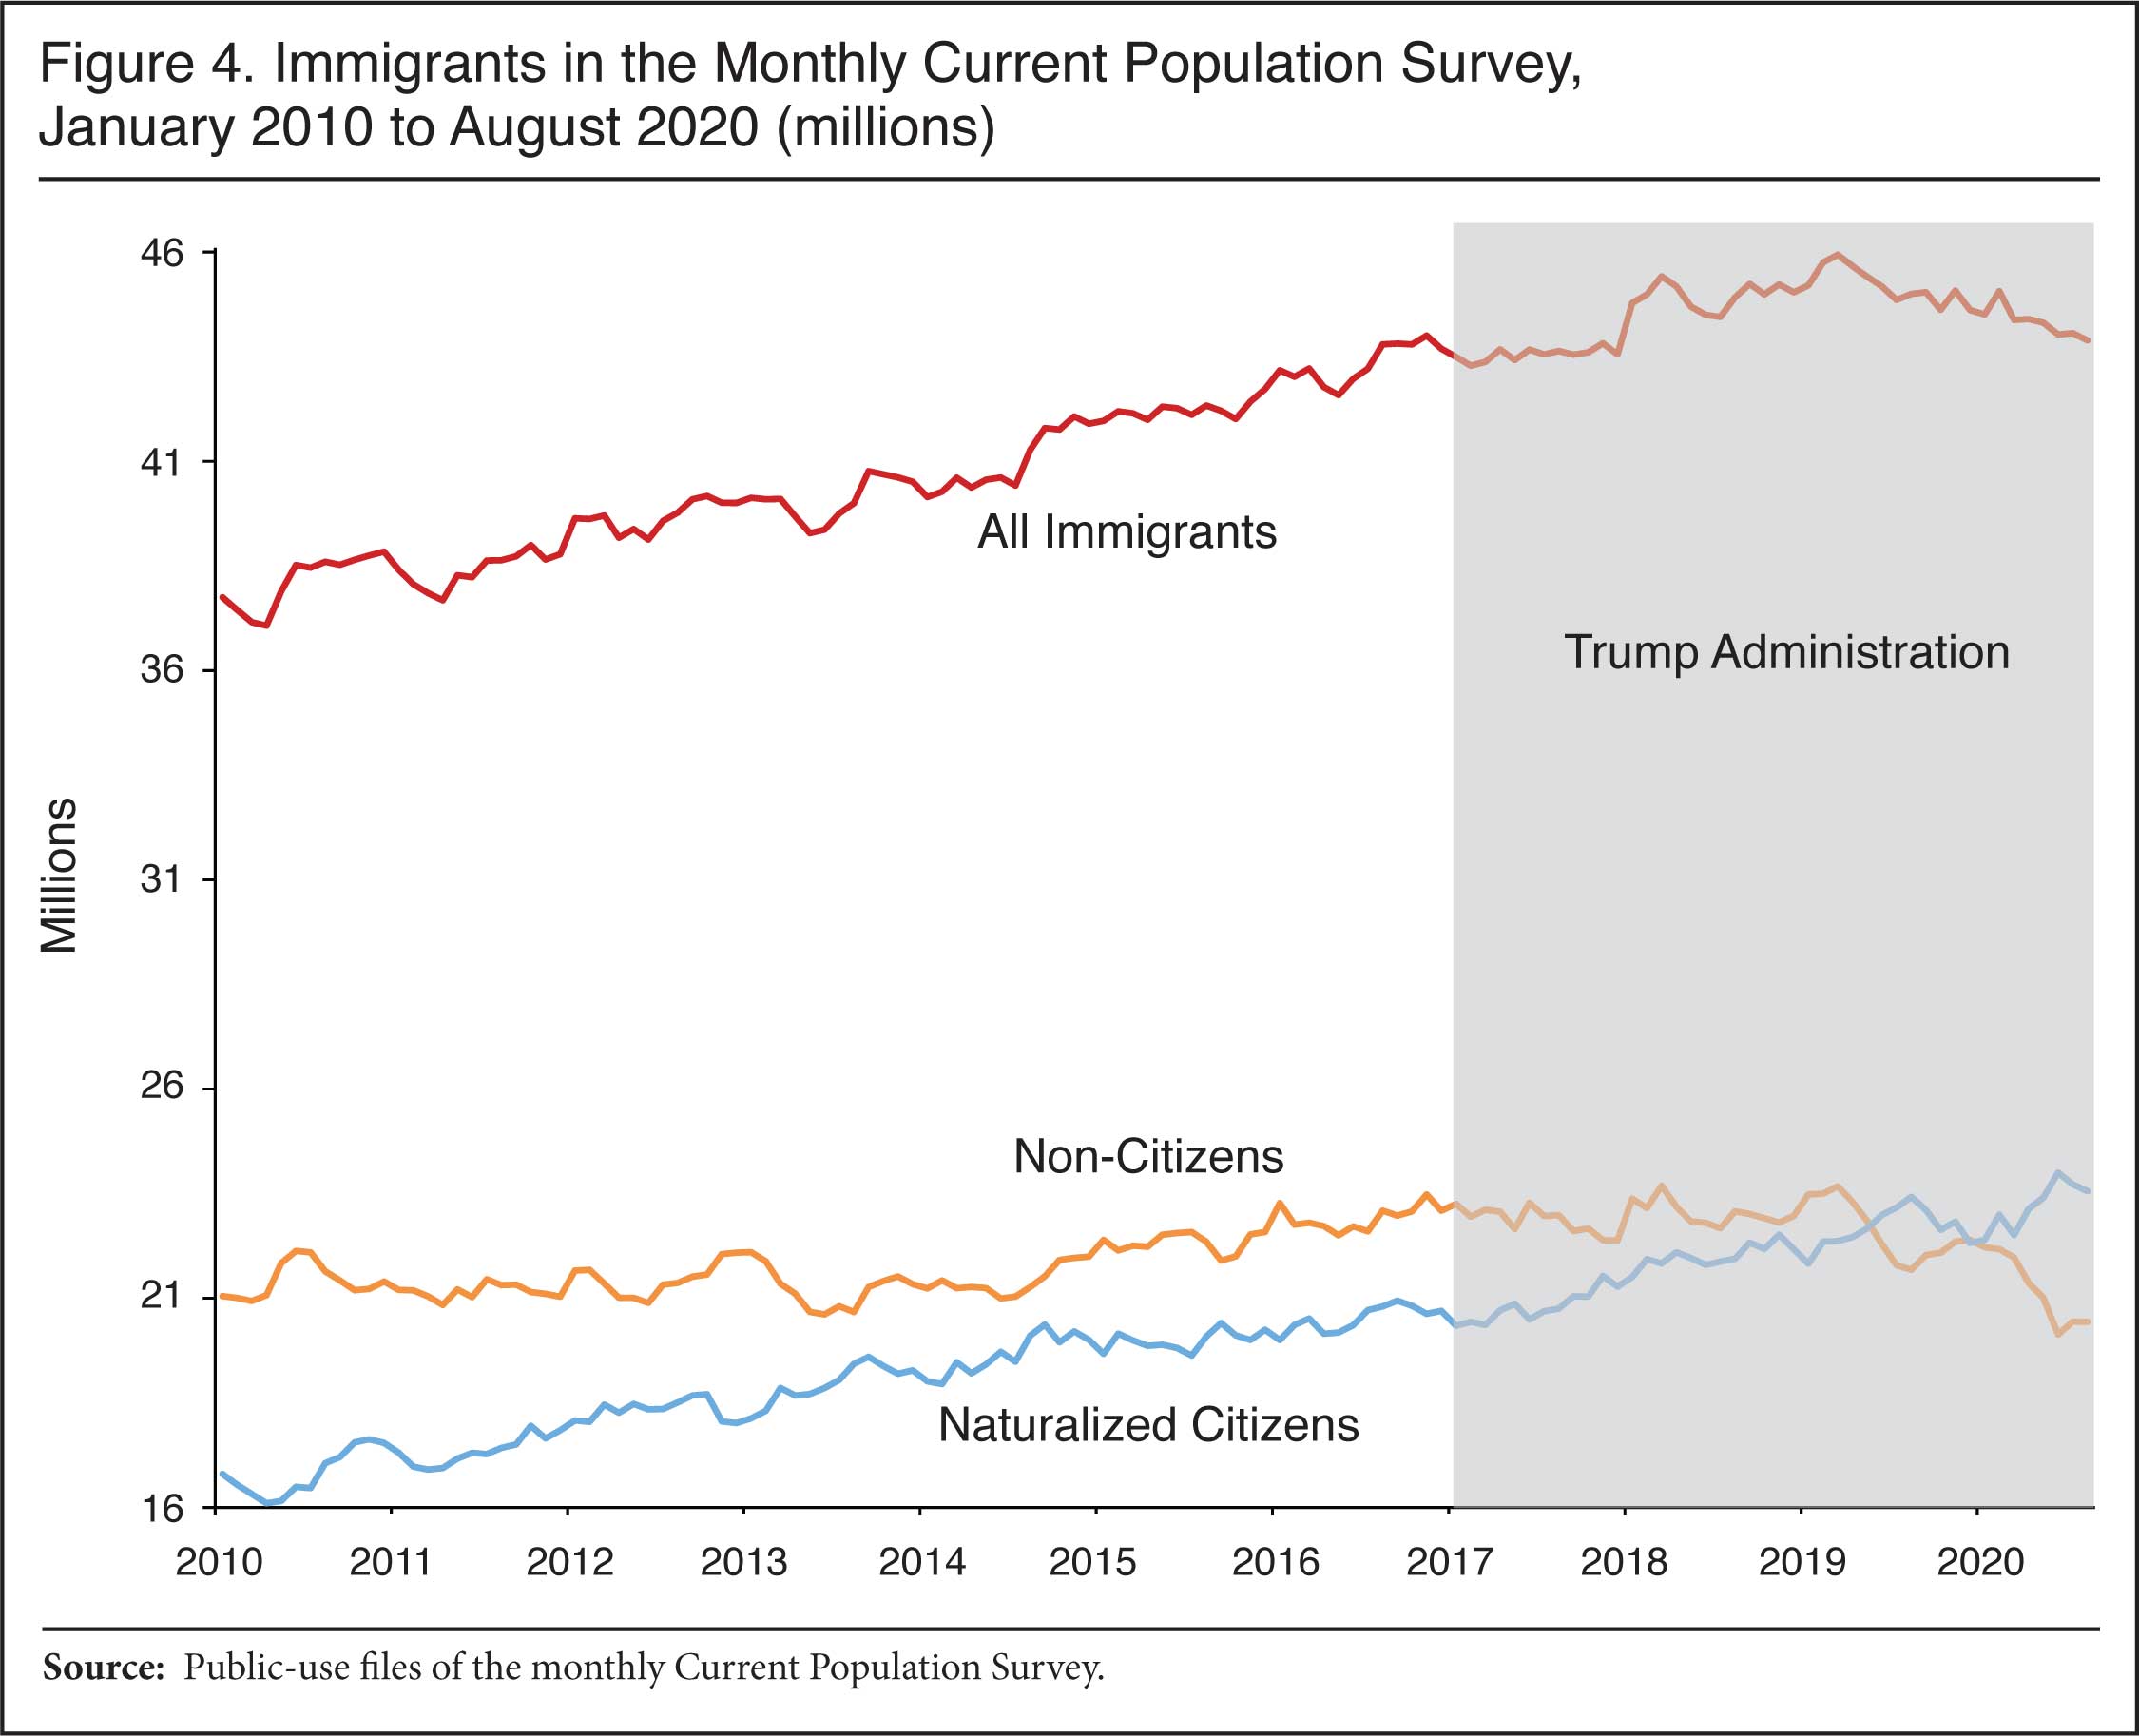
- The slowdown in growth is entirely due to a decline in non-citizens in the country; the number of naturalized citizens continues to grow. This is probably an indication that some illegal immigrants left or fewer arrived, primarily from Mexico. It may also indicate that more long-term visitors are headed home instead of overstaying their visas. (Table 4 and Figure 4)
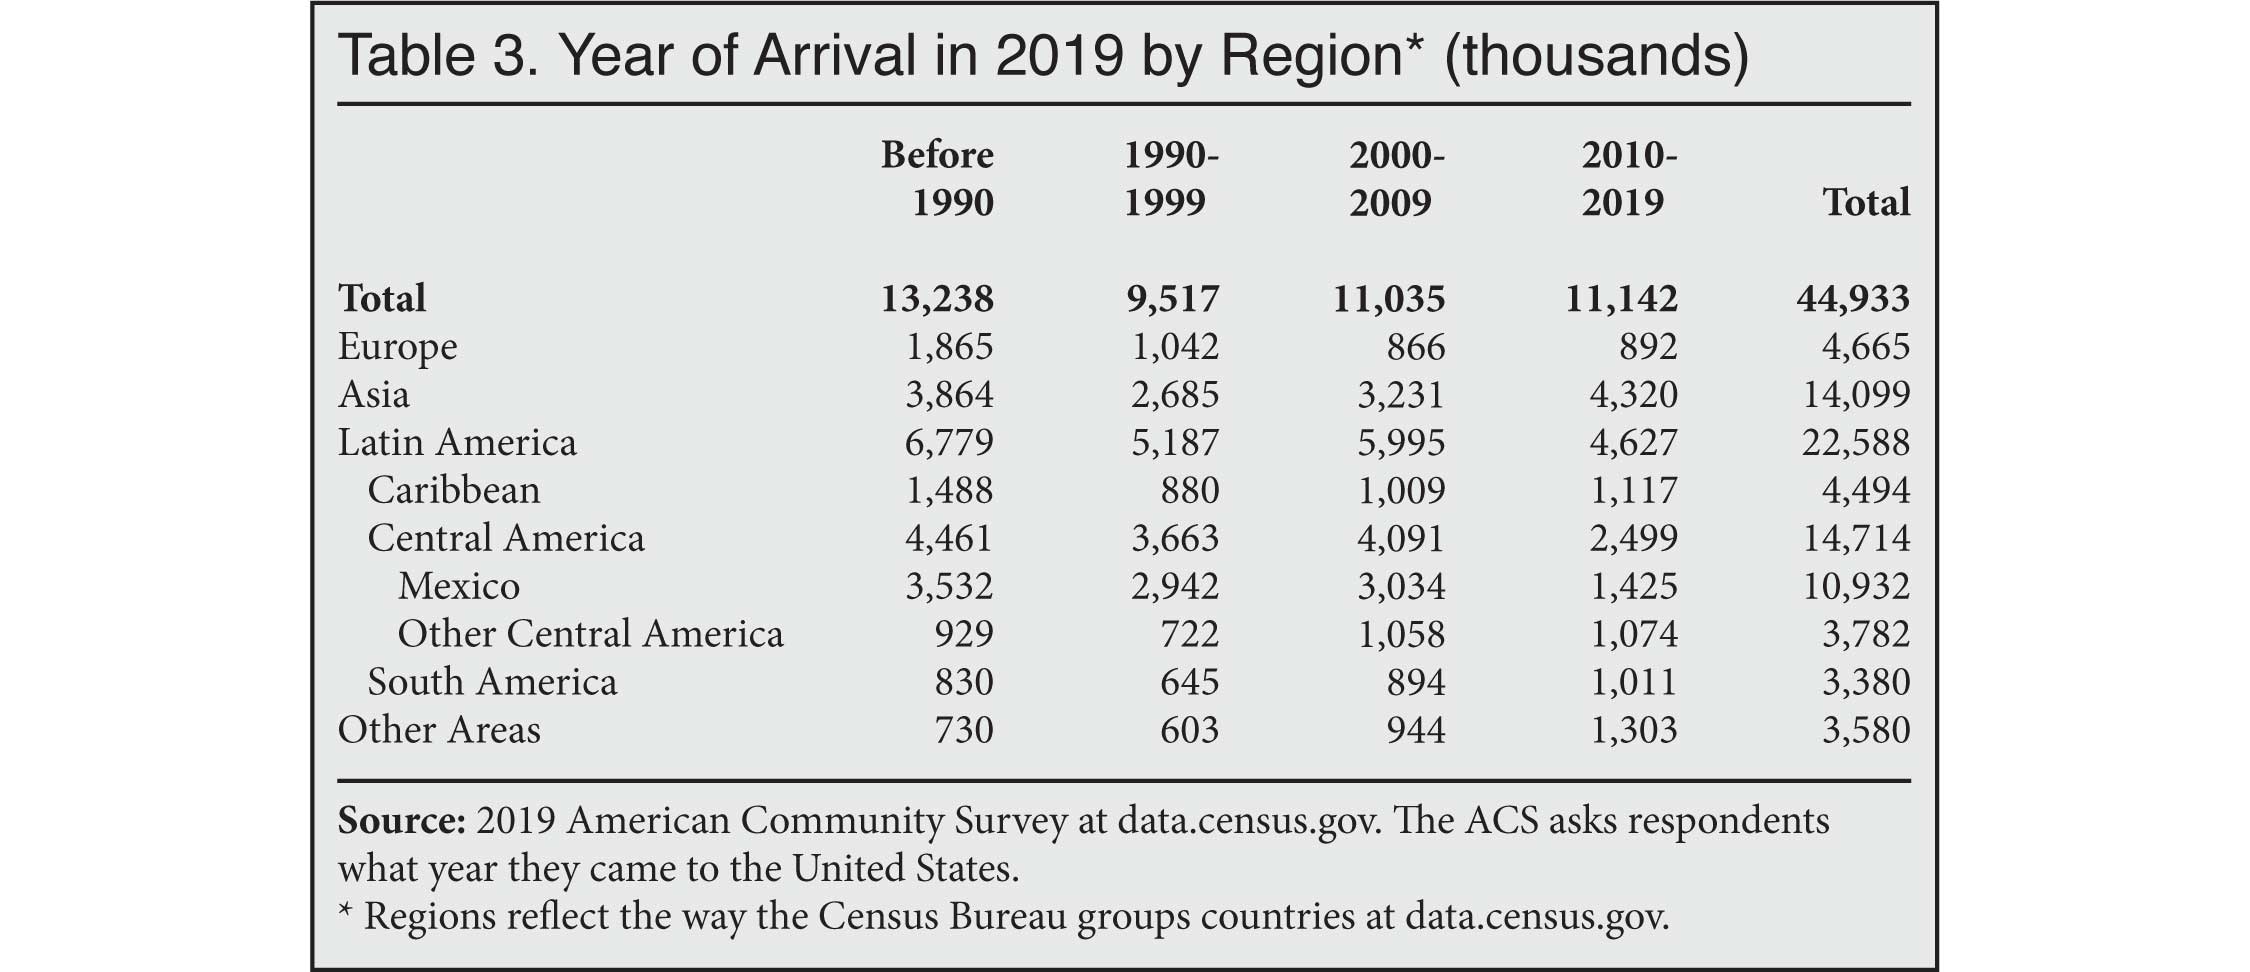
- It is not clear from the data available if slower growth was caused by fewer people coming or more leaving — though both likely played a role. We do know that in 2019 11.1 million immigrants indicated that they had settled in the United States since 2010.5 This was offset by deaths and out-migration.6
- While the ACS data only shows population trends through July 1, 2019, the Census Bureau's Current Population Survey, a much smaller survey, does show the immigrant population continued to decline through August 2020.7 (Figure 4)
- Trump administration policies that may have caused the slowdown include:8
- A significant reduction in the number of refugees allowed into the country;
- Requiring immigrant self-sufficiency through reform of the public charge rules;
- Modest administrative changes that may have had a cumulative effect;9
- Agreements with Mexico and Central American countries to offer safe haven to people seeking asylum;
- Increased barriers and fencing at the border;
- More worksite enforcement against illegal workers and some employers; and
- Efforts to end TPS and DACA, which may have increased out-migration and/or discouraged new illegal immigration.
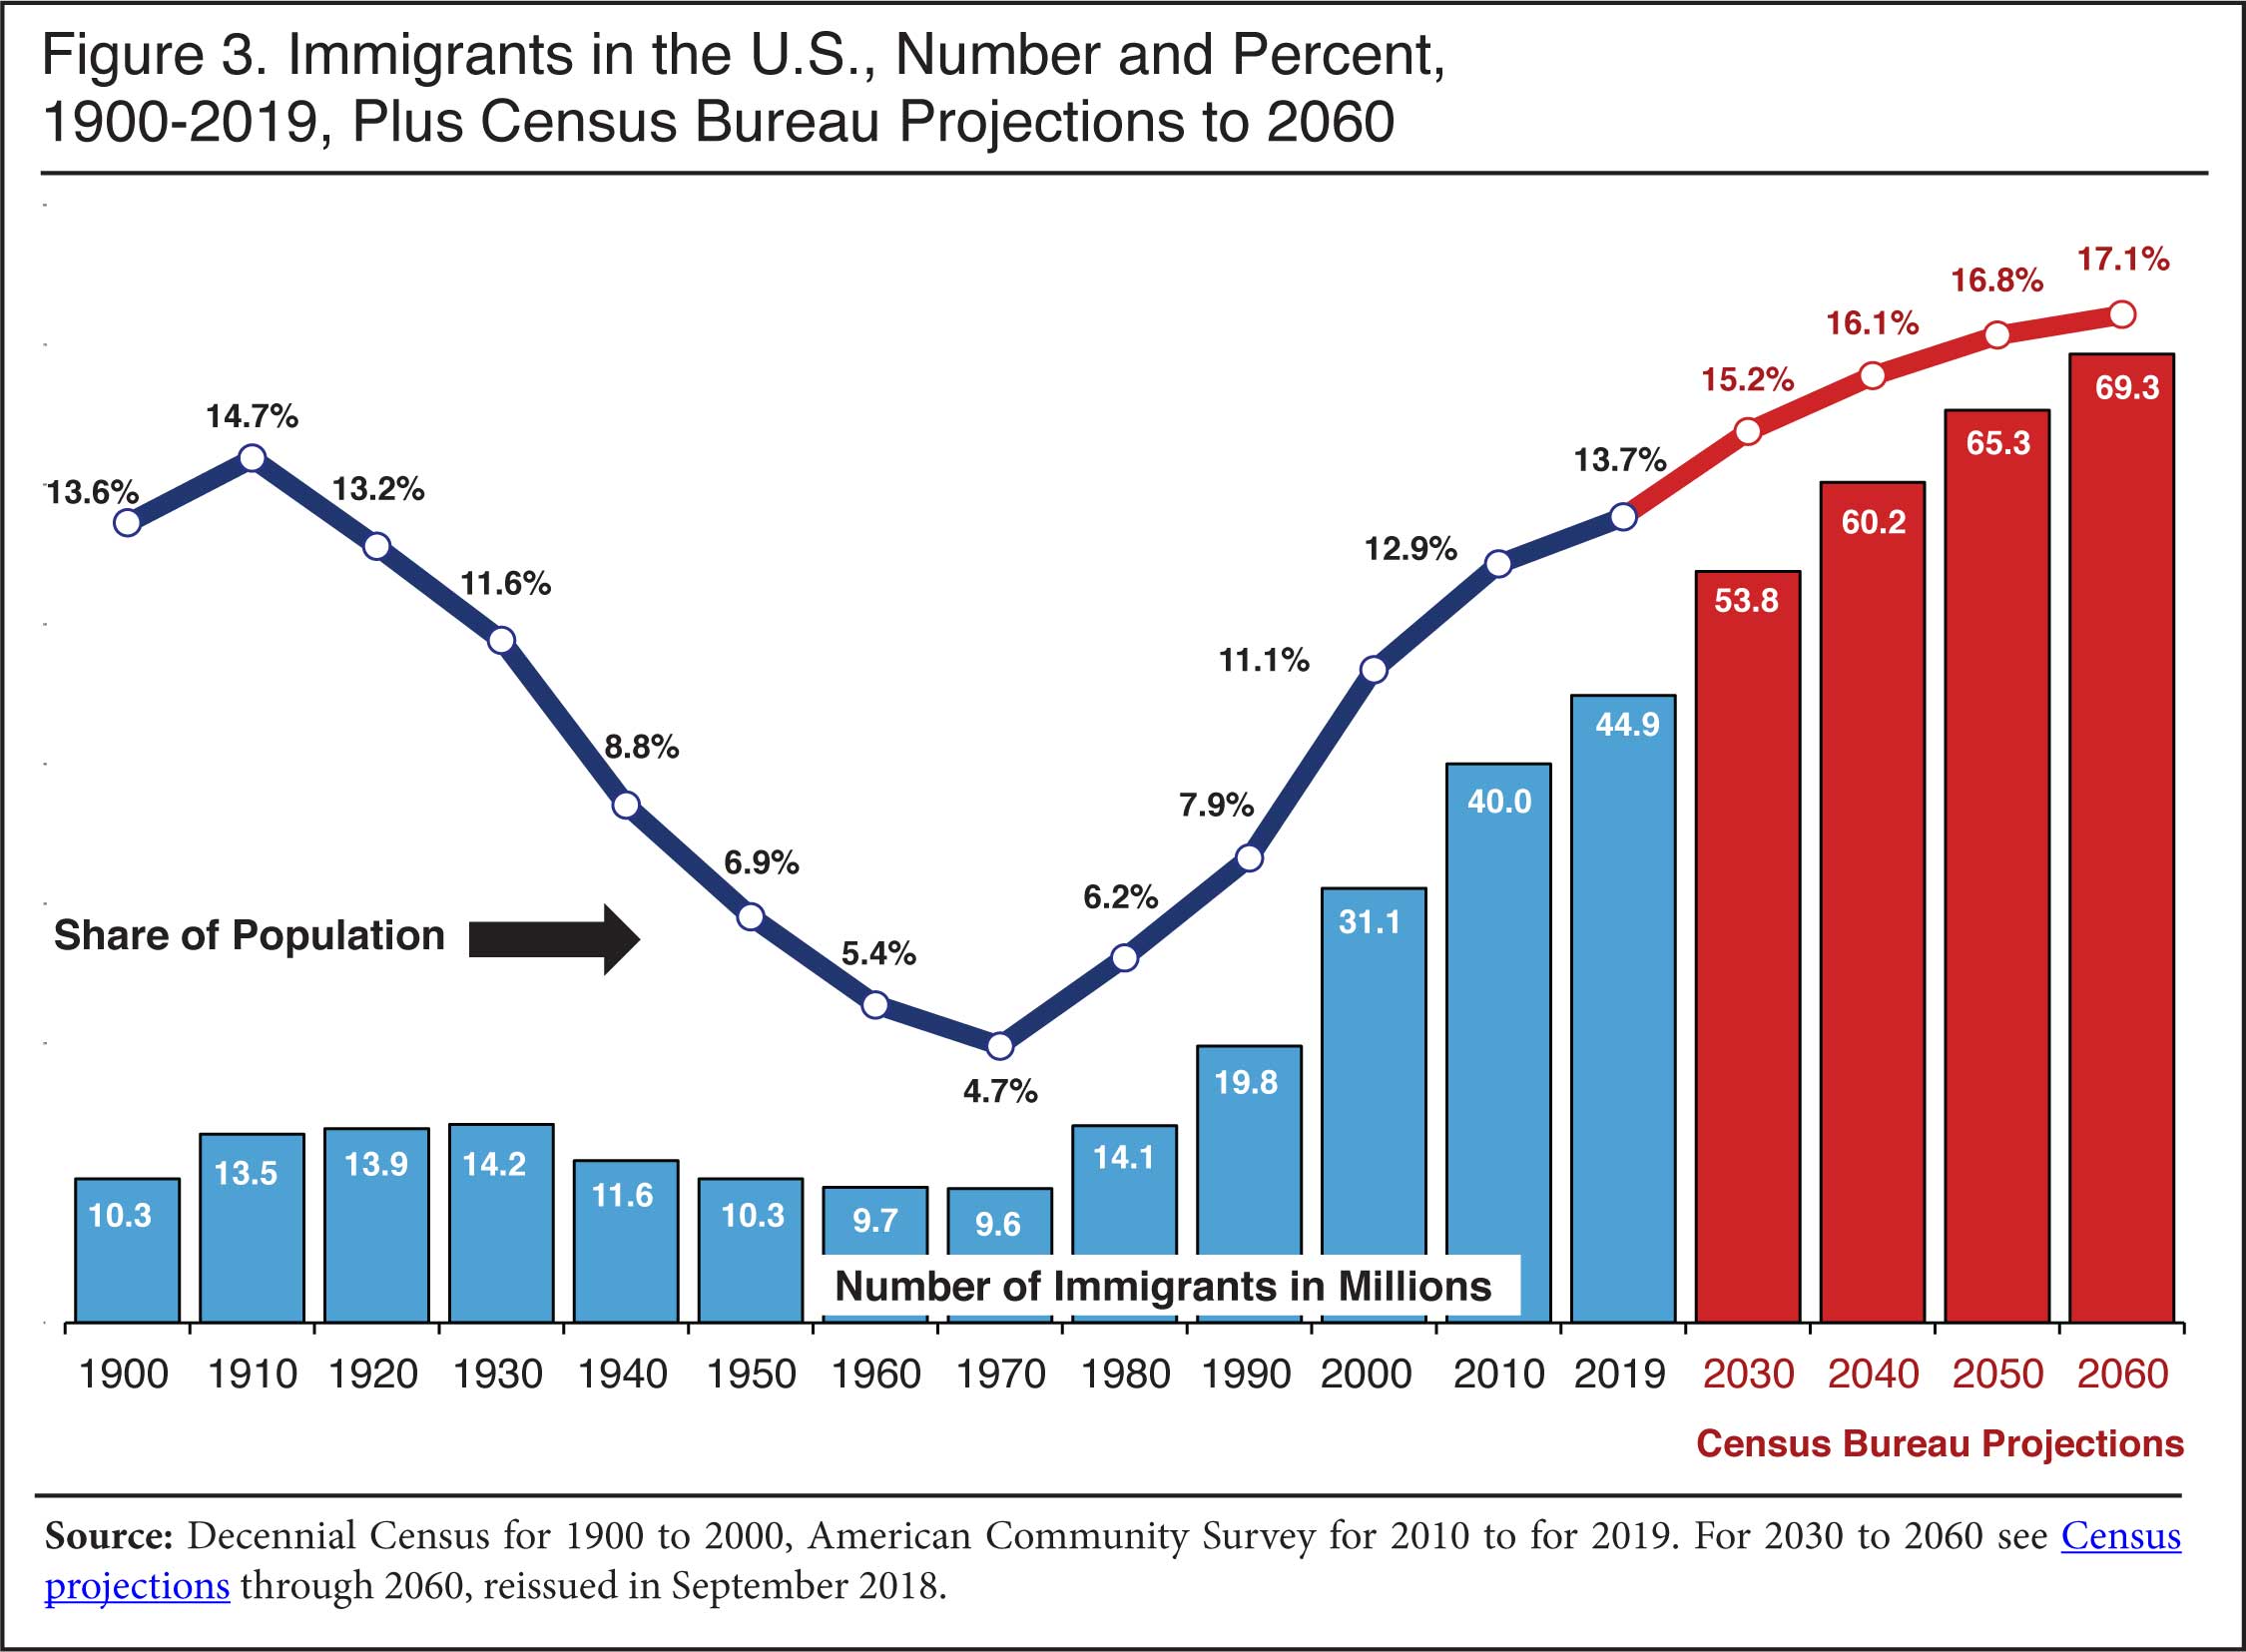
- Although the pace of increase has slowed down, the nation's immigrant population still hit a new record of 44.9 million in July 2019, an increase of about 204,000 over 2018.10 (Figures 1 and 3)
- As a share of the U.S. population, immigrants (legal and illegal) comprised 13.7 percent in 2019, the highest percentage in 109 years.11 (Figure 3)
- In addition to immigrants, there were 17.1 million U.S.-born minor children with an immigrant parent in 2019, for a total of 62 million immigrants and their children in the country — accounting for about one in five U.S. residents.12
Sending regions and U.S. states:
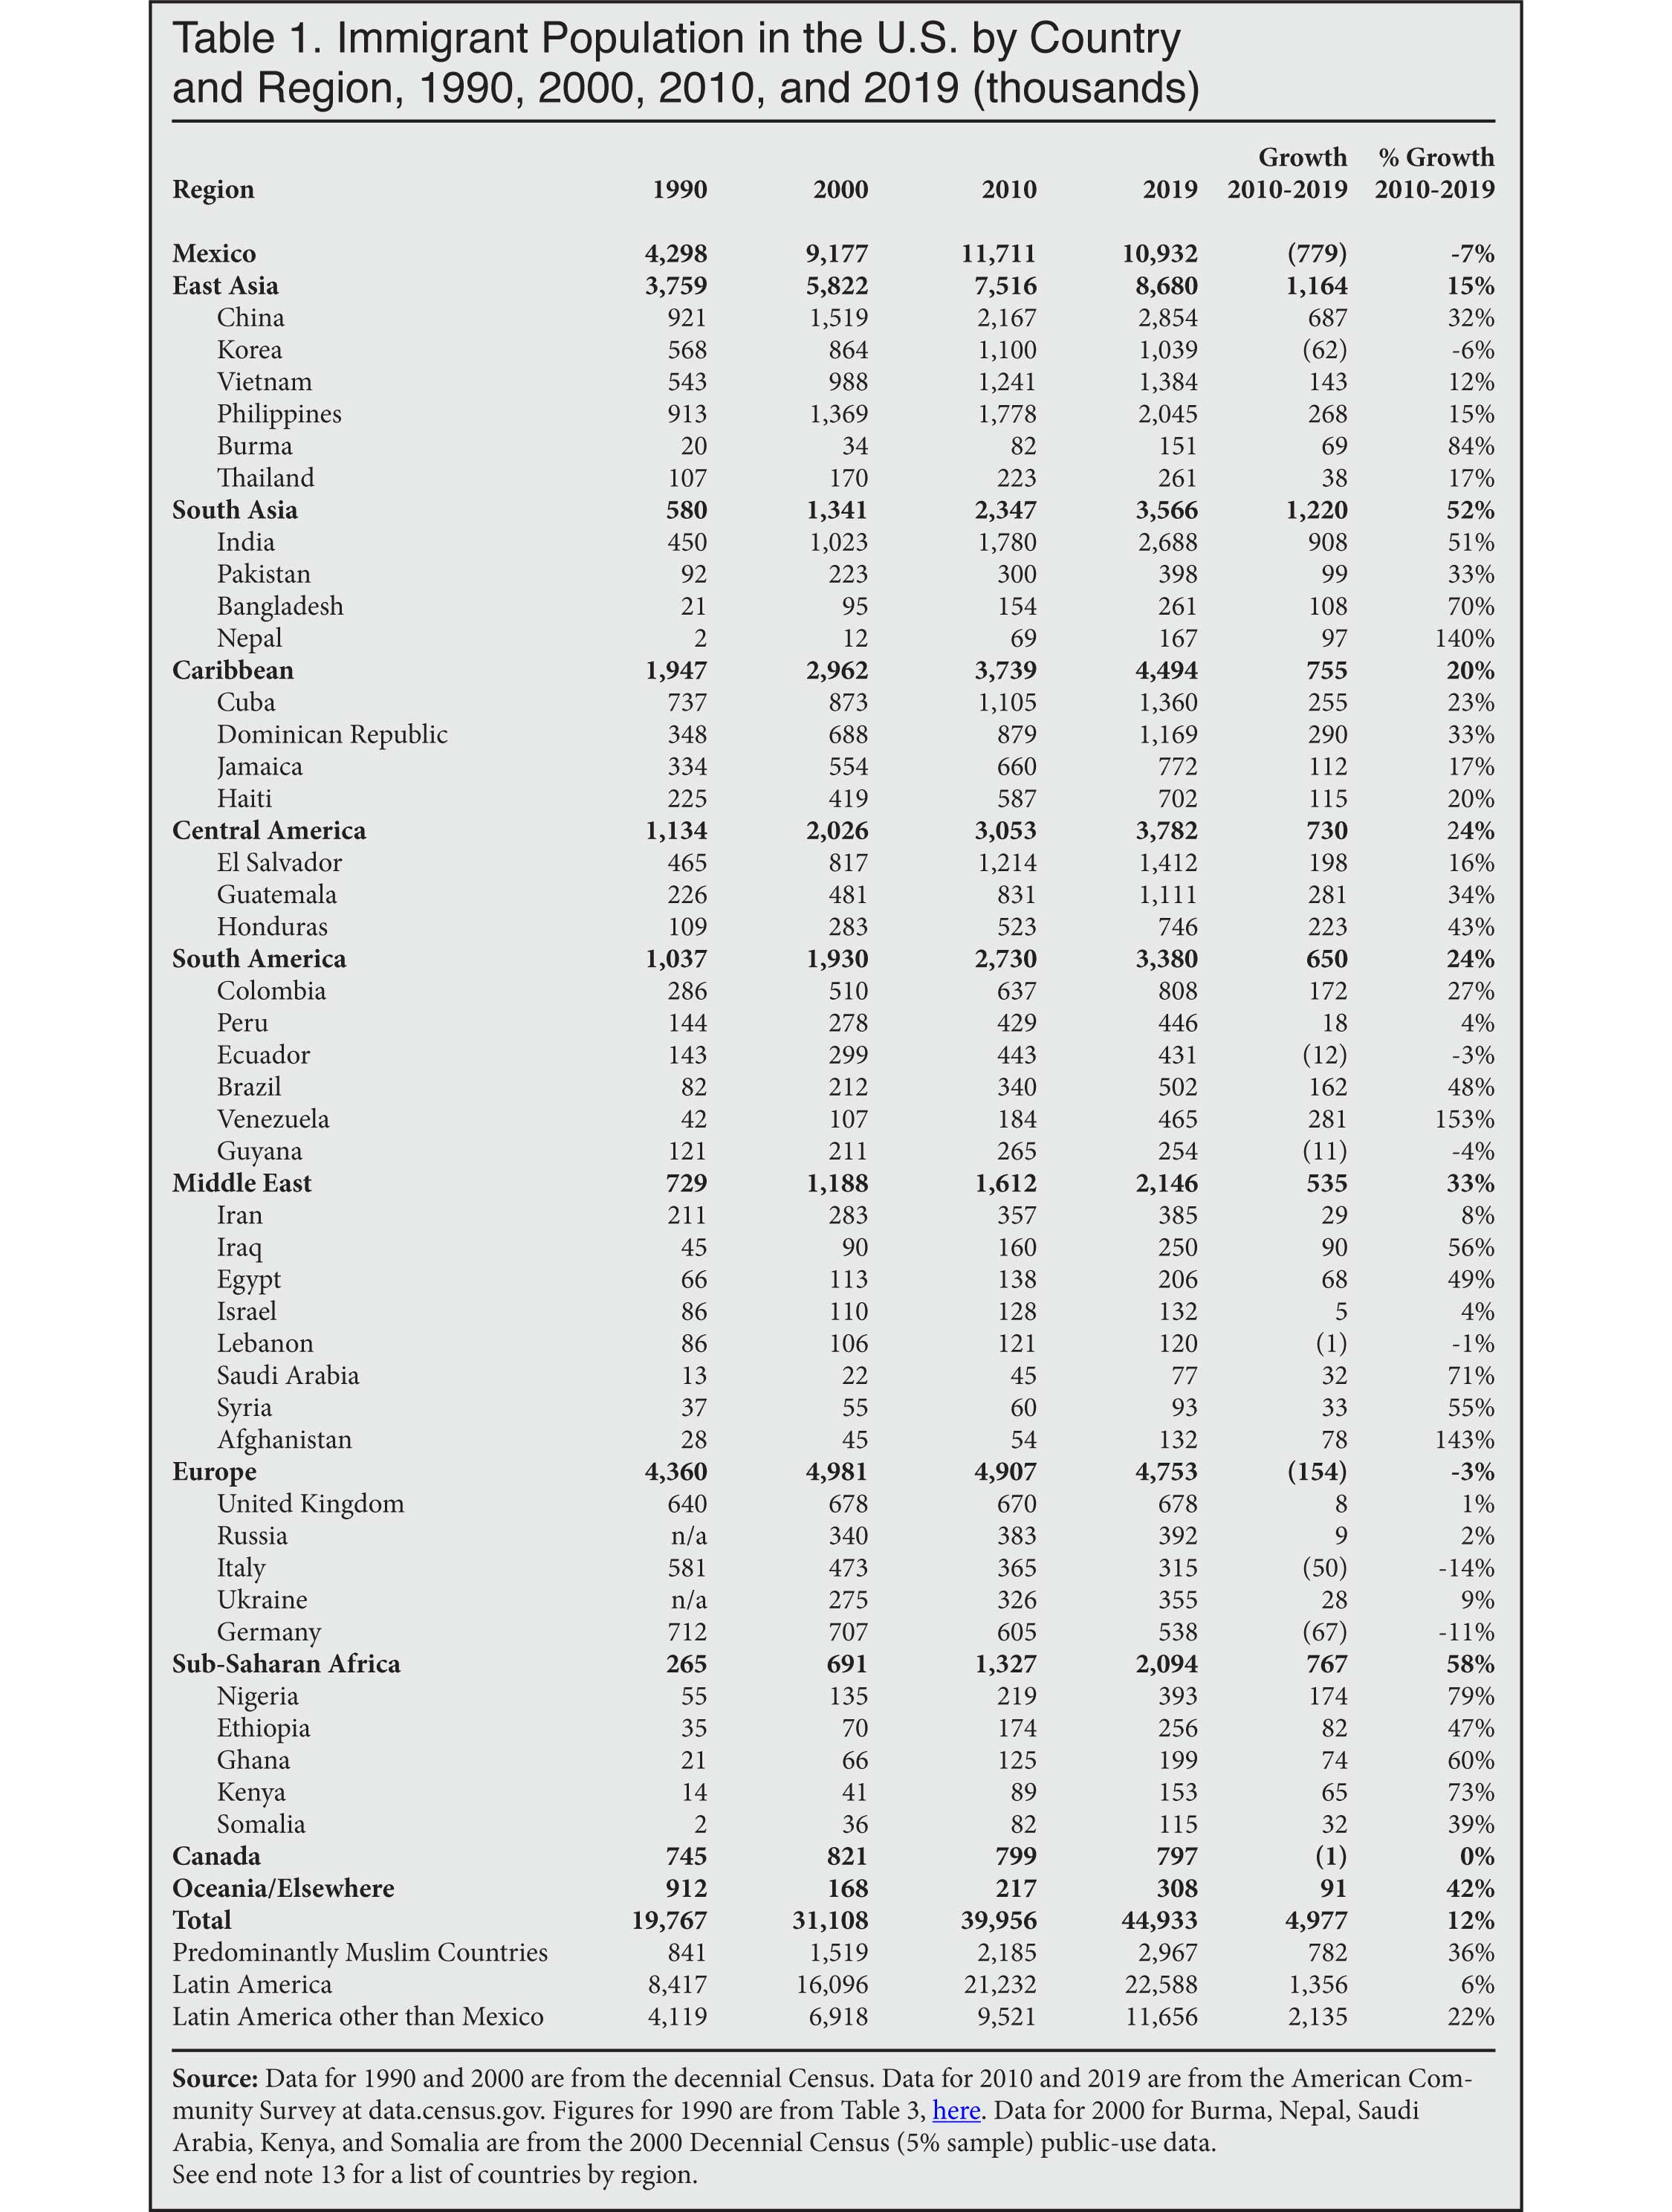
- Mexico accounted for 13 percent or 1.4 million of the immigrants who arrived since 2010, making it the top sending country. However, because of out-migration and natural mortality among the existing population, the overall Mexican-born population actually declined by nearly 780,000 between 2010 and 2019. (Tables 1 and 3)
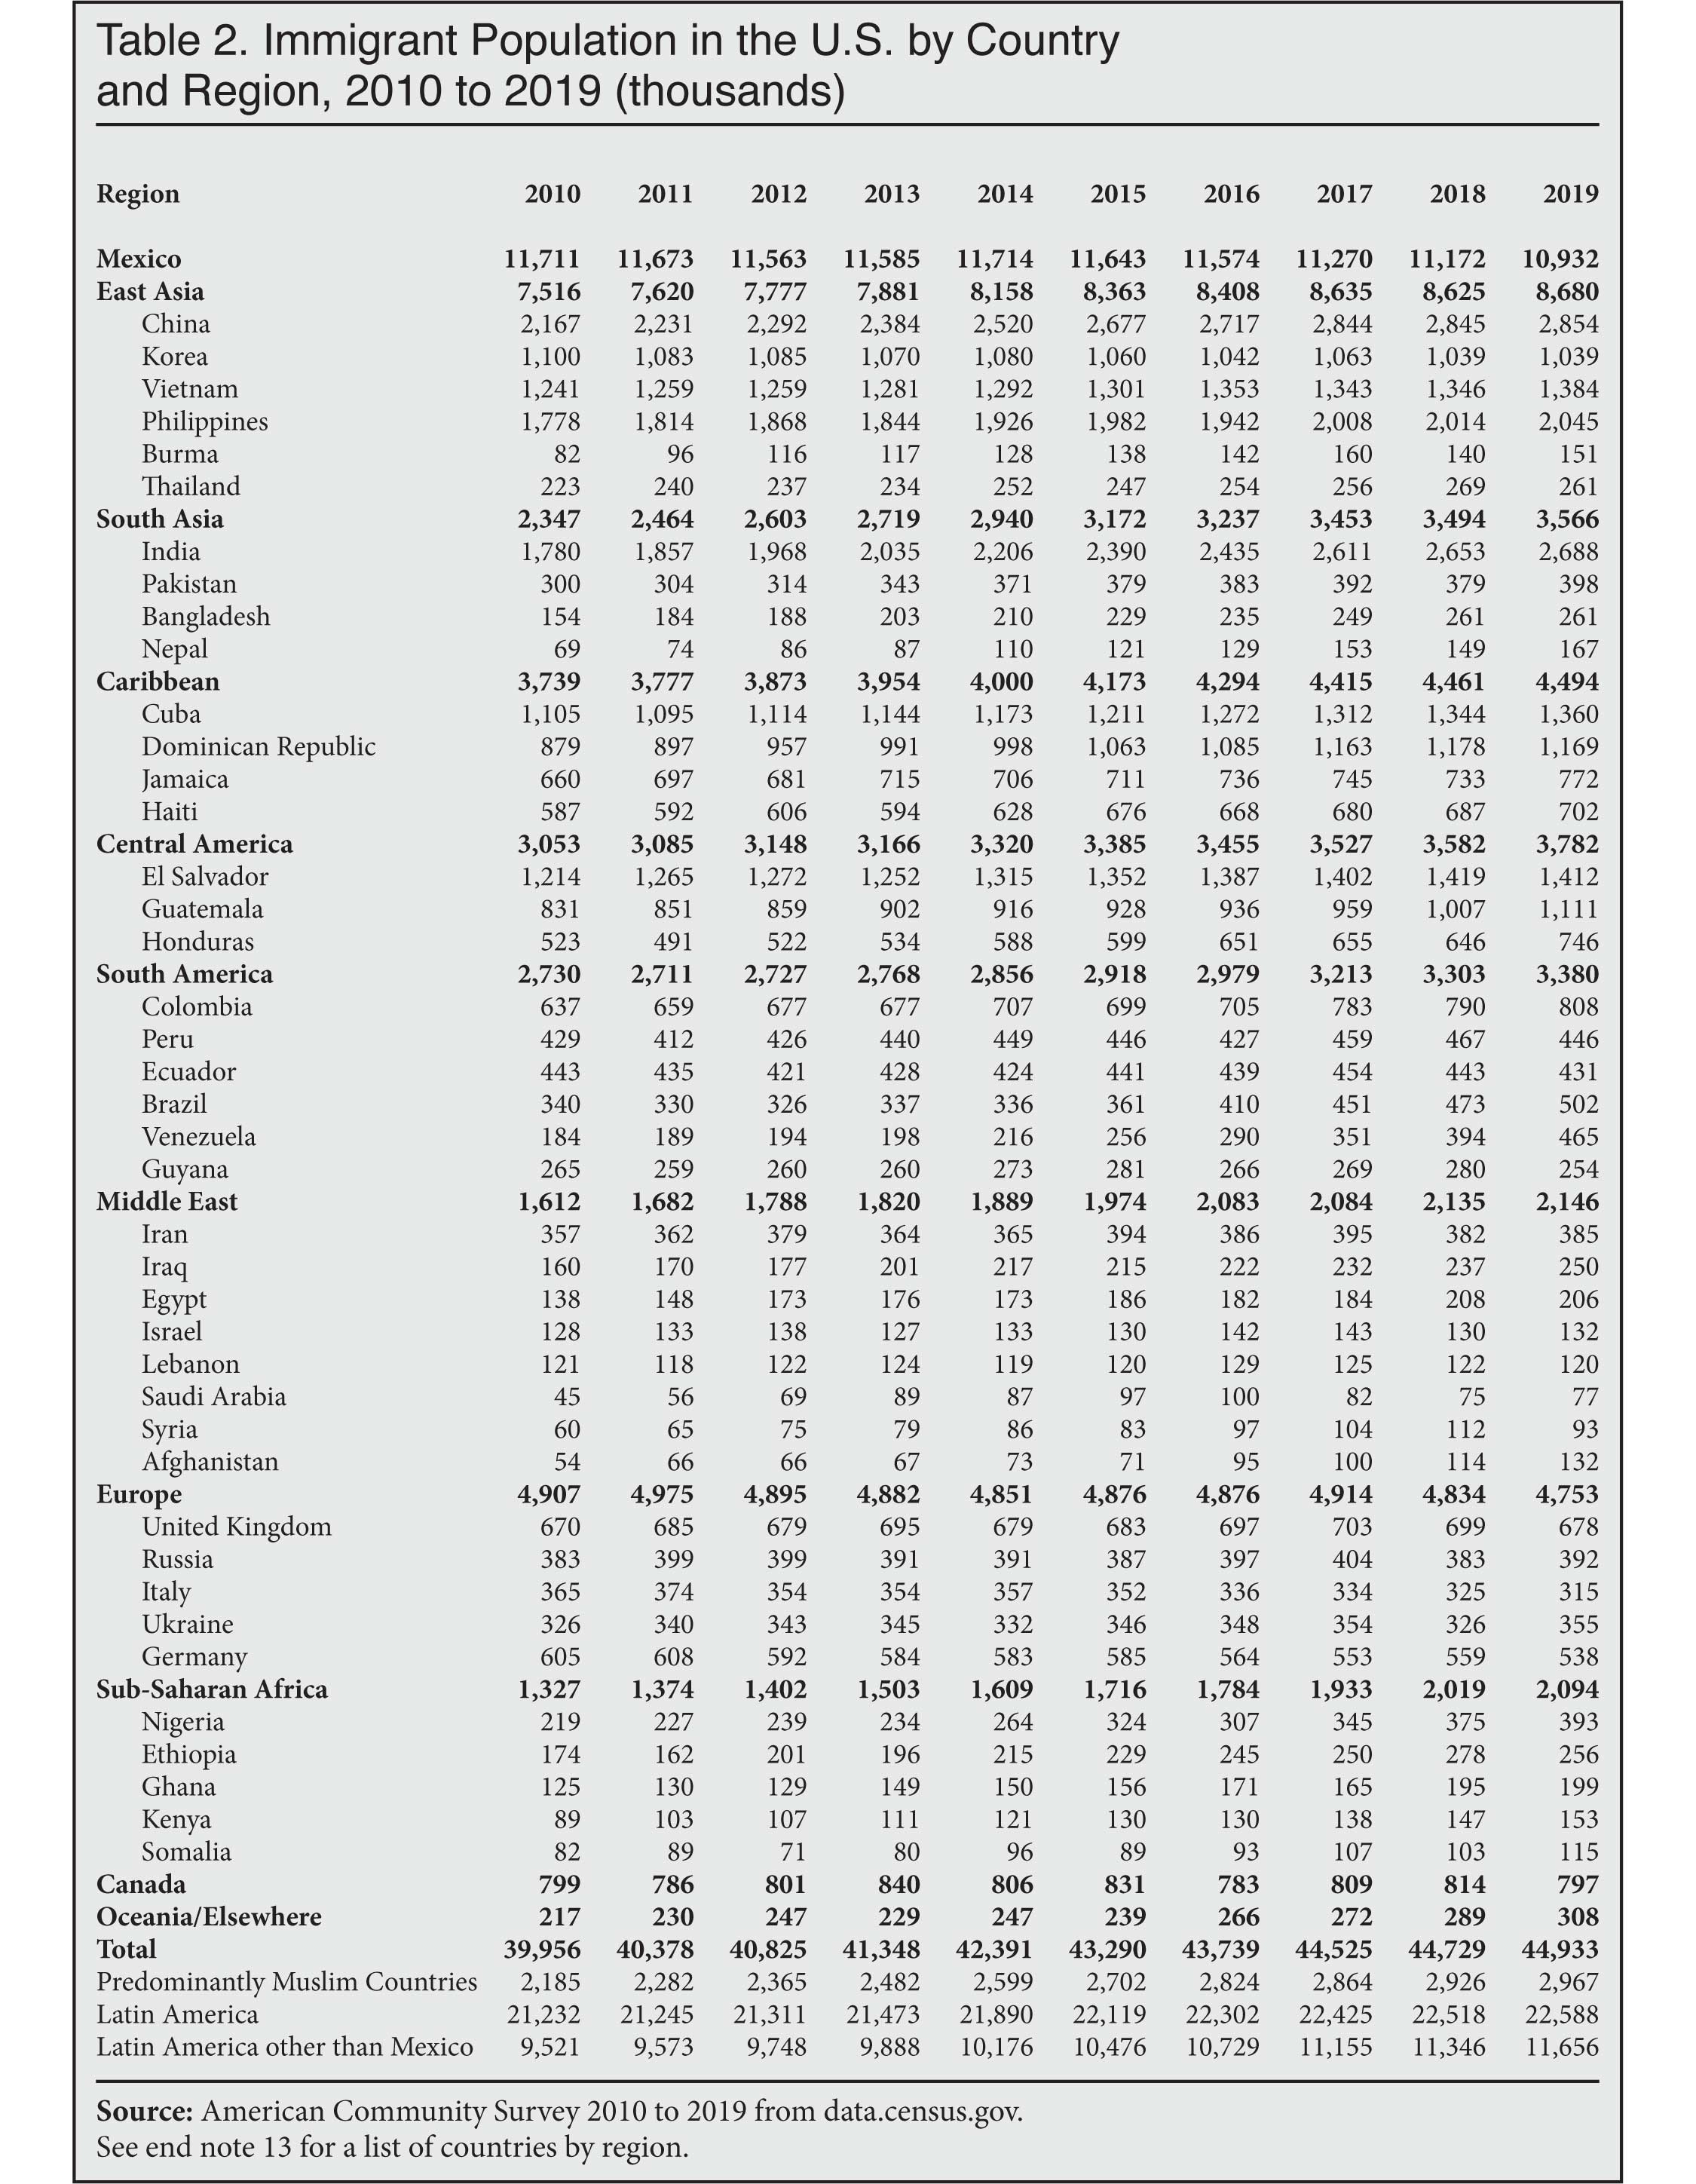
- There has been a significant increase in immigrants from Latin American countries other than Mexico. The number from Latin America (excluding Mexico) grew 2.1 million between 2010 and 2019 — significantly more than from any other part of the world. (Tables 1 and 2)
- Just between 2018 and 2019, the number of immigrants from Latin America (excluding Mexico), grew 310,000, with Central Americans accounting for about 200,000 of this increase and Venezuela roughly 70,000 of the increase. (Table 2)
- The sending regions with the largest numerical increases 2010 to 2019 were South Asia (up 1.22 million); East Asia (up 1.16 million); Sub-Saharan Africa (up 767,000); the Caribbean (up 755,000); Central America (up 730,000); South America (up 650,000); and the Middle East (up 535,000).13 (Table 1)
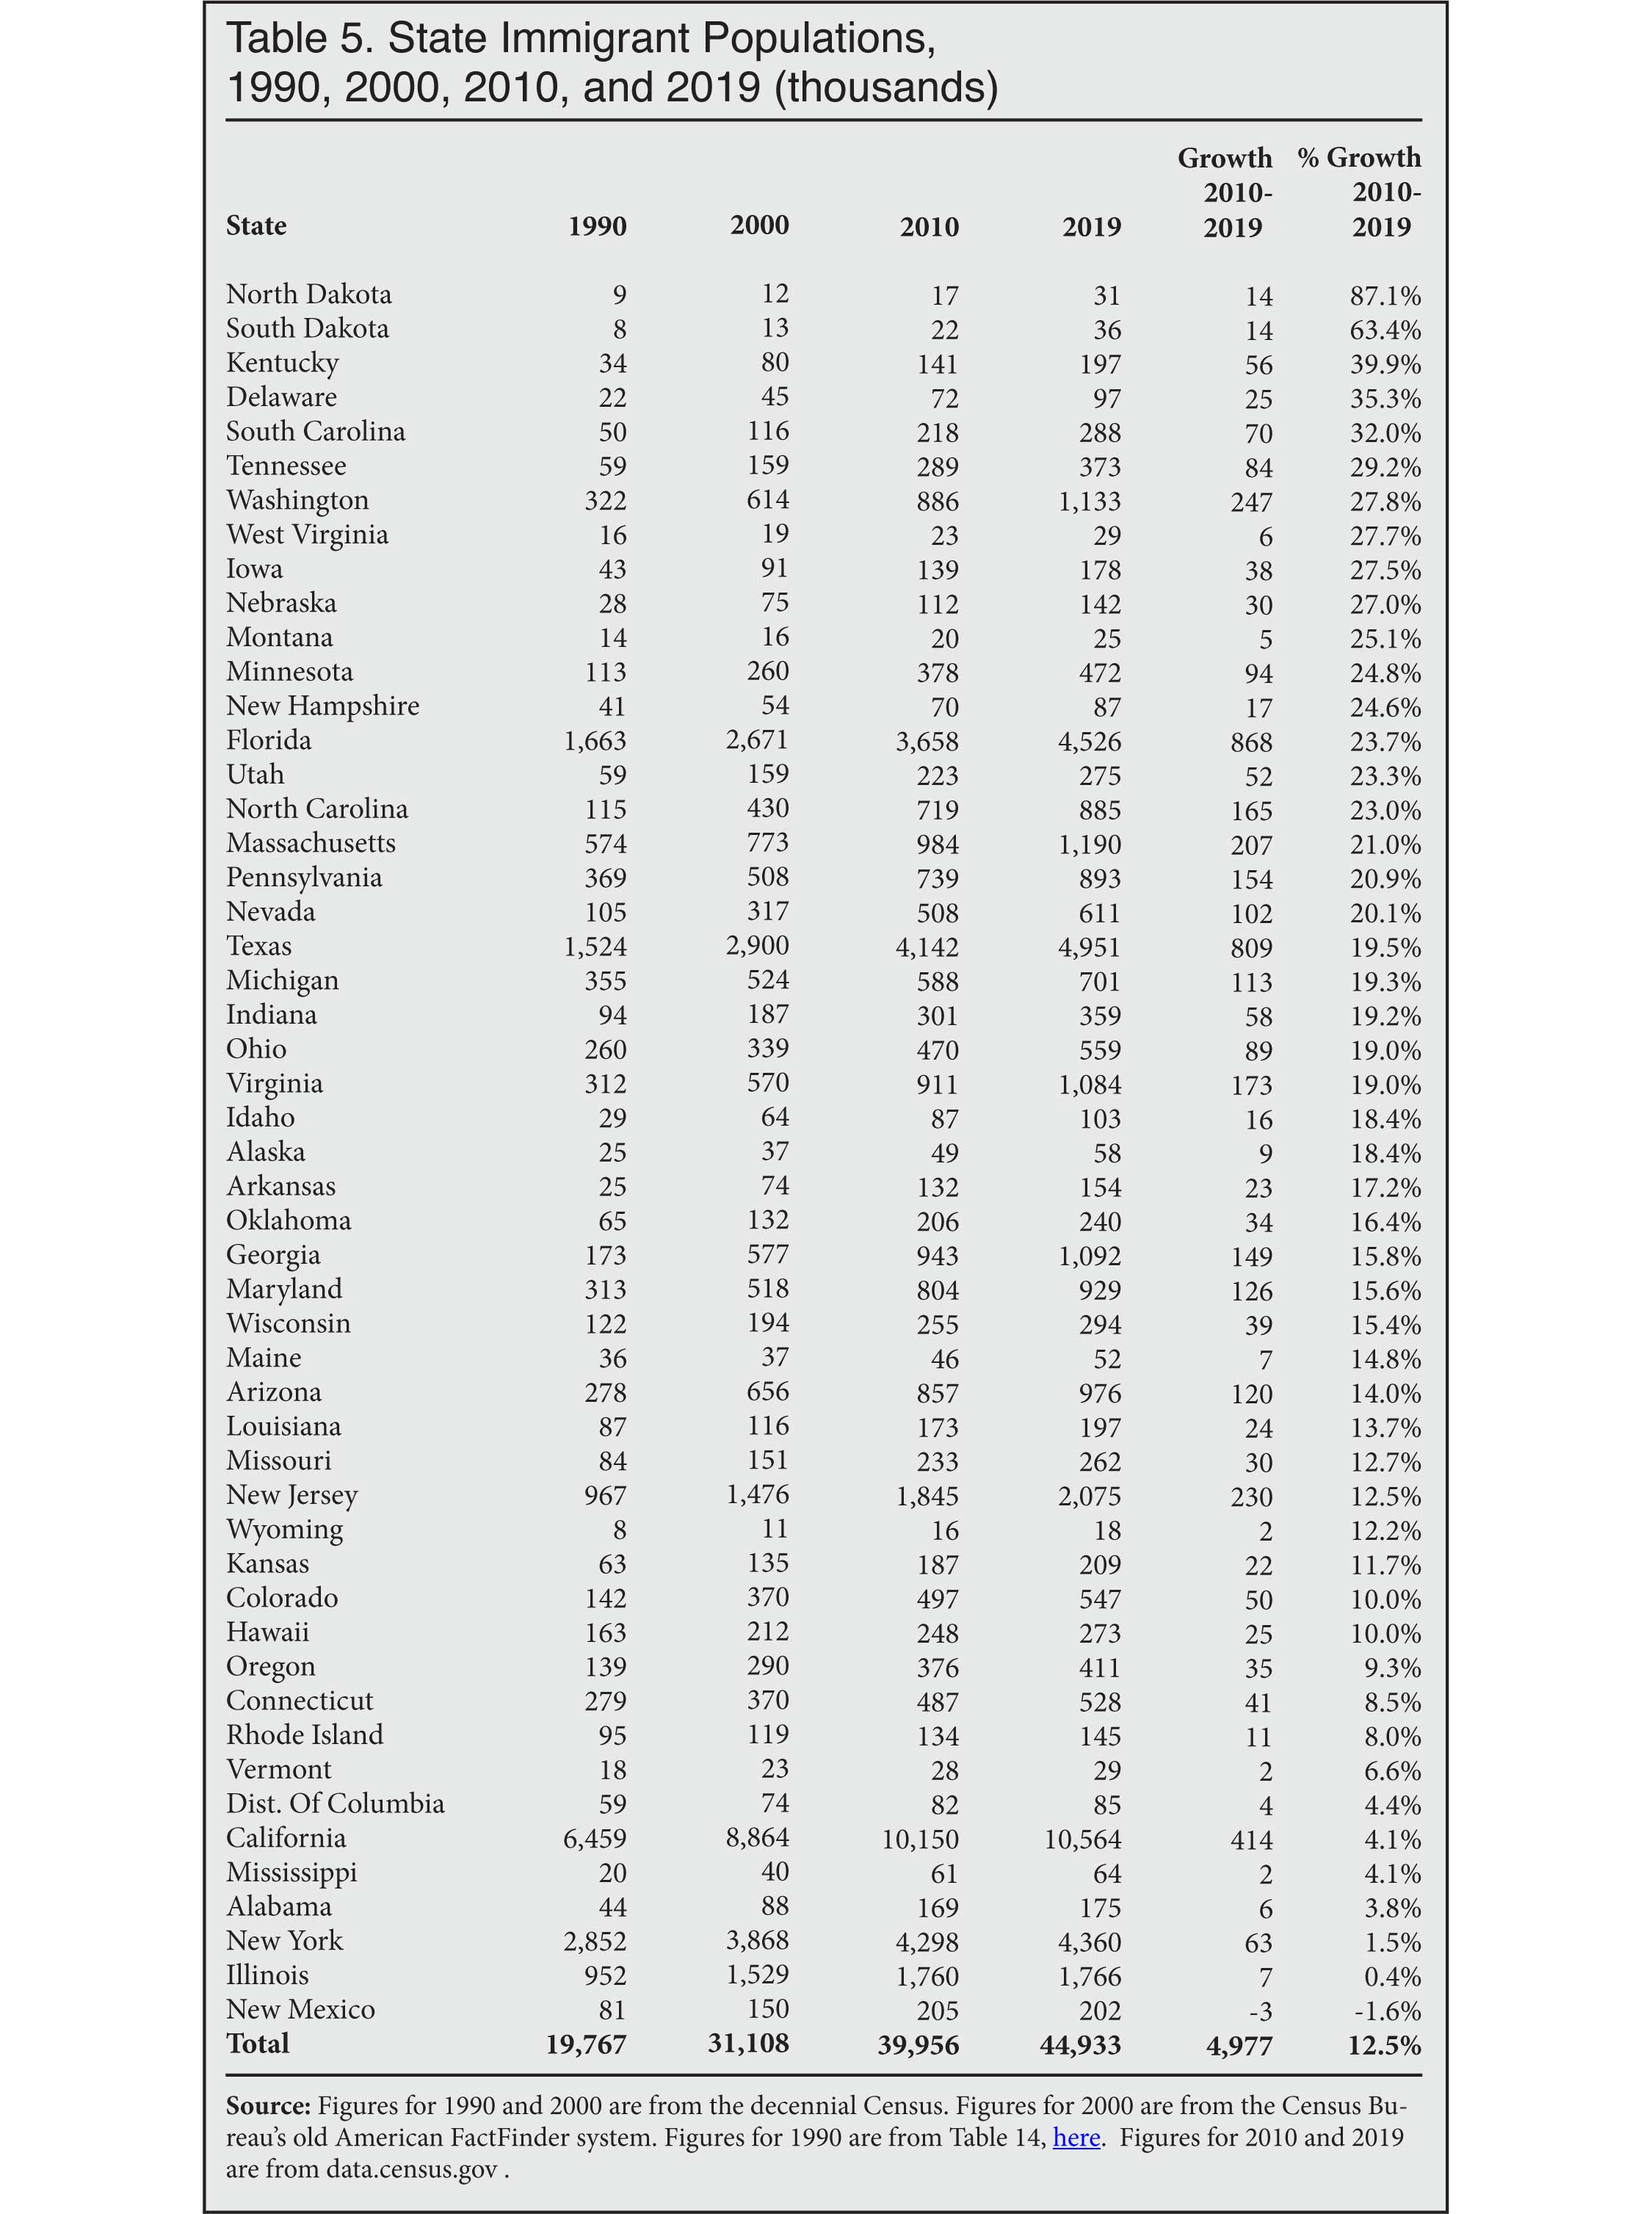
- The states with the largest numerical increase in the number of immigrants 2010 to 2019 were Florida (up 868,000); Texas (up 809,000); California (up 414,000); Washington (up 247,000); New Jersey (up 230,000); Massachusetts (up 207,000); Virginia (up 173,000); North Carolina (up 165,000); Pennsylvania (up 154,000); Georgia (up 149,000); Maryland (up 126,000); Arizona (up 120,000); Michigan (up 113,000); and Nevada (up 102,000). (Table 5)
- The states with the largest percentage increase 2010 to 2019 were North Dakota (up 87 percent); South Dakota (up 63 percent); Kentucky (up 40 percent); Delaware (up 35 percent); South Carolina (up 32 percent); Tennessee (up 29 percent); Washington and West Virginia (each up 28 percent); Iowa and Nebraska (each up 27 percent); and Montana (up 25 percent). (Table 5)
Data Source
At the end of September, the Census Bureau released some of the data from the 2019 American Community Survey (ACS). The survey reflects the U.S. population as of July 1, 2019. The ACS is by far the largest survey taken by the federal government each year and includes over two million households.14 The Census Bureau has posted some of the results from the ACS to its data.census.gov website.15 It has not released the public-use version of the ACS for researchers to download and analyze. However, a good deal of information can be found at data.census.gov. Unless otherwise indicated, the information in this analysis comes directly from the Bureau's website.
The immigrant population, referred to as the "foreign-born" by the Census Bureau, is comprised of those individuals who were not U.S. citizens at birth. It includes naturalized citizens, legal permanent residents (green card holders), illegal immigrants, temporary workers, and foreign students. It does not include those born to immigrants in the United States, including to illegal immigrant parents, or those born in outlying U.S. territories, such as Puerto Rico. Prior research by the Department of Homeland Security and others indicates that some 90 percent of illegal immigrants respond to the ACS.16 Thus all the figures reported above are for both legal and illegal immigrants.
 |
 |
 |
 |
 |
 |
 |
 |
 |
 |
 |
End Notes
1 Immigrants in the American Community Survey include all individuals who were not U.S.-citizens at birth — naturalized citizens, green card holders, long-term temporary visitors, and illegal immigrants.
2 We can calculate growth in the immigrant population during the Obama administration in several different ways, but all show the average annual increase during the first part of the Trump administration was about one-third of that. President Obama took office in January of 2009 and left office in January of 2017. The 2009 ACS showed a total immigrant population of 38.462 million, but the survey is widely recognized to have underestimated the size of this population. The Pew Research Center reweighted the 2009 ACS to reflect the 2010 Census. Pew's reweighted ACS total immigrant population for 2009 is 39.313. If we take growth from 2009 to 2016, it shows an increase of 4.43 million (632,000 a year). If we ignore 2009 due to data issues and measure the growth in the immigrant population from 2010 to 2016, it shows growth of 3.78 million (631,000 a year). We measure growth to 2017, but the ACS reflects the population on July 1 of each year, so the Obama administration is not "responsible" for growth in the first half of 2017. Measuring growth from 2009 (with Pew's reweighting) to 2017 shows a growth of 5.21 million and an average annual growth of 652,000.
3 Figure 2 reports year-over-year net migration of immigrants. The figure is created using a relatively simple and straight-forward method of roughly estimating the net migration of immigrants by adding growth in the immigrant population to deaths. Based on the race, age, and gender of the immigrant population in 2010, we estimate 288,000 deaths in that population between 2010 and 2011. The number of deaths increased to 322,000 between 2018 and 2019. Figure 2 takes deaths from year to year and adds it to growth to get the level of net immigration among immigrants. Over the entire period 2010 to 2019, net migration totaled 7.7 million. There are several caveats about these numbers. First, these figures take the point estimates from the ACS as they are, ignoring sampling variability. Using a 90 percent confidence level, the margin of error in the total foreign-born population is ±81,000 from 2010 to 2019. This variability may cause growth in the foreign-born to fluctuate from year to year, reflecting the underlying variation in the data rather than actual changes in the net migration of immigrants. Second, this approach uses the prior year to calculate deaths year over year and does not account for the very slight increase in deaths that occurs over the course of a year due to the increasing size of the immigrant population. A third point is also important: Our estimate of net migration is only for the immigrant (foreign-born) population. The movement of native-born Americans is not included. The Census Bureau publishes estimates of net-international migration as part of its population estimates. The Bureau is clear that their estimates of net international migration include "the international migration of both native and foreign-born populations" and are not just for immigrants. See footnote 2 in Table 5 at the Census Bureau's population estimates page, which shows the components of population change, here.
4 The unemployment rate was at or below 4.1 percent for all of 2018 and 2019 after having declined from 4.7 percent to 4.1 percent between January and December 2017. Historical data from the establishment survey shows an increase of 5.3 million jobs from January 2017 to July 2019.
5 In addition to asking about citizenship and country of birth, the ACS also asks immigrants what year they came to the United States. The information from data.census.gov, on which this analysis is based, only provides aggregated year of arrival data by decade, such as for 2010 to 2019. Only when the public-use microdata becomes available will we be able to know individual year of arrival.
6 To estimate out-migration, we can use the same mortality rate as in end note 3 and combine it with the year-of-arrival question in the ACS. However, individual year-of-arrival data has not yet been released by the Bureau for 2019. The information from data.census.gov, on which this analysis is based, only provides aggregated years by decade, such as for 2010 to 2019. The 2019 ACS shows 11.142 million immigrants living in the country who arrived from 2010 to 2019. However, this figure includes all of 2010, while growth from 2010 to 2019 (4.977 million) in the ACS is measured from July 1, 2010, to July 1, 2019, which is the population control date for the survey. Using the prior year's ACS (2018) and excluding one-half of those who arrived in 2010 (495,000) — to represent those who came in the first half of 2010 — allows us to roughly match arrival numbers to growth figures. This means that 10.647 million new immigrants arrived between July 1, 2010, and July 1, 2019. Deaths over this time period among the immigrant population totaled 2.745 million. Out-migration can be estimated using the following formula: new arrivals – (growth + deaths) = out-migration. Plugging in the numbers, we get the following: 10.647 million – (4.977 million + 2.745 million) = 2.925 million. This means 2.925 million people left the country in the nine years from 2010 to 2019, or about 325,000 annually. Deaths averaged about 305,000 a year. The main limitation with this calculation of outmigration is that it is based on aggregated year-of-arrival data in the 2019 ACS — 2010 to 2019. This means, for example, that an immigrant who arrived in 2012 and left in 2018 would not show up in the analysis. As a result, between 2010 and 2019 the number of new arrivals and departures was almost certainly significantly higher than the 11.1 million reported in the 2019 data. It is likely that annual out-migration between 2010 to 2019 actually averaged at least 450,000 a year. When individual year-of-arrival data is analyzed, a more accurate, and higher, measure of outmigration can be estimated.
7 The monthly Current Population Survey (CPS) reported in Figure 4 shows that the decline in the total immigrant population was due to a falloff in the number of non-citizens. Additionally, in the March CPS each year, the Census Bureau over-samples minorities and asks respondents additional questions not included in the basic monthly survey. The March CPS with the over-sample and additional questions is referred to as the Current Population Survey Annual Social and Economic Supplement (CPS ASEC). The CPS ASEC shows a larger immigrant population than the basic monthly CPS due to the differences in survey methodology. However, the CPS ASEC typically shows a smaller immigrant population than the ACS, primarily because the CPS ASEC does not include the institutionalized population, such as those in prisons and nursing homes. For reasons that are unclear, this was not the case in 2018 and 2019. The Center for Immigration Studies has published a detailed discussion of the puzzling divergence between the ACS and CPS ASEC. The 2020 CPS ASEC, as reported in Figure 5, does show a large decline in the immigrant population from March 2019 to March 2020. This could be an indication that the unexplained divergence between the ACS and CPS ASEC is at an end.
8 Recently, the Center's Executive Director, Mark Krikorian, summarized in National Review some of the most important changes undertaken by the Trump administration with regard to immigration. The Center also published a detailed look in January 2019 at the progress the administration has made in enacting administrative reforms.
9 The Trump administration has adopted a number of modest, mostly technical changes to existing policy and law designed to increase the integrity of the process and protect American workers. These changes may have resulted in some illegal immigrants or temporary visa holders giving up on adjusting to permanent status or extending their period of stay, thereby causing them to return home in larger numbers. Among the changes: In an attempt to work through the asylum backlog more quickly, USCIS is taking new cases first and trying to weed out frivolous claims. The Trump administration expanded the list of reasons immigrants can be deported. The administration has tightened the rules that are used to calculate the time F-1 and M visa holders can be in the country out of status. USCIS increased the vetting of information applicants provide for visa applications. Along the same lines, the agency requires a more thorough review of applicants for visa extensions for long-term temporary visitors. USCIS also more closely reviews the relationship between employers and visa holders when they are at third-party worksites. The president's "Buy American and Hire American" program has increased cooperation between USCIS and the DOJ in an effort to make sure Americans are not discriminated against.
10 The Department of Homeland Security has previously estimated that 1.96 million immigrants are missed by the ACS, so the total immigrant population in 2019 was likely 46.9 million. See Table A1-1 on p. 11 in Bryan Baker, "Estimates of the Unauthorized Immigrant Population Residing in the United States: January 2015", Office of Immigration Statistics, DHS, December 2018.
11 The immigrant share of the population was very slightly higher in 2019 (13.69 percent) than in 2018 (13.67 percent).
12 The figure for immigrants is from the 2019 American Community Survey (ACS). The figure for U.S.-born children is from the public-use files of the 2019 and 2020 Current Population Survey Annual Social and Economic Supplement (CPS ASEC) and is for those under age 18 born in the United States with either a mother or father born outside of the United States. Unlike the ACS, the CPS ASEC asks all respondents about their parents' places of birth, including children. The CPS ASEC is collected in March each year. The 2019 CPS ASEC showed 17.4 million U.S.-born children of immigrants, while the 2020 CPS ASEC showed 16.61 million U.S.-born children of immigrants. While it is not clear is why the child population declined, taking the numbers as given and assuming a constant rate of change between March 2019 to March 2020 means that on July 1, the control date of the 2019 ACS, there were 17.1 million U.S.-born minor children of immigrants.
13 Regions are defined in the following manner: East Asia: China (including Hong Kong and Taiwan), Japan, Korea, Cambodia, Indonesia, Laos, Malaysia, Myanmar, Philippines, Singapore, Thailand, Vietnam, Other Southeastern Asia, Other Eastern Asia, Asia n.e.c; South Asia: Bangladesh, India, Nepal, Pakistan, Sri Lanka; Caribbean: Bahamas, Barbados, Cuba, Dominica, Dominican Republic, Grenada, Haiti, Jamaica, St. Vincent and the Grenadines, Trinidad and Tobago, West Indies, Other Caribbean, Other Northern America; Central America: Belize, Costa Rica, El Salvador, Guatemala, Honduras, Nicaragua, Panama, Other Central America; South America: Argentina, Bolivia, Brazil, Chile, Colombia, Ecuador, Guyana, Peru, Uruguay, Venezuela, Other South America; Middle East: Afghanistan, Iran, Kazakhstan, Uzbekistan, Iraq, Israel, Jordan, Kuwait, Lebanon, Saudi Arabia, Syria, Yemen, Turkey, Egypt, Morocco, Sudan, Other Northern Africa, Other South Central Asia, Other Western Asia; Europe: United Kingdom, Ireland, Denmark, Norway, Sweden, Other Northern Europe, Austria, Belgium, France, Germany, Netherlands, Switzerland, Other Western Europe, Greece, Italy, Portugal, Spain, Albania, Belarus, Bulgaria, Croatia, Czech Republic, Slovakia, Hungary, Latvia, Lithuania, Macedonia, Moldova, Poland, Romania, Russia, Ukraine, Bosnia and Herzegovina, Serbia, Armenia, Other Southern Europe, Other Eastern Europe, Europe, n.e.c; Sub-Saharan Africa: Eritrea, Ethiopia, Kenya, Somalia, Other Eastern Africa, Cameroon, South Africa, Other Southern Africa, Cape Verde, Ghana, Liberia, Nigeria, Sierra Leone, Other Western Africa, Other Middle Africa, Africa n.e.c; Oceania/Elsewhere: Australia, Oceania, Pacific Islands, Fiji, and elsewhere. Predominately Muslim Countries includes the following: the Middle East (excluding Israel) as well as Bangladesh, Pakistan, Somalia, Indonesia, and Malaysia. The country list reflects 2010 and 2019; in 2000 the list of specific countries was less detailed.
14 Detailed information on the American Community Survey methodology, questions, and other topics on the can be found here.
15 Unless otherwise indicated, all of the information on the immigrant or foreign-born population used in this analysis comes from data.census.gov or its predecessor, American FactFinder, which is now defunct.
16 The Department of Homeland Security has previously estimated that 1.96 million immigrants are missed by the ACS, so the total immigrant population in 2019 was likely 46.9 million. See Table A1-1 on p. 11 in Bryan Baker, "Estimates of the Unauthorized Immigrant Population Residing in the United States: January 2015", Office of Immigration Statistics, DHS, December 2018.