Download a PDF of this Backgrounder.
Steven A. Camarota is the director of research and Karen Zeigler is a demographer at the Center.
Summary. Using the Census Bureau’s annual American Community Survey (ACS) as the primary data source, this analysis examines immigration’s impact on U.S. population growth from 2001 to 2021, the last year for which ACS data is available. We find that immigration growth accounts for an increasing share of population growth in recent years even though the number of new immigrants arriving fell some from 2017 to 2020 and overall population growth slowed. We estimate that the net migration of immigrants plus births to immigrants was equal to 77 percent of population growth from 2016 to 2021. The primary reason immigration now accounts for such a large share of the increase in the population is that the level of immigration remains very high coupled with the well-documented decline in natural increase among U.S. residents — births minus deaths — even before Covid. The Census Bureau population estimates, which run through the middle of 2022, show that net migration by itself accounted for 80 percent of U.S. population growth from 2021 to 2022. However, even this number is probably an understatement in our view because the method used by the Census Bureau to estimate migration cannot fully capture the scale of the ongoing border crisis and resulting surge of new illegal immigration into the country. We expect natural increase to rebound some as deaths decline significantly and births increase some as the pandemic abates. Even if natural increase rebounds as expected, it is almost certain that immigration will continue to account for the lion’s share of population growth for the foreseeable future, particularly if births to immigrants are included in the calculation.
Introduction
One of the most direct ways immigration impacts a receiving country is by adding to its population. The Center for Immigration Studies, the U.S. Census Bureau, and many others have projected the likely impact of immigration on the future size of the U.S. population. In contrast, this analysis is retrospective; that is, it looks back over the last two decades and estimates the impact of immigration on the overall size of the U.S. population using Census Bureau data. While there are a number of ways to look at the impact of immigration on population growth, no matter how one examines the data it is clear immigration is the determinate factor in U.S. population growth in the last two decades. Further, the share of population growth attributable to immigration has increased in recent years as fertility has slowed and deaths have risen among U.S. residents.
Throughout this report, we use the terms “immigrant” and “foreign-born” interchangeably to mean all persons who were not U.S. citizens at birth. This includes naturalized citizens, legal permanent residents, long-term temporary visitors (e.g. foreign students and guestworkers), and illegal immigrants. Although some share of the foreign-born, particularly illegal immigrants, are missed by the Census Bureau, we do not attempt to adjust the data to account for this issue and instead take the data as reported by the government.
The Impact of Immigration on Population Growth Based on Census Bureau Surveys
We primarily use the public-use files of the American Community Survey (ACS) to estimate the share of the U.S. population between 2001 and 2021 that is attributable to immigration, divided into five-year time periods.1 The ACS is the largest survey conducted by the U.S. Census Bureau each year. The 2022 ACS will not be released until the fourth quarter of this year, so we can only use the survey to estimate population growth through 2021. In addition to the ACS, we also use a combined three-month sample from the June, July, and August Current Population Surveys to estimate births to immigrants. The CPS is also collected by the Census Bureau and, unlike the ACS, it specifically asks respondents their parents’ place of birth, so the number of U.S.-born children of immigrants can be easily identified in the survey. All of the estimates reported here reflect the impact of immigration through July 1 of each year. We provide nine different ways for estimating the effect of immigration on U.S. population growth since 2001 based on the ACS. We report these different methods to help those who are interested in this issue to understand different ways of thinking about this question.
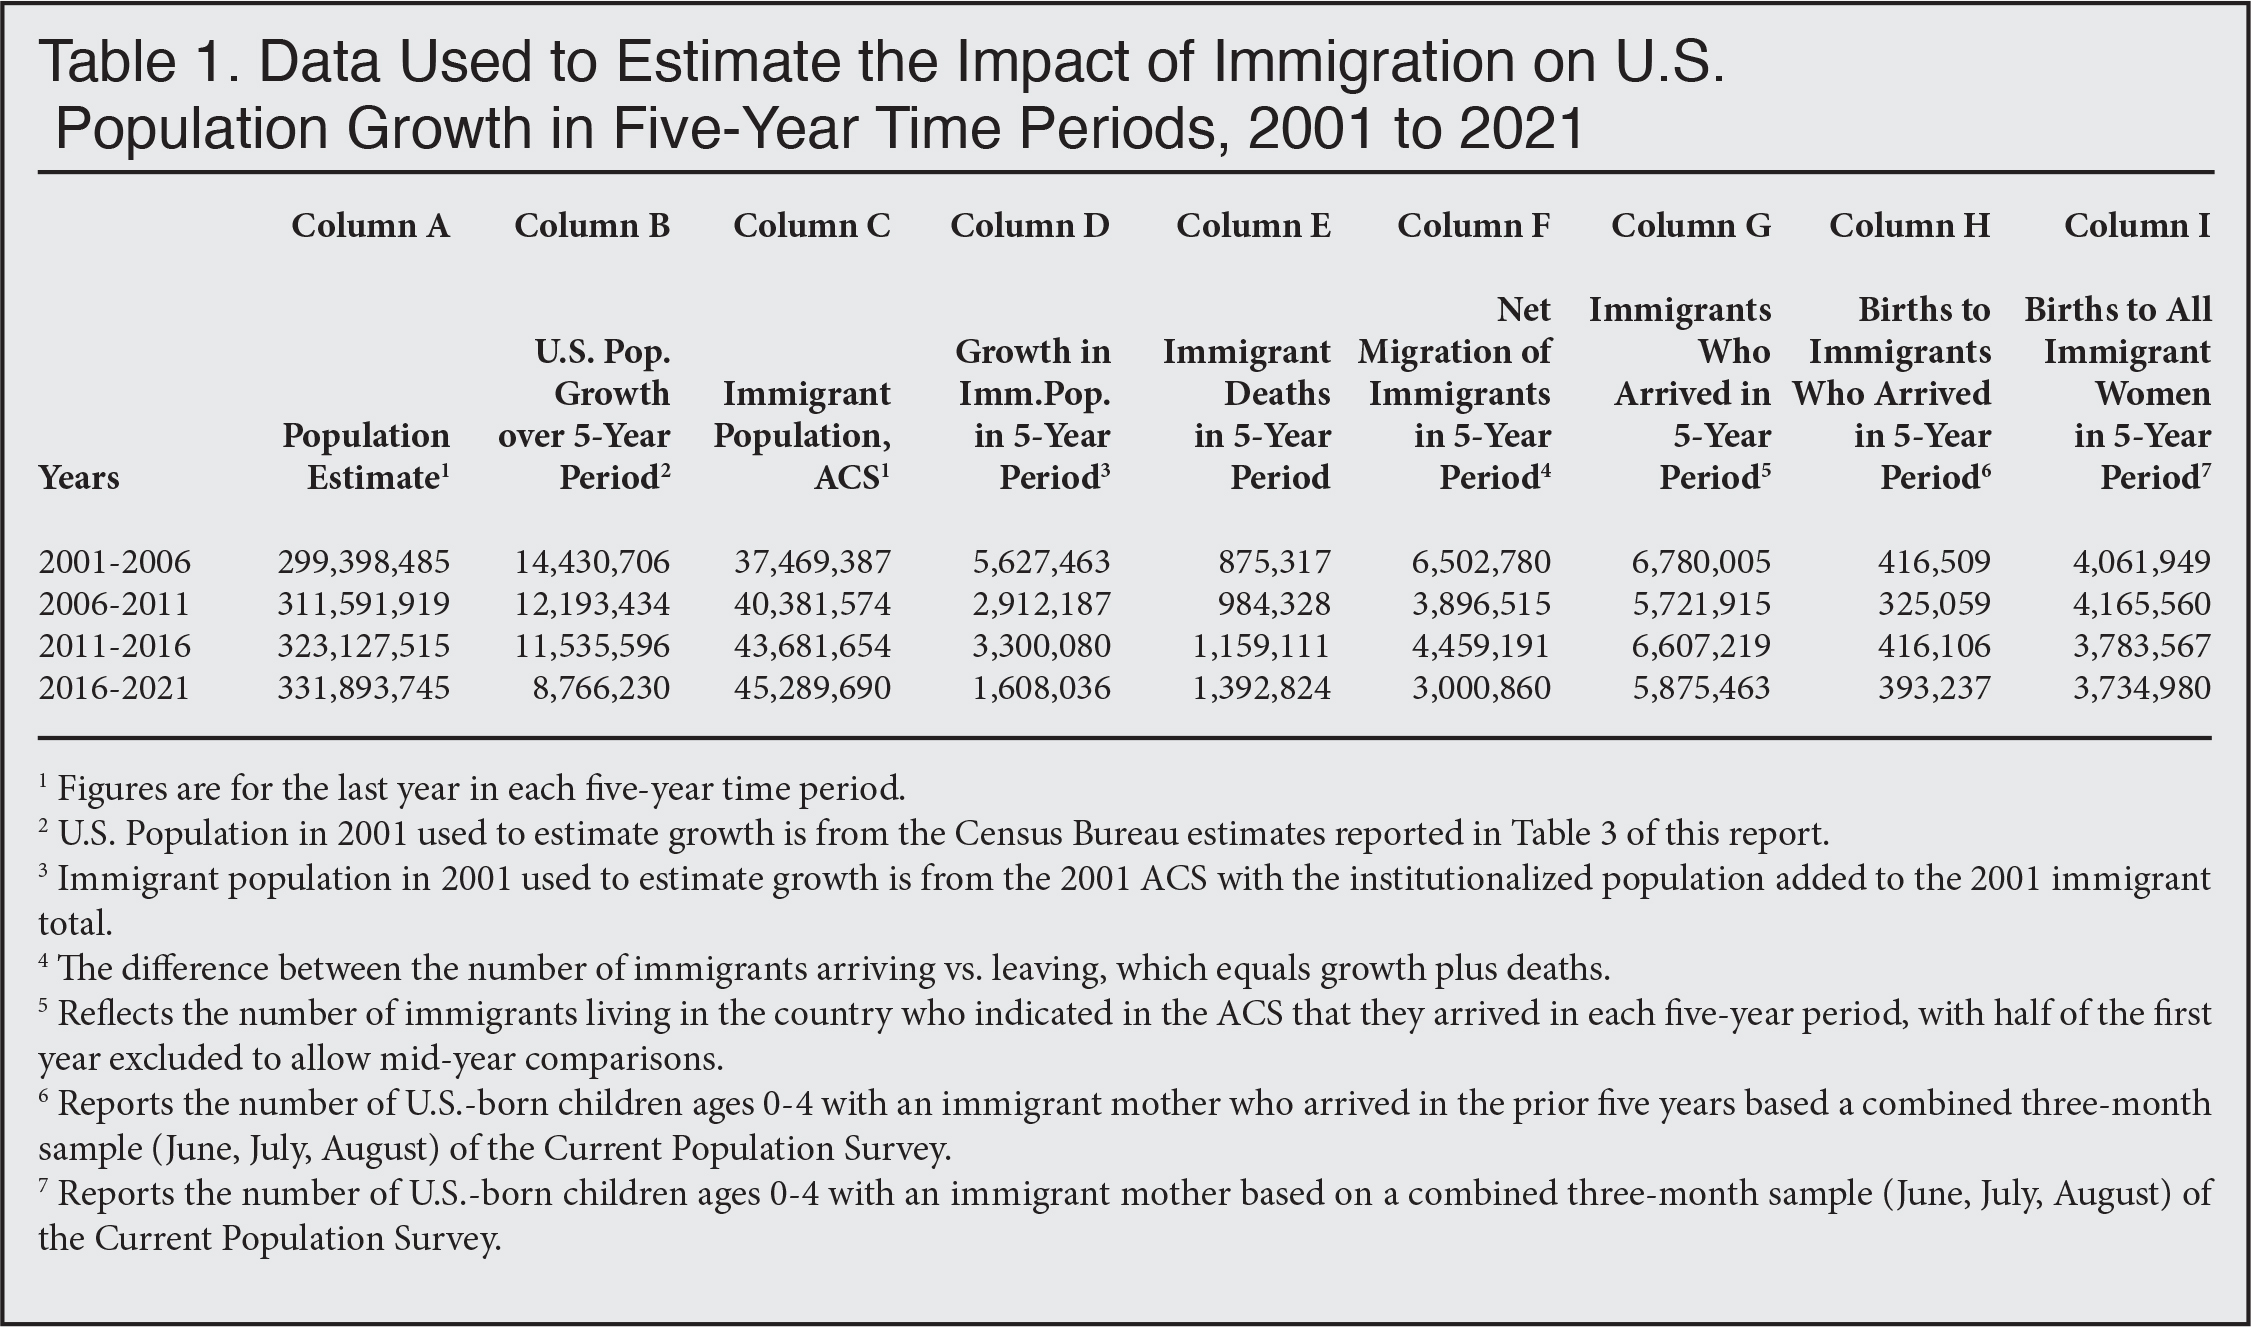
Basic Data. Table 1 reports the basic information we use later in this analysis to estimate the impact of population growth attributable to immigration. Column A in Table 1 shows the total U.S. population in the last year of each five-year time period used for our analysis.2 Column B reports the growth of the U.S. population over each five-year time period, while Column C reports the size of the immigrant population based on the ACS in the last year of each five-year period, and Column D shows growth in the immigrant population over the same time period3. Column E is the estimated number of deaths among immigrants over each five-year period.4 Column F adds growth in the immigrant population to immigrant deaths to estimate net migration — the difference between the number of immigrants arriving vs. the number leaving. It should be noted that, as we discuss later in this report, the Census Bureau population estimates include “net international migration” (NIM) as a component of change. However, the NIM reported by the Census Bureau includes both the movement of the U.S.-born and immigrants in and out of the country. In contrast, figures in Column F are only for the foreign-born. Column G is the number of immigrants who arrived in each time period based on the year of entry question in the survey.5 Column H shows the number of births to immigrant mothers from the Current Population Survey (CPS) who indicated they arrived in the prior five years and Column I is the number of births from the CPS to all immigrant women during this time.6
 |
Different Ways of Estimating the Impact of Immigration. Table 2 uses the information in Table 1 to estimate the impact of immigration on U.S. population growth. The information used in Table 2 to estimate the impact of immigration can be found in Table 1. The calculations above each column in Table 2 refer to the column headings in Table 1. So, for example, in the second column of Table 2 where it reads “Columns (D+H)/B from Table 1” the percent reported for each five-year period takes growth in the immigrant population from Table 1, Column D, and adds in births to recent immigrants from Column H, and then divides that sum by the total increase in the U.S. population from Column B in Table 1. Table 2 is organized as follows: The first three columns in the table use growth in the immigrant population as a basis to estimate immigration’s impact on population growth. The middle three columns in the table use net migration to estimate the effect of immigration. The last three columns in Table 2 use the number of immigrants arriving as the basis of estimating the impact of immigration on U.S. population growth. In each set of scenarios, births to immigrants who arrived during the five-year period are added and then births to all immigrants, regardless of when they arrived, are added in.
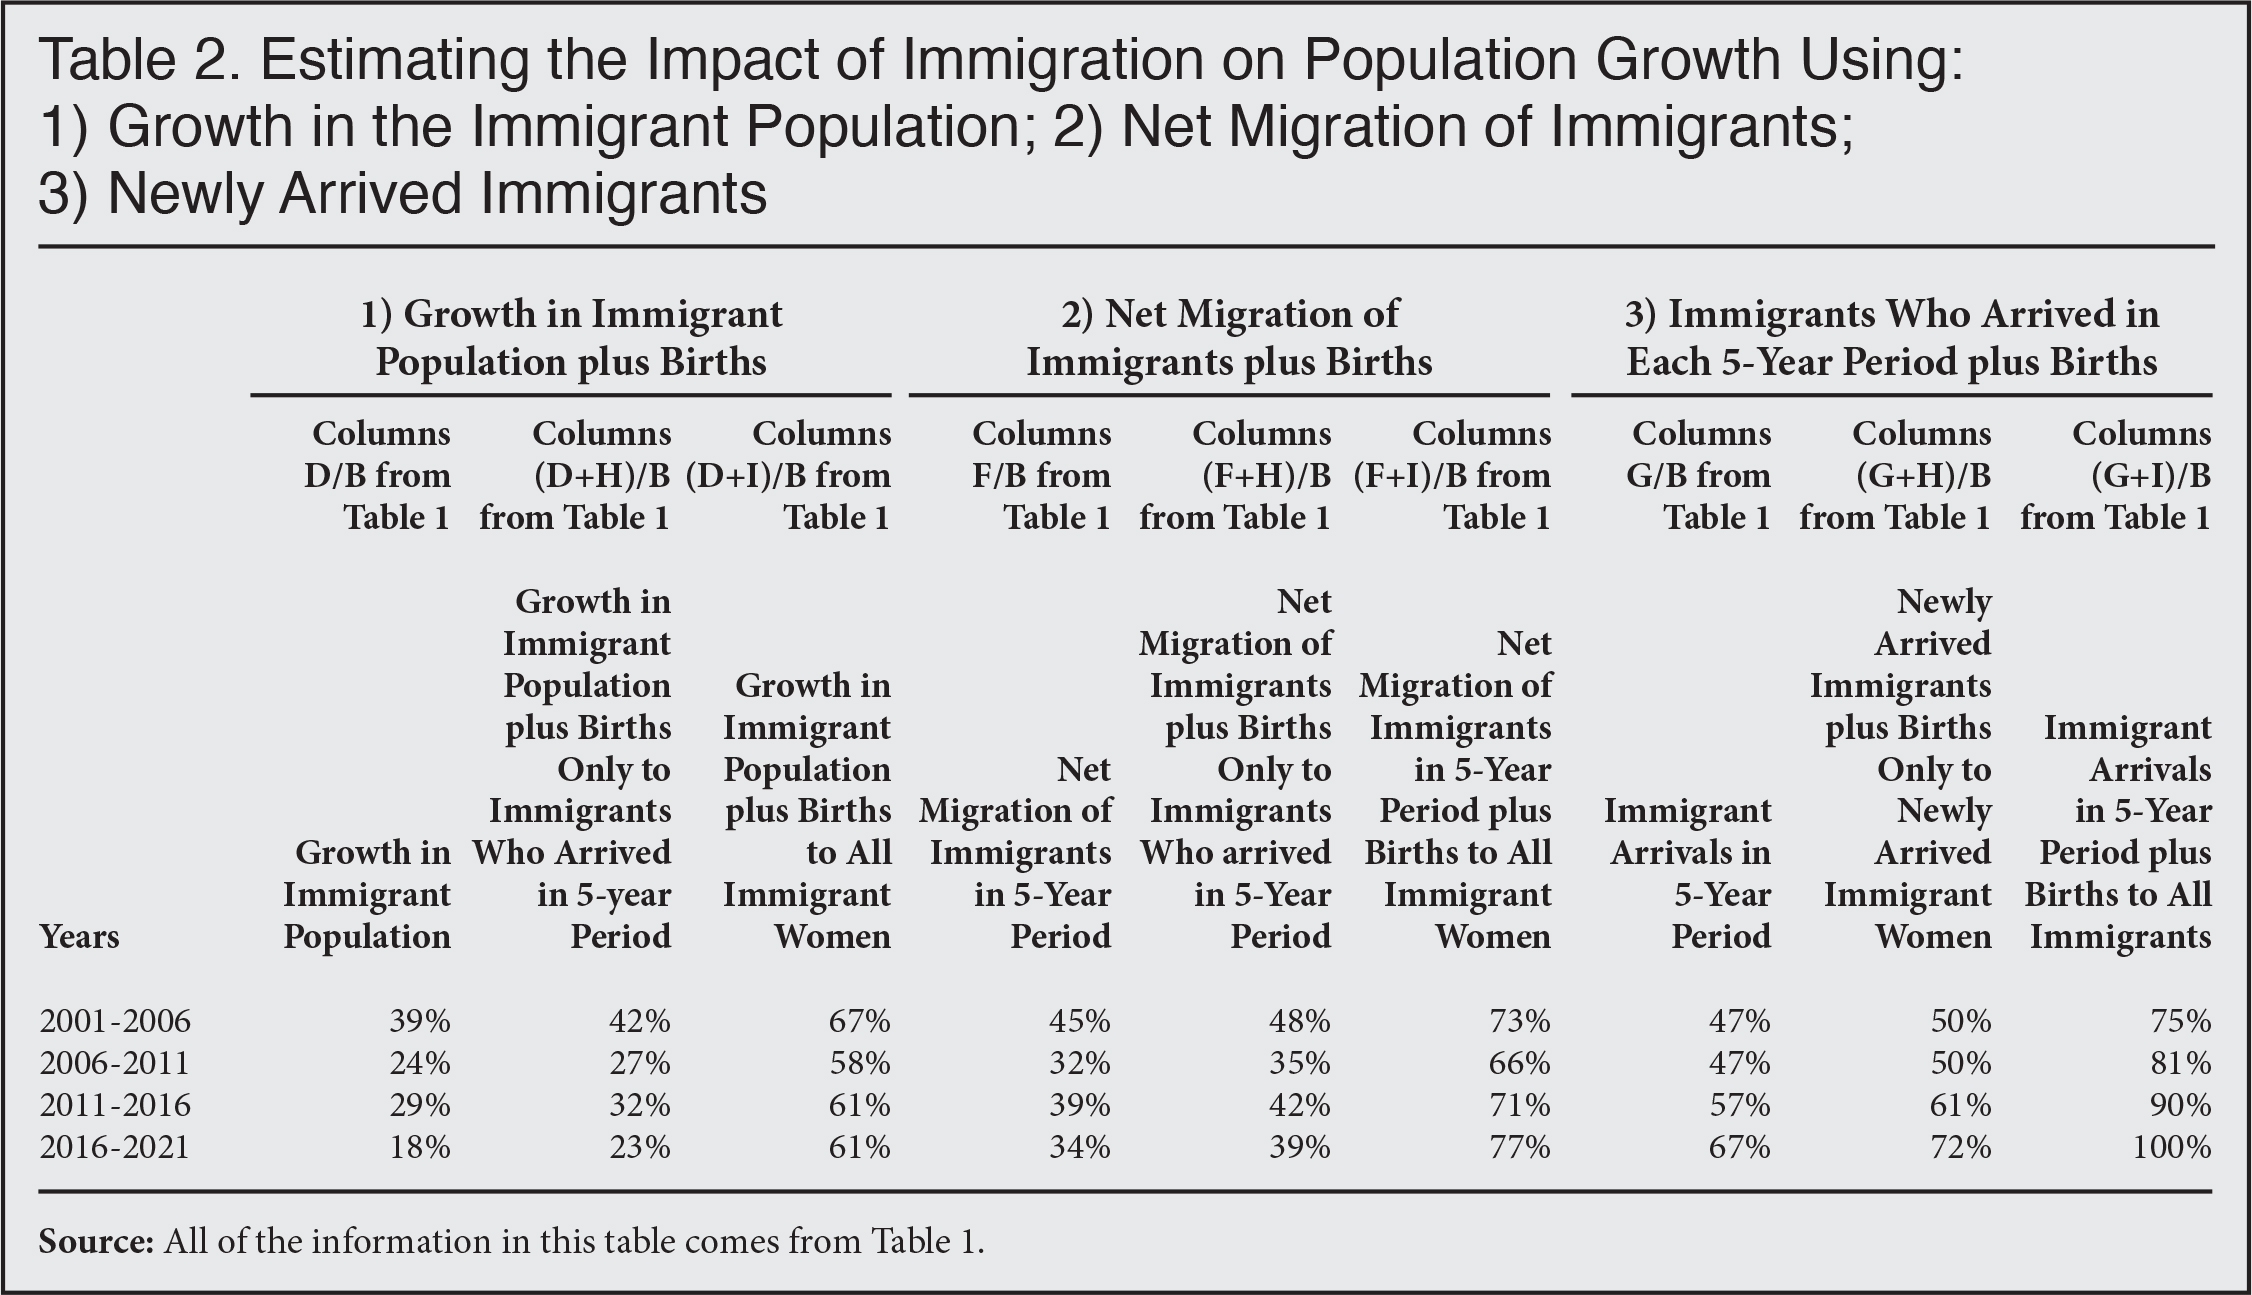 |
Immigration and Population Growth. Column B in Table 1 shows that between July 2016 and June 2021 the U.S. population grew by 8.77 million people. Growth in the immigrant population was 1.61 million (Column D in Table 1). As the first column of Table 2 shows, this was equal to 18 percent of the overall increase in the U.S population — Column D divided by Column B. If we add in births only to those immigrant women who arrived in the United States in the prior five years, then it can be said that growth in the foreign-born plus births to immigrant women who arrived in this time period was equal to 23 percent of population growth from 2016 to 2021. Adding all births to immigrant women to growth in the foreign-born population means that between 2016 and 2021 immigration was equal to 61 percent of population growth. Clearly, adding in all births to immigrants significantly increases the share of population growth attributable to immigration; however, it should be pointed out that the vast majority of these births were to immigrants who arrived prior to each five-year time period examined, typically in the 20 years prior.
Net Immigration and Population Growth. As already stated, net immigration is the difference between the number of immigrants arriving in a particular time period relative to the number who left. This can be calculated in a number of different ways, but the simplest and most straightforward is to add deaths to the growth in the foreign-born population for each five-year time period — shown in Column F in Table 1. Over the last two decades, net migration of the foreign-born has varied quite a bit, from a high of 6.5 million from 2001 to 2006 to a low of three million in the most recent period. As we have observed in prior analyses, the number of new immigrants arriving fell after the Great Recession and then there was a significant increase in newcomers that peaked in 2016, followed by a decline during the first three years of the Trump administration (2017 to 2019) before Covid hit. Out-migration also increased over this time period.7
The impact of net migration of immigrants on population growth has varied over the last two decades, from a low of 32 percent (2006-2011) to a high of 45 percent (2001-2006). In the most recent period, 2016 to 2021, net migration was equal to 34 percent of population growth. If births to immigrants who arrived in each five-year time period are added to net migration, the share of U.S. population growth attributable to immigration is higher, varying from 35 percent to 48 percent. From 2016 to 2021, net immigration of the foreign-born plus births to immigrants who arrived in this period was equal to 39 percent of population growth. Adding in all births to immigrants, regardless of when they arrived, significantly increases the impact of immigration on population growth to 77 percent in the most recent five-year time period, whereas it hit a low of 66 percent from 2006 to 2011.
New Arrivals and Population Growth. The last three columns in Table 2 use new arrivals to estimate the impact of immigration on the U.S. population’s size. It shows that immigrants who arrived in each five-year period alone accounted for nearly half of population growth from 2001 to 2011 and more than half from 2011 to 2021. When we add in births to those who came in each five-year period, it equals half or more population growth. Finally, if we add in all births to all immigrants, regardless of when they arrived, it shows that new arrivals plus births account for the lion’s share of population growth in every five-year period since 2011. In fact, in the 2016 to 2021 period all population growth can be said to have come from immigration if the impact of immigration is measured in this way.
What Approach Is Best? In our view, net migration of immigrants makes the most sense as a starting point for thinking about the impact of immigration on U.S. population growth. Immigrants arrive each year, which certainly adds directly to the population, but some number also leave. Both facts have to be considered when measuring population growth. Simply looking at new arrivals would not take into account those immigrants who leave the country each year, whether voluntarily or because they were removed by ICE. Growth in the foreign-born population is, like net migration, a net figure. But simply looking at growth would include deaths among immigrants, which is not related directly to migration. Moreover, the growth in the overall U.S. population includes the impact of mortality among immigrants already in the country, so it does not really make sense to double-count deaths by using the increase in the size of the immigrant population rather than net migration.
The issue of how to count births is more ambiguous. Of course, all population estimates and population projections include births, as it is a fundamental aspect of human demography. When estimating the impact of births on immigrants it could be argued that only births to those who arrived during the time period studied should be considered. But including births to all immigrants over a specific time period, regardless of when the mother arrived, would seem to be a more comprehensive approach. After all, immigrants have children for many years after they arrive and in this way add directly to the size of the population.8 Looking only at the relatively limited number of births to recent arrivals would, in our view, significantly understate the impact of immigration on population growth. For these reasons, we think net migration plus births to all immigrants is the best way to think about immigration’s impact on U.S. population growth. As Table 2 shows, looked at this way, immigration in the last 20 years accounted for between two-thirds and a little over three-fourths of population growth.
Population Growth and the Census Bureau Estimates
Tables 1 and 2 show the impact of immigration on the size of the U.S. population using Census Bureau Surveys. But it is also possible to look at the annual population estimates to gain some insight into the impact of immigration on population growth. Each year the bureau estimates the size and characteristics of the nation’s population by such variables as race, sex, and age. Like the ACS, the bureau’s population estimates measure the growth from mid-year (July 1) to mid-year.9 The estimates are adjusted annually as new administrative and survey data becomes available. The “vintage” year of a population estimate refers to the final year of the time series. Because the estimates are continually re-adjusted as new administrative and other data become available, there is more than one estimate for most years at the Census Bureau website, which can be confusing.
Components of Change. Table 3 shows the total population each year since 2001 based on the Census Bureau’s population estimates and the accompanying “components of change” that are used to estimate the nation’s population — births, deaths, and net international migration.10 Estimates of births and deaths in the United States are based on administrative records. If we take births and subtract deaths, we get what is known as “natural increase”. That is, the increase in the population from the existing population of U.S. residents each year. The third component of population change is net international migration. This is the difference in the number of native- and foreign-born people arriving and leaving the country annually. Births minus deaths plus net migration should equal growth in the overall population. Although the Census Bureau’s estimate of NIM as reported in Table 3 includes the U.S.-born, the level of net migration is very similar to that of the foreign-born alone as shown in Table 1, with the exception of the 2001 to 2006 period.11 In general, the in-migration of the U.S.-born very roughly equals their out-migration in most years. As a consequence, it is the foreign-born that primarily impact the net migration numbers.
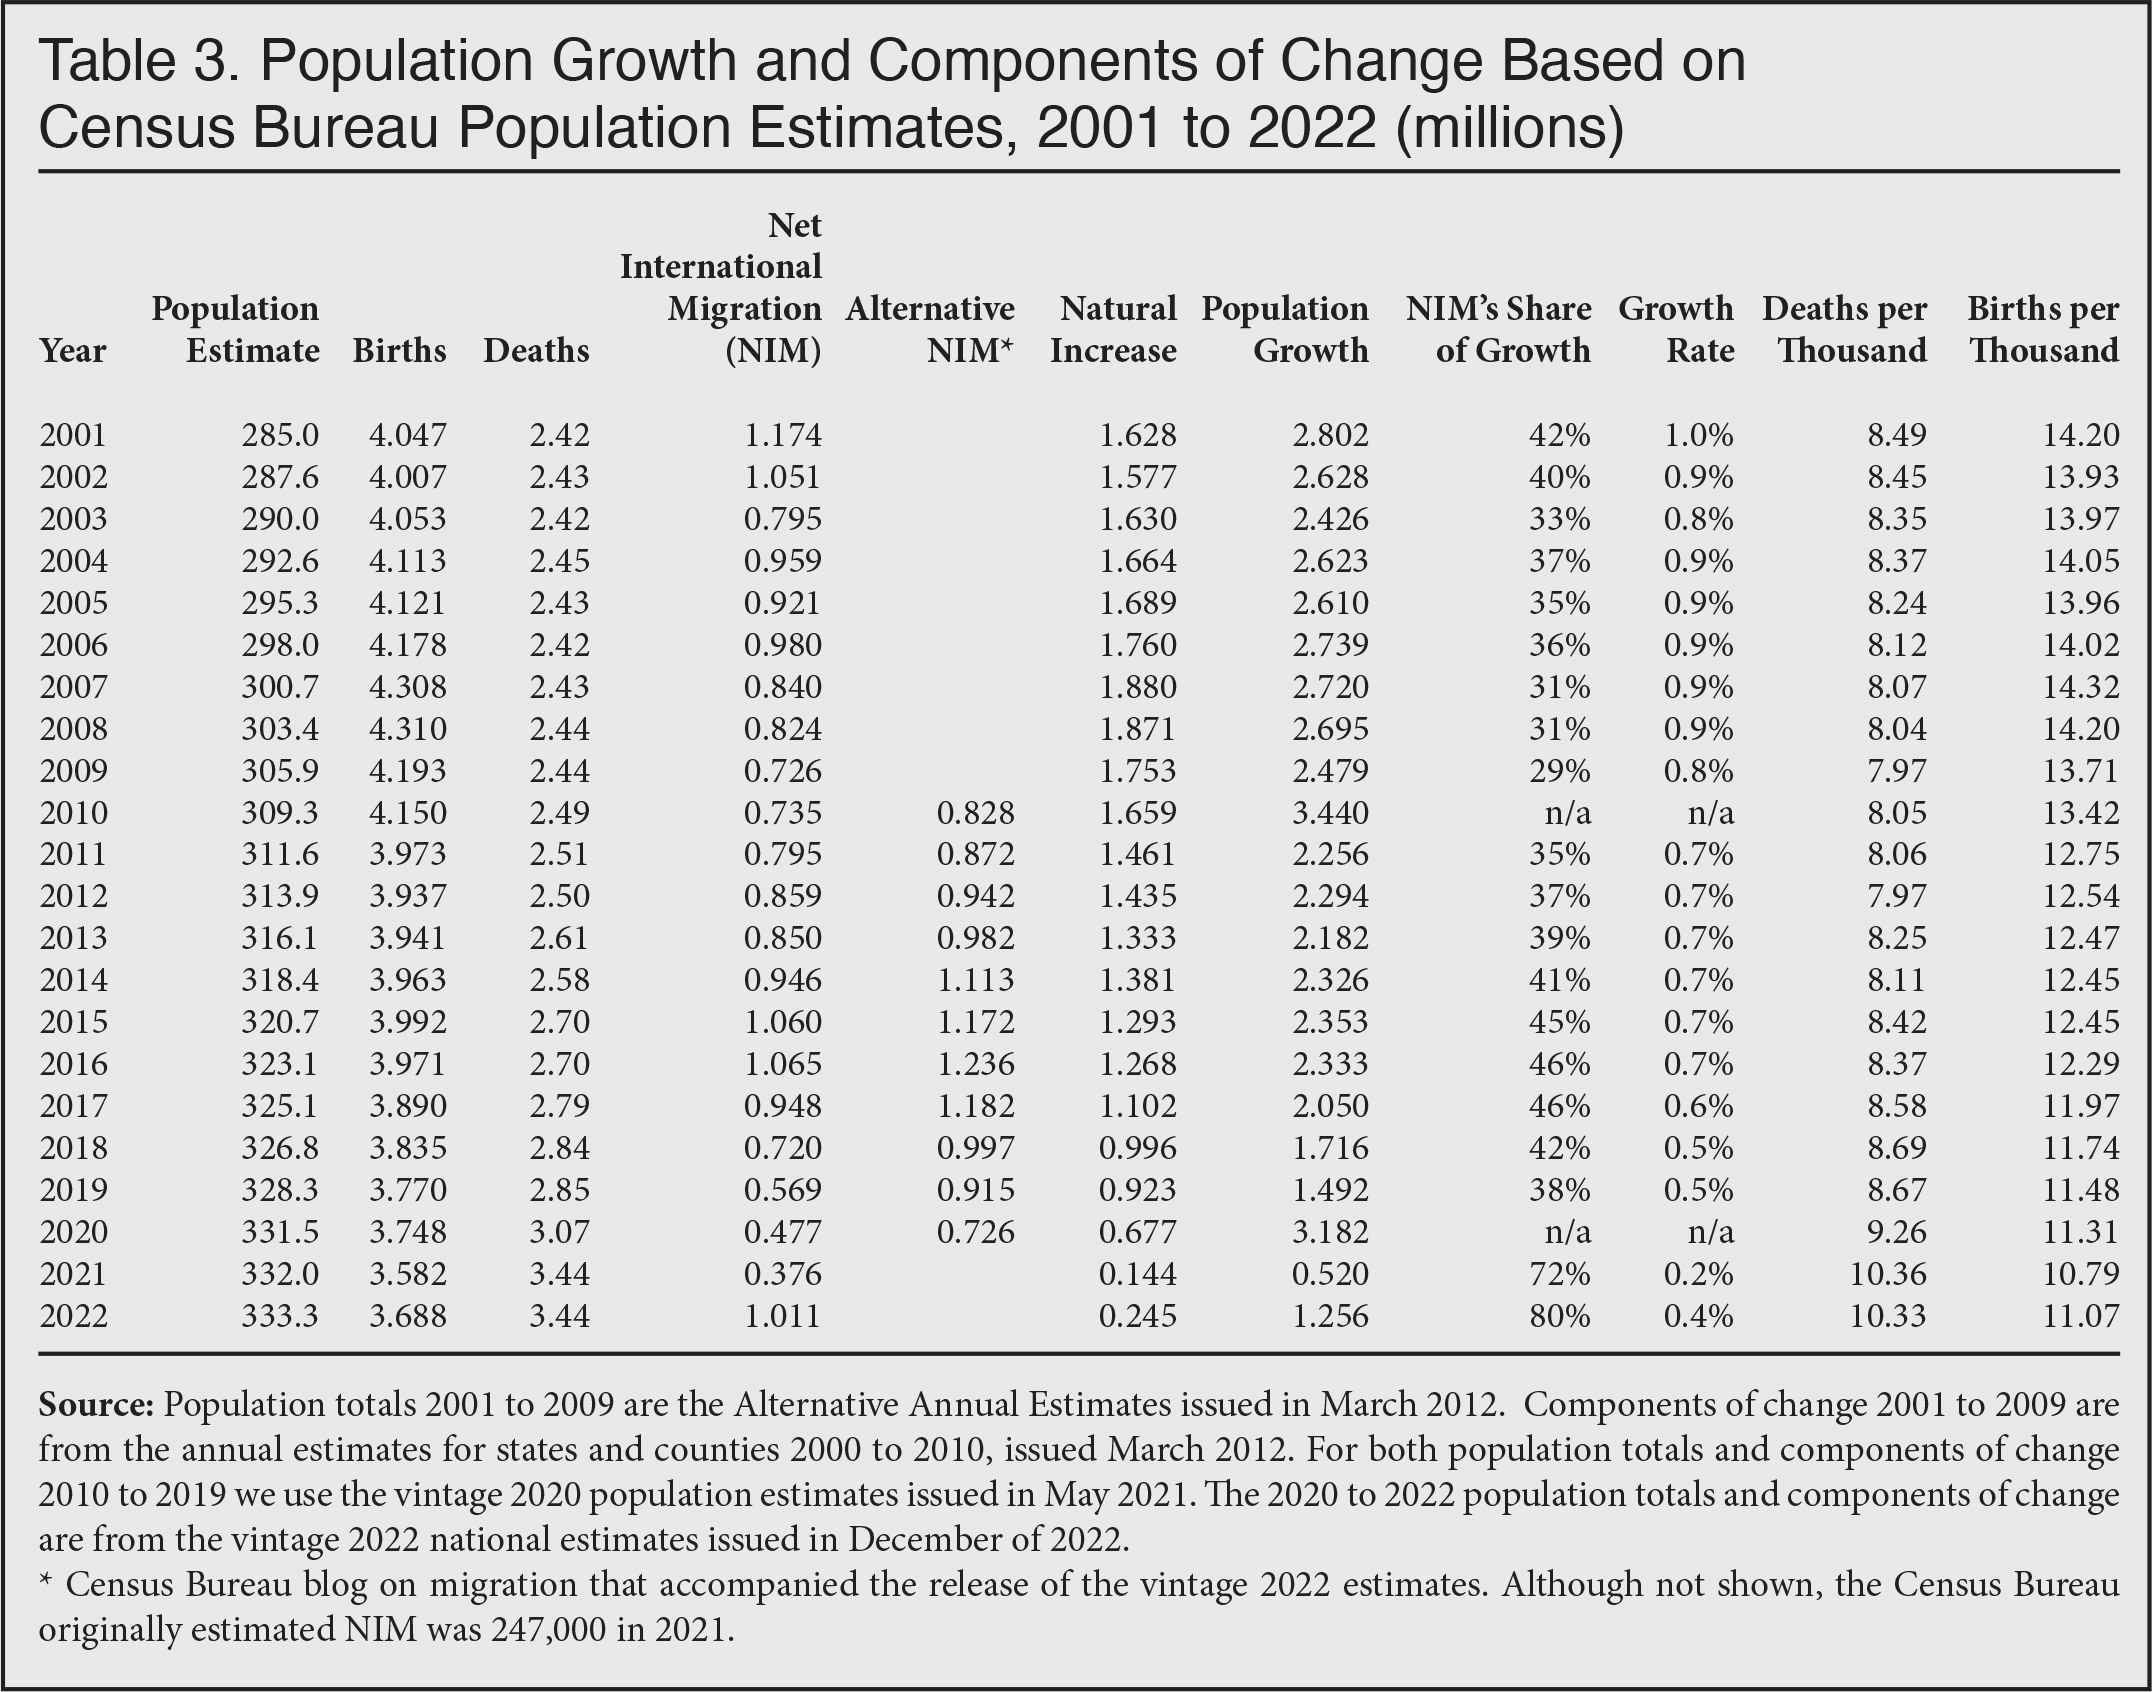 |
Breaks in the Continuity of Estimates. As discussed at length in a prior CIS publication, at the time of each census there is always a significant break in the continuity of the estimates.12 We can see this most clearly by looking at the population in the year of the census relative to the year before the census. In census years, the components do not add up to population growth relative to the year before the census. The initial population estimate in the year of the census does match the components of change, but this is not the case once the results of the decennial census are known. The revised population totals that reflect the results of the census are what we report in Table 3.13 This means population growth as reported in Table 3 can be examined 2001 to 2009, 2010 to 2019 or 2020 to 2022 relative to the components of change. But this is not the case for 2009 to 2010 or 2019 to 2020. This is why the numbers reported in Table 3 appear to show a huge increase in the population from 2009 to 2010 and 2019 to 2020.
Fall in Natural Increase. Probably the most important trend in Table 3 is that natural increase has declined significantly. This has been caused both by an increase in deaths and a decline in births. Natural increase was relatively stable from 2001 to 2012, but then it began to fall. Still, as recently as 2014 it was 1.4 million, though by 2019 — before Covid — it was down to 920,000. Turning first to deaths, there was a significant upturn after 2012 due in part to a significant and tragic increase in mortality associated with what are sometimes called “deaths of despair” (e.g. overdoses and suicide).14 There has also been an increase in deaths associated with obesity. Population aging is another factor that has caused the number of deaths to rise; the oldest Baby boomers began to turn 65 in 2011. Covid and the social disruptions associated with it caused the number of deaths to rise dramatically so that in 2021 and 2022 there were about 600,000 more deaths each year compared to 2019. It is unclear why deaths were as high in 2022 as in 2021, despite widespread vaccinations. Nonetheless, it seems very likely that deaths will be lower in 2023, though they will not likely return to the 2019 level.
Births have been on a long-term decline since the Great Recession, so that in 2019 there were 540,000 fewer births than the peak in 2008. The reasons for the decline in the number of births are complex and go beyond the scope of this analysis. However, the fertility decline has affected both the U.S.-born and immigrants alike. It seems likely that the U.S. has entered a period of lower fertility, at least for the foreseeable future.15 That said, in 2023 births may rise as uncertainty associated with Covid recedes. The number of births did tick up by a little more than 100,000 in 2022 compared to 2021 (see Table 3), and this could continue in 2023. While the decline in natural increase is profound, the U.S. population still grew by a quarter of a million in 2022 absent NIM. Natural increase should be higher in 2023, perhaps rising to 500,000, though it seems certain it will not return to pre-pandemic levels.
The Impact of Net International Migration. The estimates show that NIM of the U.S.- and foreign-born — excluding births to immigrants once here — accounted for 38 to 46 percent of population growth in the half decade (2015 to 2019) before the pandemic. It is also important to note that the Census Bureau has issued alternative estimates of NIM for every year from 2010 to 2020, though they have not issued alternative estimates for births, deaths, or the total population over this time to the best of our knowledge.16 Using those alternative estimates would mean that net migration accounted for 50 to 61 percent of population growth from 2015 to 2019, though this assumes no adjustment for the other components of change or to the population totals.
Table 3 shows that net international migration of 1.01 million accounted for roughly 80 percent of U.S. population growth in 2022. Even if deaths decline significantly as expected and births do rise some in the next year, with net migration running at over one million a year, NIM, primarily driven by the movement of foreign-born people in and out of the country, will continue to account for the majority of population growth. This is the case even without counting births to immigrants as we do in Tables 1 and 2. For reasons explained below, there is good reason to think that the Census Bureau continues to underestimate NIM.
Undercounting Net Migration? Migration is by far the most difficult component of population change to estimate; births and deaths can be discerned reasonably well from administrative data, though there is always some lag in the release of this information. We argued in our previous paper on the 2021 population estimates that the Census Bureau was underestimating immigration for 2010 to 2021.17 It is part of the reason why the vintage 2020 population estimates, released before the Census results were known, showed a total U.S. population of 329.48 million for that year, but now the bureau estimates that the population was 331.51 million in 2020 — a 2.03 million difference.18 The methodology statement for the vintage 2022 estimates, a blog post specifically on migration, and the new estimates’ release notes all discuss changes made in how NIM is calculated, particularly during and after the pandemic. The blog post accompanying the release of the vintage 2022 estimates is especially interesting because it contains alternative estimates of NIM for 2010 to 2020 that reflect the new methodology the bureau has adopted to estimate migration 2020 to 2022 in the new vintage 2022 estimates.19 Comparing these alternative estimates of NIM to the original estimates shows a cumulative difference of 1.94 million from 2010 to 2020. This is a clear indication how much difficulty the bureau is having in estimating NIM.
The vintage 2022 estimates revise upward the vintage 2021 estimate for 2020 by a quarter of a million (52 percent), from 477,000 to 726,000. The new estimates also revised upward NIM for 2021 from 247,000 to 376,000 for 2021, also a 52 percent increase.20 In fact, the Census Bureau refers to its NIM estimate of 1.01 million for 2022 as a “projection” to convey that it has a lower level of confidence in its number and it is subject to change as newer data become available. The bureau makes clear this is due to disruptions in data collection during Covid. For example, part of the way the Census Bureau creates its estimate of NIM is by comparing the ACS each year, particularly to estimate emigration. Because the 2020 ACS produced unreliable estimates and the 2022 ACS will not be available until the end of 2023, the bureau has had to rely on other means to estimate NIM in 2021 and 2022. Of course, the problems Covid created do not explain the bureau consistently underestimating NIM from 2010 to 2019, at least relative to the alternative NIM.
Underestimating NIM in 2022. Despite the bureau's providing revised upward estimates of NIM 2010 through 2021 and developing a new methodology for estimating NIM, we still think the Census Bureau’s estimate (projection) for mid-2021 to mid-2022 of 1.01 million is too low. There are several reasons we think this is the case, particularly the scale of the ongoing border crisis.21 Moreover, a combined three-month sample of the Current Population Survey (June, July, and August), which produces reasonably statistically robust mid-year estimates, shows 44.92 million foreign-born residents in mid-2021 and 47.14 million mid-2022 — an increase of 2.22 million. Adding in deaths (275,000) means net migration of the foreign born was 2.49 million during this time — almost 2.5 times the bureau’s estimate for NIM. Migration of the U.S.-born cannot account for this difference, nor can the margin of error in the CPS. In our view, the bureau’s methodology for estimating net migration, which relies heavily on administrative data, is not able to fully capture a sudden and dramatic increase in illegal immigration of the kind the country began experiencing starting in 2021.22 If we are correct, then net migration and population growth was one million to 1.5 million higher than the bureau estimated for 2022. This would also mean that NIM accounted for roughly 90 percent of population increase in the last year.
Conclusion
Using the ACS, this analysis makes clear that immigration is the primary factor driving U.S. population growth. The net migration of immigrants plus births to immigrants once here accounted for roughly two-thirds to three-fourths of U.S. population growth over the last two decades. Unfortunately, the most recent ACS available is for 2021, which reflects the population in the middle of that year, so our estimates using the ACS do not reflect the enormous impact on population growth due to the ongoing border crisis. We find using the survey that in the last decade the impact of immigration has tended to rise some, even as the number of new immigrants fell from 2017 to 2020 and overall population growth slowed considerably. For the most recent five-year period using the ACS for 2016 to 2021, the net migration of immigrants plus births to immigrants was equal to 77 percent of population growth 2016 to 2021. The primary reason for migration’s increasing role is a significant falloff in natural increase — births minus deaths among U.S. residents. The Great Recession seems to have permanently reduced fertility for both the U.S.-born and immigrants. At the same time, a rise in deaths caused primarily by an increase in suicides, overdoses, and population aging contributed to a significant increase in the death rate. All of this was happening before Covid caused a huge increase in deaths and a further steep decline in natural increase starting in 2020.
The population estimates from the Census Bureau, which do not break out births to immigrants separately, run through the middle of 2022. They show net international migration by itself, excluding natural increase, was roughly one-third to nearly one-half of population growth in the decade before Covid. In 2021 and 2022, net migration has increased to roughly three-fourths of population growth.
However, we think the level of net migration estimated by the Census Bureau is too low. The enormous scale of the border crisis and resulting illegal immigration as well as growth in the foreign-born population in the monthly Current Population Survey indicate that net migration is significantly higher than the 1.01 million estimated by the Census Bureau for 2022. If we are correct, then the U.S. population grew by significantly more than the bureau estimated and net international migration accounted for upwards of 90 percent of the increase in the last year.
In the near term, the dramatic and unprecedented increase in deaths associated with the pandemic should abate. Births may also recover some as the uncertainty associated with the pandemic recedes. Natural increase should rebound from a low of 144,000 in 2021 and 245,000 in 2022 to perhaps 500,000 or more in 2023. Still, natural increase will almost certainly not return to pre-pandemic levels. The United States seems to have entered a period of slower population growth relative to what it was even a decade ago. How one interprets the slowdown in population growth depends on one's policy priorities. For those concerned with environmental issues such as pollution, greenhouse gas emissions, and sprawl, as well as quality of life issues such as congestion and traffic, the fall-off in population growth will be seen as a welcome development. For those who see faster population growth as necessary to economic growth and as a way of increasing opportunities for businesses and consumers, smaller increases in the U.S. population will be seen as a problem. Of course, the level of future immigration is a wild card. Immigration has exploded since the start of 2021. In the coming years, absent a change in policy, immigration will continue to drive population growth. In fact, immigration has the potential to add enormously to the size of the U.S. population.
End Notes
1 The public-use ACS data does not exactly match the total ACS sample, which is reported at data.census.gov. However, the data tool at the Census Bureau website does not allow for the kind of detailed calculations done in this paper so it is necessary to use the public-use data rather than generate numbers from ACS data at data.census.gov.
2 The Census Bureau continually revises its population estimates as more information becomes available. To estimate population growth in each five-year period that is consistent with the ACS, we used the total resident U.S. population as shown in the ACS for 2006, 2011, 2016, and 2021. However, in 2001 the ACS was not fully implemented and did not include group quarters so we used the alternative population estimate, which is shown in Table 3 of this report, for the nation’s total population in that year.
3 All immigrant numbers are from the public-use files of the ACS. However, in order to get a more accurate count of the foreign-born in 2001, we add in those in group quarters based on the 2006 ACS. The 2006 ACS was the first year that the survey captured those in group quarters.
4 To create an immigrant population to which we can apply death rates for 2001 to 2005, we add the foreign-born in the ACS for each of those years to those in group quarters based on the 2006 ACS, which was the first year that the survey captured that population.
5 The arrival data in the ACS is reported by respondents by calendar year and this does not match the mid-year reference date of the ACS or the population estimates. As a result, we take only half of those who indicated they arrived in the first year of each five-year cohort to produce arrival data that reflect those who arrived mid-year to mid-year. Also, the actual number of immigrant arrivals would be somewhat higher in each five-year period because it does not include immigrants who arrived and left during the five years. But those who are here for such a short duration do not add to population growth.
6 By counting only immigrant mothers we avoid double counting the impact of births. That is, we count those U.S.-born children with only immigrant mothers, and those with an immigrant mother and father, but it excludes those with only immigrant fathers and native-born mothers.
7 In two prior analyses, the Center for Immigration Studies has estimated that there was a falloff in new arrivals after 2016 and a significant increase in out-migration starting in 2016. Columns G and F in Table 1 again show this is the case. It seems very likely that this slowdown in immigration was at least partly attributable to Trump administration policies and his rhetoric. See Steven A. Camarota and Karen Zeigler, “Immigrant Population Growth Slows: ‘Trump Effect’ likely explains slowdown”, Center for Immigration Studies, October 22, 2020; and Steven A. Camarota and Karen Zeigler, “New Census Bureau Data Indicates There Was a Large Increase in Out-Migration in the First Part of the Trump Administration”, Center for Immigration Studies, October 22, 2020.
8 It is worth noting that the births figure we are using is essentially a net figure in the sense that it counts only those U.S.-born children born during the five years who are living in the country at the end of the time period. Using this approach means that if a child was born during the five-year time period but left the United States or died, then they would not be counted.
9 The weight used in the ACS comes directly from the population estimates.
10 As indicated at the outset of our discussion on the population estimates, there are multiple estimates for each year. In order to use population totals that match the components of change for 2001 and 2009, we use the Alternative Annual Estimates issued in March 2012 for population totals and match them with the components of change 2001 to 2009 from the Annual Estimates done for states and counties 2000 to 2010. For both population totals and components of change 2010 to 2019 we use the vintage 2020 population estimates issued in May 2021. For 2020 to 2022 population totals and components of change we use the newest population estimates available, the vintage 2022 national estimates issued in December 2022. It is important to note that the annual revisions to the estimates and components of change in the years between the censuses are typically not very large and using a different one would not make a meaningful difference to the numbers reported in Table 3.
11 For example, Table 1 reports net migration of immigrants from 2006 to 2011 of about 3.9 million. If we add up NIM in Table 3 for 2007 to 2011 it also comes to about 3.9 million. The reason the comparison has to be 2007 to 2011 in Table 3 is that migration, like all the other components of change in Table 3, reflects what happens in the 12 months prior to each year shown. So, to make a comparison with Table 1 of 2006 to 2011 we use 2007 to 2011 because the figures for 2006 reflect migration mid-2005 to mid-2006. We are not certain why the NIM figures in Table 3 for the period 2002 to 2006 (4.7 million) do not more closely match those in Table 1 for 2001 to 2006 (6.5 million). One possible explanation is that the net migration of the U.S.-born was very unusual in this period as it involved the deployment of U.S. troops overseas for the Persian Gulf and Afghanistan Wars. Another possibility is that the estimate of the foreign-born for 2001 in the ACS is too low, even after we add in the institutionalized. This would produce more growth and more net migration in the foreign-born by 2006 than was actually the case.
12 Steven A. Camarota and Karen Zeigler, “Understanding the New 2021 Population Estimates”, Center for Immigration Studies, February 10 2022.
13 For example, the new vintage 2022 population estimates show a population of 331.51 million for 2020, as shown in Table 3. This is 2.03 million larger than the original vintage 2020 population estimate for 2020 (329.48 million), which was produced before the results of the 2020 census were known. So, using vintage 2020 estimates shows that population growth 2019 to 2020 was 1.15 million and births minus deaths plus net international migration would equal this amount over this time period. But the vintage 2022 estimate is much larger and so the components of change 2019 to 2020 do not match up with the revised 2020 population. Something similar happened in 2010, as the original estimates for both census years were too low. In effect, the Census Bureau underestimated population growth 2000 to 2010 and 2010 to 2020.
14 A great deal has been written about the increase in deaths from drugs, alcohol, and suicide. See, for example, “Long-Term Trends in Deaths of Despair”, SCP Report NO. 4-19, Senate Joint Economic Committee, September 5, 2019.
15 Steven A. Camarota and Karen Zeigler, “Fertility Among Immigrants and Native-Born Americans: Difference between the foreign-born and the native-born continues to narrow”, Center for Immigration Studies, February 16, 2021.
16 Anthony Knapp and Tiangeng Lu, “Net Migration Between the United States and Abroad in 2022 Reaches Highest Level Since 2017”, U.S. Census Bureau, December 2022.
17 Steven A. Camarota and Karen Zeigler, “Understanding the New 2021 Population Estimates”, Center for Immigration Studies, February 10, 2022.
18 “National Population Totals: 2010-2020”, U.S. Census Bureau, revised October 8, 2021; “National Population Totals: 2020-2022”, U.S. Census Bureau, December 29, 2022.
19 See the Census Bureau methodology statement, the blog post specifically on migration, and the new estimates’ release notes.
20 Net international migration from the vintage 2021 estimates can be found here: Jason Schachter, Pete Borsella, and Anthony Knapp, “New Population Estimates Show COVID-19 Pandemic Significantly Disrupted Migration Across Borders”, U.S. Census Bureau, December 21, 2021.
21 Among the reasons we think the newest numbers still undercount NIM is the enormous number of border encounters. From July 2021 to June 2022, there were 2.4 million encounters at the southern border; a large share of these individuals were released into the interior. Moreover, there were something like half a million “got-aways” mid-2021 to mid-2022 based on media accounts — individuals observed by the Border Patrol but not stopped. DHS Secretary Mayorkas told a congressional hearing on April 28, 2022, that there were 389,155 got-aways in fiscal year 2021 (October 2020 to September 2021). Fox News in October 2022 reported 599,000 known got-aways in fiscal year 2022. This border encounter figure has been widely cited, including by Texas Governor Abbott. Net international migration also includes legal immigration. New arrivals (rather than adjustments from within the U.S.) of permanent residents numbered roughly 400,000 during this time. In addition, several hundred thousand guestworkers, foreign students, and other long-term temporary visitors came to the country in the last year. Of course, all of these numbers are offset by outmigration.
22 One may reasonably ask if the NIM estimates are used to create the overall population estimates that are then used to weight surveys like the ACS or CPS. How can those same surveys independently provide any information about migration? The reason for this is that nativity is not one of the variables used to weight the data so a problem with the sample weights will not fundamentally change what the survey shows about the foreign-born unless the weights are off by huge numbers, which is not the case. It may be helpful to think of it this way: If the bureau estimate of NIM is one million too low, making the overall U.S. population smaller than it should be, it will only impact the size of the immigrant population, who are about 15 percent of the population, by something like 150,000 in the survey — 15 percent of one million. This is a relatively small share of the foreign-born who now number more than 48 million. It is somewhat more complicated than this because being foreign-born is correlated with other variables like race and being Hispanic that are used to weight the data. Still, the impact on the size of the immigrant population or its share of the U.S. population will not be that large even if the estimates are off by one million. Of course, over time if the numbers are consistently off year after year then the impact on the population estimates, including the foreign-born in Census Bureau surveys, will add up.