Download a PDF of this Backgrounder.
Jessica M. Vaughan is the director of policy studies, Steven A. Camarota is the director of research, and Karen Zeigler is a demographer at the Center.
This report uses new data from the Department of Justice’s National Crime Victimization Survey (NCVS), the most authoritative survey on crime reporting, to examine the claim that immigrants are less willing than others to report victimizations to authorities. This theory is one of the most frequently cited justifications for sanctuary policies. We find that the most recent data from the NCVS, which previously did not include information on citizenship and foreign birth of victims, does not support the assertion. The combined results of three years of data from this survey collected from 2017 to 2019 show that immigrant victimizations are just as likely, and in some cases more likely, to be reported to police than crimes against the native-born. This was true even though the data was collected in the first three years of the Trump administration, during which time the media and advocacy groups routinely asserted that immigration enforcement had been dramatically expanded. The data also provides insight on why some immigrants and non-citizens might not report crimes, showing that only a tiny number — about 1 percent — said that the reason for not reporting was because of fear of the authorities. There is no evidence in the NCVS data that crimes against immigrants are reported to police at lower rates than crimes against the native-born, indicating that the routine, even active, cooperation between local law enforcement and federal immigration authorities that takes place in most jurisdictions does not suppress crime reporting by immigrants.
Among the findings:
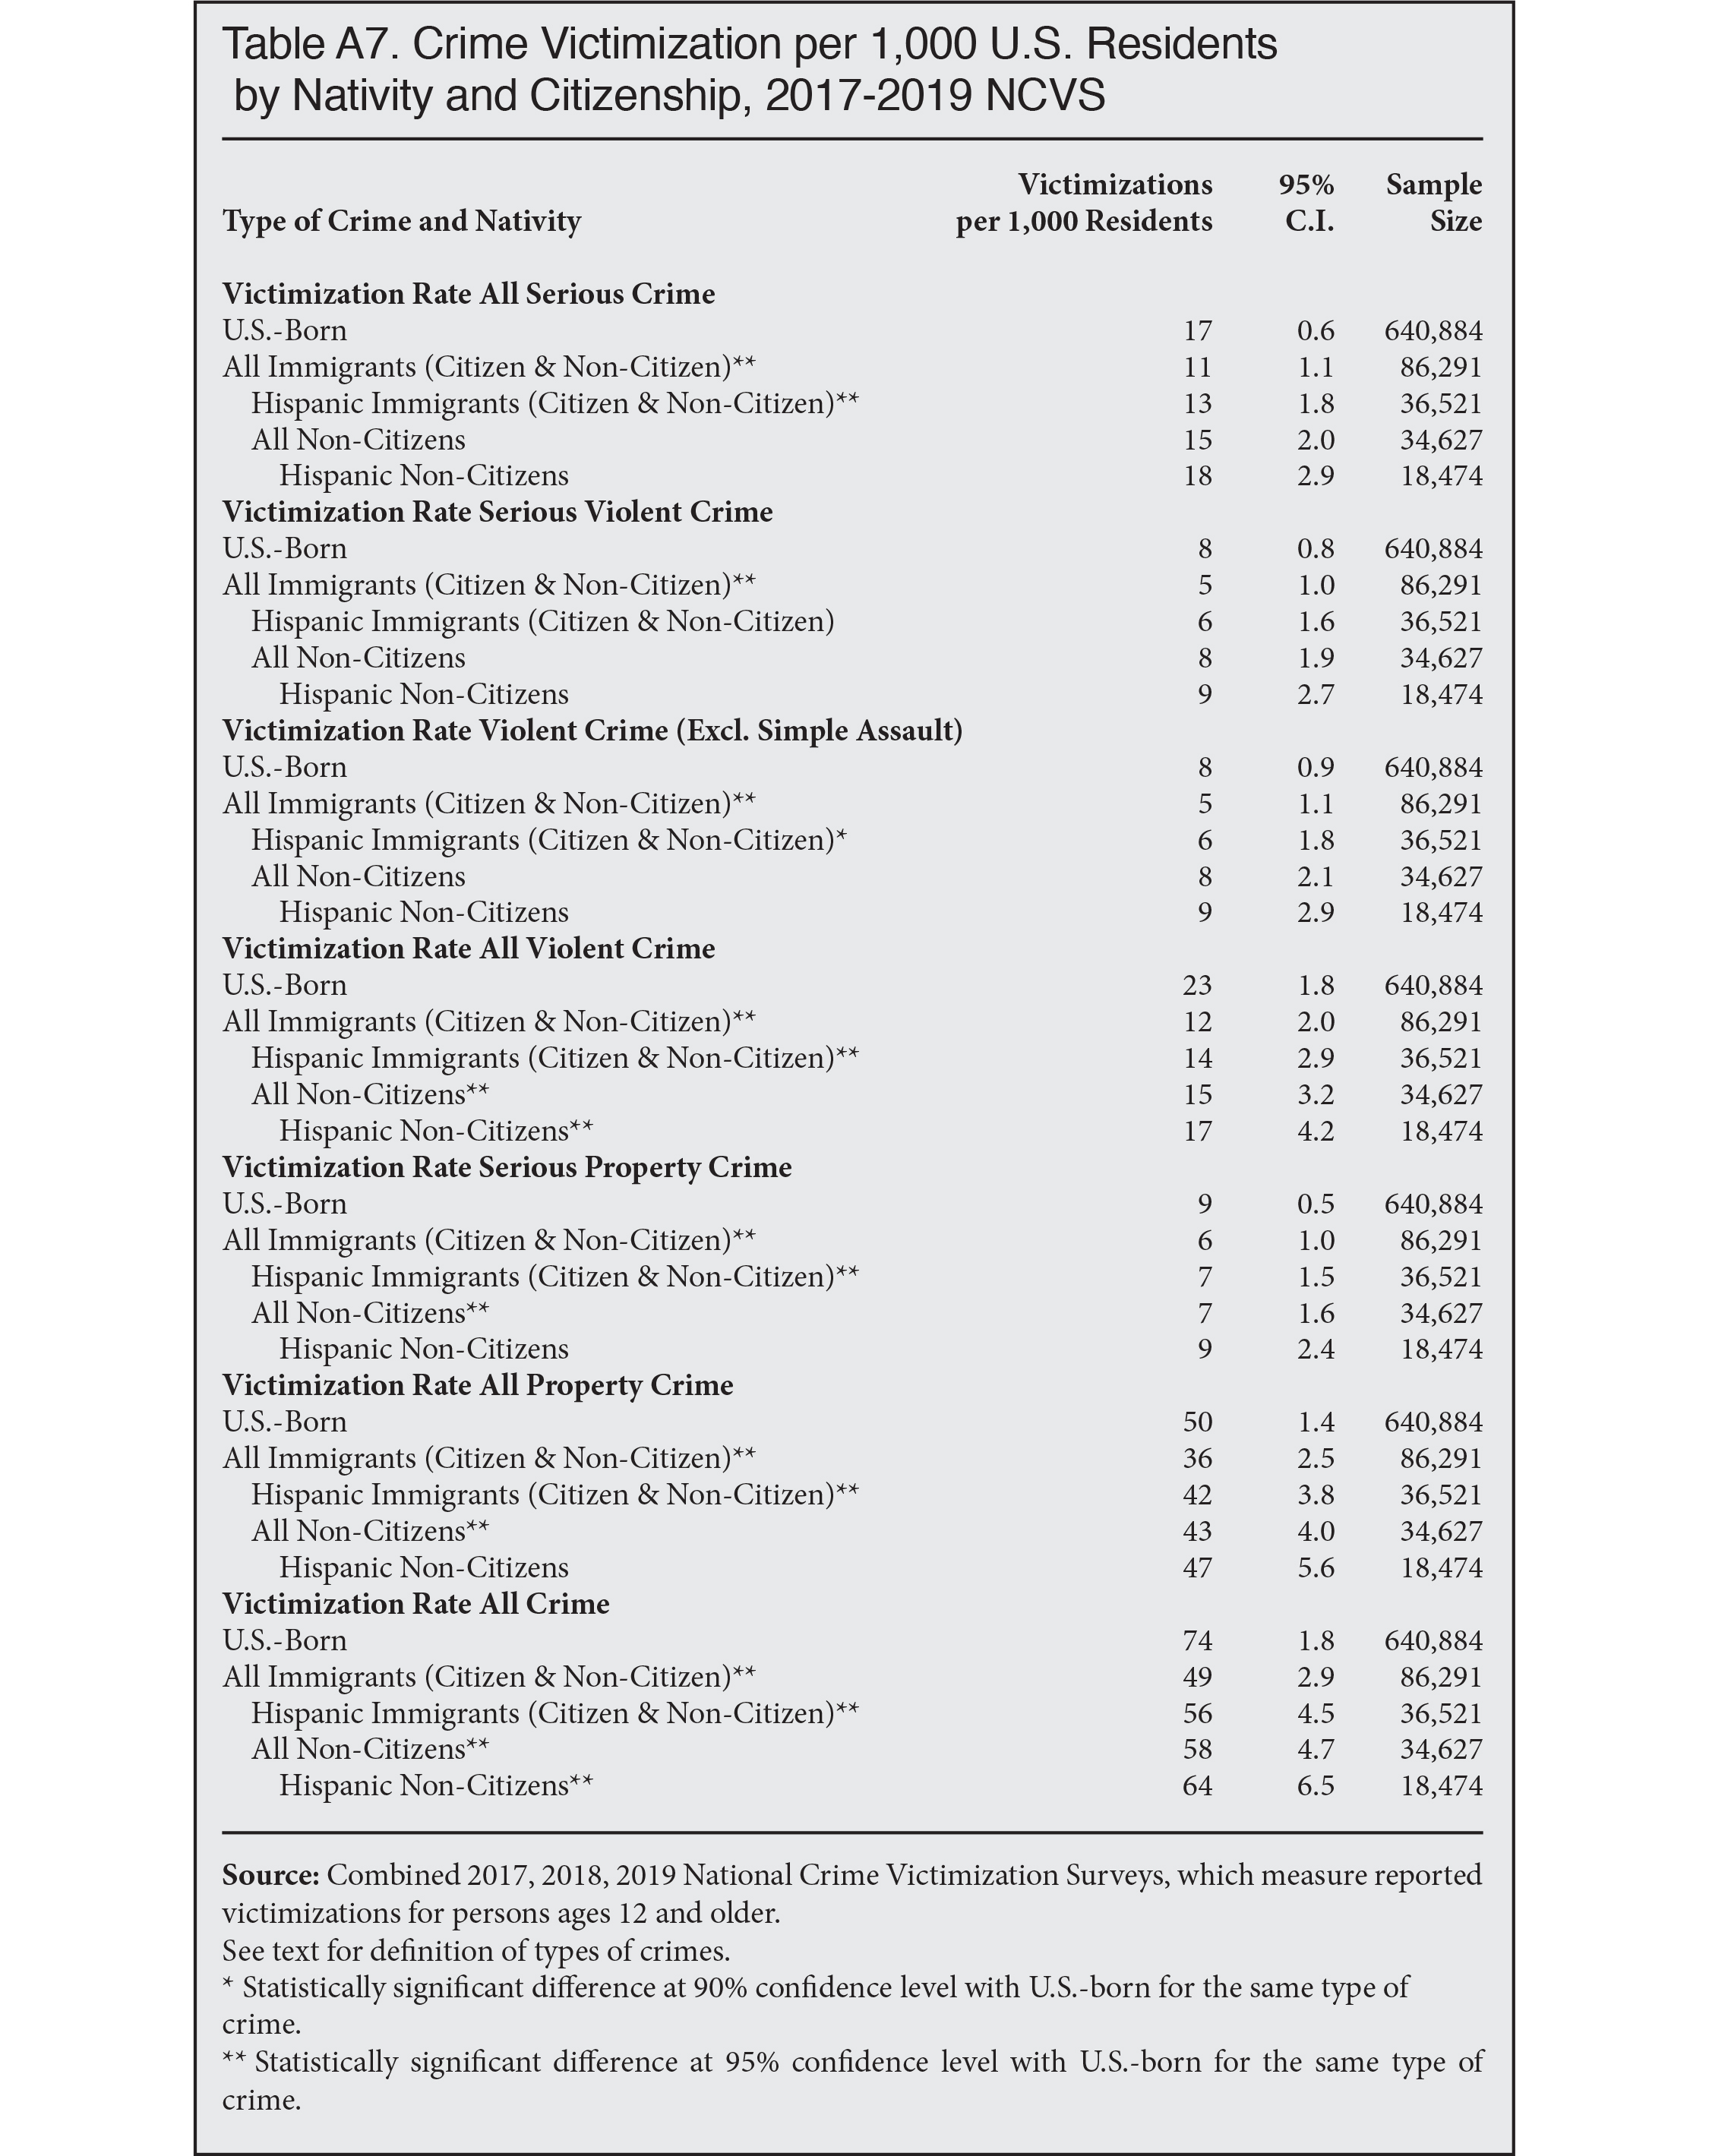
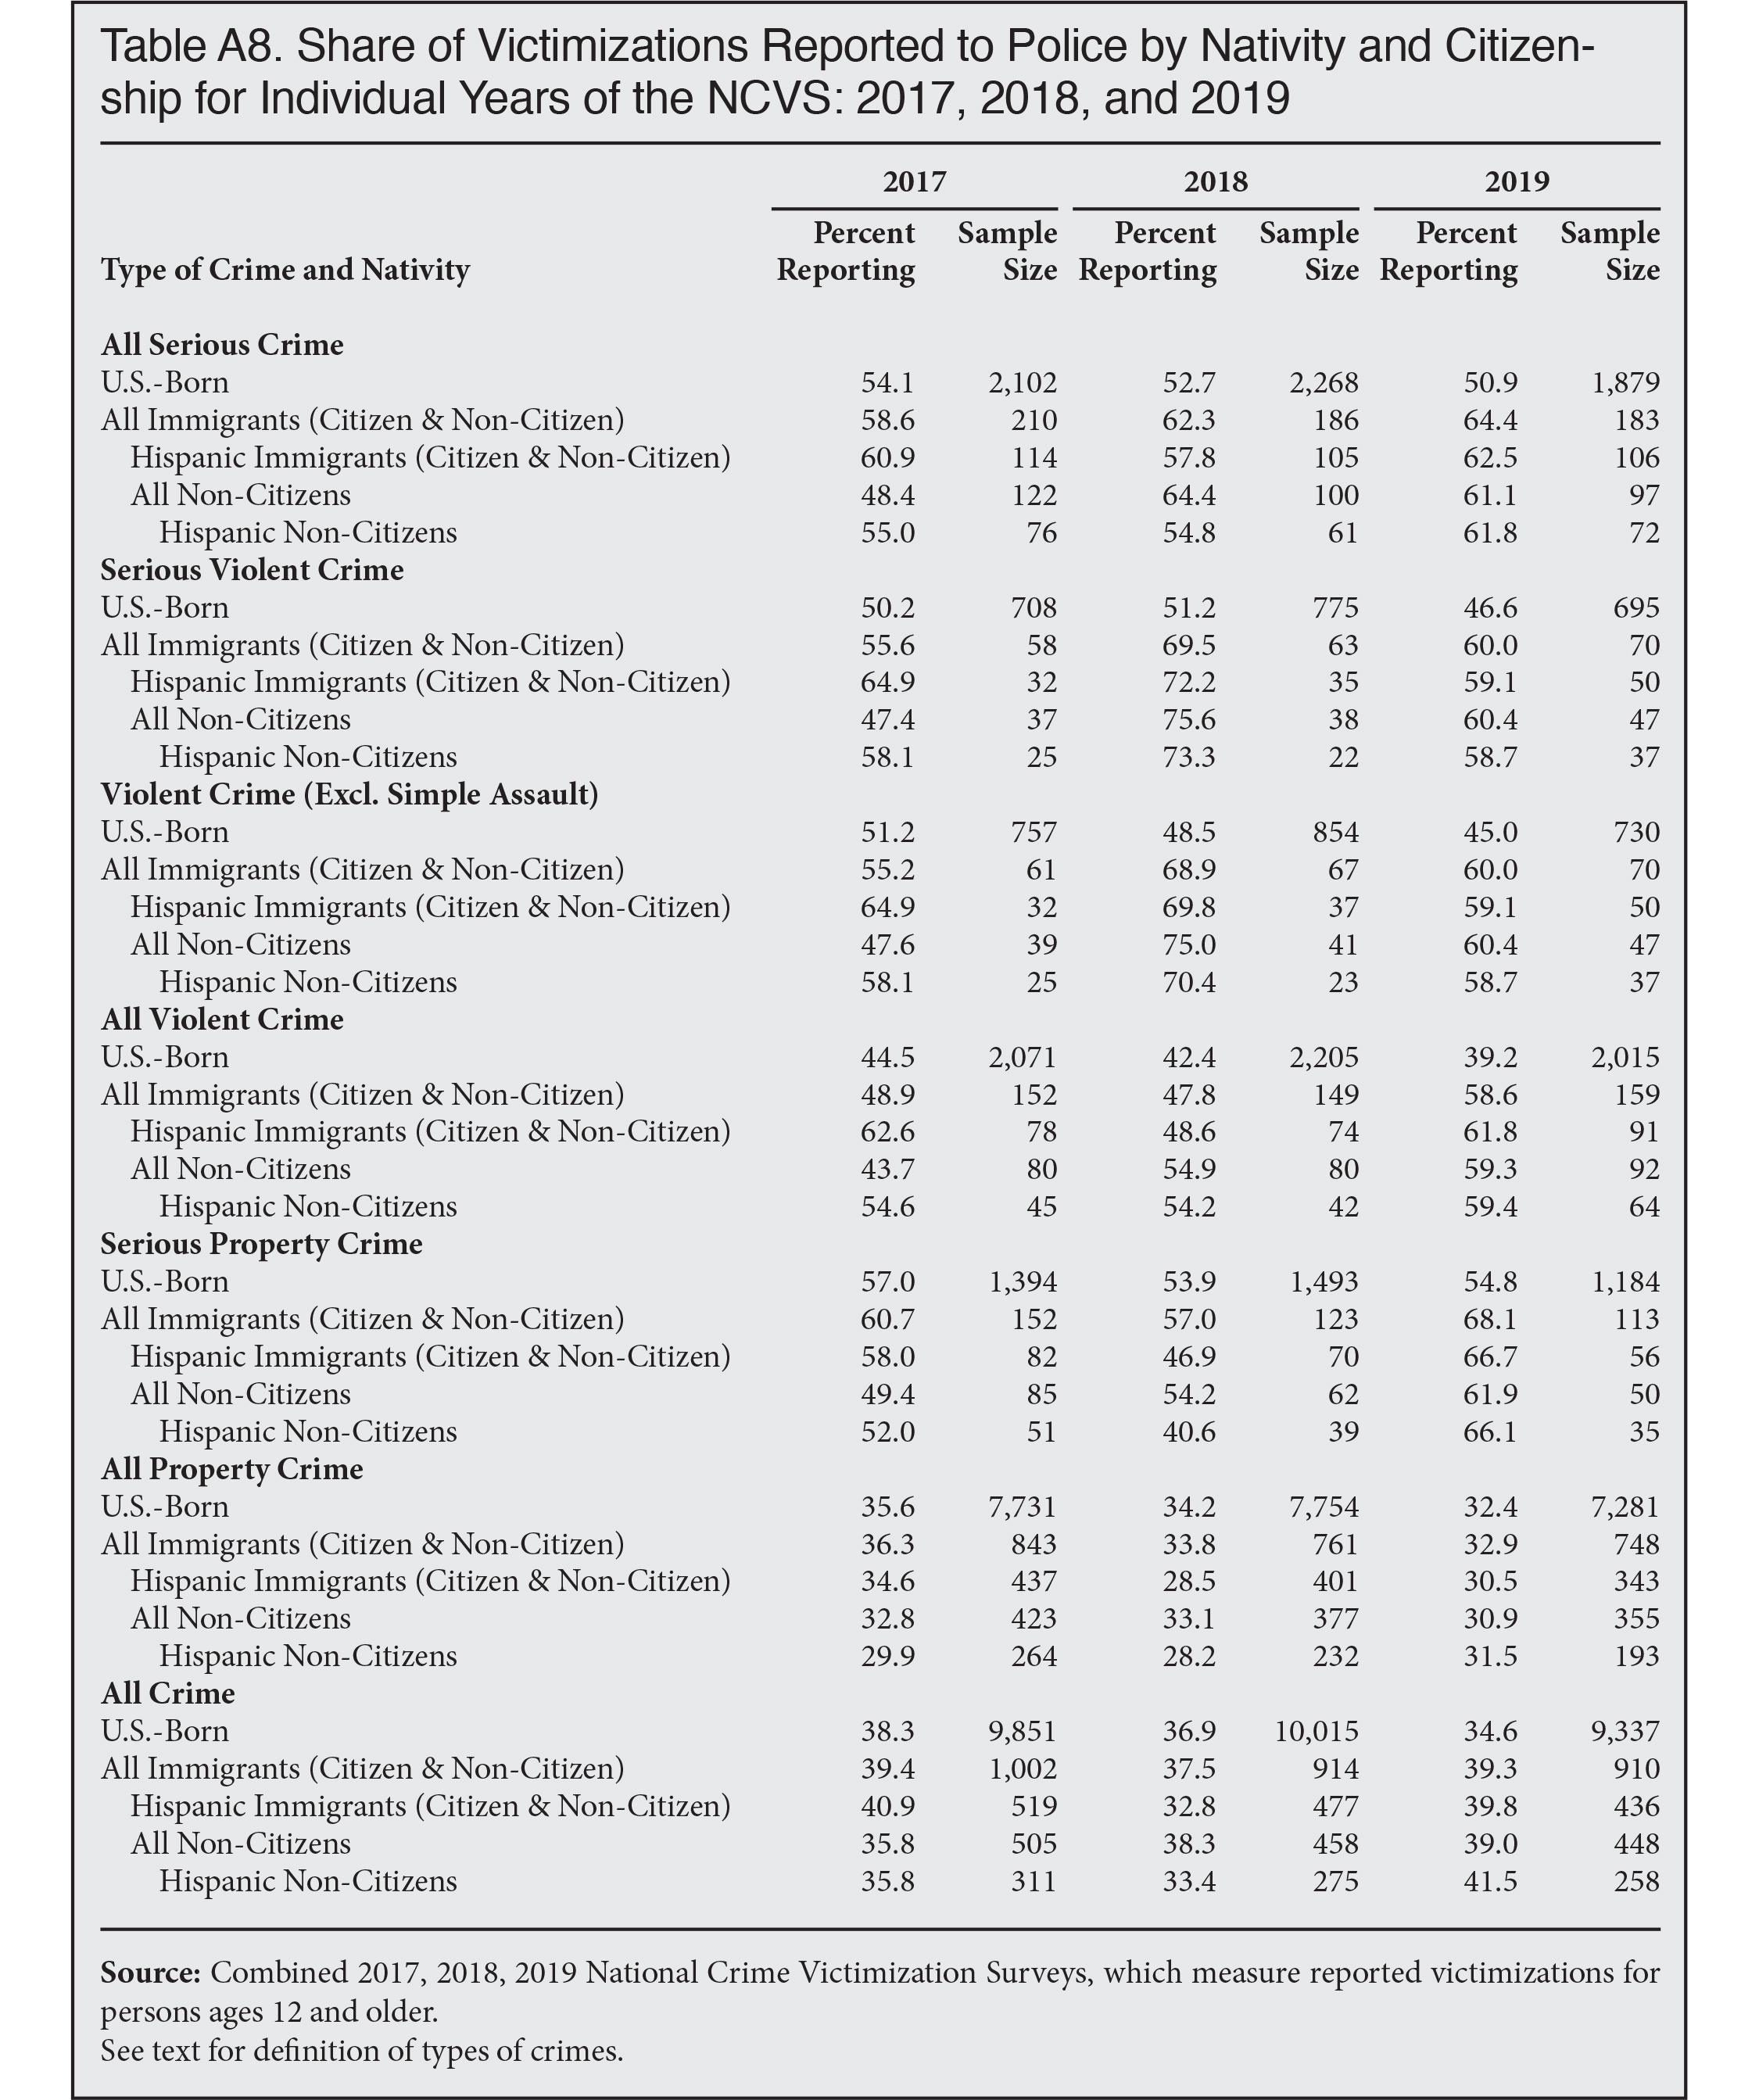
- Sixty-two percent of all serious crimes against all immigrants (citizen and non-citizen) were reported to police, compared with 53 percent of all serious crimes against native-born Americans — a statistically significant difference.
- Fifty-seven percent of serious crimes against non-citizen immigrants (and against Hispanic non-citizens) were reported to police, which is statistically equal to the 53 percent reporting rate for native-born Americans.
- Sixty-one percent of serious violent crimes against all immigrants in the survey were reported to police, compared with 49 percent against the native-born — a statistically significant difference. Fifty-nine percent of all non-citizen victimizations and 62 percent of all Hispanic non-citizen victimizations were reported to police.
- Of serious violent crimes against immigrant women, 65 percent were reported to police, as were 67 percent against non-citizen women, compared with 48 percent for the native-born women — a statistically significant difference.
- Reporting of serious and violent crimes against Hispanic non-citizens, a group that includes many illegal aliens, also generally matches or exceeds reporting of crimes against the native-born. If there were a major difference in crime reporting rates among illegal immigrants in particular, it would most likely show up in the reporting rates for this group, but the survey reveals no such meaningful difference.
- Property crimes (the most common type of crime) against immigrants are reported at rates similar to those against native-born victims — 34 percent. Among non-citizens, the rate was 32 percent, which is not statistically different from the other groups.
- Turning to all crime (violent and property), the NCVS shows 39 percent of all immigrant victimizations and 38 percent of all non-citizen victimizations were reported to police, compared with 37 percent of all crimes against the native-born — not a statistically significant difference.
- For every major category of crime, only about 1 percent of immigrant victims who did not report the crime said that the reason they did not report it was because the police would be biased, would harass or cause them trouble, or because they were advised not to report it. These are the survey responses that are most likely to indicate a fear of deportation.
- More than 80 percent of all victimizations reported to police were reported by the victim or by a member of the victim’s household. This is true for all groups analyzed: immigrants, non-citizens, and the native-born.
- We find no evidence in the NCVS data to support the “chilling effect” theory that immigrants are more reluctant to report crimes, generally, or in the parts of the country where local authorities routinely cooperate with ICE, such as the South.
Introduction
Discussion of crime reporting by immigrants has increased in recent years, as cooperation and communication between state and local law enforcement agencies has been significantly improved by the implementation of various information and resource sharing programs to facilitate the arrest and removal of criminal aliens, including the Secure Communities and 287(g) programs. The Secure Communities program enables the federal Immigration and Customs Enforcement agency (ICE) to access and review biometric information on all those arrested or booked into jails nationwide, and the 287(g) program allows state and local law enforcement officers to arrest and process criminal aliens.1
Opposition to the implementation of these programs led to an increase in state and local sanctuary policies, which aim to prohibit or limit state and local law enforcement agencies from sharing information or cooperating with federal immigration agencies, especially ICE. Proponents of sanctuary policies often claim that they are necessary to ensure that immigrants, and especially illegal immigrants, will report crimes. Police cooperation with ICE, the argument goes, has a “chilling effect” on the willingness of immigrants, or those they live with, to report crimes to police because doing so will expose them to immigration enforcement and deportation.
For example, the sponsor of a perennial Massachusetts bill that would outlaw cooperation with ICE recently said:
In a city like Lowell [with a large foreign-born population], those immigrants think that the local police officer is engaged in enforcing immigration law, they’re not going to report a crime or domestic violence. They won’t have that trust with police. That’s a main mission of this bill is to restore that trust.”2
Similarly, the Colorado speaker of the house said in justifying the need for a sanctuary bill in 2019: “The immigrant population in Colorado [is] a big part of our community and right now with the current administration, people don’t always feel safe. They don’t feel safe reporting crimes, they don’t feel safe going to public spaces.”3
President Biden’s nominee for the position of commissioner of Customs and Border Protection (CBP), Chris Magnus, who is chief of police in Tucson, Ariz., also has promoted this theory. In a 2017 op-ed in the New York Times, Magnus wrote: “If people are afraid of the police, if they fear they may become separated from their families or harshly interrogated based on their immigration status, they won’t report crimes or come forward as witnesses.”4
On the non-partisan “explainer” website Britannica Procon.org, which presents brief summary arguments from prominent officials or experts on each side of major contemporary issues, four out of the five statements by top advocates selected to represent the pro-sanctuary position mentioned concerns about immigrant crime reporting as a justification for sanctuary policies.5
The text of the sanctuary ordinance for San Francisco County, Calif., one of the strictest in the nation, cites the case of an illegal alien who was arrested by ICE in 2016 after a routine interaction with a San Francisco police officer.6 Advocates often point to the 2017 arrest of an illegal alien (with several criminal convictions and five prior deportations), outside of an El Paso courthouse, where she had been seeking a restraining order on her boyfriend, as an illustration of the alleged risk illegal immigrants face if they report victimizations to local police.7
Law enforcement agencies contend that these examples are not at all representative of most interactions immigrants — legal or illegal — have with police, and are skeptical that their cooperation with ICE discourages immigrants from reporting crimes. They maintain that immigrants are more afraid of criminals in the community than they are of authorities.8
Other Research on Immigrant Crime Reporting
There is a sizeable body of recent academic research on the topic of immigrant crime reporting that reflects the ongoing debate on the “chilling effect” theory. Yet many of the published studies that we have reviewed have significant limitations, which we explore below. None of the academic studies we have seen are as comprehensive and authoritative as the federal NCVS, which is a nationally representative set of data that surveys actual victims about the victimizations, whether they were or were not reported to police, who reported them, and reasons why crimes were not reported. The 2017 public-use NCVS is the first year that citizenship is available in the NCVS, enabling us to examine reporting rates for self-reported immigrants (foreign-born), native-born, citizens, and non-citizens, as well as by ethnicity. To the best of our knowledge, ours is the first report to use this new data to measure the propensity of immigrant victims to report crimes to police.
Some of the most frequently cited studies on this topic rely on relatively narrowly drawn surveys of immigrants who are asked to respond to hypothetical situations. For example, a 2013 report by a University of Illinois researcher asked immigrants and natives in four U.S. cities if they would be less likely to report crimes after being told that there was increased police involvement in immigration enforcement.9 Others have surveyed law enforcement officers, courts, or advocacy groups about what they have observed or suspect about crime reporting by immigrants.10 In contrast, the NCVS surveys real crime victims about their actual response after a victimization.
Still other studies report and compare the results of surveys of immigrants in particular local jurisdictions, which may or may not be representative of or similar to other parts of the country.11 One of the more comprehensive and authoritative of these local studies was conducted by University of Virginia and Police Executive Research Foundation researchers under contract to the police department of Prince William County, Va.12 On the specific issue of crime reporting, the researchers found that “the rates of reporting were nearly identical for Hispanics and non-Hispanics, and were statistically indistinguishable,” but their survey did not identify immigrants and citizens. And it is unclear to what extent the findings would be applicable to the country as a whole.
A new study, published in January 2021, claims to show conclusively that immigration enforcement, and particularly immigration enforcement in cooperation with local law enforcement, discourages illegal aliens and Hispanics in general from reporting crime. The title of the paper is “Immigration Policies and Access to the Justice System: The Effect of Enforcement Escalations on Undocumented Immigrants and Their Communities”, by Reva Dhingra, Mitchell Kilborn, and Olivia Woldemikael.13 Because this paper also uses the NCVS to test its theory, and because it has appeared in major news media outlets, including the Washington Post, and been cited by other researchers, we believe it merits a closer look.
We find a number of significant problems with their analysis. Using the FBI’s Uniform Crime Reporting (UCR) Program, Dhingra et al. found that incidents of crime declined more in counties with larger Hispanic populations (immigrant and native-born) from 2016 to 2017. Over the same time period, they also found declines in crime in those counties around the country that cooperate more with ICE. The authors conclude that the observed decline in crime was caused by Hispanics reporting fewer crimes to police out of fear of deportation due to the Trump administration’s intensification of immigration enforcement, assisted by an increase in cooperation between local police and ICE. They do not believe that there was an actual decline in crime (which could have occurred due to a variety of reasons that have nothing to do with immigration enforcement, such as police budgets, changing policing strategies, the economy, and even the weather), or believe that other possible explanations could account for the decline in crime, such as the possibility that removing criminal aliens helps reduce crime, especially in immigrant communities.
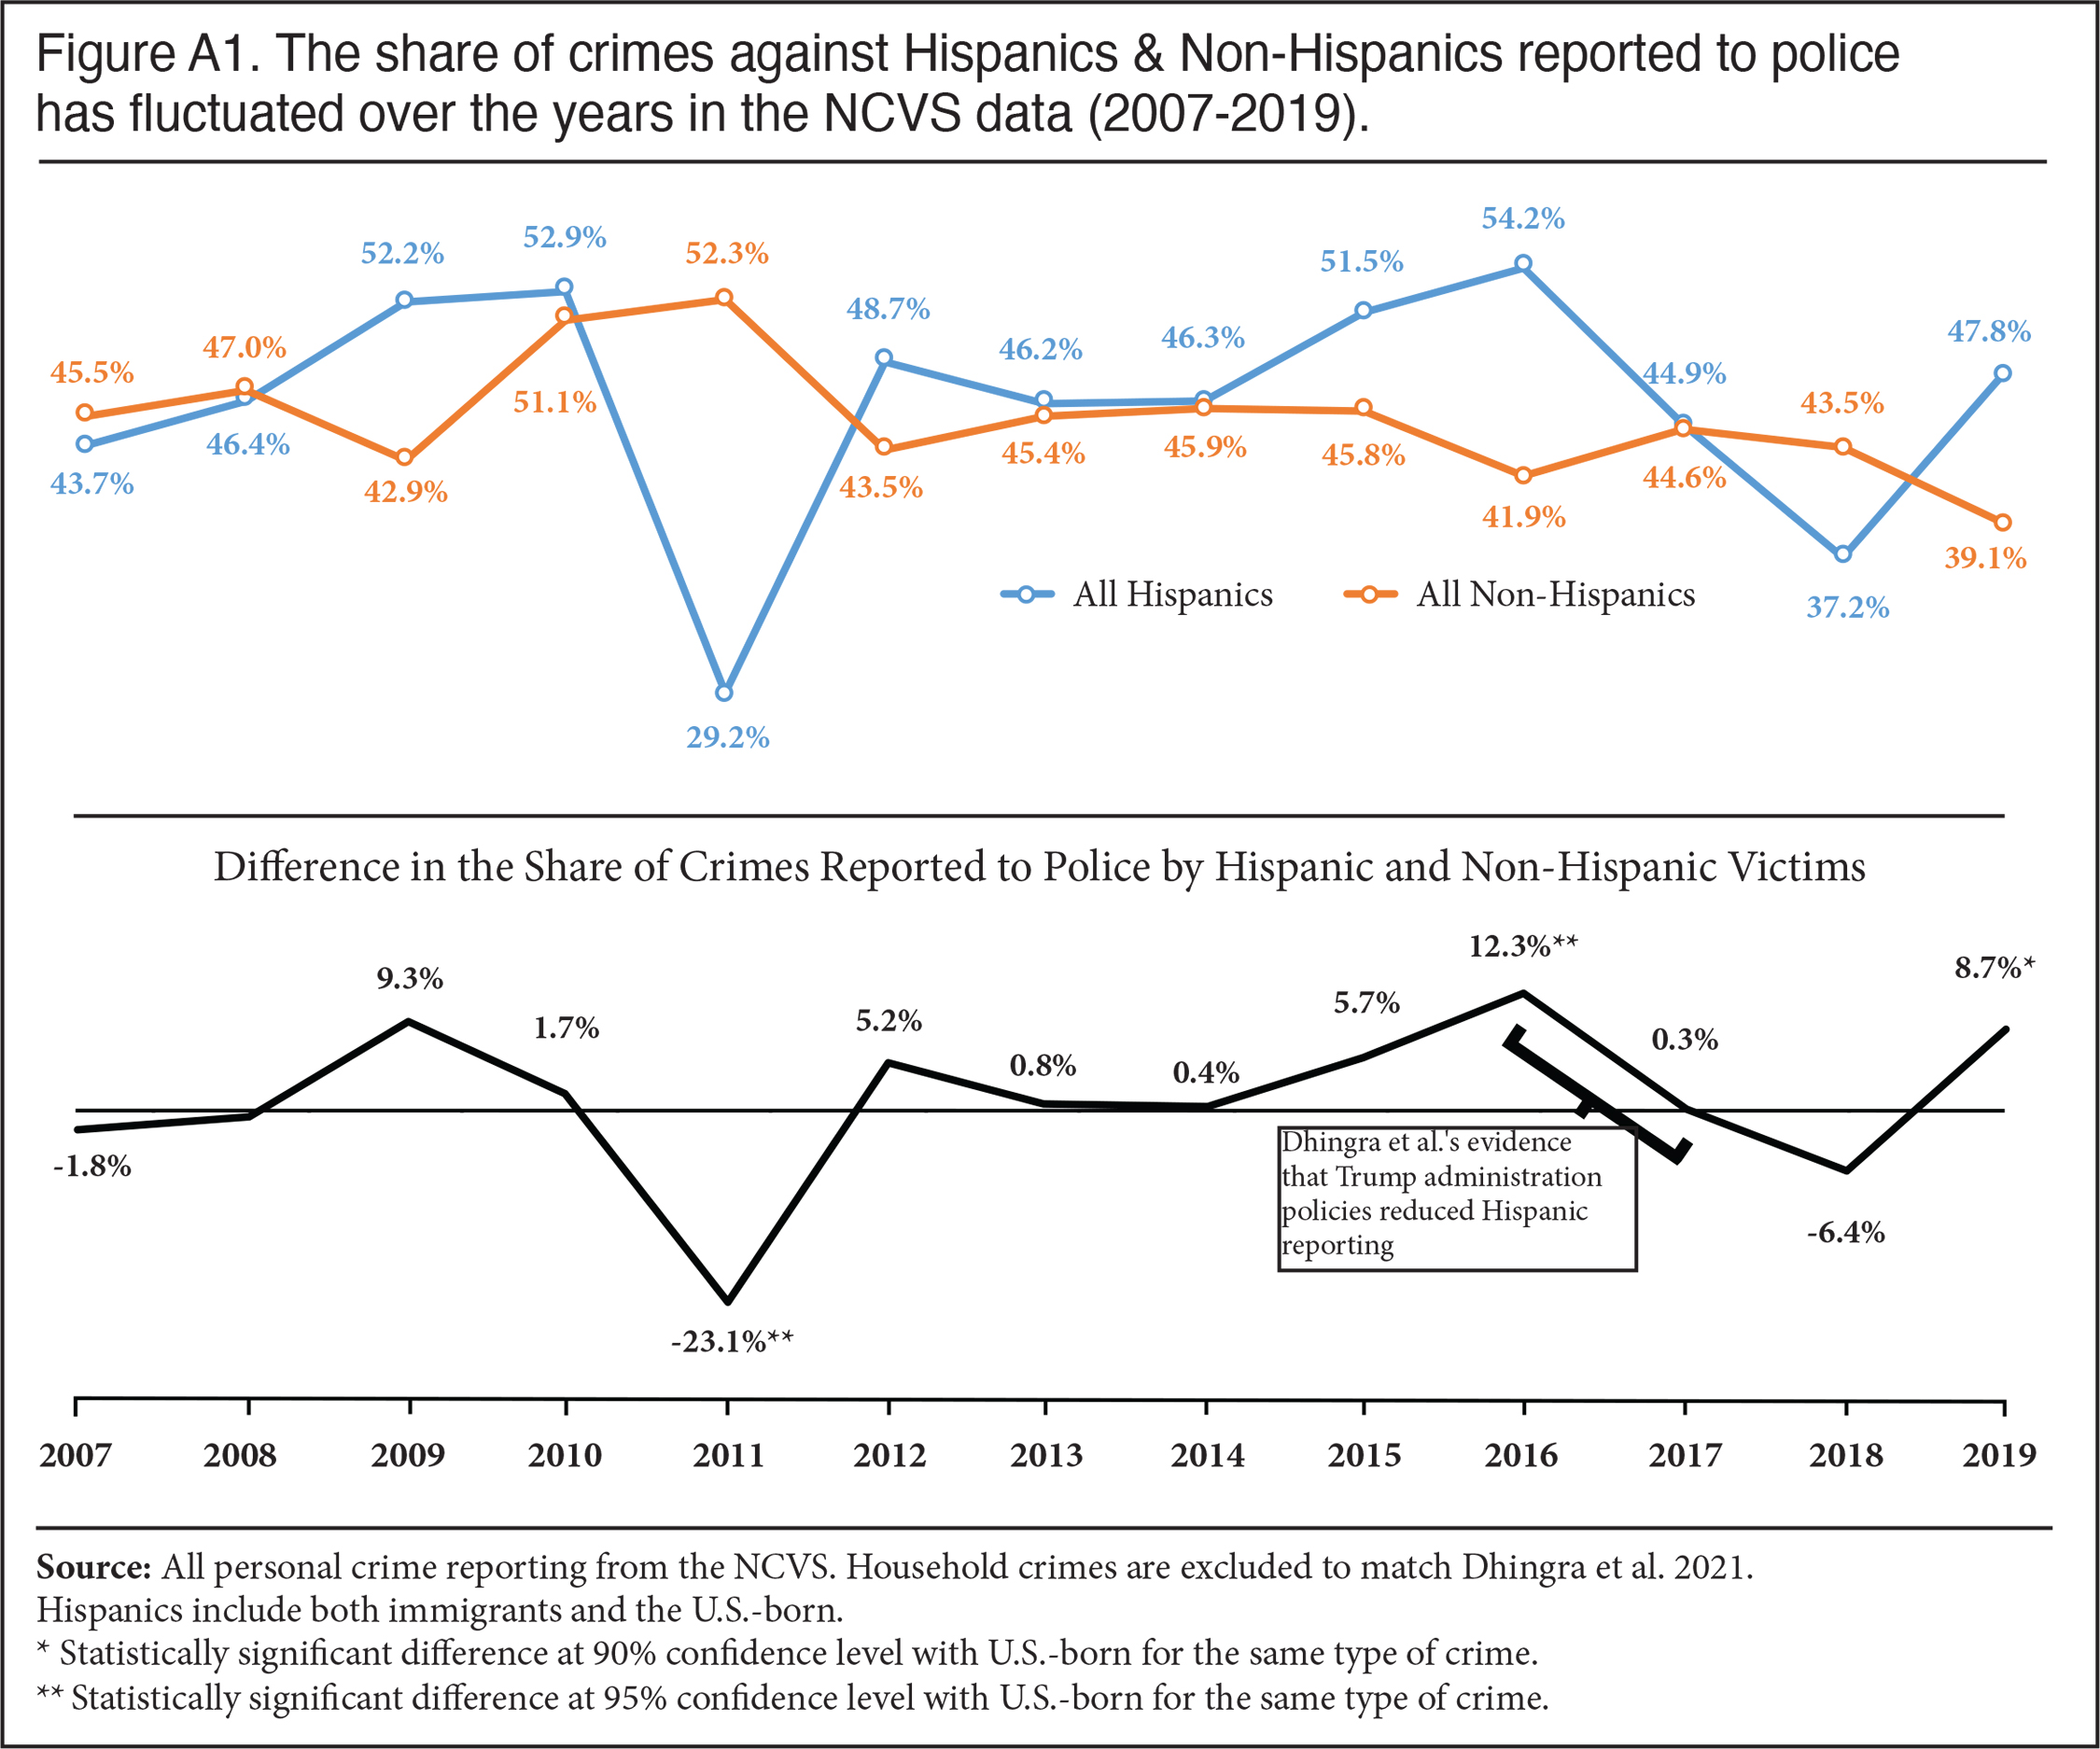
To test their theory, the authors used the NCVS data on the crime reporting rates of Hispanic populations. However, they present the data on Hispanics in isolation — without showing how it compares to the crime reporting rates of other population groups, including the native-born, a vital source of context. Dhingra et al. find that the share of crimes reported against all Hispanics (immigrant and U.S.-born together) dropped by 12 percentage points between 2016 and 2017. They do not report that in the NCVS, Hispanic victimizations in 2017 were still slightly more likely to be reported to police than non-Hispanic victimizations — 44.9 percent vs. 44.6 percent. (See Figure A1 in the Appendix for crime reporting by Hispanics and non-Hispanics from 2007 to 2019 using the public-use NCVS.) A fair interpretation of the NCVS data is that Hispanics were more likely to report crime than non-Hispanics in 2016 (54.2 percent vs 41.9 percent), and then were equally likely in 2017 (44.9 percent vs 44.6 percent).14
Further, the new NCVS data, which Dhingra et al. may not have been aware of, shows that the share of all Hispanic victimizations reported fell further in 2018 to 37.2 percent, which might be seen as buttressing the author’s arguments, but it rebounded dramatically in 2019 to 47.8 percent, while the share of crimes against non-Hispanics that were reported dropped to 39.1 percent in 2019.15 What this shows is that there is considerable annual variation in the NCVS data from year to year. We believe this reflects the relatively small sample size of Hispanic victims in the survey when using a single year of data, which creates large margins of error.16 In the years the authors focus on, the margin of error for Hispanic victims is roughly ±8 percentage points.17 Regardless, if one thinks that the change from 2016 to 2017 represented a meaningful decline in crime reporting by Hispanics, then the 2019 rebound should be seen as representing a meaningful increase, and that the initial decline was likely temporary.18
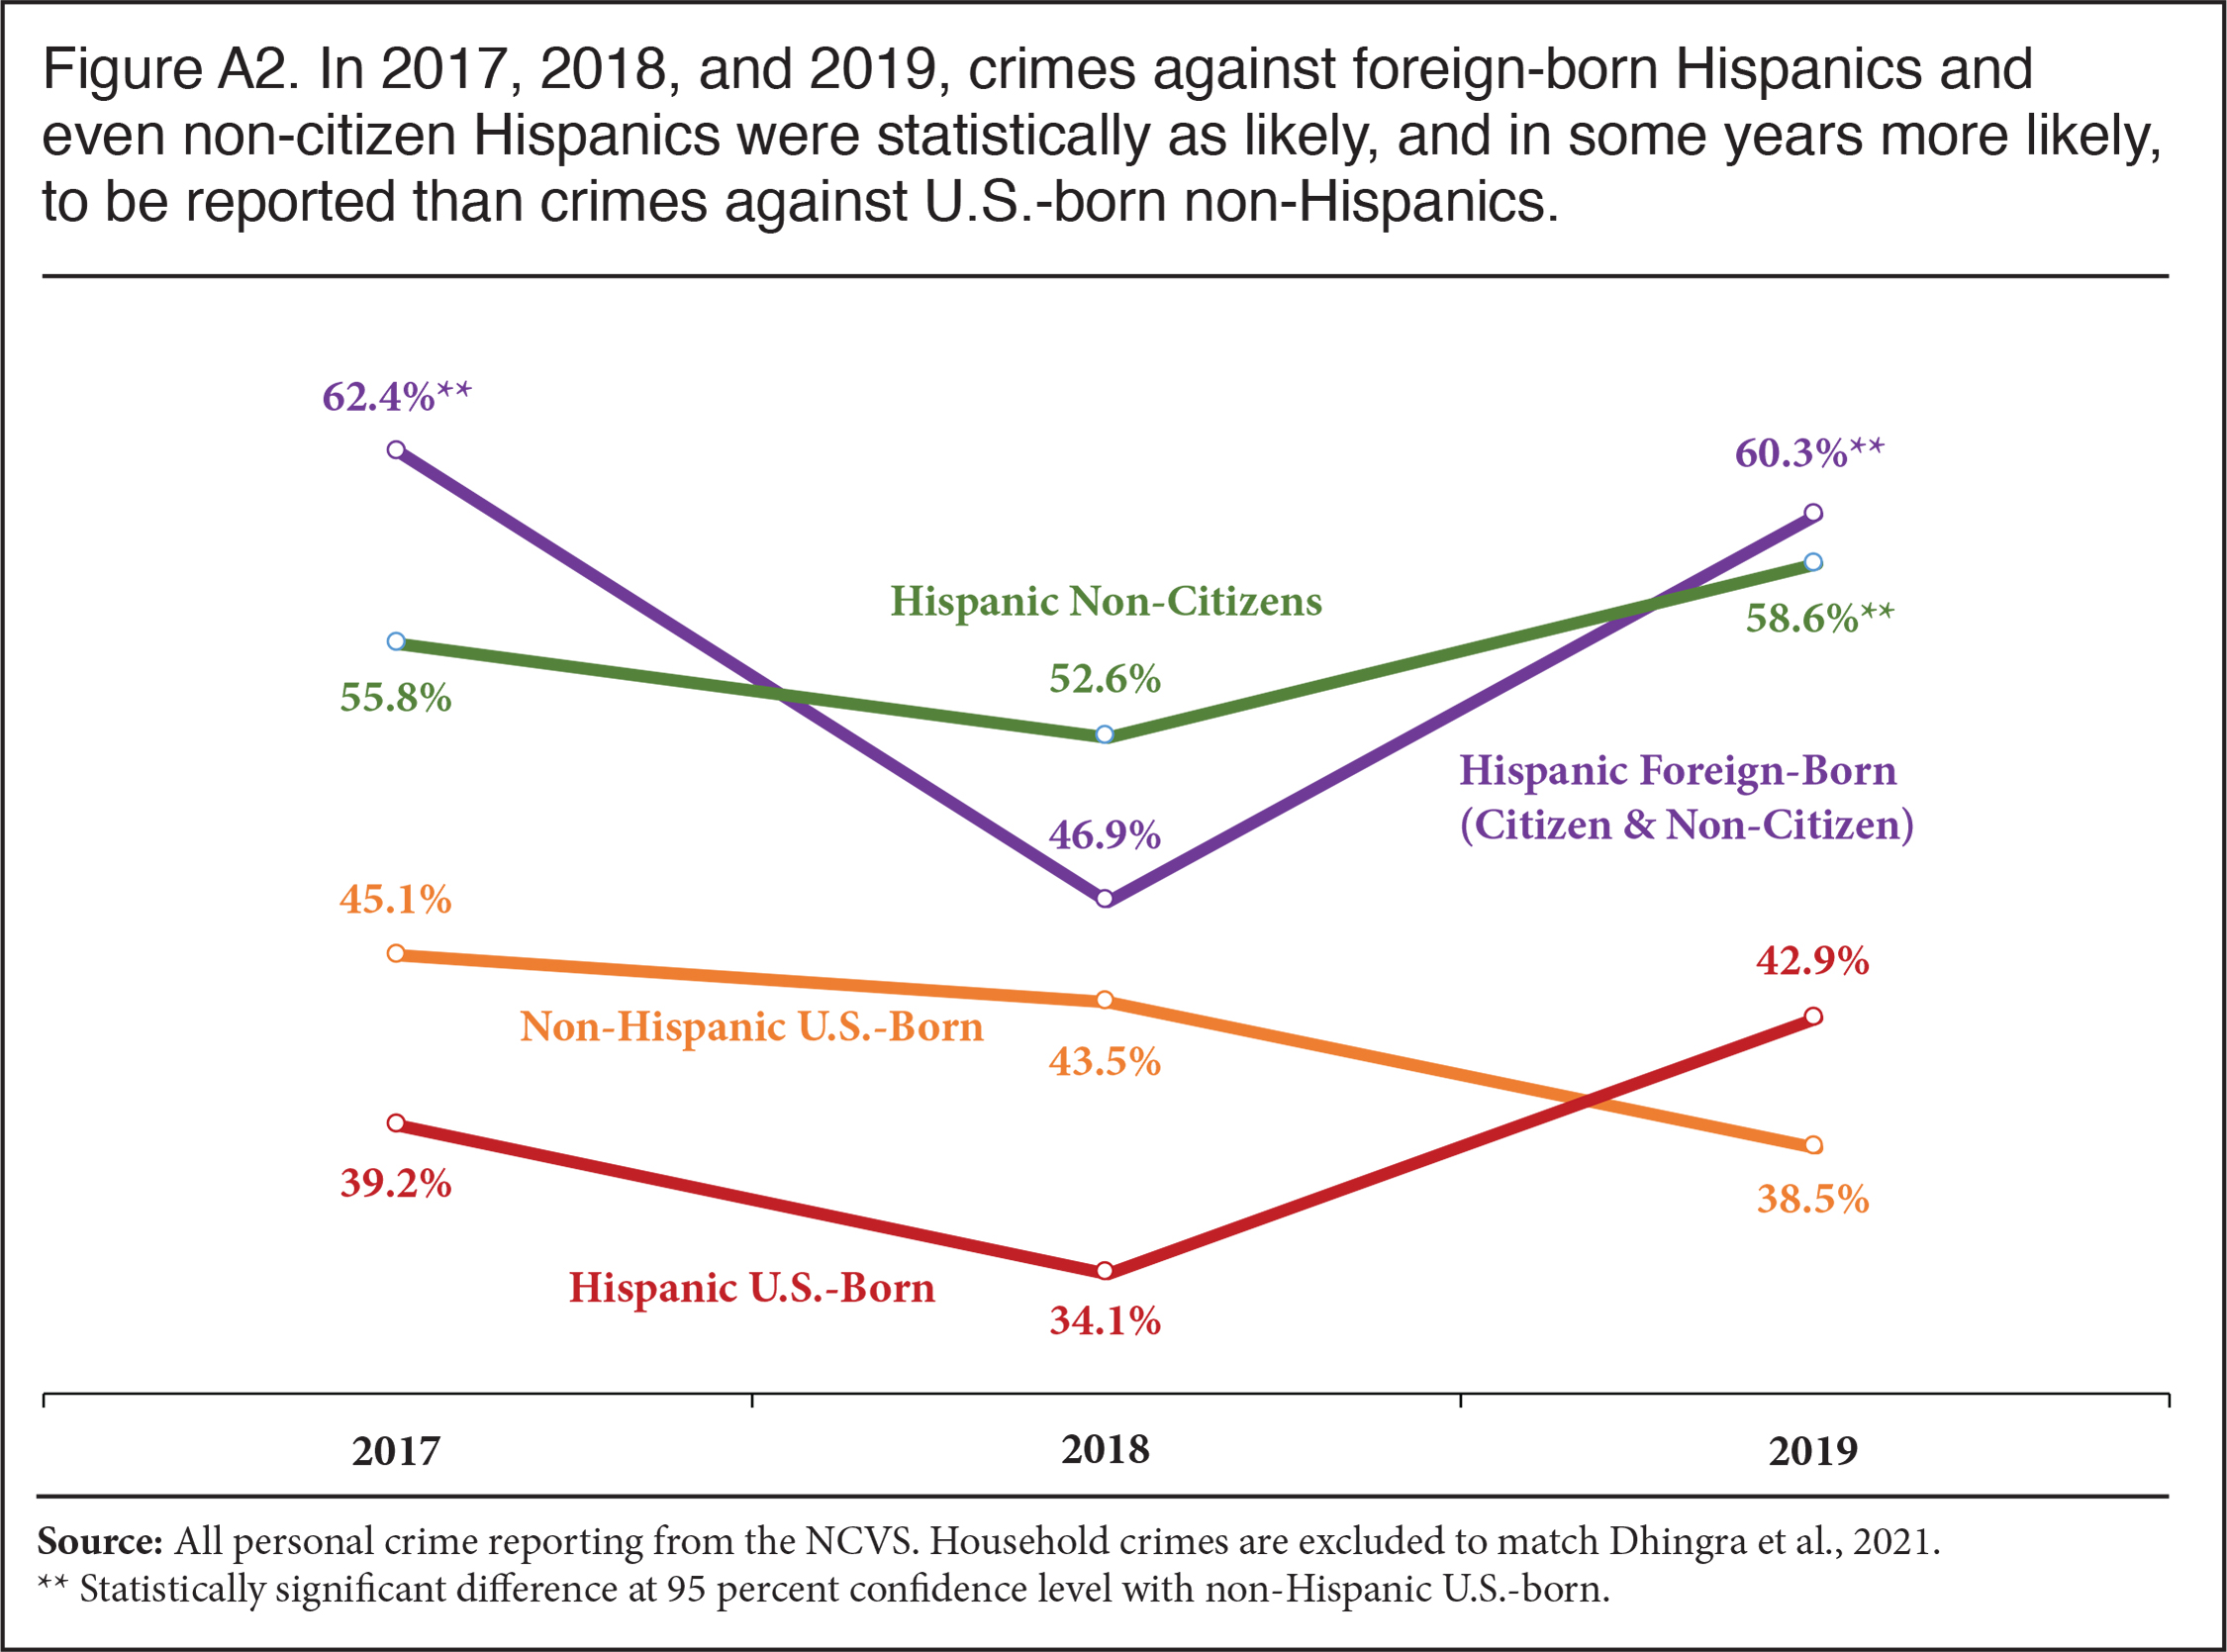
As we show in this report, newer NCVS data on the citizenship of victims also calls into question the idea that the change from 2016 to 2017 in Hispanic crime reporting was due to a fear of deportation. (See Figure A2 in the Appendix for crime reporting by citizenship.) Each of the last three years of NCVS data shows higher rates of crime reporting for immigrant Hispanics (naturalized citizen and non-citizen) than for native-born non-Hispanics; and, in some years, the difference is statistically significant. Further, in all three years, the reporting rates for Hispanic non-citizen victimizations (a reasonable proxy for illegal aliens and their family members) reported to police were higher than the reporting rates for non-Hispanic, native-born Americans, with a statistically significant difference in 2019.19
For all these reasons — failure to consider the many reasons for fluctuations in crime rates, failure to consider Hispanic crime reporting rates in the context of other groups, reliance on too brief a period of analysis of crime reporting rates, and, most importantly, the availability of new data on citizenship — we believe the findings of the study by Dhingra et al. are not persuasive.
Data and Methods
This analysis examines the reporting of crimes against immigrants and the native-born using the annual National Crime Victimization Survey, conducted by the U.S. Census Bureau for the Bureau of Justice Statistics (BJS), which is within the U.S. Department of Justice. The survey is specifically designed to measure the number and nature of criminal victimizations, whether they are reported to police, and, if not reported, the reasons for not reporting.20 Beginning in 2017, the survey began to include questions on U.S. or foreign birth and citizenship status, among other updates.
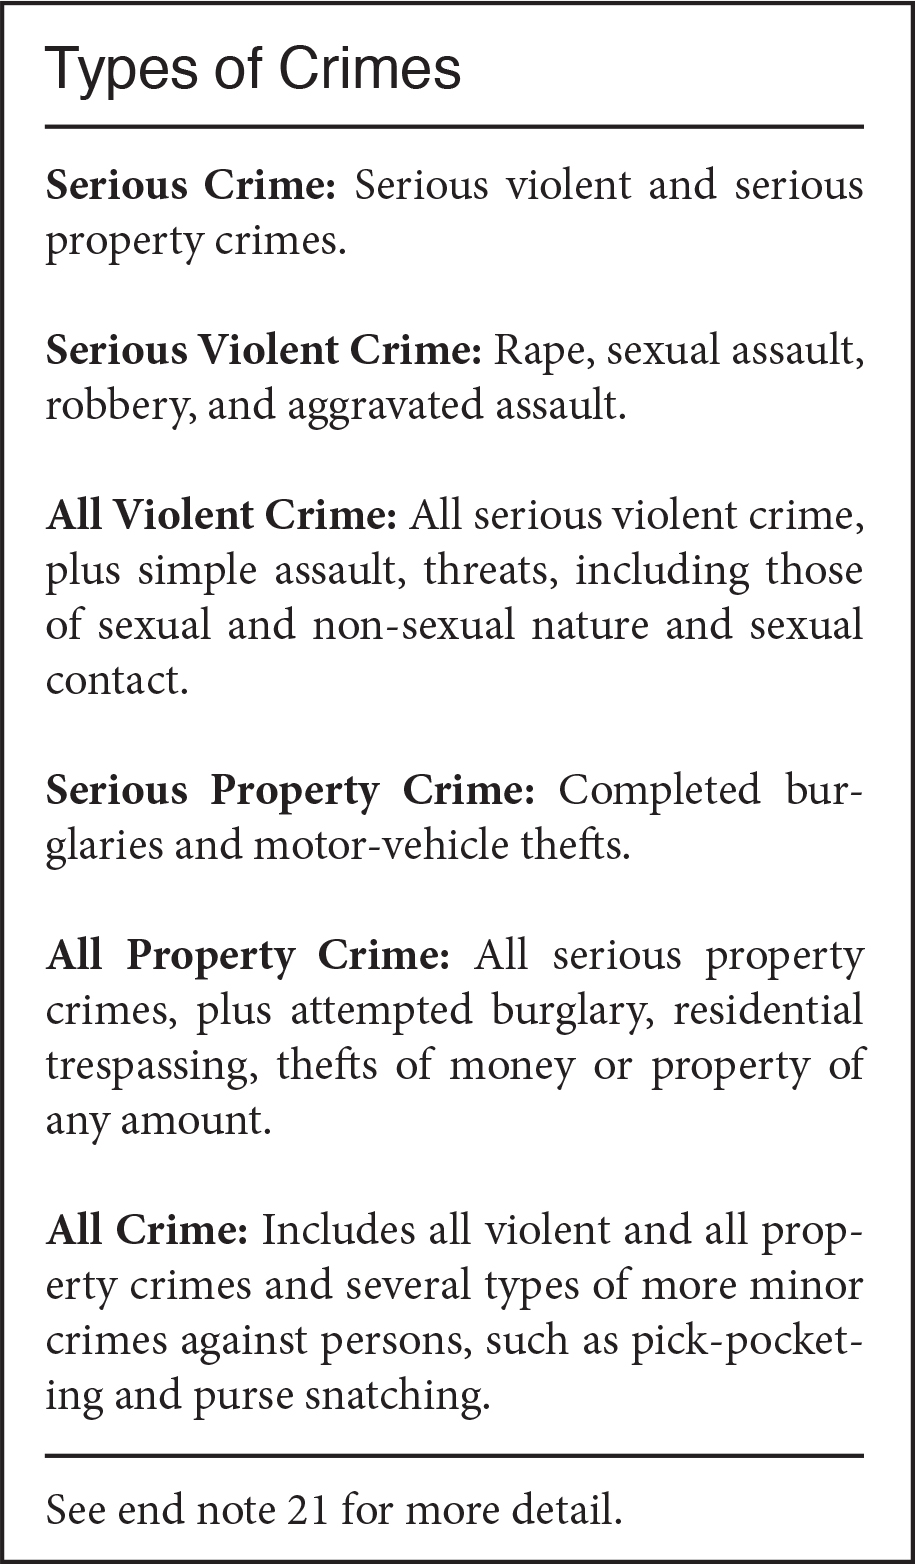
We classify crimes using the same categories that the BJS uses in its publications about the NCVS. The sidebar summarizes the crimes included in each category. In its publication, BJS tends to focus on serious crimes, which are those generally prosecuted as felonies, and violent crime.21 We follow this example, but also include figures for less serious crimes, property crimes, and all crimes.
We combine the three years of data (2017, 2018, and 2019) to allow for more statistically robust estimates, as the sample sizes of crime victims in individual years for many of the sub-populations of interest are quite small.22 The survey reports incidents of victimization; some individuals can be a victim more than once during the year.23
Calculating Unbiased Standard Errors. All standard errors from the NCVS used in this analysis to calculate confidence intervals and statistical significance are based on the parameter estimates and formulas provided by the BJS.24 We use the year-to-year correlation coefficients from the BJS for pooled data to calculate standard errors as we are using the 2017 to 2019 NCVS. The use of parameter estimates and coefficients accounts for the complex design of the NCVS, plus the fact that it is a panel survey.25 We use 90 and 95 percent confidence levels to determine statistical significance when comparing crime reporting rates between groups.
Citizenship. The 2016 redesign of the NCVS included the addition of a citizenship question. This question was first asked in July 2016 but was not available in the public-use files of the survey until 2017. The inclusion of this question allows researchers to examine all immigrants (naturalized citizens and non-citizens) together or separately.26 For the purposes of this analysis, immigrants are defined as all those residing in the United States who were not U.S. citizens at birth, including naturalized citizens, lawful permanent residents, temporary workers, foreign students, and illegal aliens.27 The U.S. Census Bureau and the BJS, as well as other government agencies, typically refer to this population as the “foreign-born”. Here we use the terms “immigrant” and “foreign-born” synonymously.28 We also use the terms “native-born”, “native”, and “U.S.-born” interchangeably for all those who were U.S. citizens at birth.
Illegal Immigrants. It is well established that illegal immigrants do respond to Census Bureau-administered surveys.29 To the best of our knowledge, there has been no specific research measuring the inclusion of illegal immigrants in the NCVS. But in comparing the Census Bureau surveys that capture illegal immigrants, we see that the number of foreign-born individuals in the Census surveys is similar to the number in the NCVS. Though there may be some undercount of illegal immigrants in the NCVS, as with the other surveys, illegal immigrants should show up in the NCVS as non-citizens.30 Confining the analysis to Hispanic non-citizens should provide a good deal of insight into the willingness of illegal immigrants, or those who live with them, to report crimes because a significant share of Hispanic non-citizens are illegal immigrants or live with illegal immigrants.31
Purpose of This Analysis. The primary goal of this analysis is to measure the crime reporting rates of immigrants in comparison to other groups to determine if immigrants have significantly different crime reporting rates than others. We compare the reporting of crimes against immigrants (both the foreign-born and non-citizens) to the reporting of crimes against the native-born. A secondary goal of this analysis is to explore whether cooperation between Immigration and Customs Enforcement (ICE) and local police has a measurable impact on the reporting of crimes by the foreign-born. While the NCVS is not ideal to examine this question because it does not identify specific states or cities where the respondents reported their victimizations, it is possible to compare crime reporting across different regions of the country and in communities of different sizes to shed some light on this question.
Findings
Immigrant Victim Crime Reporting Rates Are Similar to or Higher than the U.S.-Born
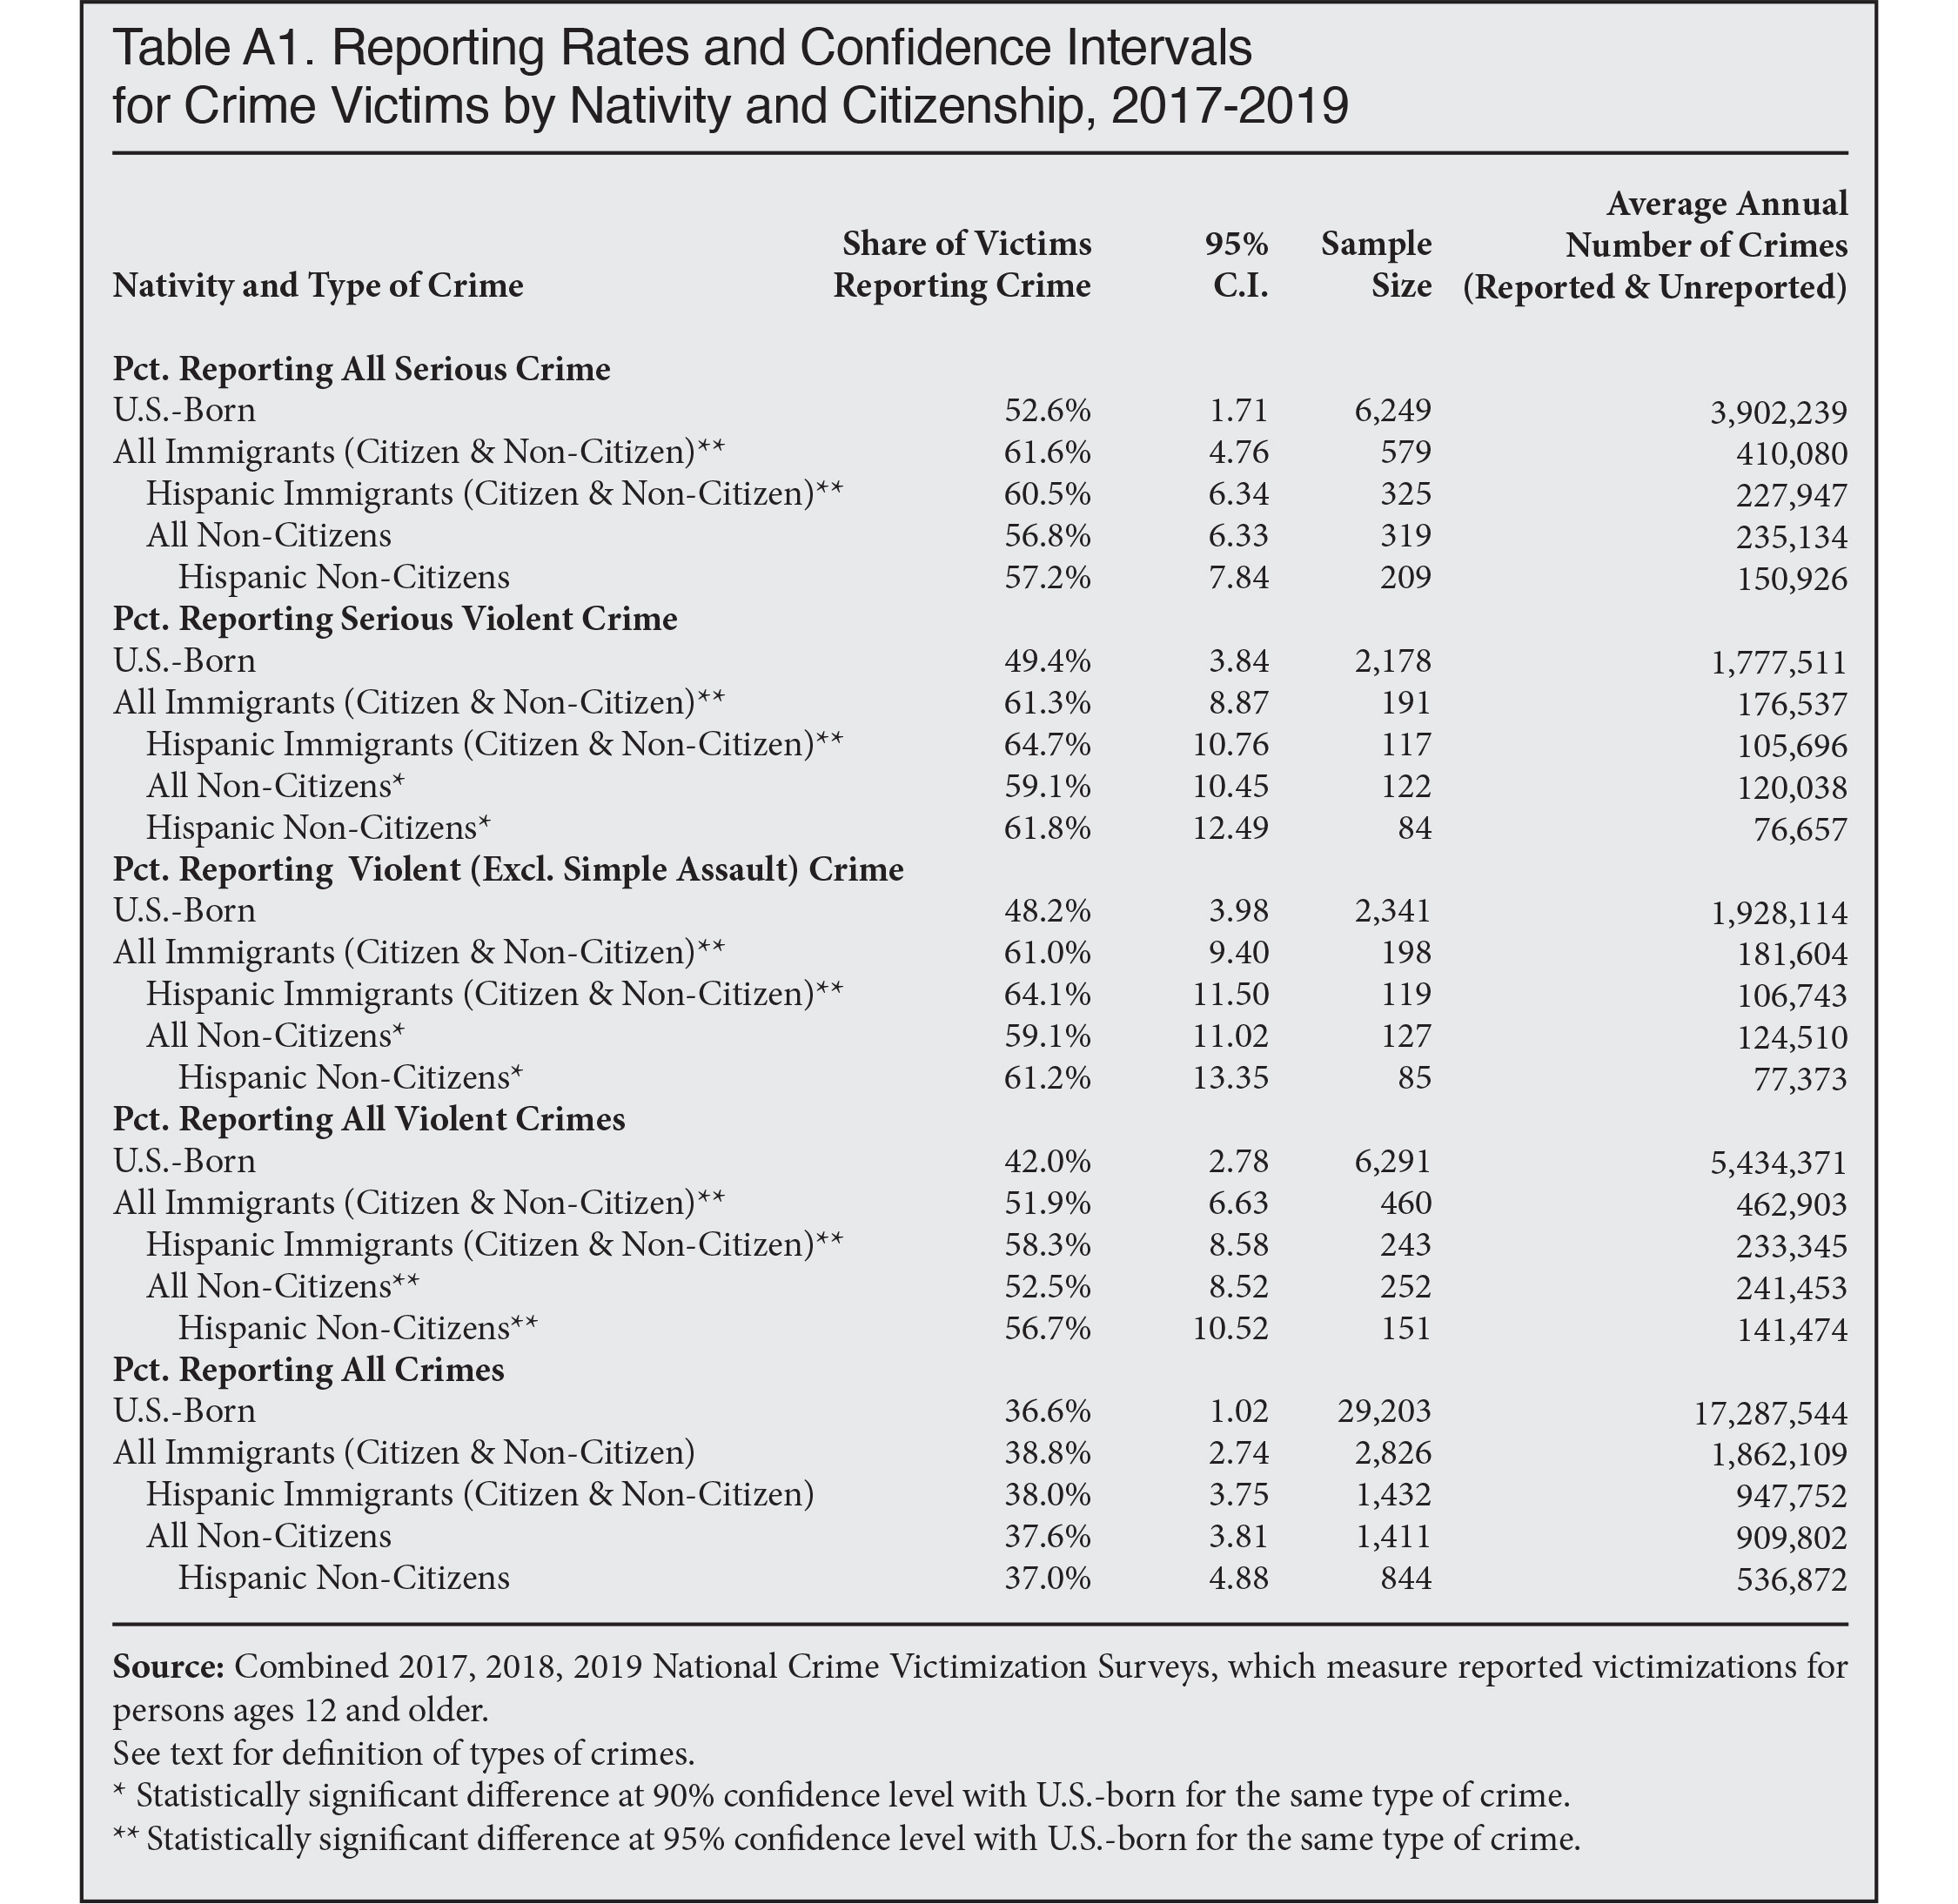
Serious Crimes. The Department of Justice defines serious crimes as those that are generally prosecuted as felonies (see sidebar). These include most completed or attempted violent crimes, apart from simple assault, and completed burglaries and motor-vehicle thefts. The left side of Figure 1 shows the share of victimizations reported to police for all serious crimes by the nativity and citizenship of the victim, with a separate breakdown of Hispanics in these classifications. (Table A1 in the Appendix provides additional information on the various types of crimes reported in Figures 1 and 2.)
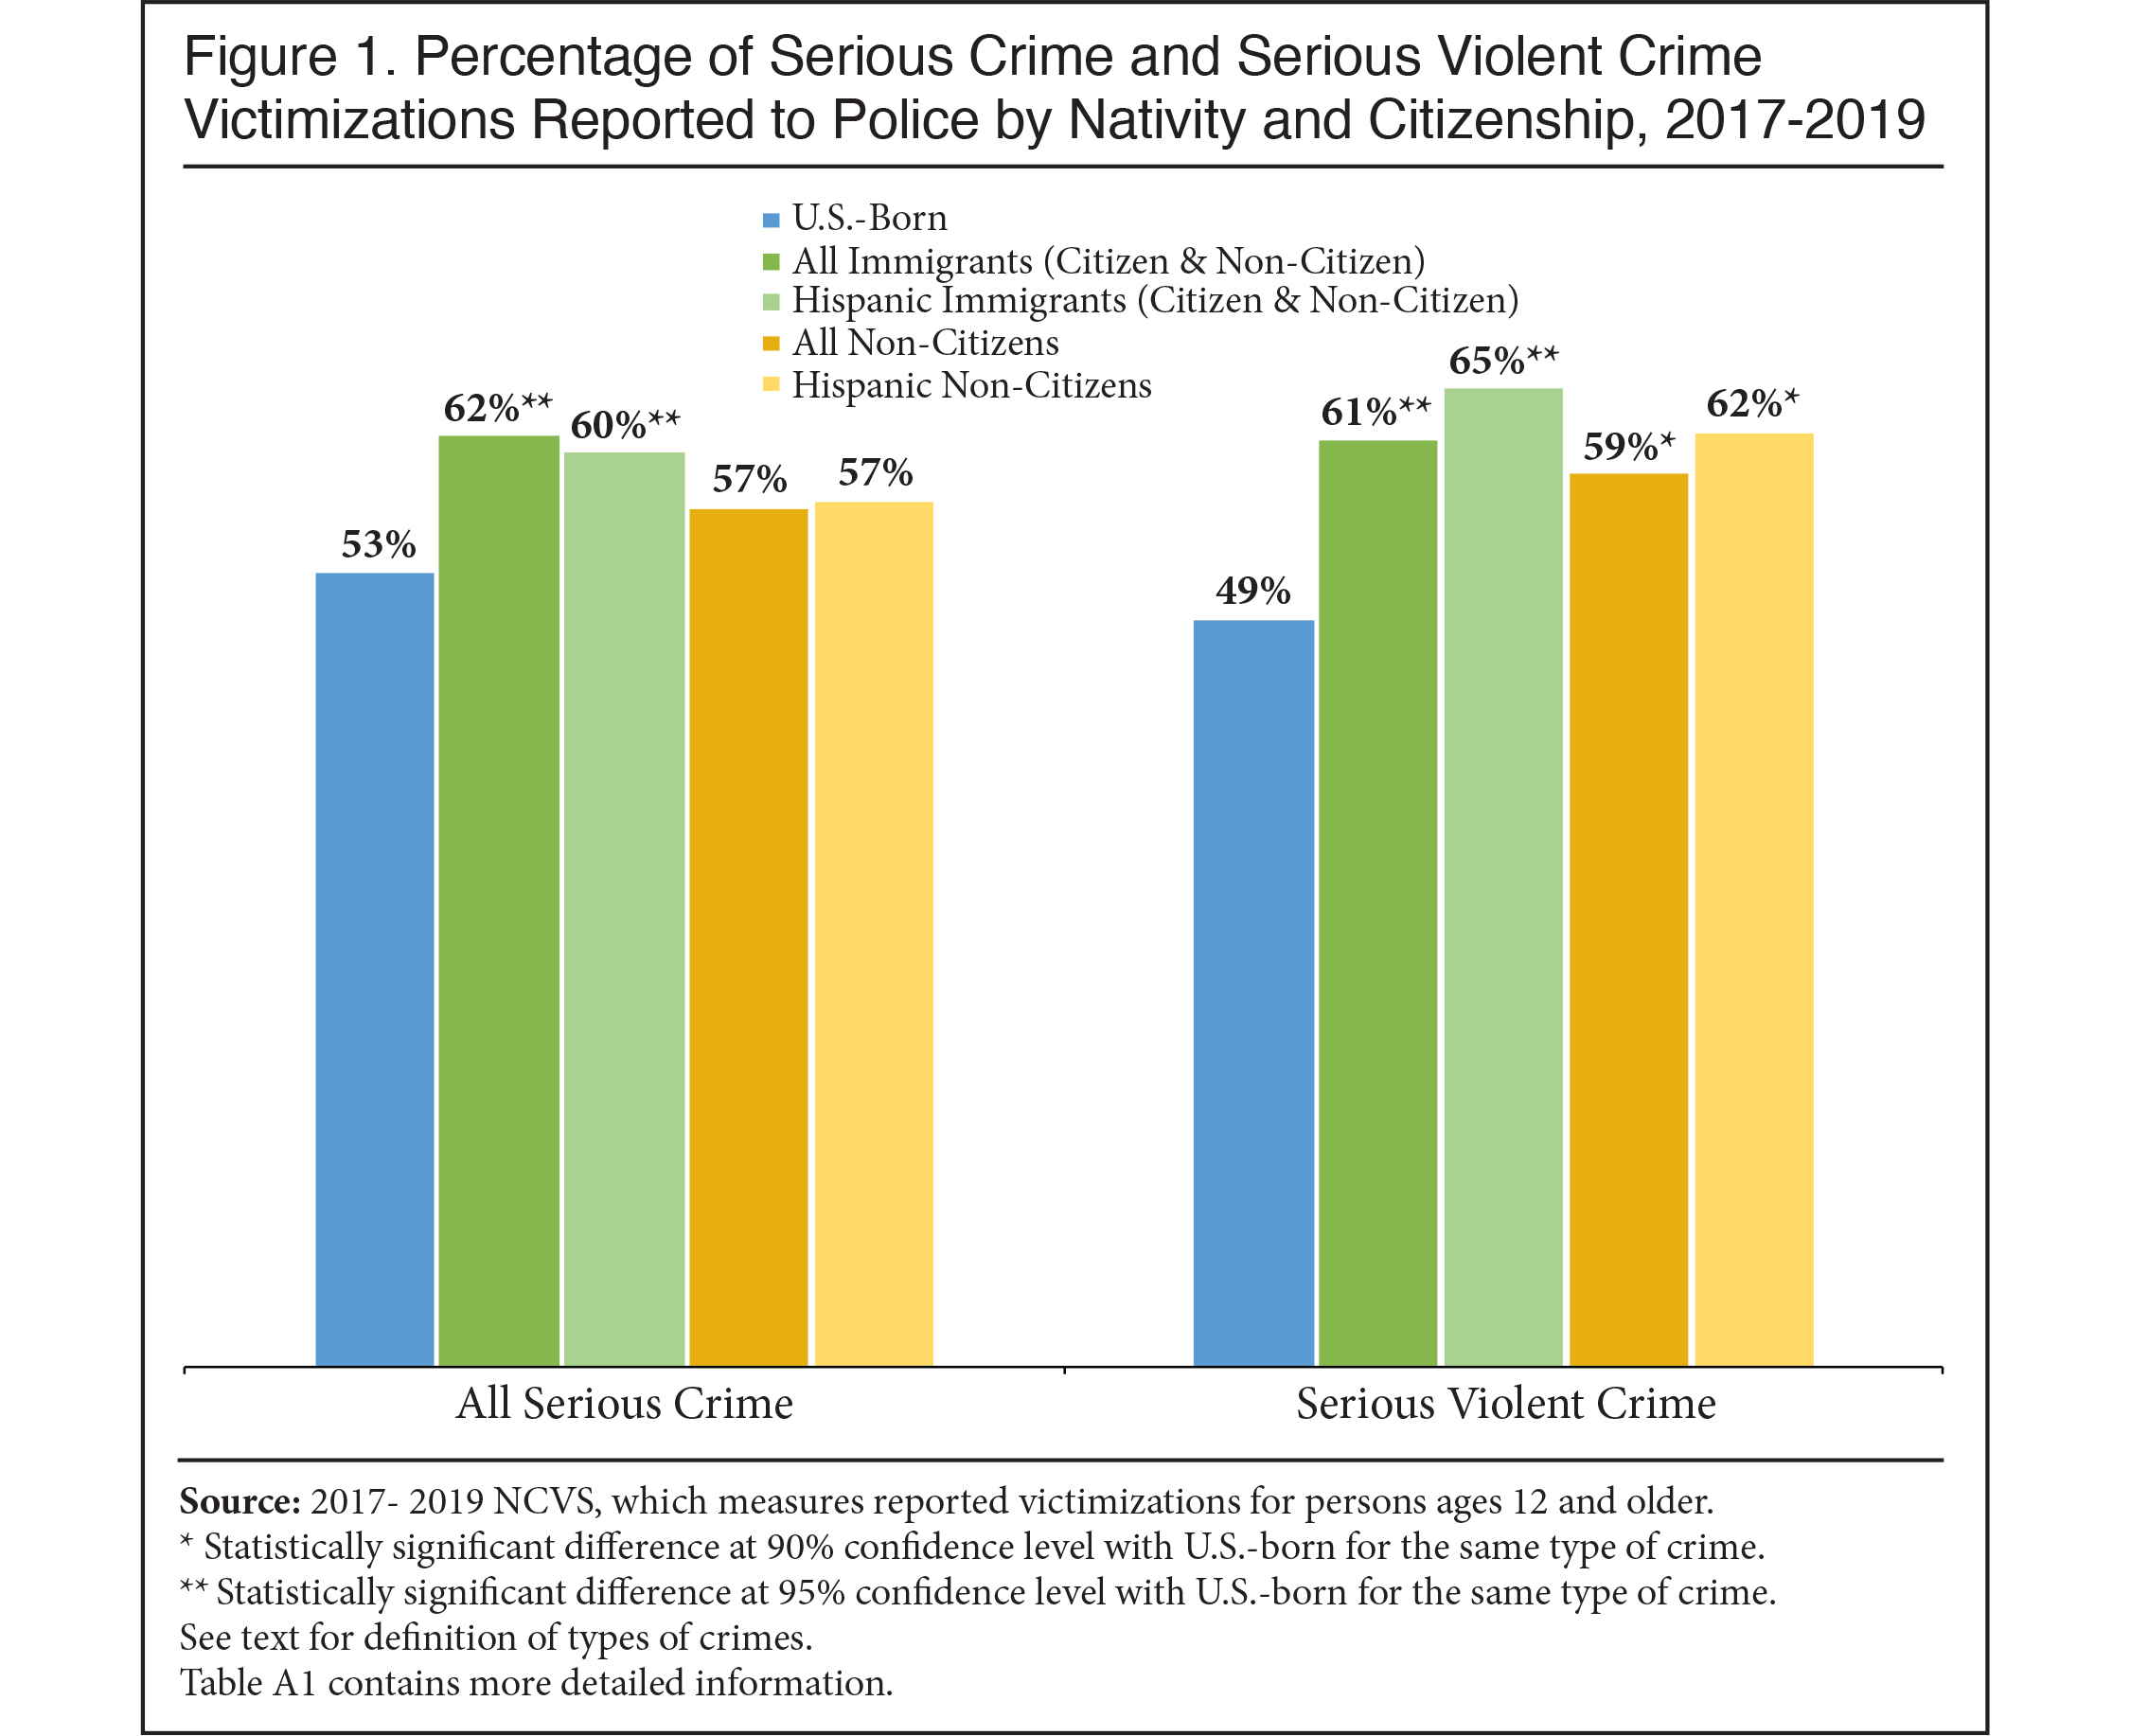 |
In the combined 2017 to 2019 sample of the NCVS, 62 percent of serious crimes against immigrants were reported to police, compared to 53 percent of such crimes against the U.S.-born. The higher rate of reporting for foreign-born victimizations is statistically significant at a 95 percent confidence level, which means that we can be 95 percent certain that an actual difference exists in the population. The same is true for Hispanic immigrants. The reporting rate for all serious crimes also is higher for non-citizens than for the native-born, but the differences are not statistically significant.32
Figure 1 also shows that crimes against the three sub-groups of immigrants (Hispanic immigrants, all non-citizens, and Hispanic non-citizens) are reported to police at rates that are at least as high as the reporting of crimes against the U.S.-born.
Serious Violent Crime. Serious violent crime is defined by the BJS to include rape, sexual assault, robbery, and aggravated assault. This is the category of crime that is most impactful on victims and public safety, and the type of crime that the police, prosecutors, and community leaders are most interested in having reported to them so that offenders can be prosecuted. The right side of Figure 1 shows the share of serious violent crimes reported to police.
Figure 1 shows that serious violent crimes against the foreign-born are more likely to be reported to police than crimes against native-born victims. Hispanic immigrant, non-citizen, and Hispanic non-citizen victimizations for serious violence are reported to police at rates that match or exceed those of the native-born, and the differences are statistically significant. At 61 percent, the share of serious violent crimes against all immigrants (citizen and non-citizen) reported to police is much higher than the 49 percent for the native-born, and the difference is statistically significant. Similarly, 65 percent of serious violence against foreign-born Hispanics was reported to police, compared to the 49 percent of such crimes against the U.S.-born — a statistically significant difference. At 59 percent and 62 percent respectively, the share of serious violent crimes against all non-citizens and Hispanic non-citizens reported to police is higher than the 49 percent of serious violent crimes against native-born Americans.
Other Types of Violent Crime. The BJS data also includes a breakdown for the broader category of violent crime, both including and excluding simple assault.33 The results are shown in Figure 2. This category includes all crimes of a sexual nature (including sexual threats), aggravated assault, and all types of robbery. The left side of Figure 2 shows the share of violent crimes, excluding simple assault, reported to police. As is the case with serious violent crime, immigrant victimizations are at least as likely to be reported as victimizations of the native-born when the crime is violent. In the category of violent crime, excluding simple assault, crimes against all immigrants (61 percent) and Hispanic immigrants (64 percent) are more likely to be reported than violence against natives (48 percent) and the difference is statistically significant. The reporting rates for all non-citizens and Hispanic non-citizens is also significantly higher than the rate for natives.
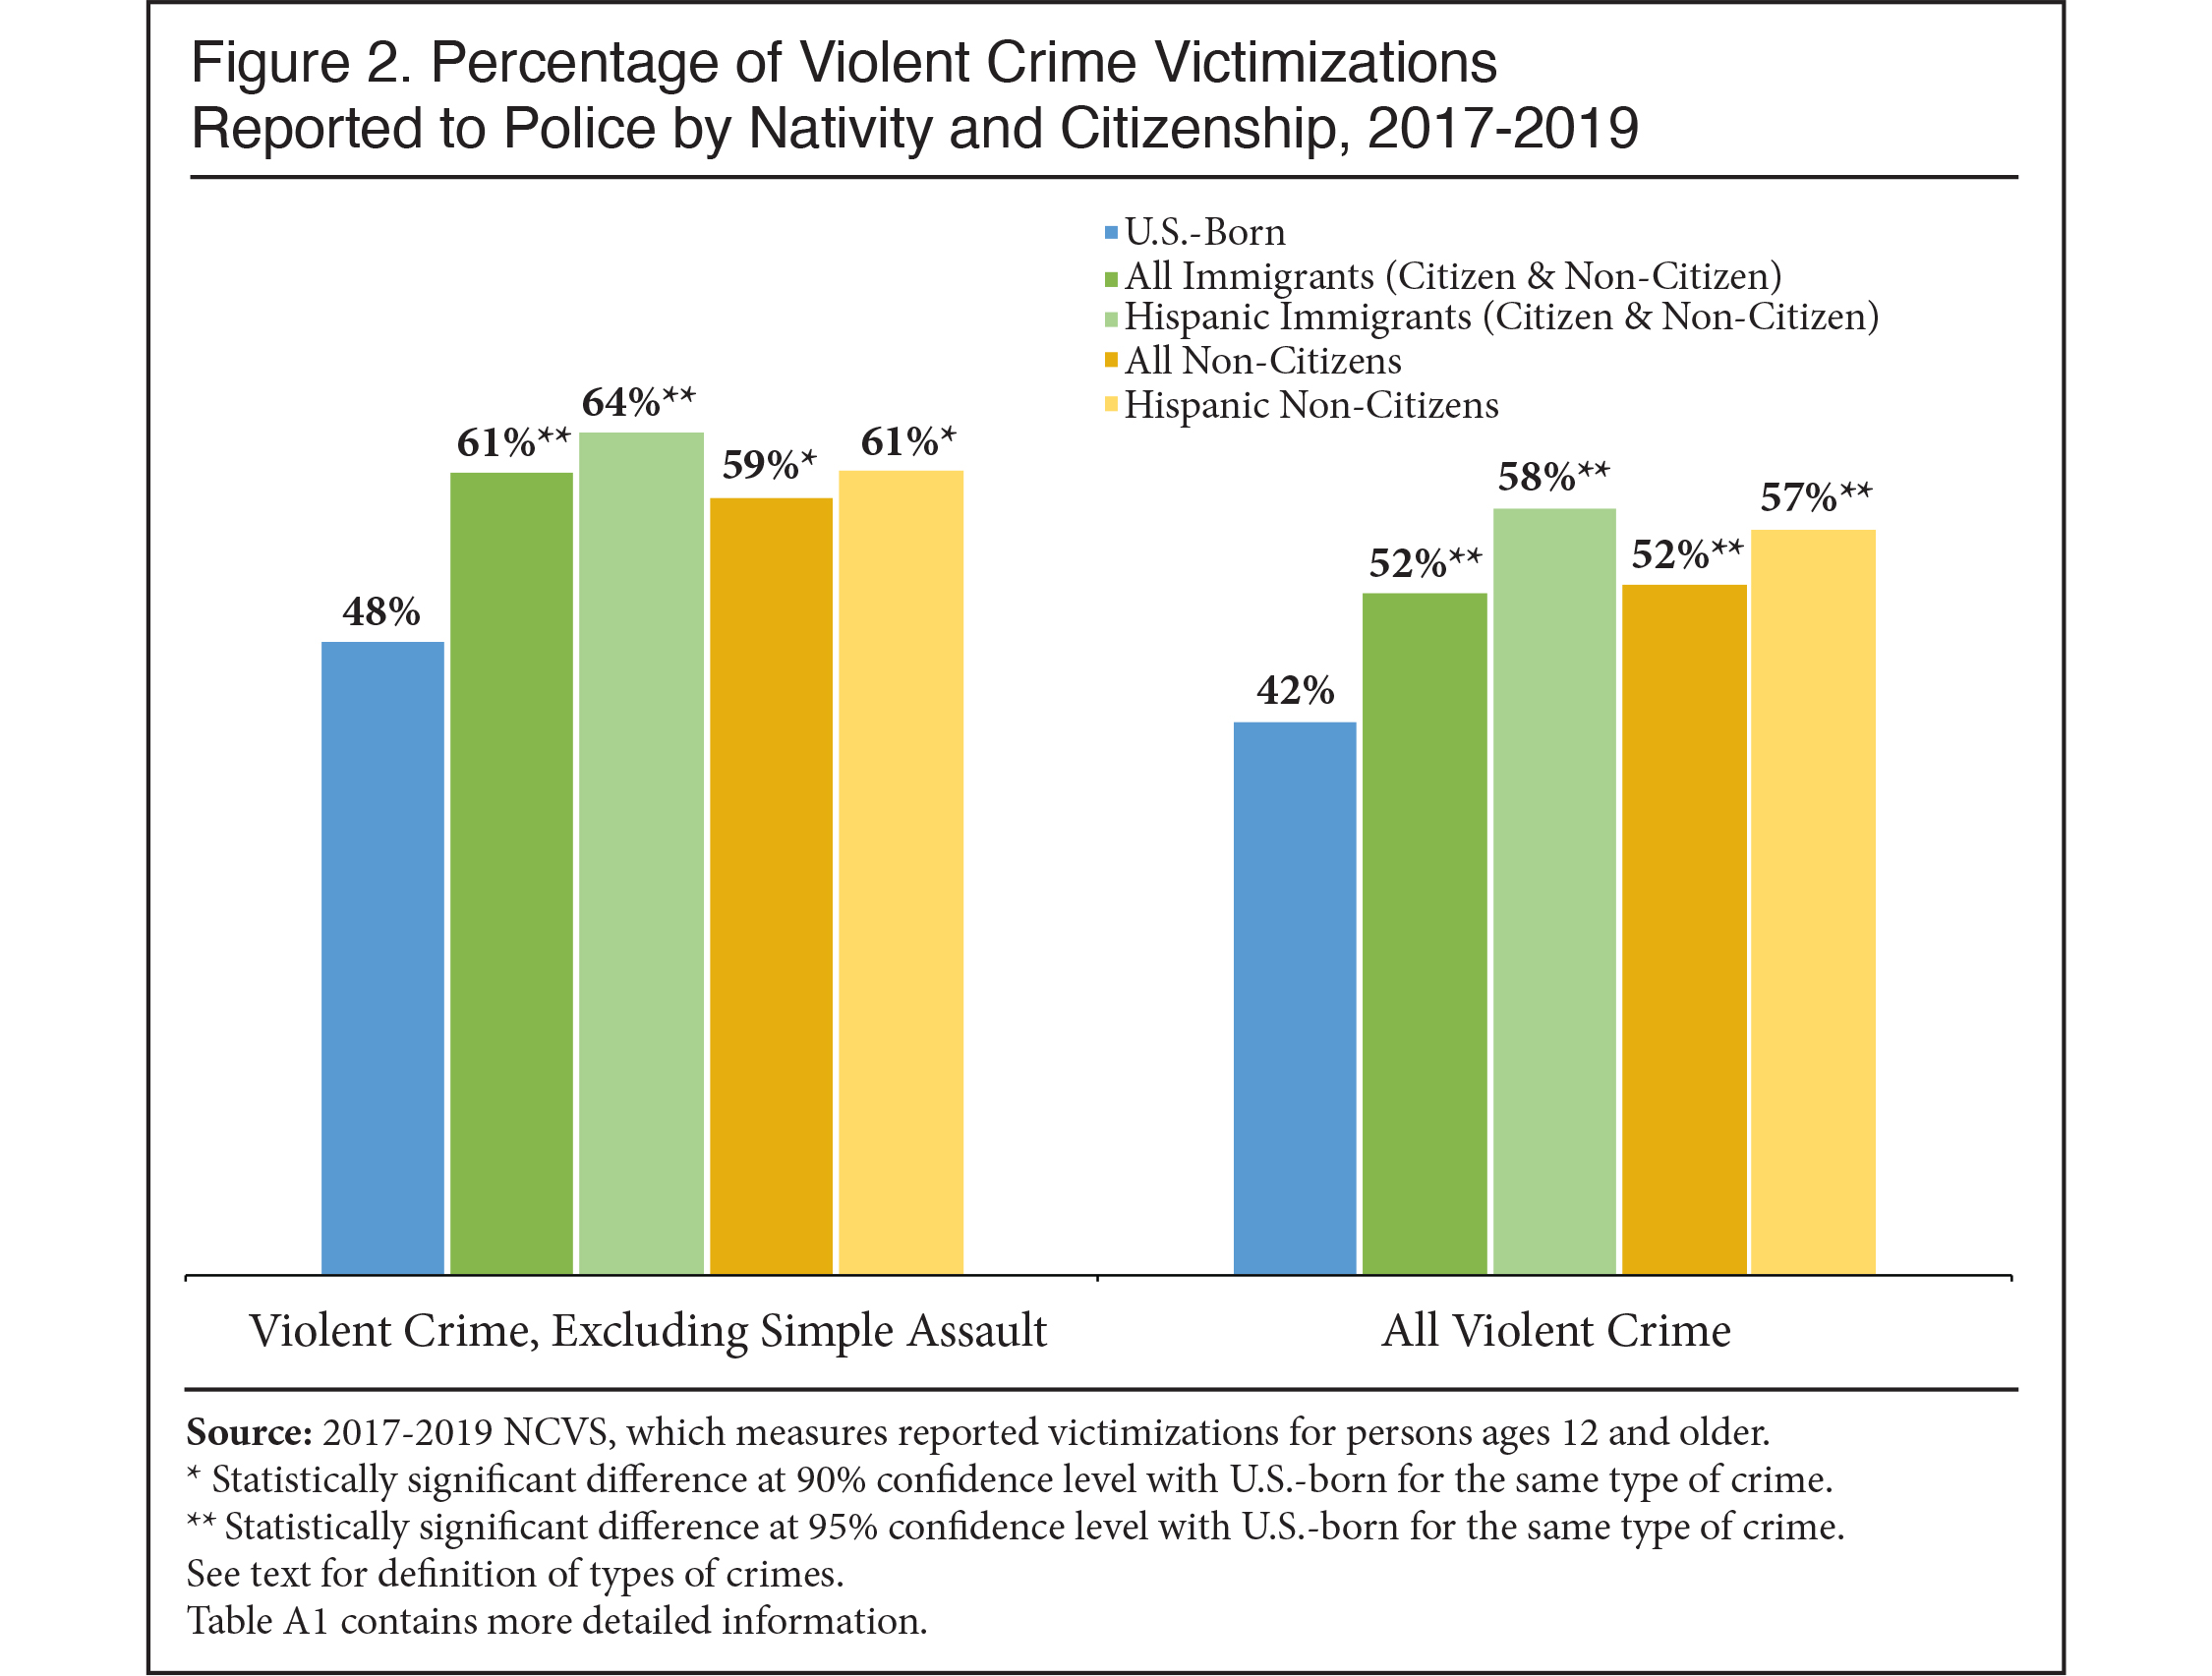 |
The right side of Figure 2 reports all violent crime, including simple assault. Simple assault is the most common type of violence, comprising more than half of all violent victimizations. It also tends to be the least reported and is generally the least serious. Figure 2 shows that when we consider all violent crime, including simple assault, we again see no evidence that immigrant victimizations are less likely to be reported to the police than crimes against the U.S.-born. Violent crimes, broadly defined, against immigrants, Hispanic immigrants, non-citizens, and non-citizen Hispanics are all reported to police at significantly higher rates than crimes against the native-born.
Taken together, Figures 1 and 2 show that, contrary to what is commonly claimed, for serious crimes and violent crimes, foreign-born victimizations are reported to police at the same or even slightly higher rates than victimizations of the U.S.-born. This finding is consistent across different categorizations of immigrants and different sets of crimes.
Most Immigrant and Native Victimizations Are Reported by the Victim
Who Reported the Crimes? The NCVS also asks victims about who reported the crimes to police. Possible responses include the victim, another household member, an official, police at the scene, or someone else. Table 1 shows the survey responses. Of serious crimes reported to police when the victim was U.S.-born, 73 percent were reported to police by the victim, and 10 percent were reported by a member of the victim’s household. Of serious crimes reported to police when the victim was an immigrant, 76 percent of the time the victim reported it and 11 percent of the time a member of the immigrant’s household reported it. For every type of crime, it is typically the victim or a member of the victim’s household who reported it to police, and this is true for both native-born Americans, the foreign-born, and non-citizens.
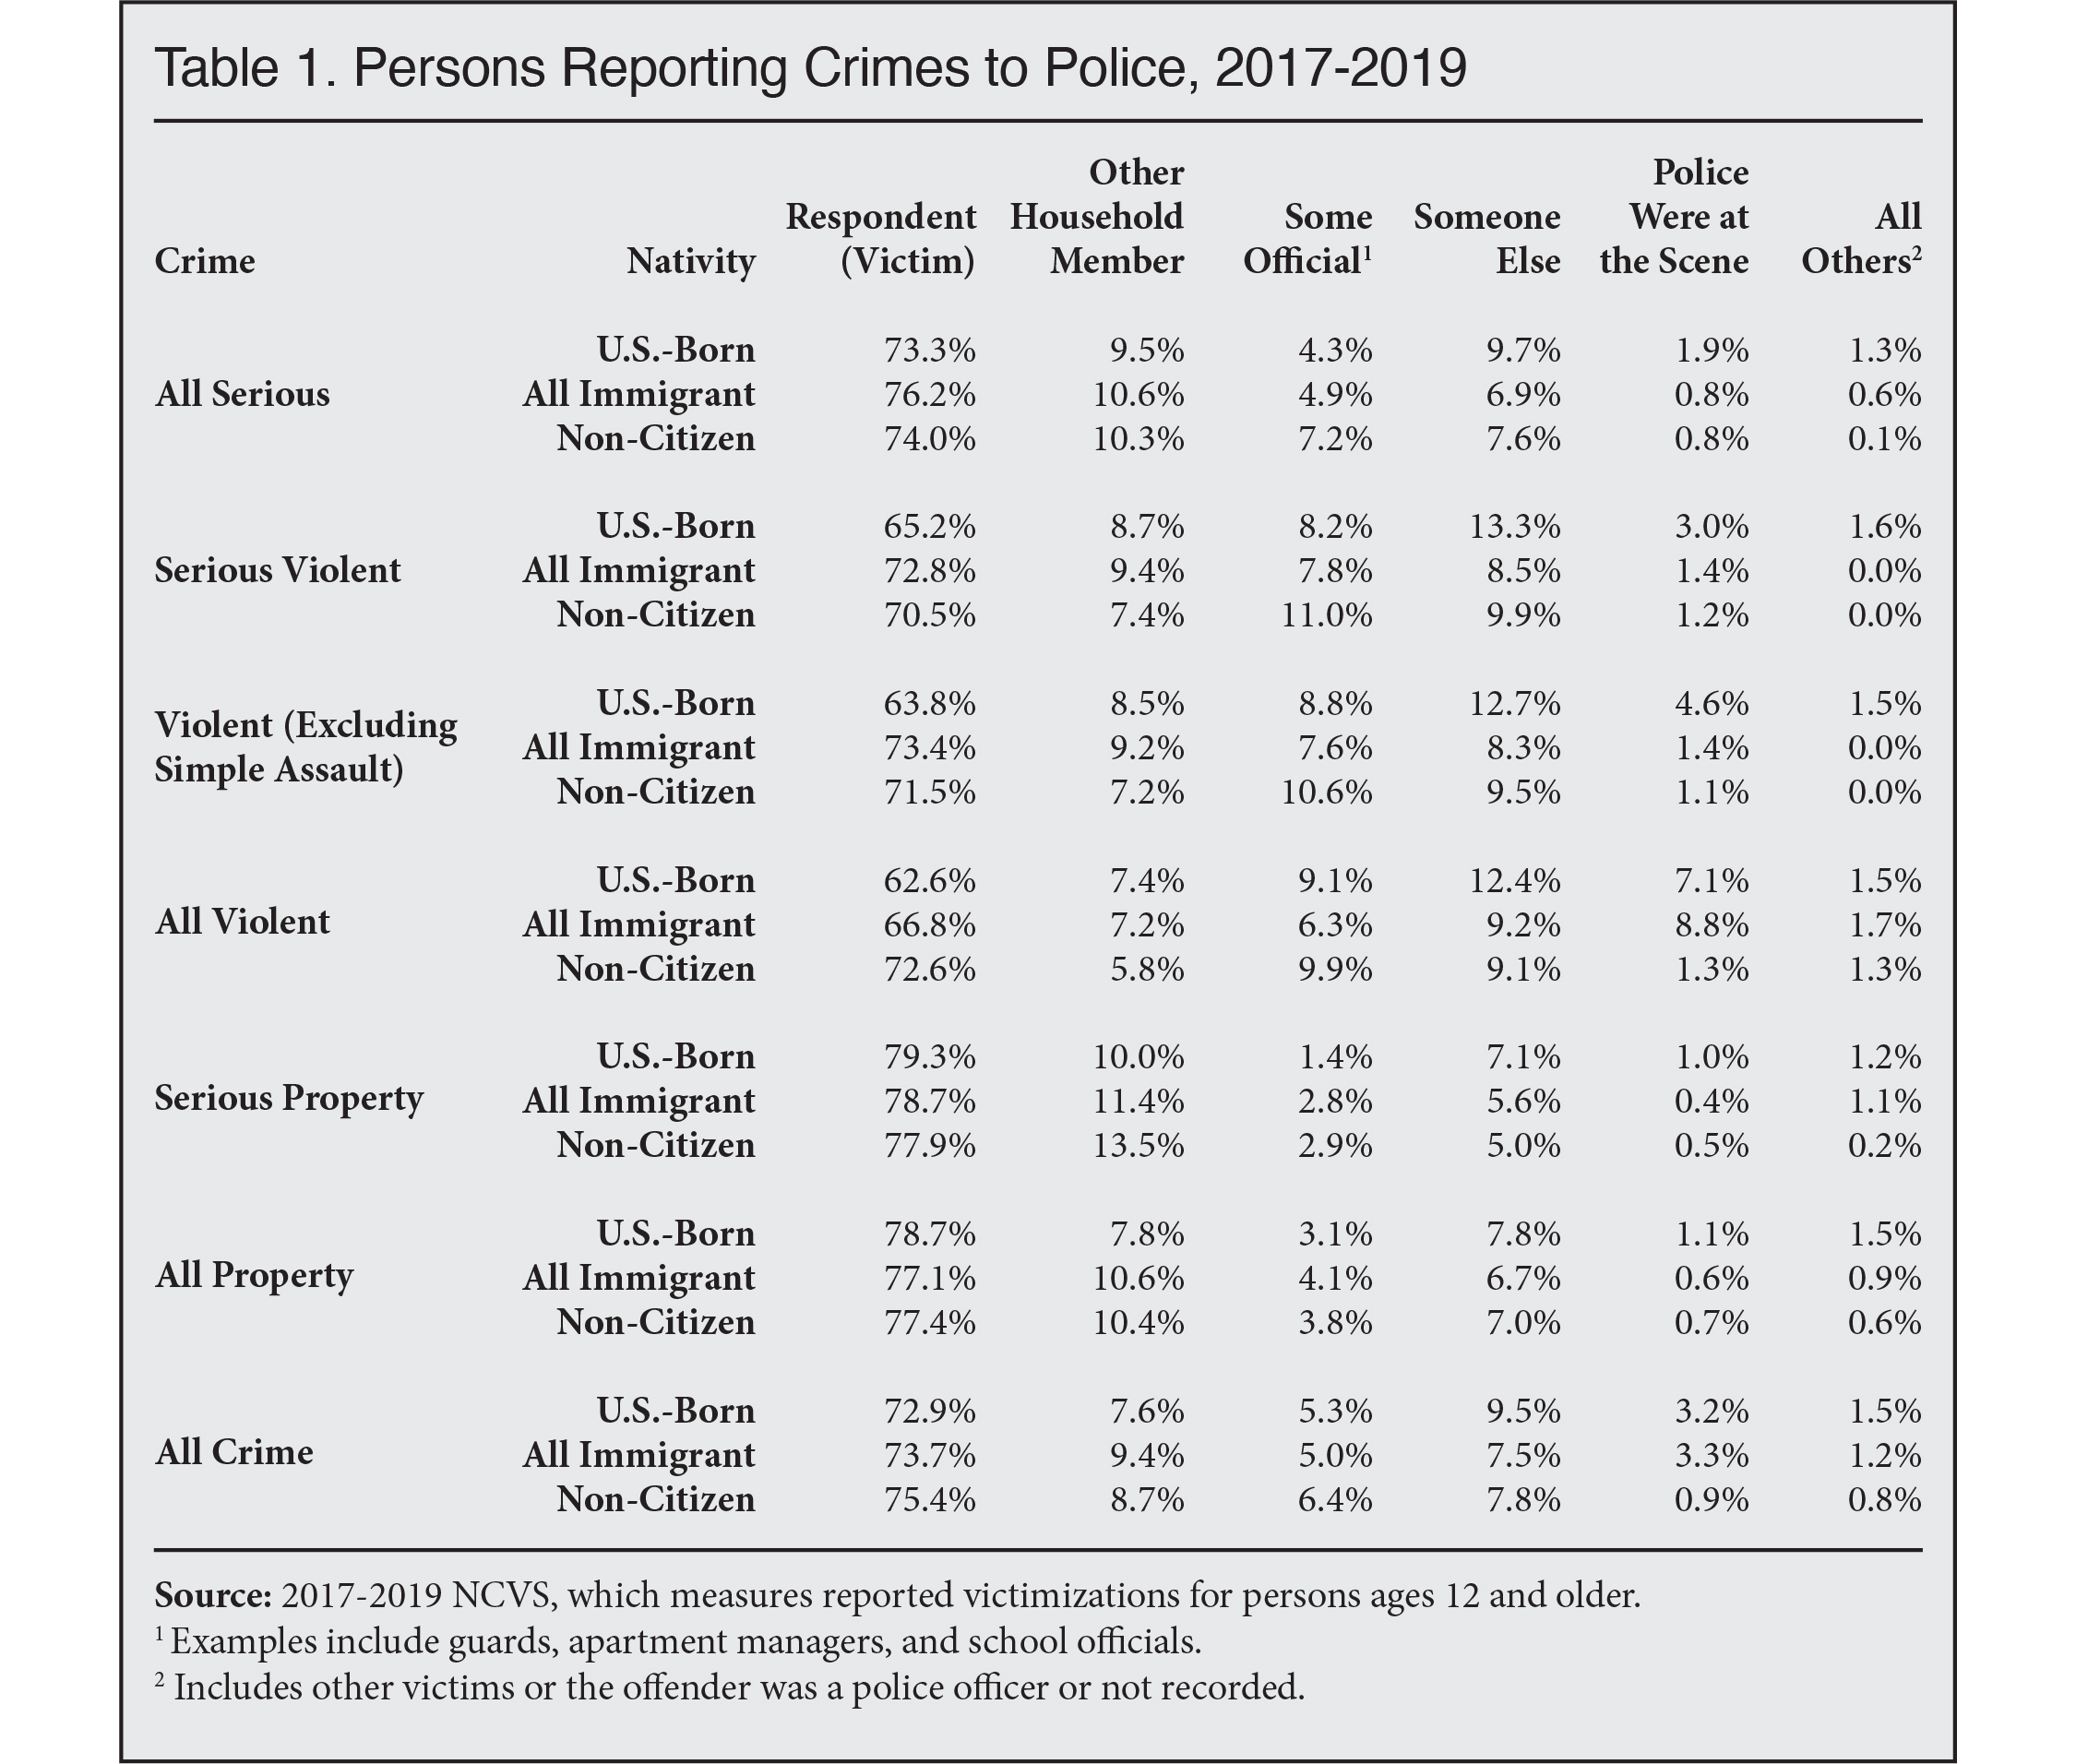 |
The responses shown in Table 1 indicate that the relatively high rates of crime reporting associated with immigrants are not due to someone other than the immigrant victim or a household member reporting the crimes. Immigrant victims are at least as willing as U.S.-born victims to report crimes to police.
Reporting of Violence Against Immigrant and Native-Born Women Is Similar
Violence Against Women. There is a long-standing concern that immigrant women are especially reluctant to report violent crimes, particularly those of a sexual nature or those committed by an intimate partner. The NCVS does identify crimes committed by domestic partners as a subset of violent crime, but the number of female victimizations is relatively small, at least as captured in the NCVS. As a result, the sample of female immigrant victimizations for domestic partners is too small to provide reliable results for reporting of this specific crime. However, we can look at female victimizations for serious crime or serious violent crimes using the survey.
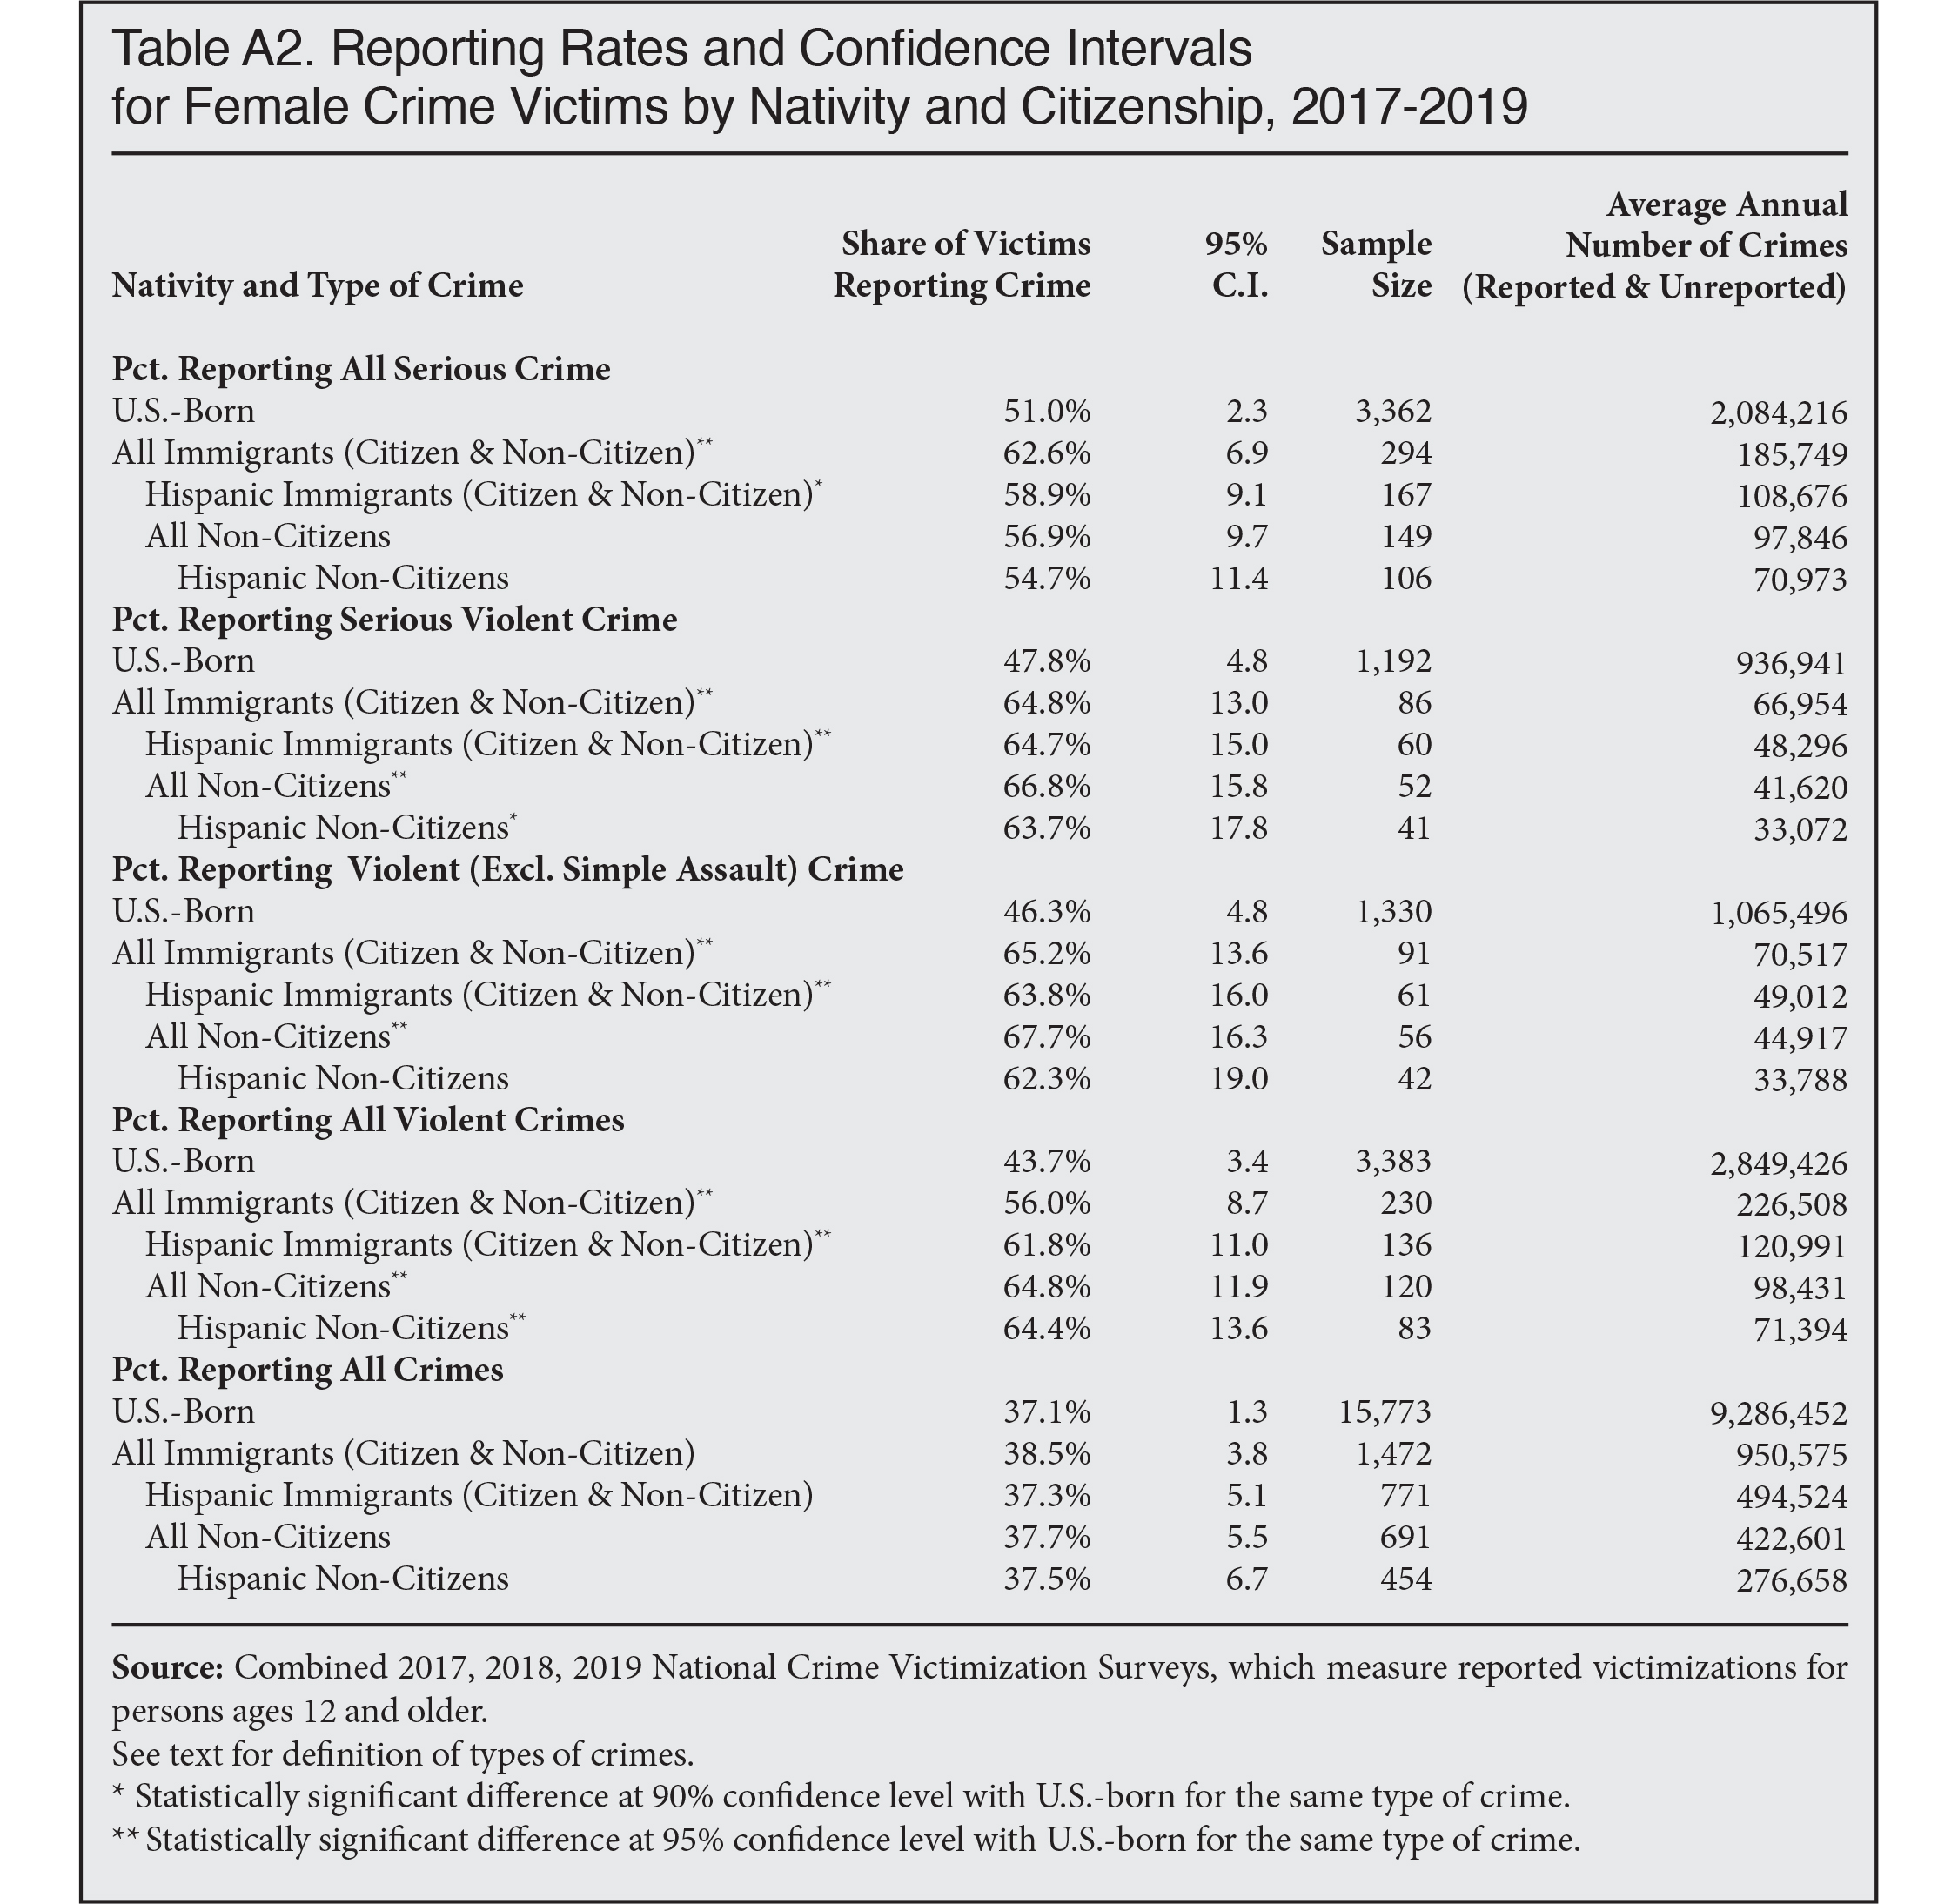
The left side of Figure 3 shows the percentage of serious crimes reported to police when the victim is a woman. Serious crimes against all immigrant women and Hispanic immigrant women are significantly more likely to be reported than those against U.S.-born women.
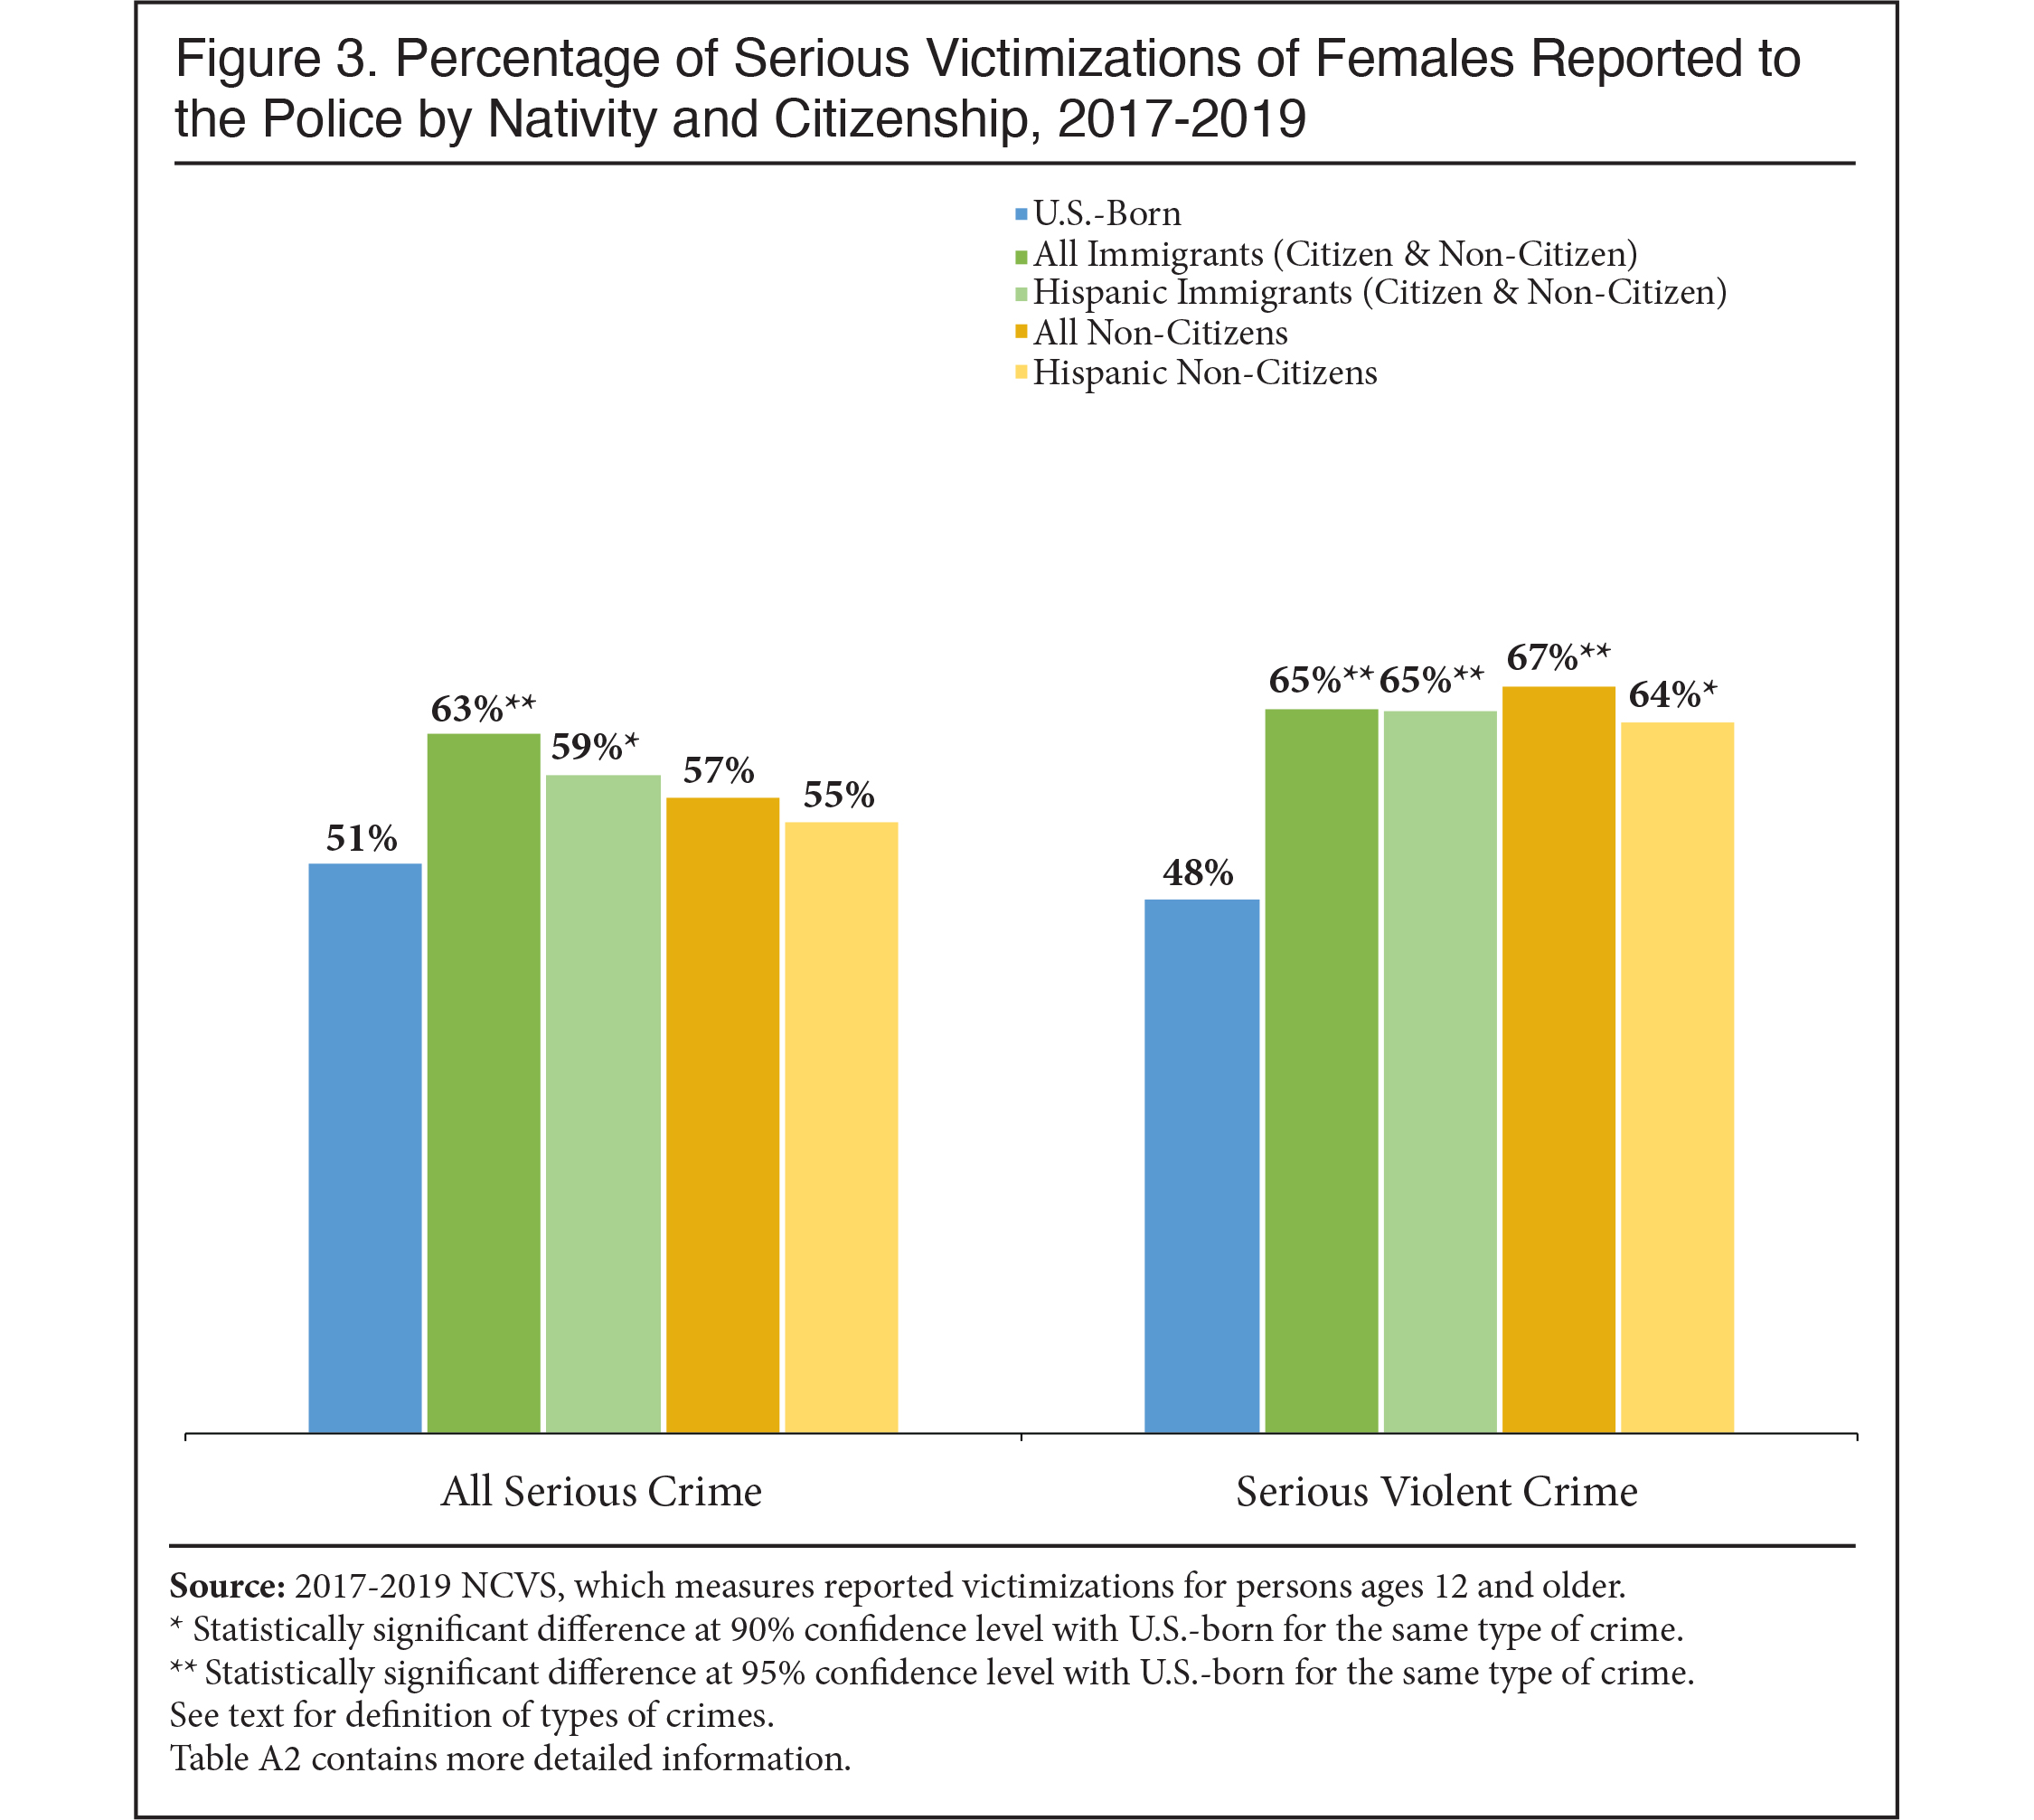 |
As for serious violent crimes, the right side of Figure 3 shows that, relative to U.S.-born women, serious violence against immigrant women (including Hispanics) and against all non-citizens and Hispanic non-citizens is significantly more likely to be reported to police than are serious violent crimes against native-born women. Figure 3 also shows that police are being informed of the larger category of all serious crimes against foreign-born women at higher rates than for native-born women. Table A2 in the Appendix reports additional categories of violence against women as well as sample sizes and confidence intervals. Like Figure 2, Table A2 shows that violent crimes against immigrant women are reported to police at rates that either match or are higher than reporting rates for U.S.-born women.
As with reporting for all crimes, the survey reveals that violence against women is reported primarily by the victim herself or, less frequently, by members of her household, as shown in Table 2. This is true both for immigrant and U.S.-born female victims.
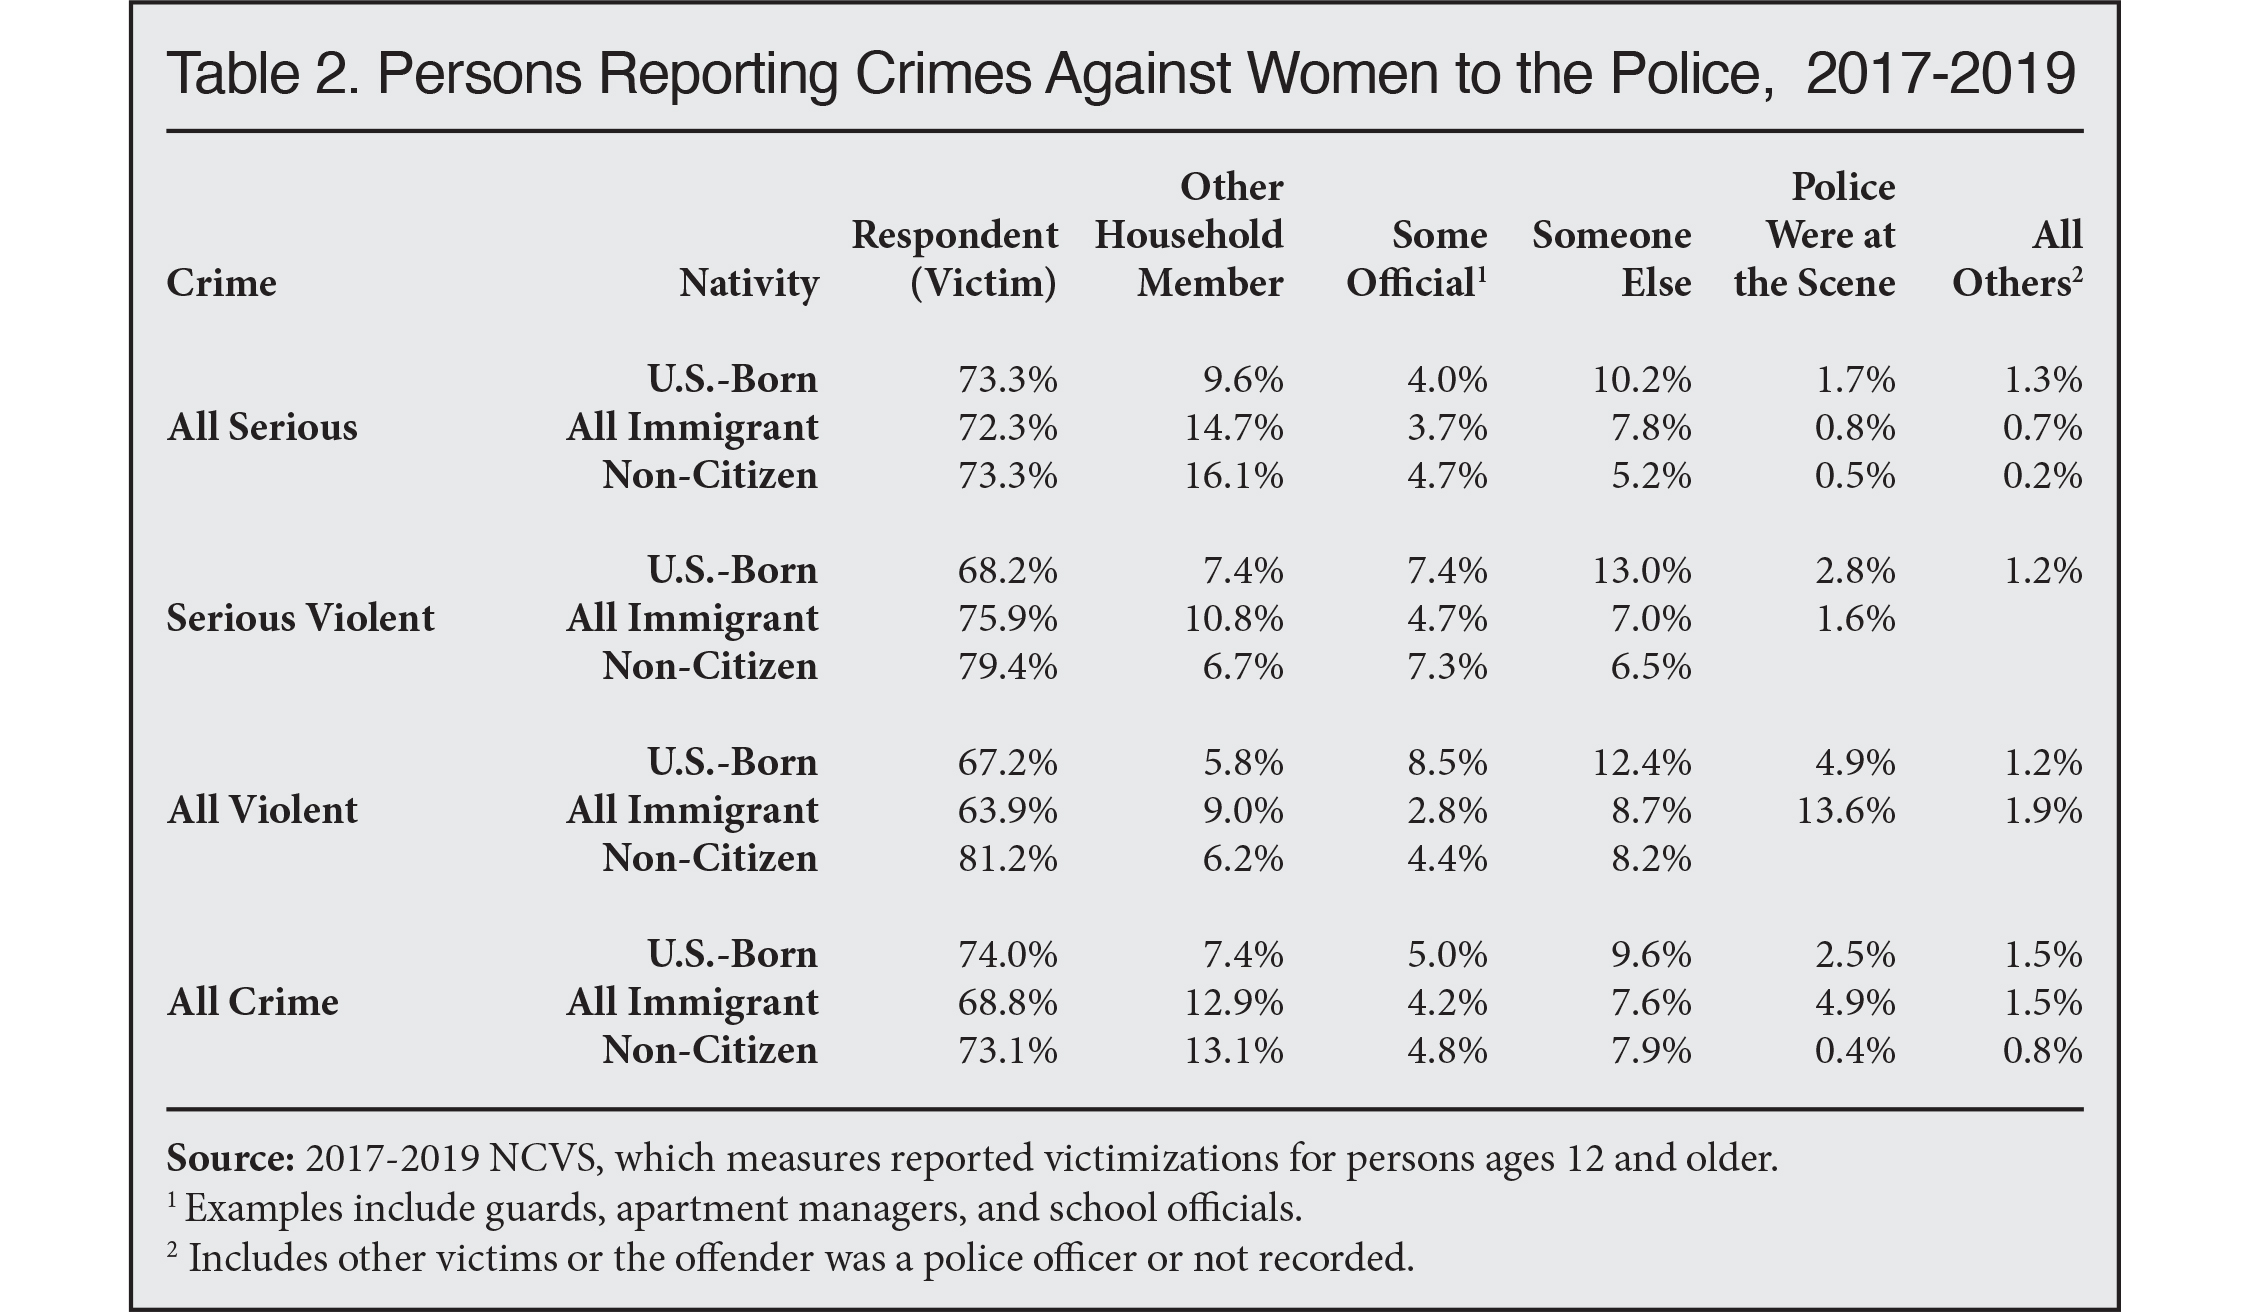 |
This data should not be interpreted to mean that reporting of crime and violence against women, immigrant or native-born, is not an issue of concern. Rather, it shows that assertions that immigrant women in particular are more reluctant to report victimizations than other women are not supported by the NCVS data.
Immigrants and the Native-Born Report Property Crimes at Similar Rates
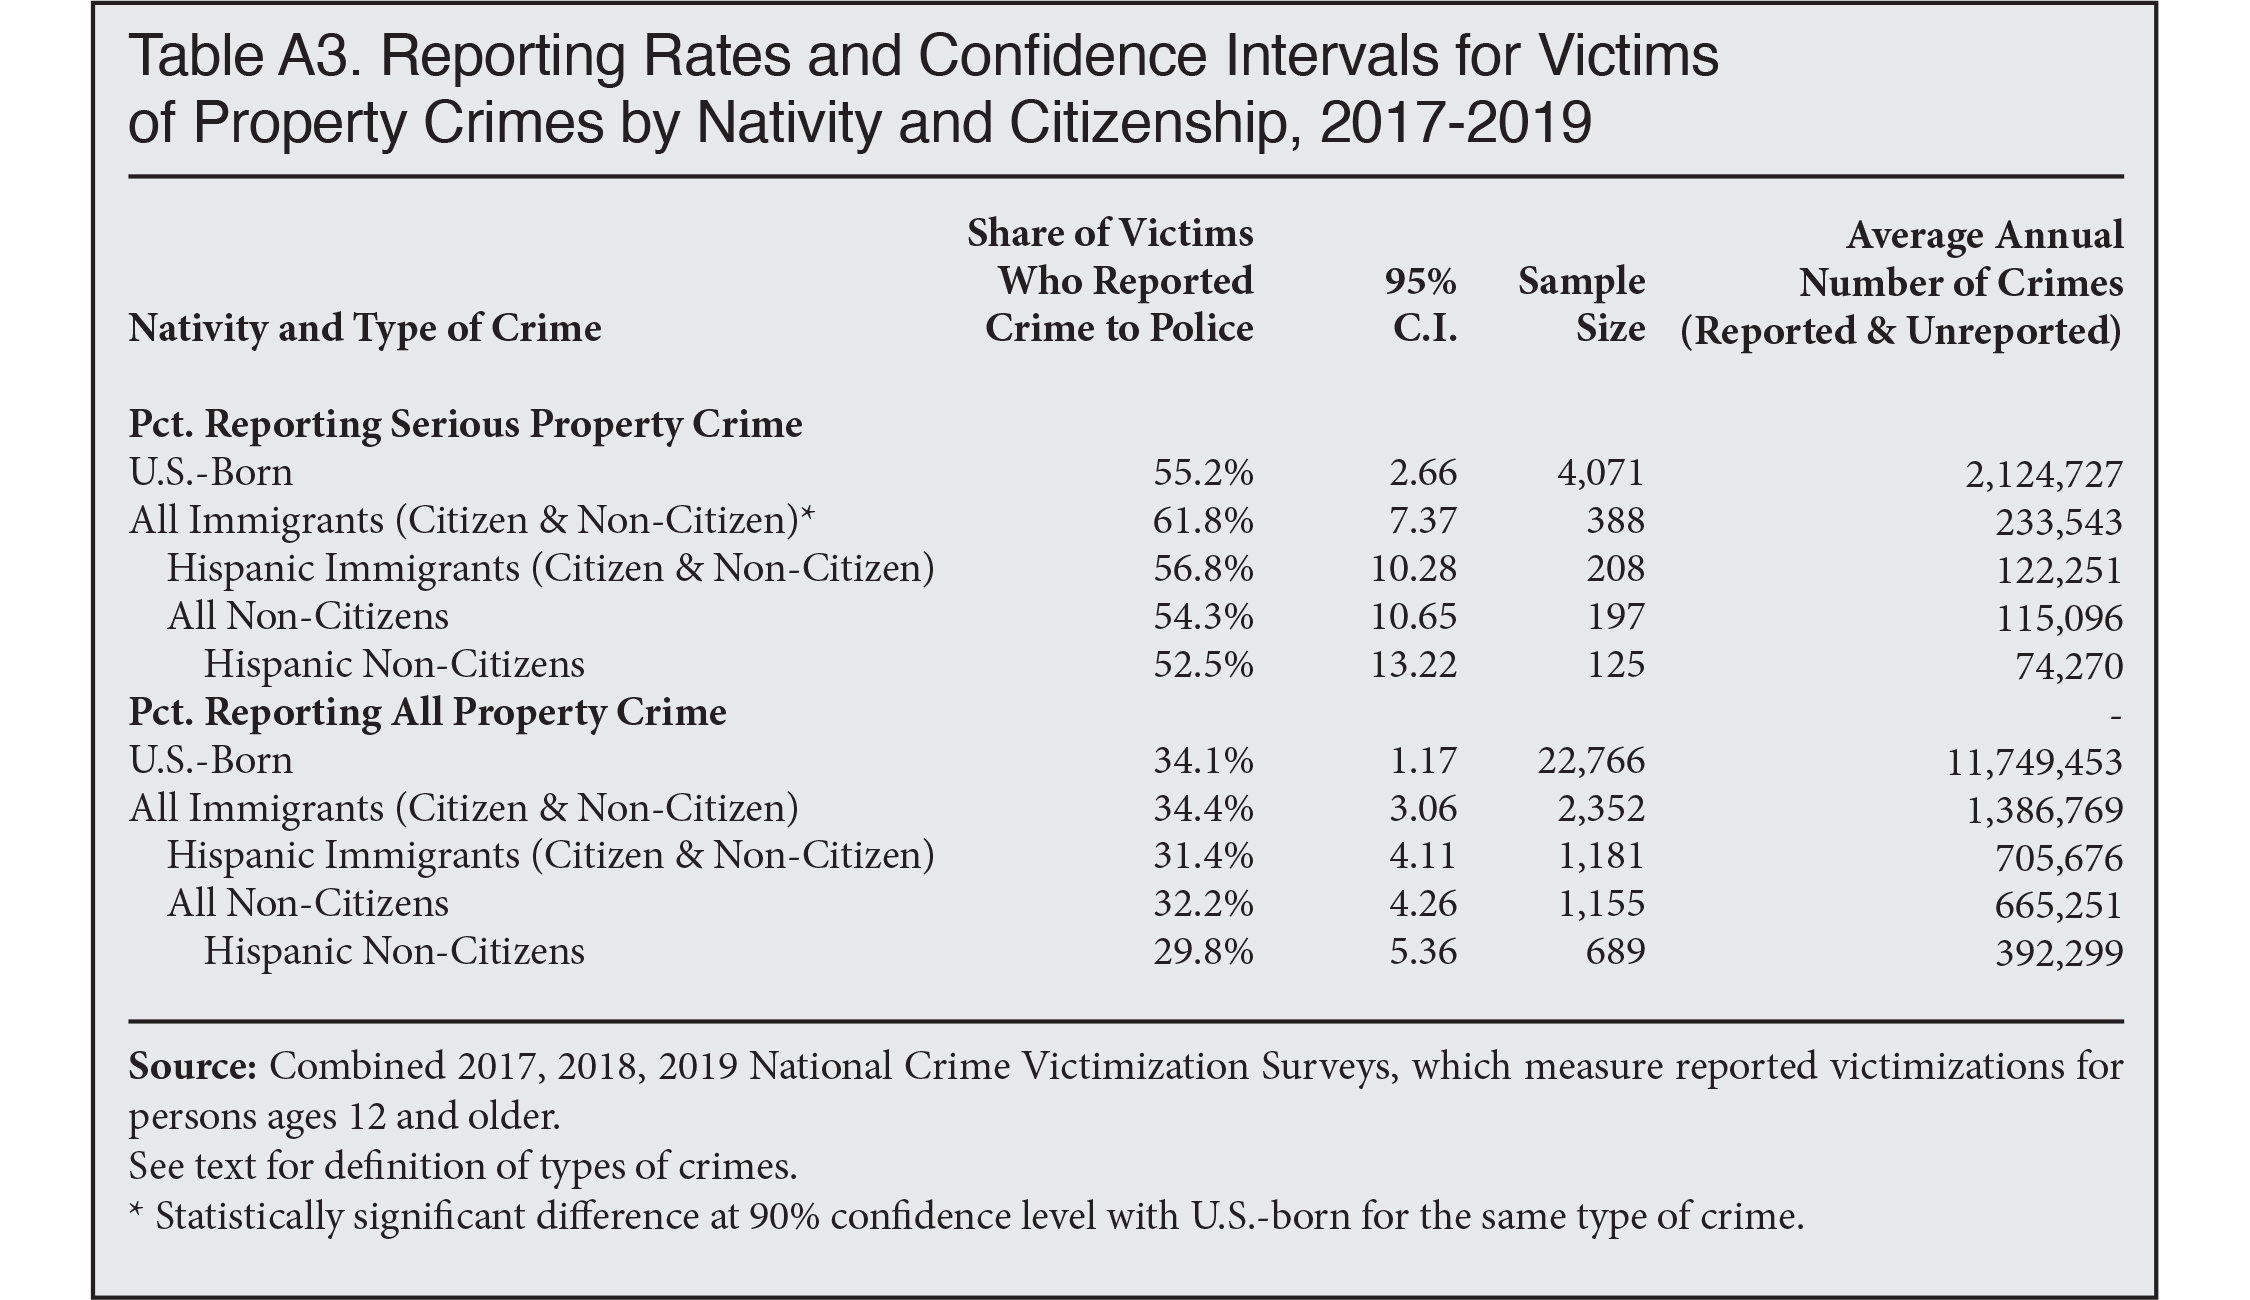
Property Crime. Property crime includes burglary (unlawful or forcible entry involving theft), attempted forced entry, motor vehicle theft (attempted or completed), and thefts of money or property of any amount. Serious property crime includes burglary and completed motor-vehicle theft. Figure 4 illustrates that 62 percent of all serious property crimes against immigrants in the NCVS survey were reported to police, which is higher than the 55 percent of serious property crimes reported against the U.S.-born in the survey. The difference is statistically significant at the 90 percent confidence level.
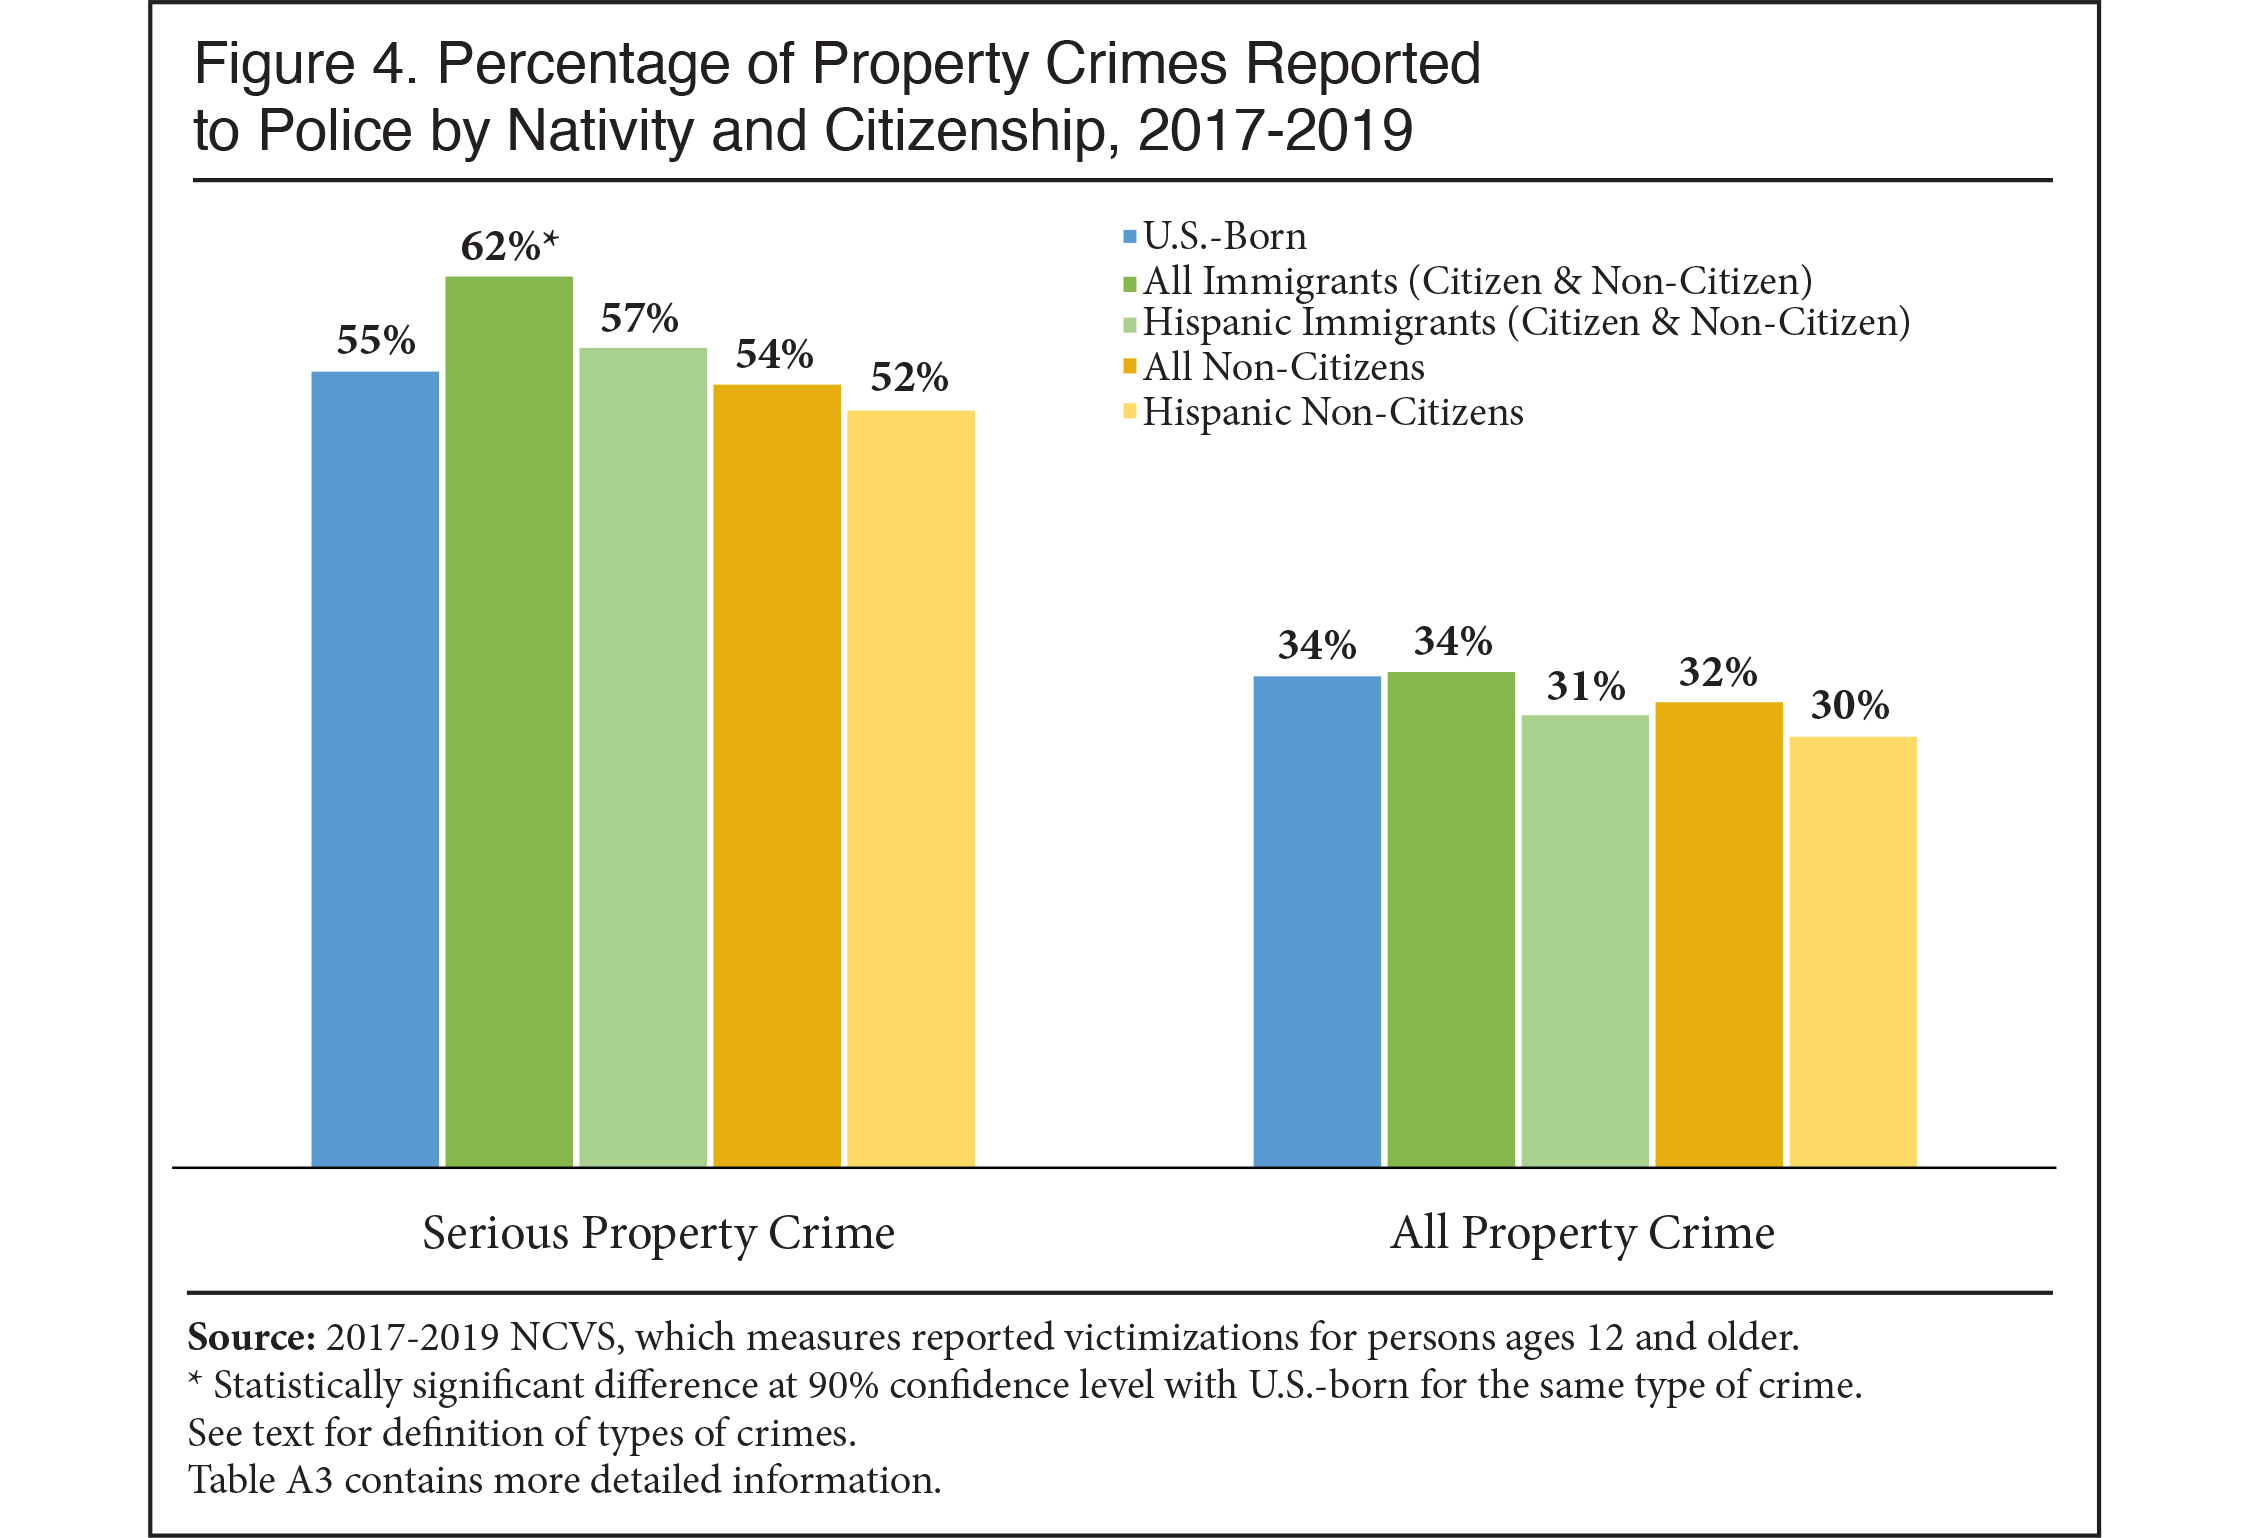 |
Figure 4 also shows that the reporting rates for serious property crimes in the survey were higher for Hispanic immigrants than for the native-born, but the difference is not statistically significant. In fact, none of the other differences in Figure 4 are statistically significant for serious property crimes except when the native-born are compared to all immigrants.
The right side of Figure 4 shows reporting rates for all property crimes, which are the same for immigrants and the native-born — 34 percent. Hispanic immigrants and non-citizens have reporting rates that are slightly lower than natives, but these modest differences are not statistically significant. It is worth noting that the category of all property crimes includes a relatively large number of relatively small incidents. The number of serious property crimes is a relatively small share of the total. Thefts are by far the largest number of property crimes, and about one-quarter of all thefts in the NCVS are valued at less than $50 by the victim. So the relatively low reporting rates shown on the right side of Figure 4 reflect the fact that many victims do not consider the crime to be very serious or worth reporting to police. Still, the survey data shows no meaningful difference between the share of property crimes reported to police when the victim is foreign-born or U.S.-born. Tables A1, A2, and A3 in the Appendix provide additional information about property crimes against immigrants and the U.S.-born.
No Indication of Lower Reporting Rates for Illegal Immigrants
As described above, advocates for illegal immigrants and some officials frequently express concern that illegal immigrants refrain from reporting crimes because they fear that local police will turn them over to federal immigration authorities. This is despite long-standing ICE policy to generally refrain from initiating deportation proceedings in the case of crime victims and witnesses, and despite near-universal policies of local law enforcement agencies not to question victims and witnesses about their immigration status.
The NCVS does not collect information on immigration status, so it is impossible to identify definitively respondents who are illegal aliens. However, it is possible to construct a proxy for this population based on other reliable data. As discussed in the Methods section above, we can be confident that illegal immigrants participate in the NCVS. According to the Census Bureau’s 2018 American Community Survey (ACS), which is often used by researchers to estimate illegal immigration, we find that 46 percent of the non-citizen Hispanics aged 12 and older and non-institutionalized are residing in the country illegally, and that another 23 percent are legal immigrants who live in the same household as an illegal alien.34 (All NCVS respondents are age 12 and older and all are non-institutionalized, so our selected ACS population matches the NCVS.)
If we assume that the shares in the NCVS are roughly similar, then about two-thirds of non-citizen Hispanics in the NCVS (69 percent) are either illegal immigrants themselves or live with an illegal immigrant — meaning that this is the group that would be most likely to refrain from reporting crimes to police according to the “chilling effect” theory. If fear of deportation truly causes illegal immigrants or their family members to be significantly less willing to report victimizations, then the share of crimes against non-citizen Hispanics in the NCVS that were reported to police should be quite low relative to the native-born. But this is not the case.
The results of the NCVS presented in the figures and tables above consistently show that Hispanic non-citizens in the survey reported victimizations to police at rates that match or exceed the crime reporting rates of the U.S.-born — for serious crimes, violent crimes, and all crimes together. In particular, violence against Hispanics who are not citizens tends to be reported to police at rates that are significantly higher than the native-born. The reporting of property crimes against non-citizen Hispanics tends to be somewhat lower than the U.S.-born, but the differences with natives are not statistically significant.
Hispanic non-citizens are not a perfect proxy for illegal immigrants and their family members; about one-fourth of illegal immigrants are not Hispanic, and about one-third of Hispanic non-citizens are neither illegal aliens nor residing with them. Nevertheless, to the best we can measure in the NCVS, there is no indication that crimes against Hispanic illegal immigrants are reported to police at significantly lower rates than the native-born.
Younger Immigrants Report Crimes at Similar Rates as Natives
A number of academic studies over the years also have found that immigrants generally, including non-citizens, are just as likely as the native-born to report crimes to police, but that recently arrived immigrants may be more reluctant to report victimizations to police.35 Unfortunately, we cannot examine the reporting rates of new arrivals directly because, unlike some other government surveys, the NCVS does not ask the foreign-born what year they came to live in the United States.
However, in the same way that the category of Hispanic non-citizens can be used as a proxy for illegal immigrants, an analysis of the reporting rates of these younger immigrant victims could offer insight into whether or not recent arrivals are less likely to report crimes. The Census Bureau’s American Community Survey (ACS) does ask about year of arrival, and it shows that about half of all immigrants who are age 12 to 34 arrived during the previous 10 years. Of non-citizens in particular, the ACS shows that roughly two-thirds of those under age 35 came during the last 10 years.
Table 3 shows that about 54 percent of serious crimes against immigrants under age 35 and 51 percent of serious crimes against the U.S.-born under age 35 were reported to the police. For young non-citizens in this age group, about 50 percent of serious crimes were reported.
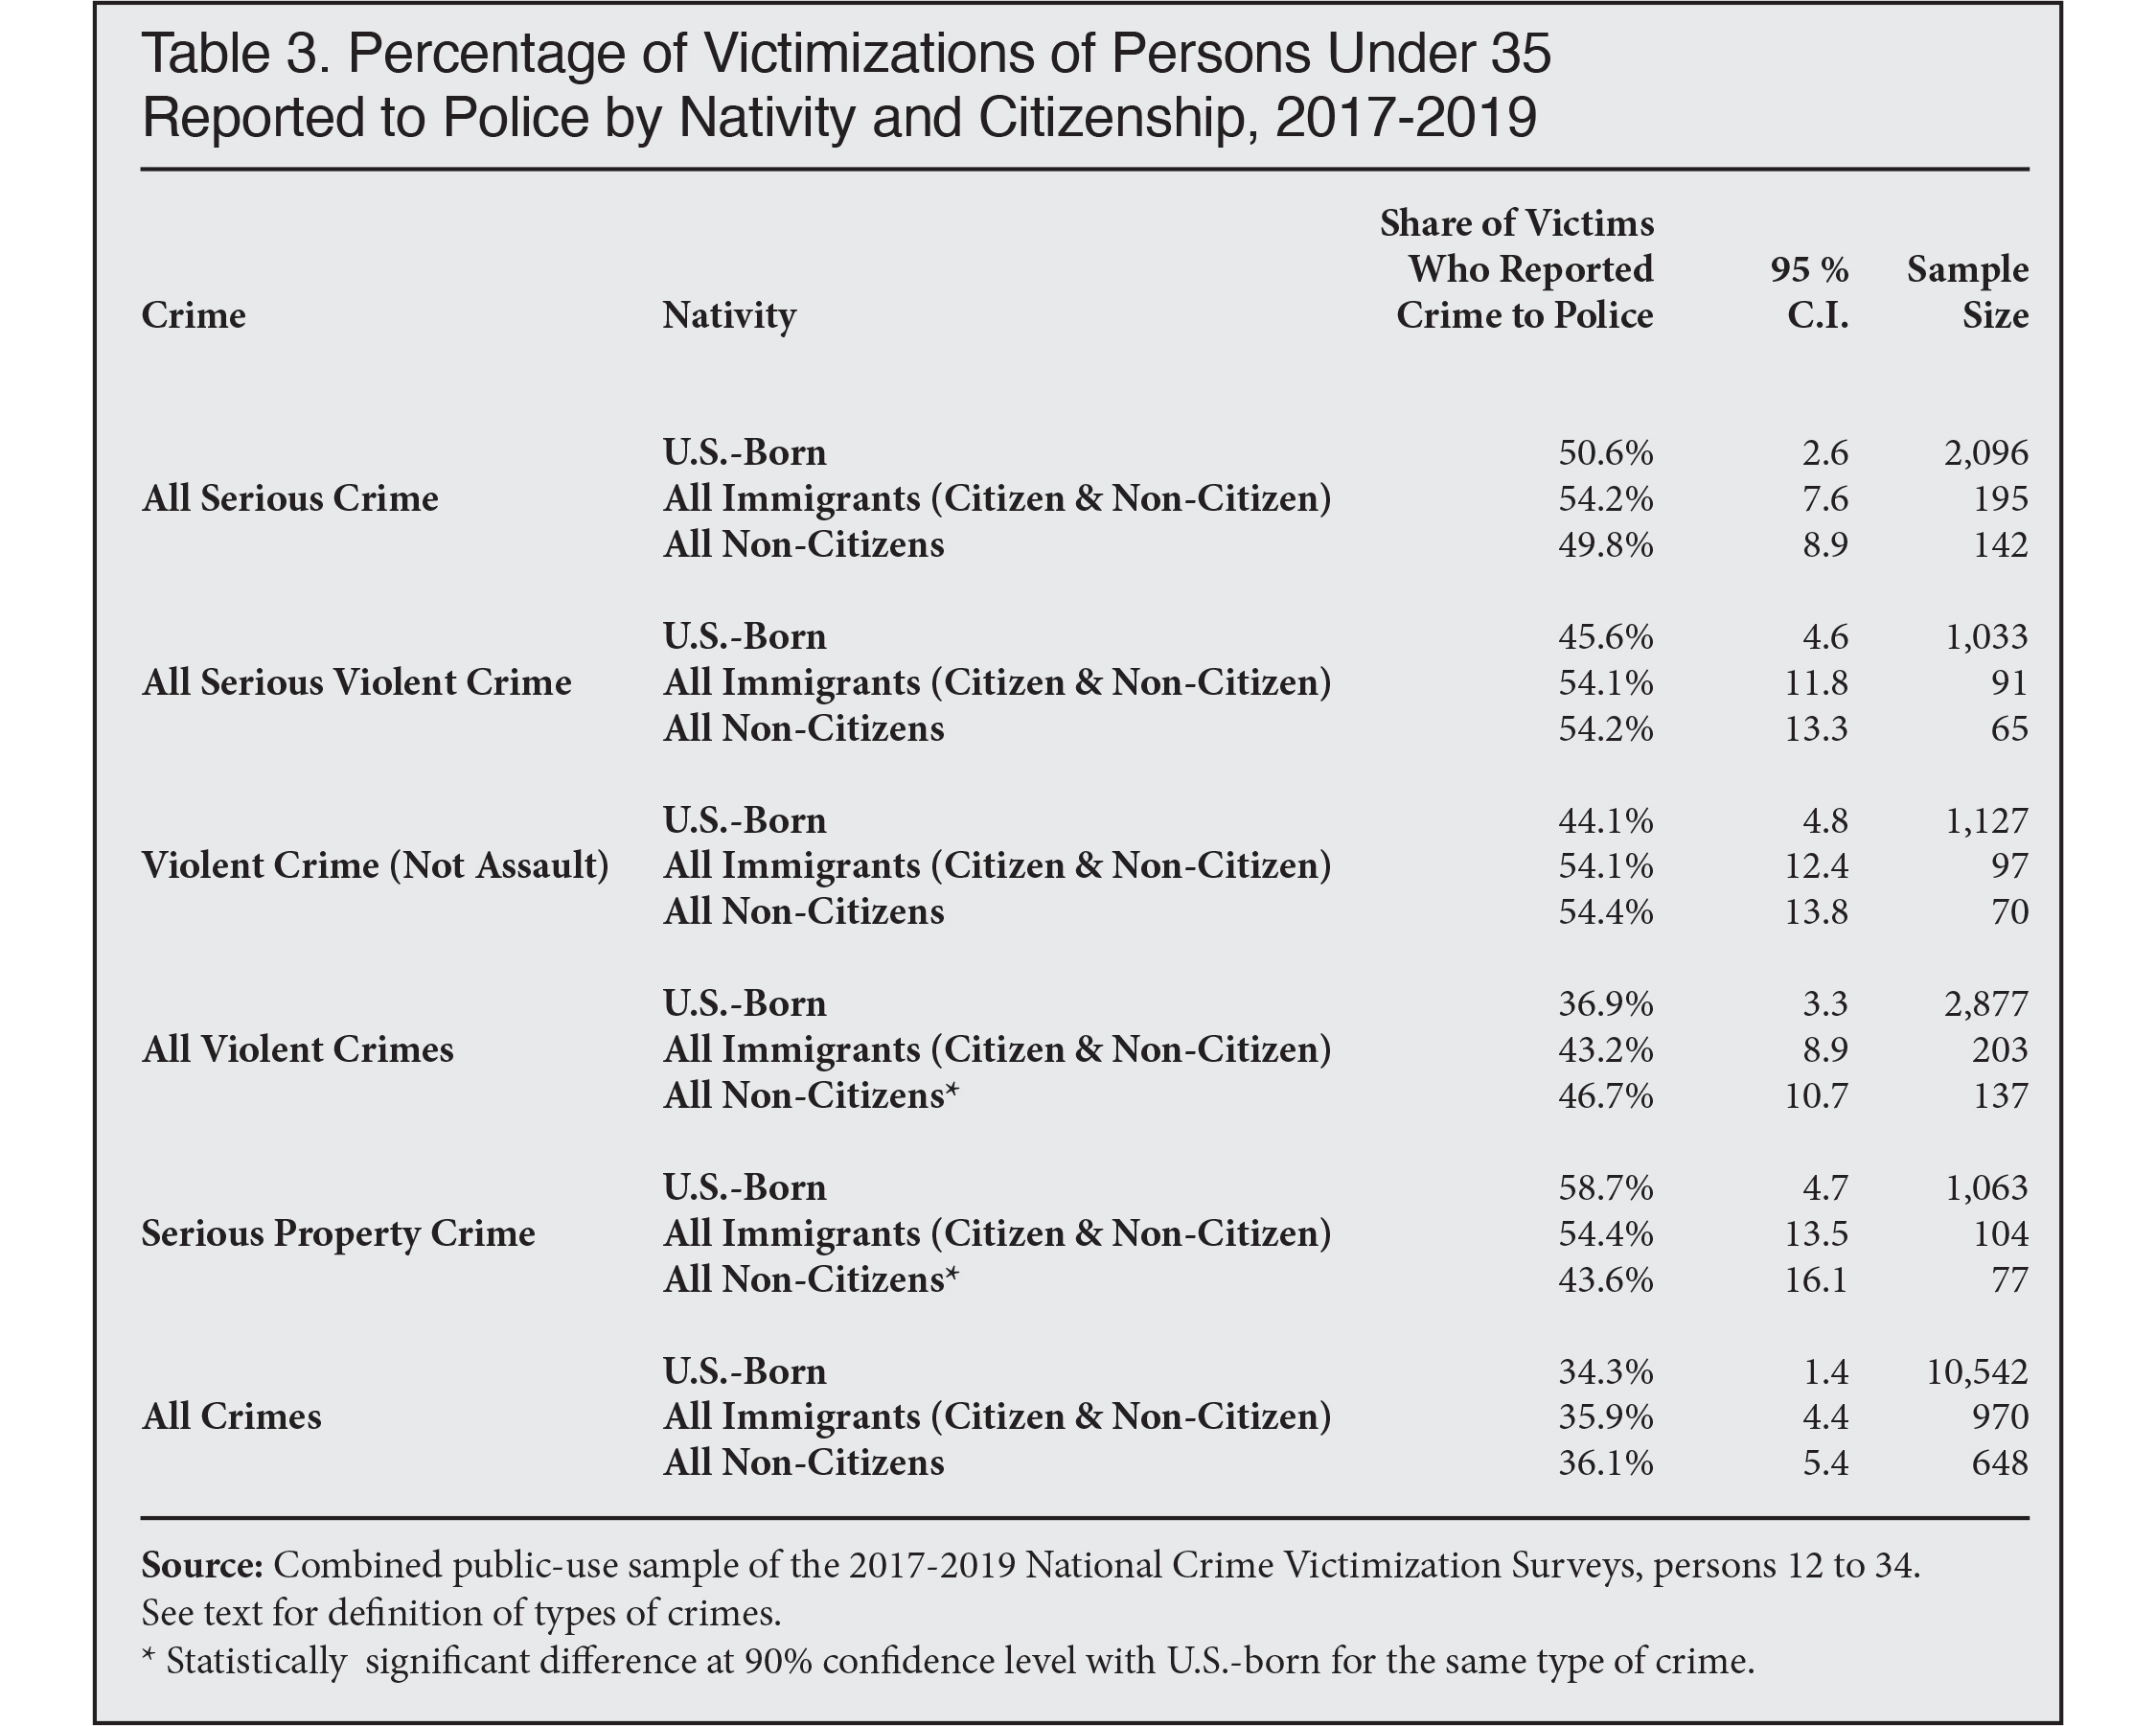 |
As for serious violent crimes against those under age 35, about 54 percent were reported to police when the victim was an immigrant or a non-citizen, compared to 46 percent for native-born victimizations. None of these differences are statistically significant. There are only two statistically significant results in Table 3. First, 47 percent of all violent crimes against young non-citizen victims were reported, which is significantly higher (90 percent confidence level) than the 37 percent share of violent crimes against young natives. Second, the lower reporting rate of crimes against non-citizens (44 percent) relative to the native-born (59 percent) for property crimes is also statistically significant at the 90 percent confidence level. But overall there is no clear evidence in this data for the theory that newcomers (using the proxy of younger immigrants) are less likely to report crimes than the native-born.
Fear of Police, Deportation Not Major Hindrances to Immigrant Crime Reporting
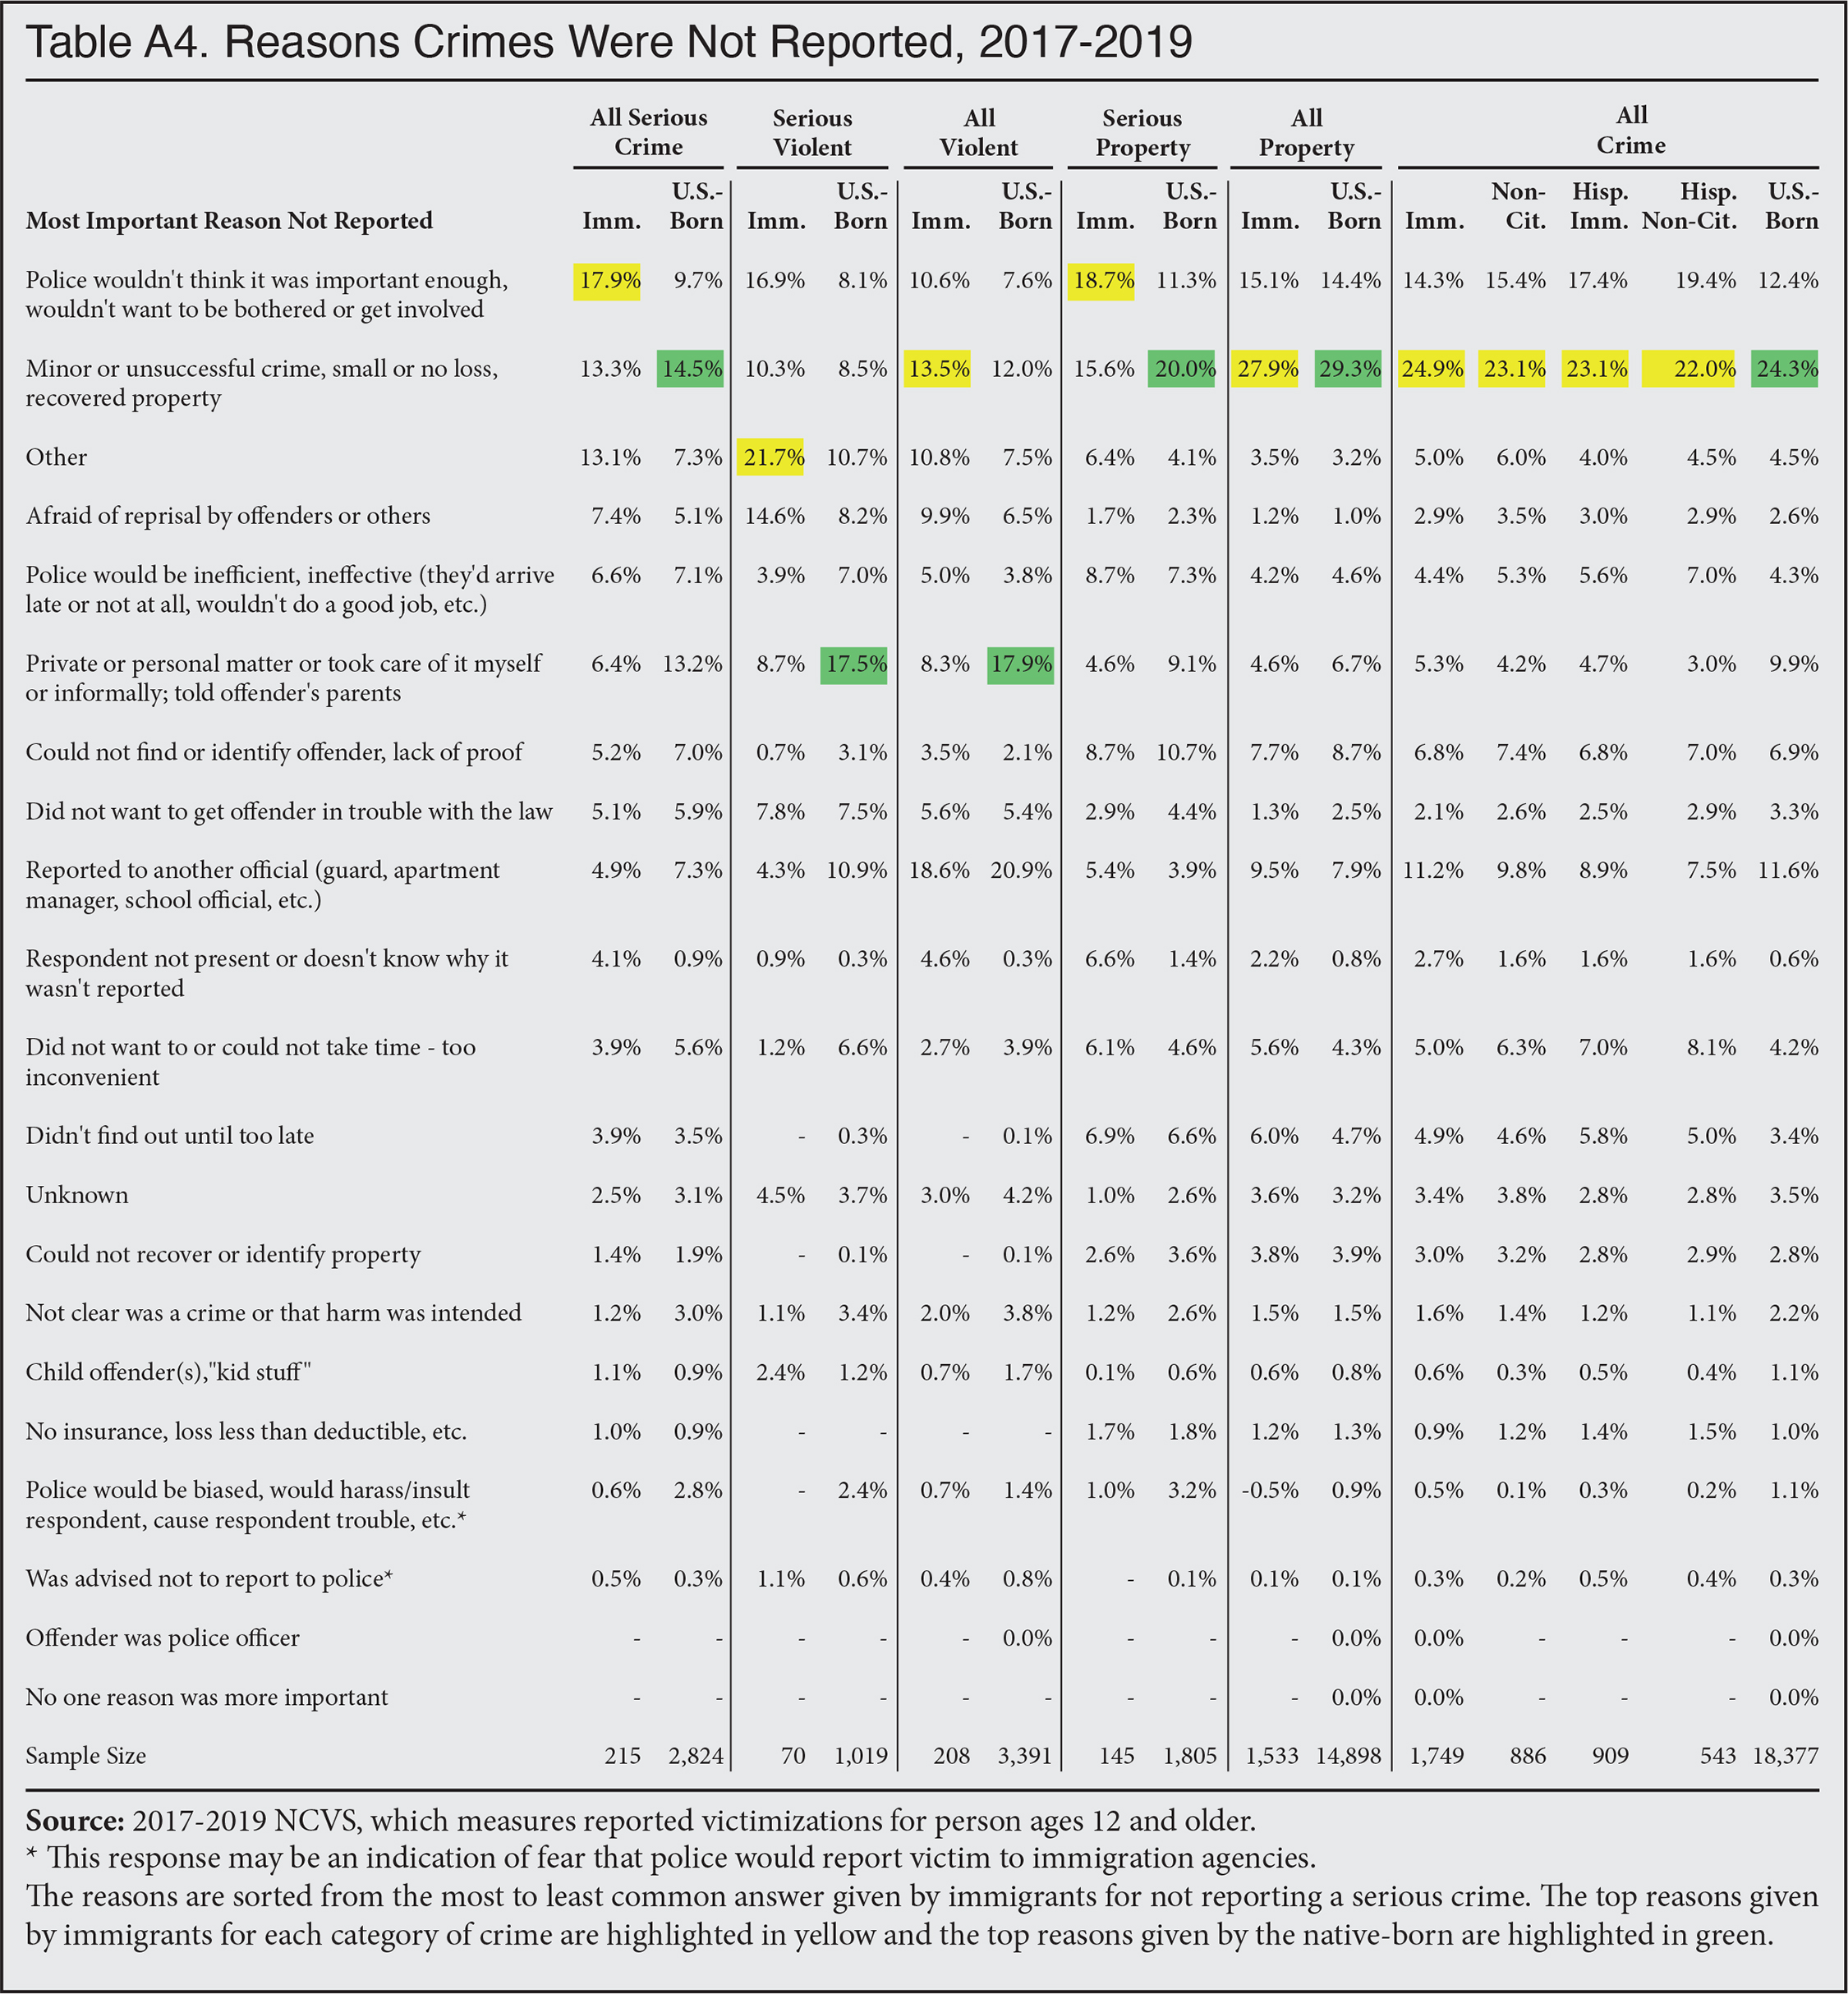
Advocates for sanctuary policies frequently assert that immigrants are wary of reporting victimizations out of concern that local authorities will turn them over to immigration authorities. The responses of immigrant victims in the NCVS who say they did not report crimes do not support this theory. The survey asks those who did not report their victimizations for the most important reason they did not come forward about their victimization. The responses, further broken down according to the category of crime, are shown in Table A4. Because most serious and violent crimes are reported by immigrants, the sample sizes for victims who did not report are very small. Moreover, there are 21 different possible responses in the survey. Therefore, Table A4 shows the responses for all the sub-groups in the immigrant population only in the category of “All Crimes”.
In Table A4, the reasons are sorted from the most to least common answer given by immigrants for not reporting a serious crime. The top reasons given by immigrants for each category of crime are highlighted in yellow and the top reasons given by the native-born are highlighted in green. The top two responses given by immigrant victims of all categories of crimes that were not reported to police were: “Police wouldn’t think it was important enough, wouldn’t want to be bothered or get involved” and that there was a “Minor or unsuccessful crime, small or no loss, recovered property”.
While “fear of deportation” or “fear of referral to immigration authorities” is not included specifically in the list of 21 different possible responses, there are other possible responses that plausibly could include or represent such concerns. The two specific responses most likely to indicate a fear of deportation are “Police would be biased, harass/insult respondent, or cause respondent trouble” and “Was advised not to report to police”. Together, only about 1 percent of immigrant victims gave these two responses as the reason they did not report the crime. This is also the case for non-citizen Hispanics, shown on the right side of Table A4. Fear of immigration enforcement does not seem to be much of a factor when immigrants do not report crimes.
A significant number of immigrant respondents answered “other” in several of the categories of crime. While it is possible that this could indicate fear of deportation, in fact this response is very difficult to interpret and could be unrelated to a fear of deportation.36 First, there is little consistency in the share of immigrants who gave this answer from year to year. Moreover, less than 5 percent of all non-citizen Hispanic victims offered this response for all crimes.37 Finally, academic research on reasons that immigrants may not feel comfortable reporting crimes suggests a number of different factors that also could be represented in the “other” category. These include language barriers, not knowing how to report the crime, fear of authorities based on experiences in their home country, and lack of awareness that a crime had occurred.38
Analysis of Crime Reporting by Region and Community Size
This analysis so far has shown that crimes committed against the foreign-born were not less likely to be reported to the police than crimes against the U.S.-born during the 2017-2019 time period, which is generally considered to have been a time of relatively robust immigration enforcement, assisted by cooperation with local law enforcement agencies. It does not directly answer the related and much-debated question of whether local policies and practices of police engagement with federal immigration enforcement suppress crime reporting by immigrants in those communities, a claim that is routinely asserted by advocates for sanctuary policies. Because the NCVS includes basic information on victim responses according to broad geographic region and community size, it is possible to do a rudimentary examination of this question. We can compare crime reporting rates between large regions of the country that are generally more likely to have law enforcement agencies that routinely engage with ICE and those that have more sanctuary jurisdictions. In addition, we can compare reporting rates in larger and smaller U.S. communities.
Variation in Crime Reporting Across Regions Is Generally Not Significant
While most state and local law enforcement agencies routinely cooperate and engage with federal immigration authorities, there are dozens of jurisdictions around the country that have adopted laws, ordinances, or other types of sanctuary policies that limit such cooperation in a variety of ways. A few jurisdictions, such as San Francisco and New York City, have had sanctuary policies for many years (at least since the 1990s), although the majority of the roughly 300 non-cooperation policies were established more recently, after a new local-federal criminal information-sharing program known as Secure Communities was fully implemented in 2012.
In response to the growing movement to adopt sanctuary policies, several states, including Texas, Florida, Tennessee, and Indiana, enacted laws to require all law enforcement agencies in the state to cooperate with ICE. In addition, 146 law enforcement agencies around the country have joined ICE’s 287(g) partnership program, established by Congress to enable agencies to voluntarily participate in immigration enforcement.39
The Center for Immigration Studies monitors the adoption and reversal of sanctuary, anti-sanctuary, and other engagement policies nationwide, enabling us to identify the regions of the country where these policies might affect crime reporting by immigrants.40
Unfortunately, the level of specificity of geographic locations of NCVS respondents is not as detailed as the information available on sanctuary and ICE engagement policies. The NCVS does not provide details on the geographic locations of the respondents beyond the same four broad geographic divisions used by the Census Bureau: Northeast, Midwest, South, and West. Individual states or cities are not identified in the survey. Even if they were, there would not be enough immigrant respondents in the sample to allow for reliable analysis of crime reporting rates in most states, and certainly not for localities, even specific large cities.
While there are jurisdictions with sanctuary policies in all four broad regions of the country, the greatest concentrations of these are in the West and the Northeast. Of 11 states with sanctuary laws, five are in the West (California, Colorado, Oregon, Washington, and New Mexico), five are in the Northeast (Massachusetts, New Jersey, New York, Vermont, and Connecticut), and one is in the Midwest (Illinois). None are in the South, which is the region with the most state anti-sanctuary laws and 287(g) jurisdictions. The Midwest has one very large sanctuary jurisdiction (the state of Illinois and especially Chicago and Cook County within it), but also includes large non-sanctuary states such as Ohio, Indiana, and Missouri, and states with a patchwork of policies, like Wisconsin and Michigan.
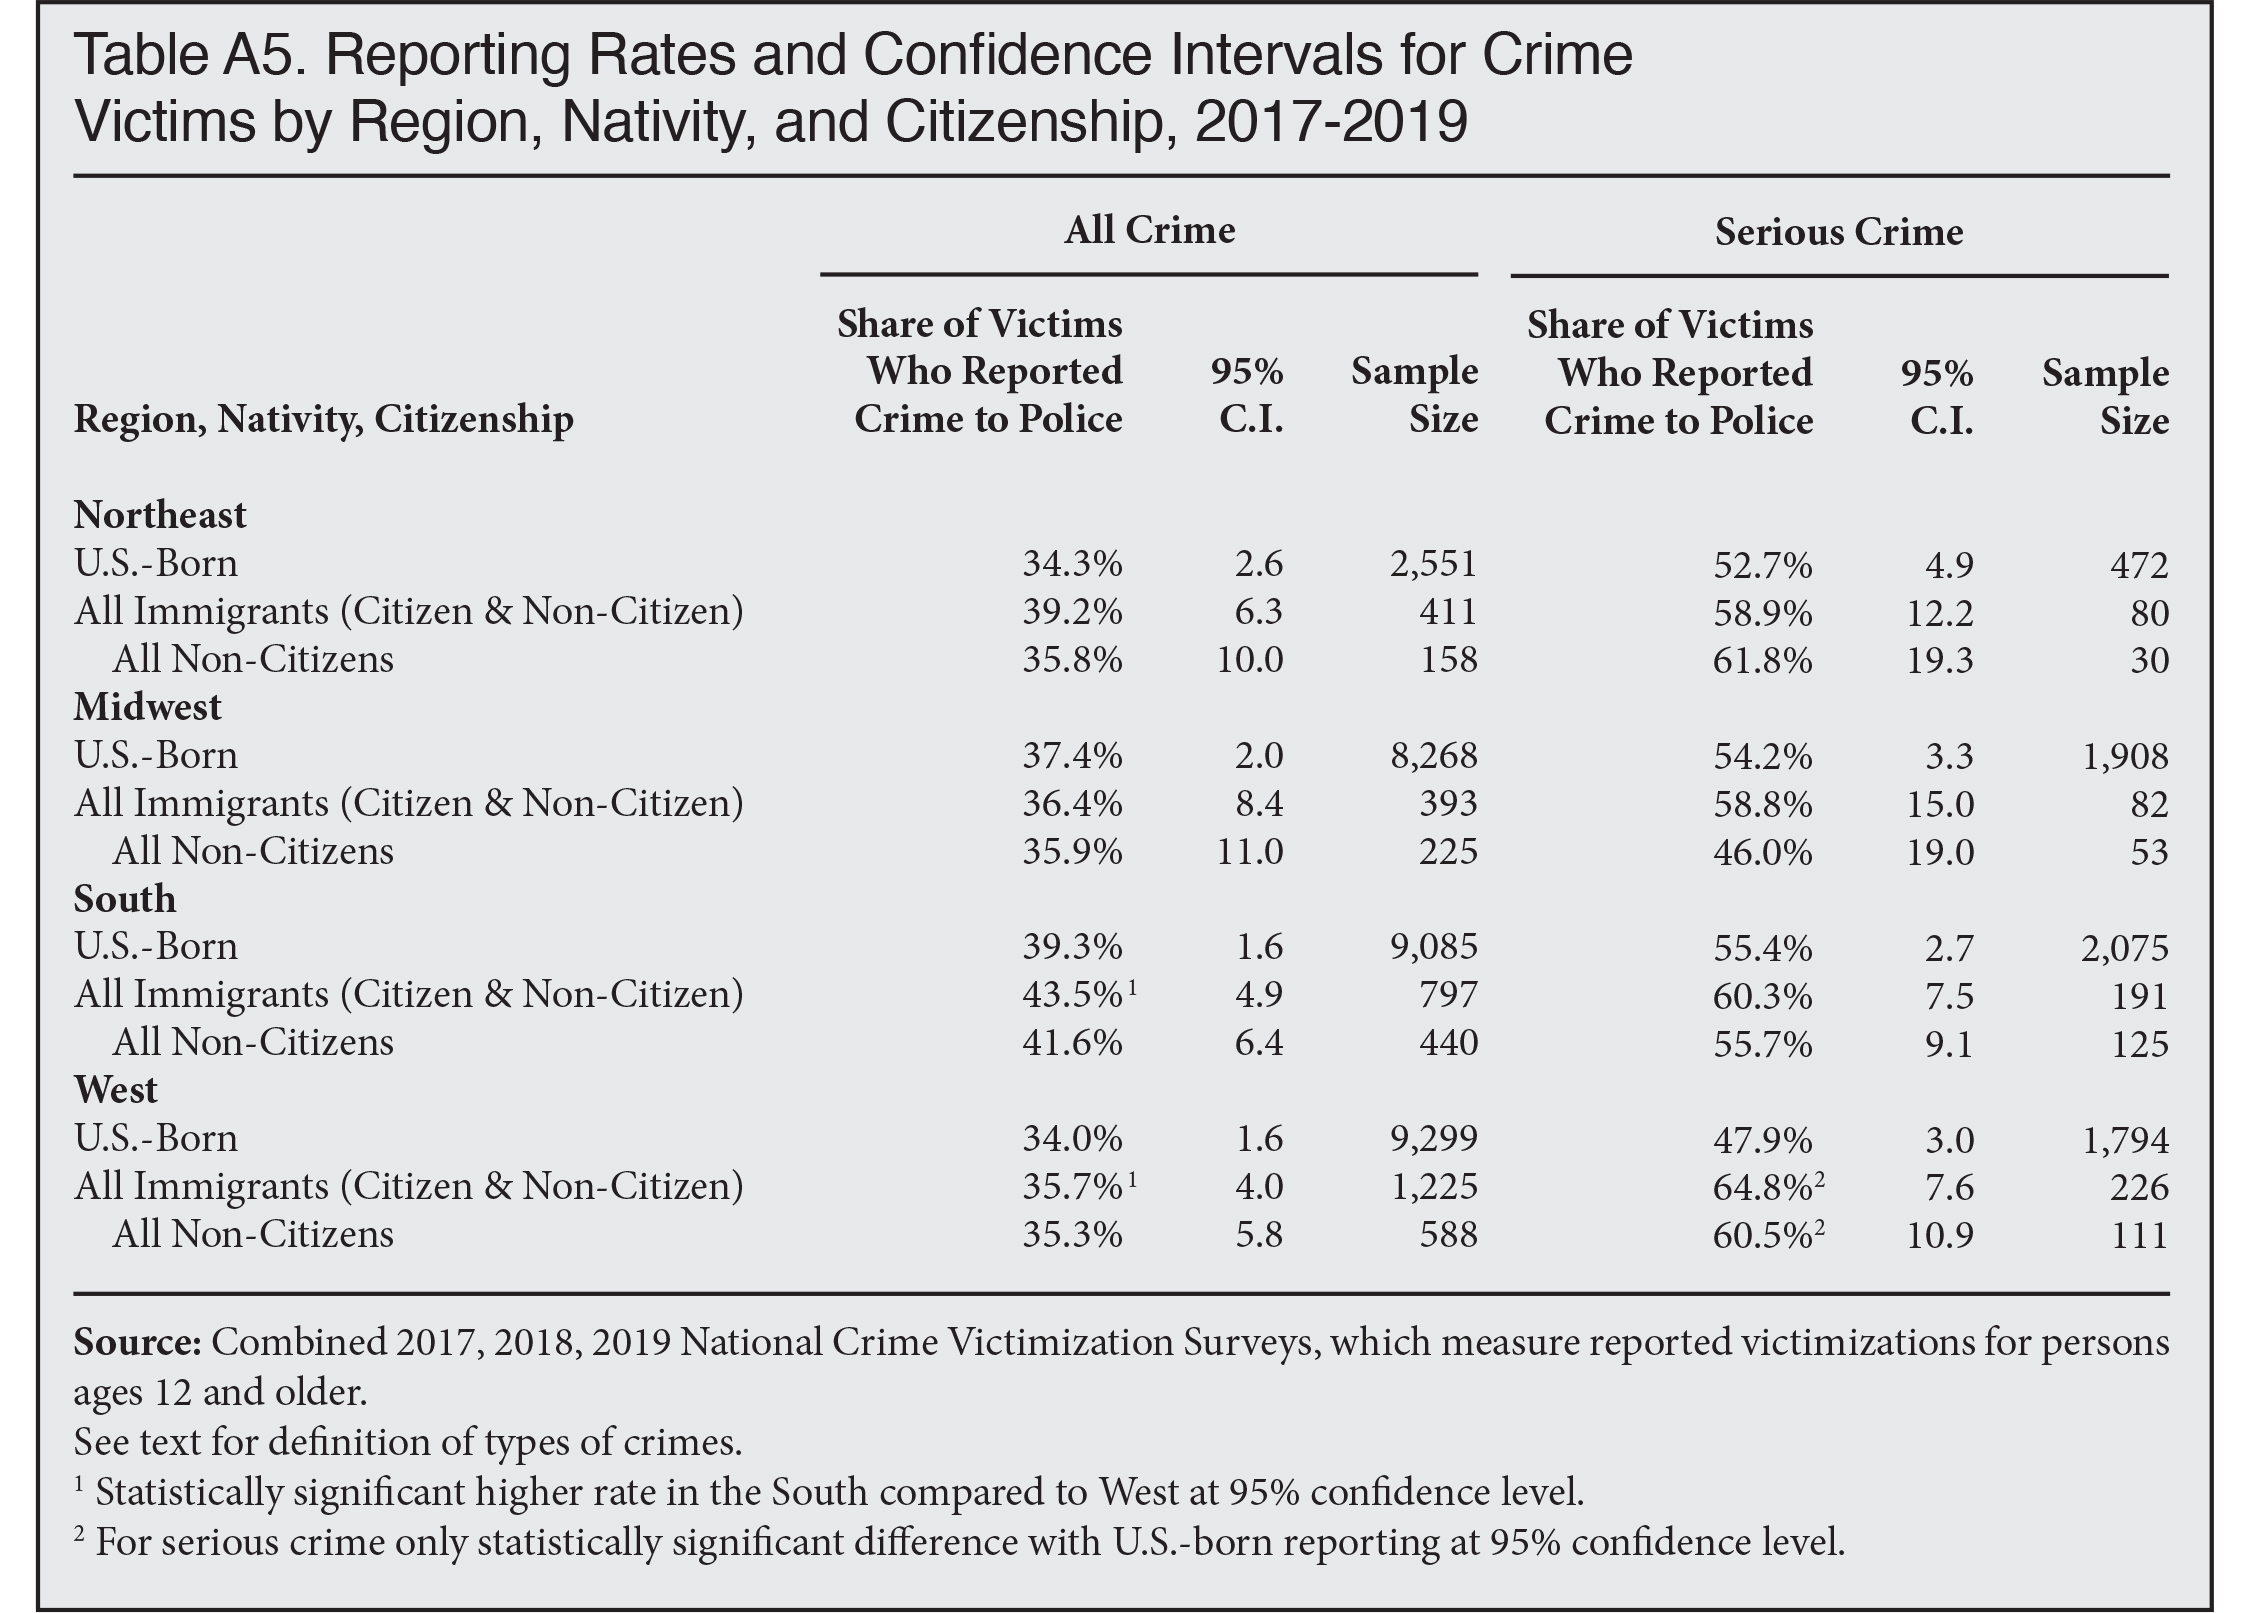
Figure 5 reveals some slight regional differences in crime reporting by immigrant victims, non-citizens, and the U.S.-born. Yet even with the larger sample size available for victims of all crimes, only one of the regional differences is statistically significant. The share of immigrant victimizations for all crimes reported to police in the South (44 percent) is significantly higher than the share reported in the West (36 percent).
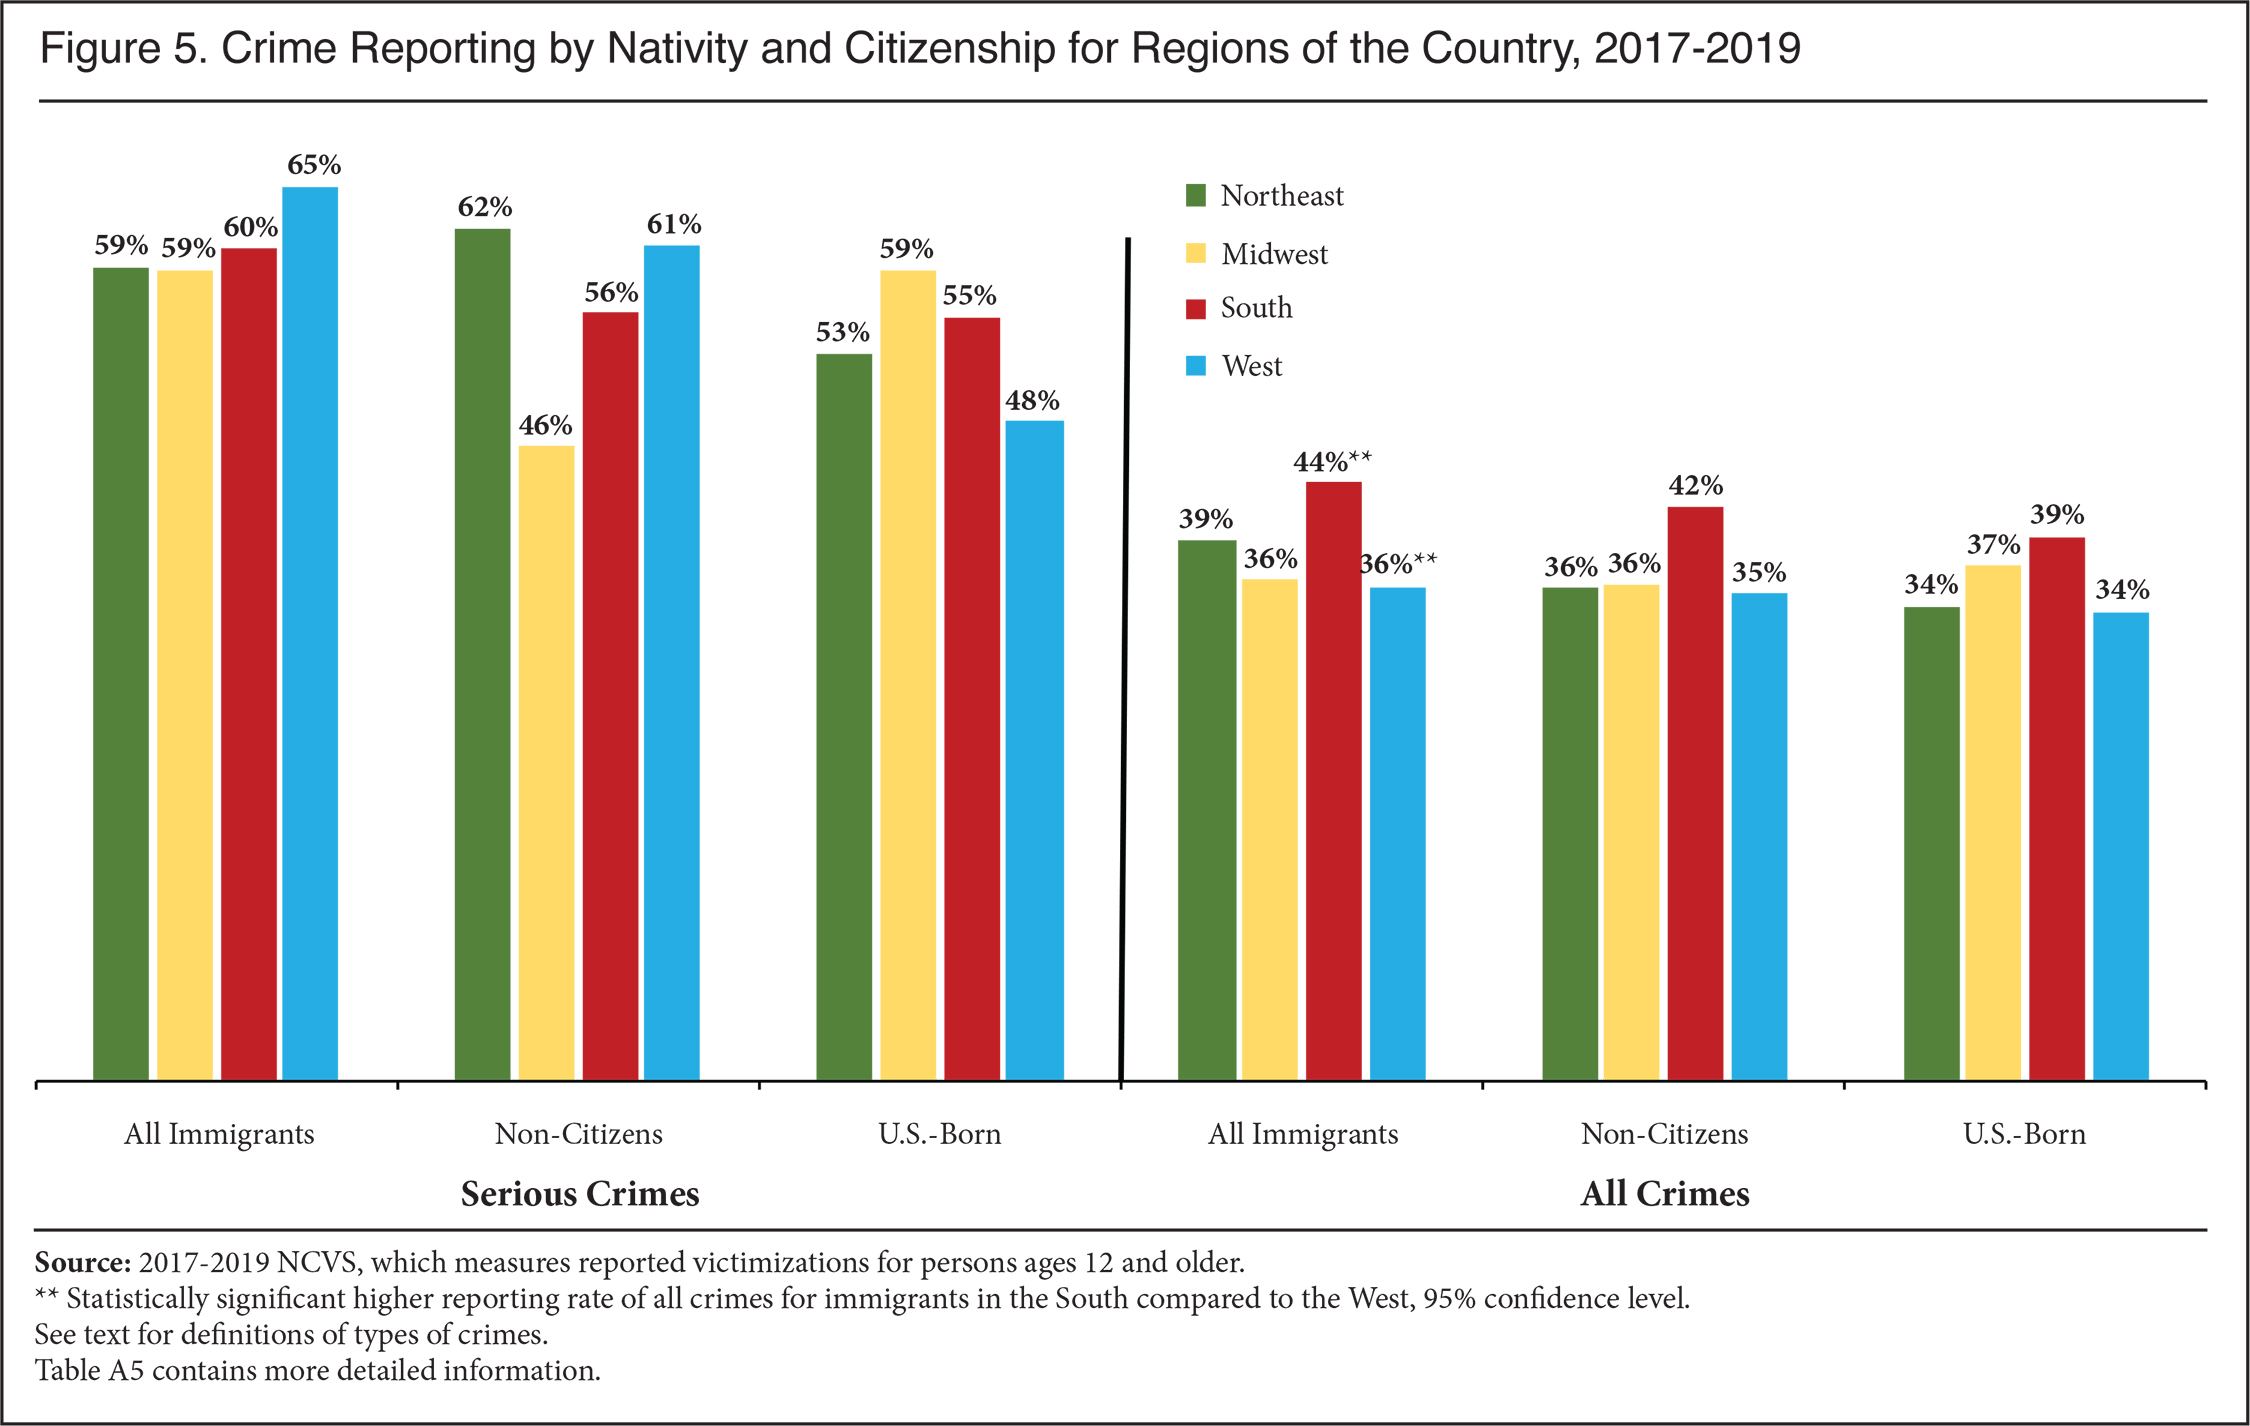 |
The division of the NCVS sample by the four geographic regions necessarily reduces the size of each sample. As shown in Table A5 in the Appendix, the largest geographic samples are for the West and the South, while the sample for the Northeast is about one-third the size of the three other regions. This makes it unworkable to further break down the data by types of crimes or for Hispanic non-citizens as a proxy for illegal immigrants. For this reason, the analysis in Figure 5 (and Table A5) showing crime reporting by region is limited to serious crimes and all crimes and only for U.S.-born, all immigrants, and all non-citizens. (Table A5 reports sample sizes.)
These results call into question the theory that routine engagement and cooperation between local law enforcement agencies and ICE creates distrust and suppresses crime reporting by immigrants. If the sanctuary policies that are so common in the West actually did help boost immigrant crime reporting, then the West should have higher reporting rates than the South, where cooperation is more common — but the NCVS data indicates the opposite.
Variation in Crime Reporting By Community Size Is Not Significant
The “chilling effect” theory also can be tested by examining another geographic variable included in the NCVS — the size of the community in which respondents live. The NCVS breaks down the responses according to whether the respondent lives in a place with a population greater than or less than 100,000. In general, sanctuary policies are more likely to be adopted in larger jurisdictions than in the suburbs and rural areas. Out of 181 localities with sanctuary policies documented by the Center, 112 are large communities (greater than 100,000) and 69 are in small communities (fewer than 100,000 people). And many of the nation’s largest cities, including New York, Los Angeles, Chicago, and Philadelphia have sanctuary policies. Therefore, comparing reporting rates in larger communities with smaller communities might provide some insight into whether engagement with federal immigration enforcement affects immigrant crime reporting.
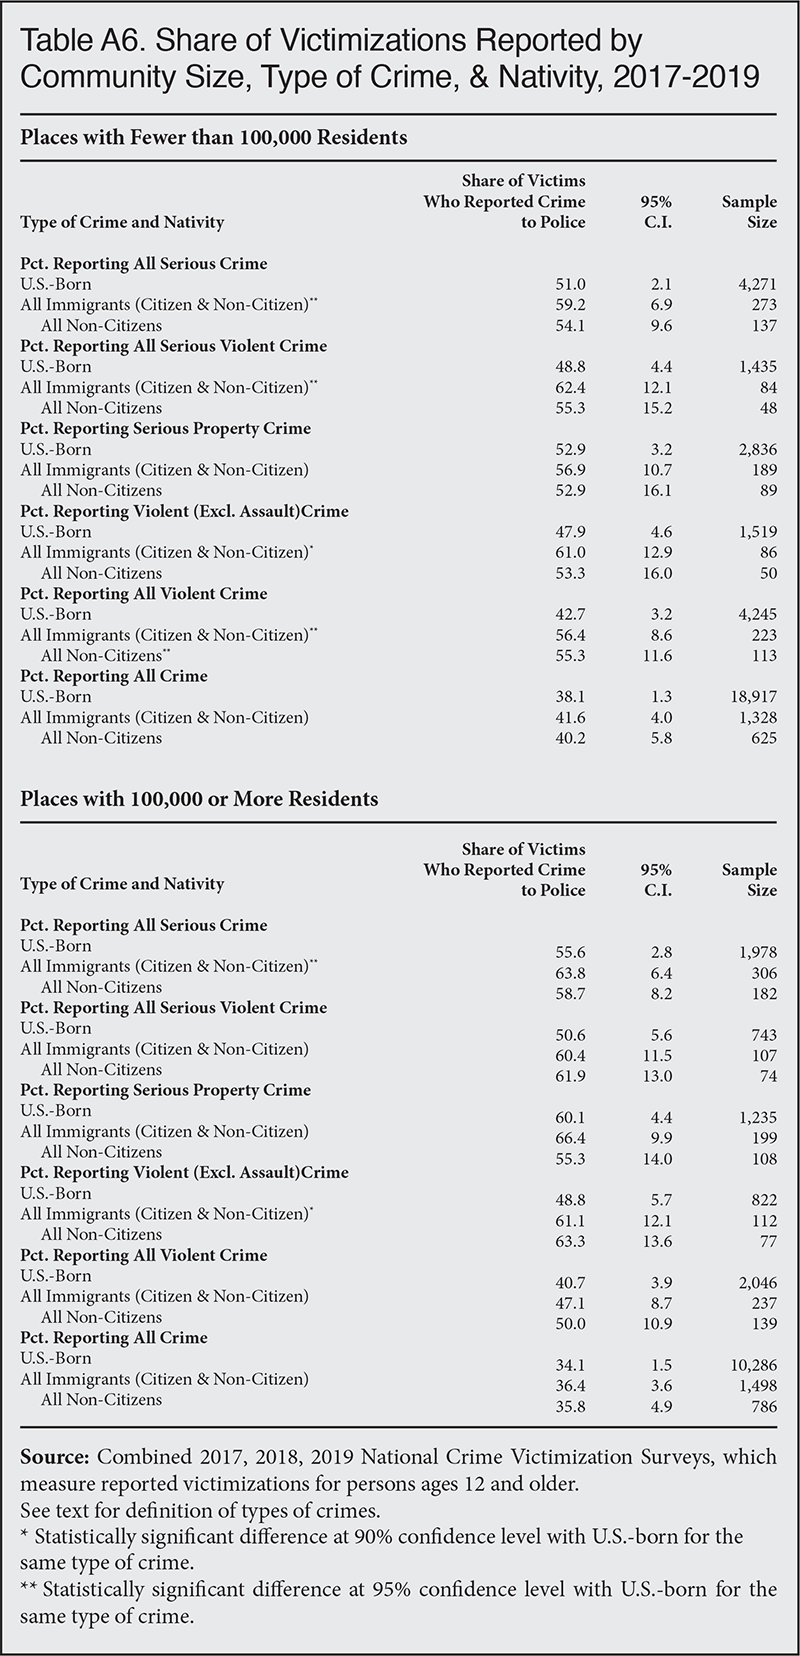
Figure 6 shows the share of serious, violent, and all crimes against the native- and foreign-born reported to police in cities of 100,000 or more compared with communities with fewer than 100,000 residents.41 As it turns out, the data show that there are no statistically significant differences in crime reporting rates for immigrants and non-citizens according to community size. Based on a simple comparison by community size, crimes against immigrants are not reported at higher rates in larger communities even though, in general, these areas are more likely to have sanctuary policies.
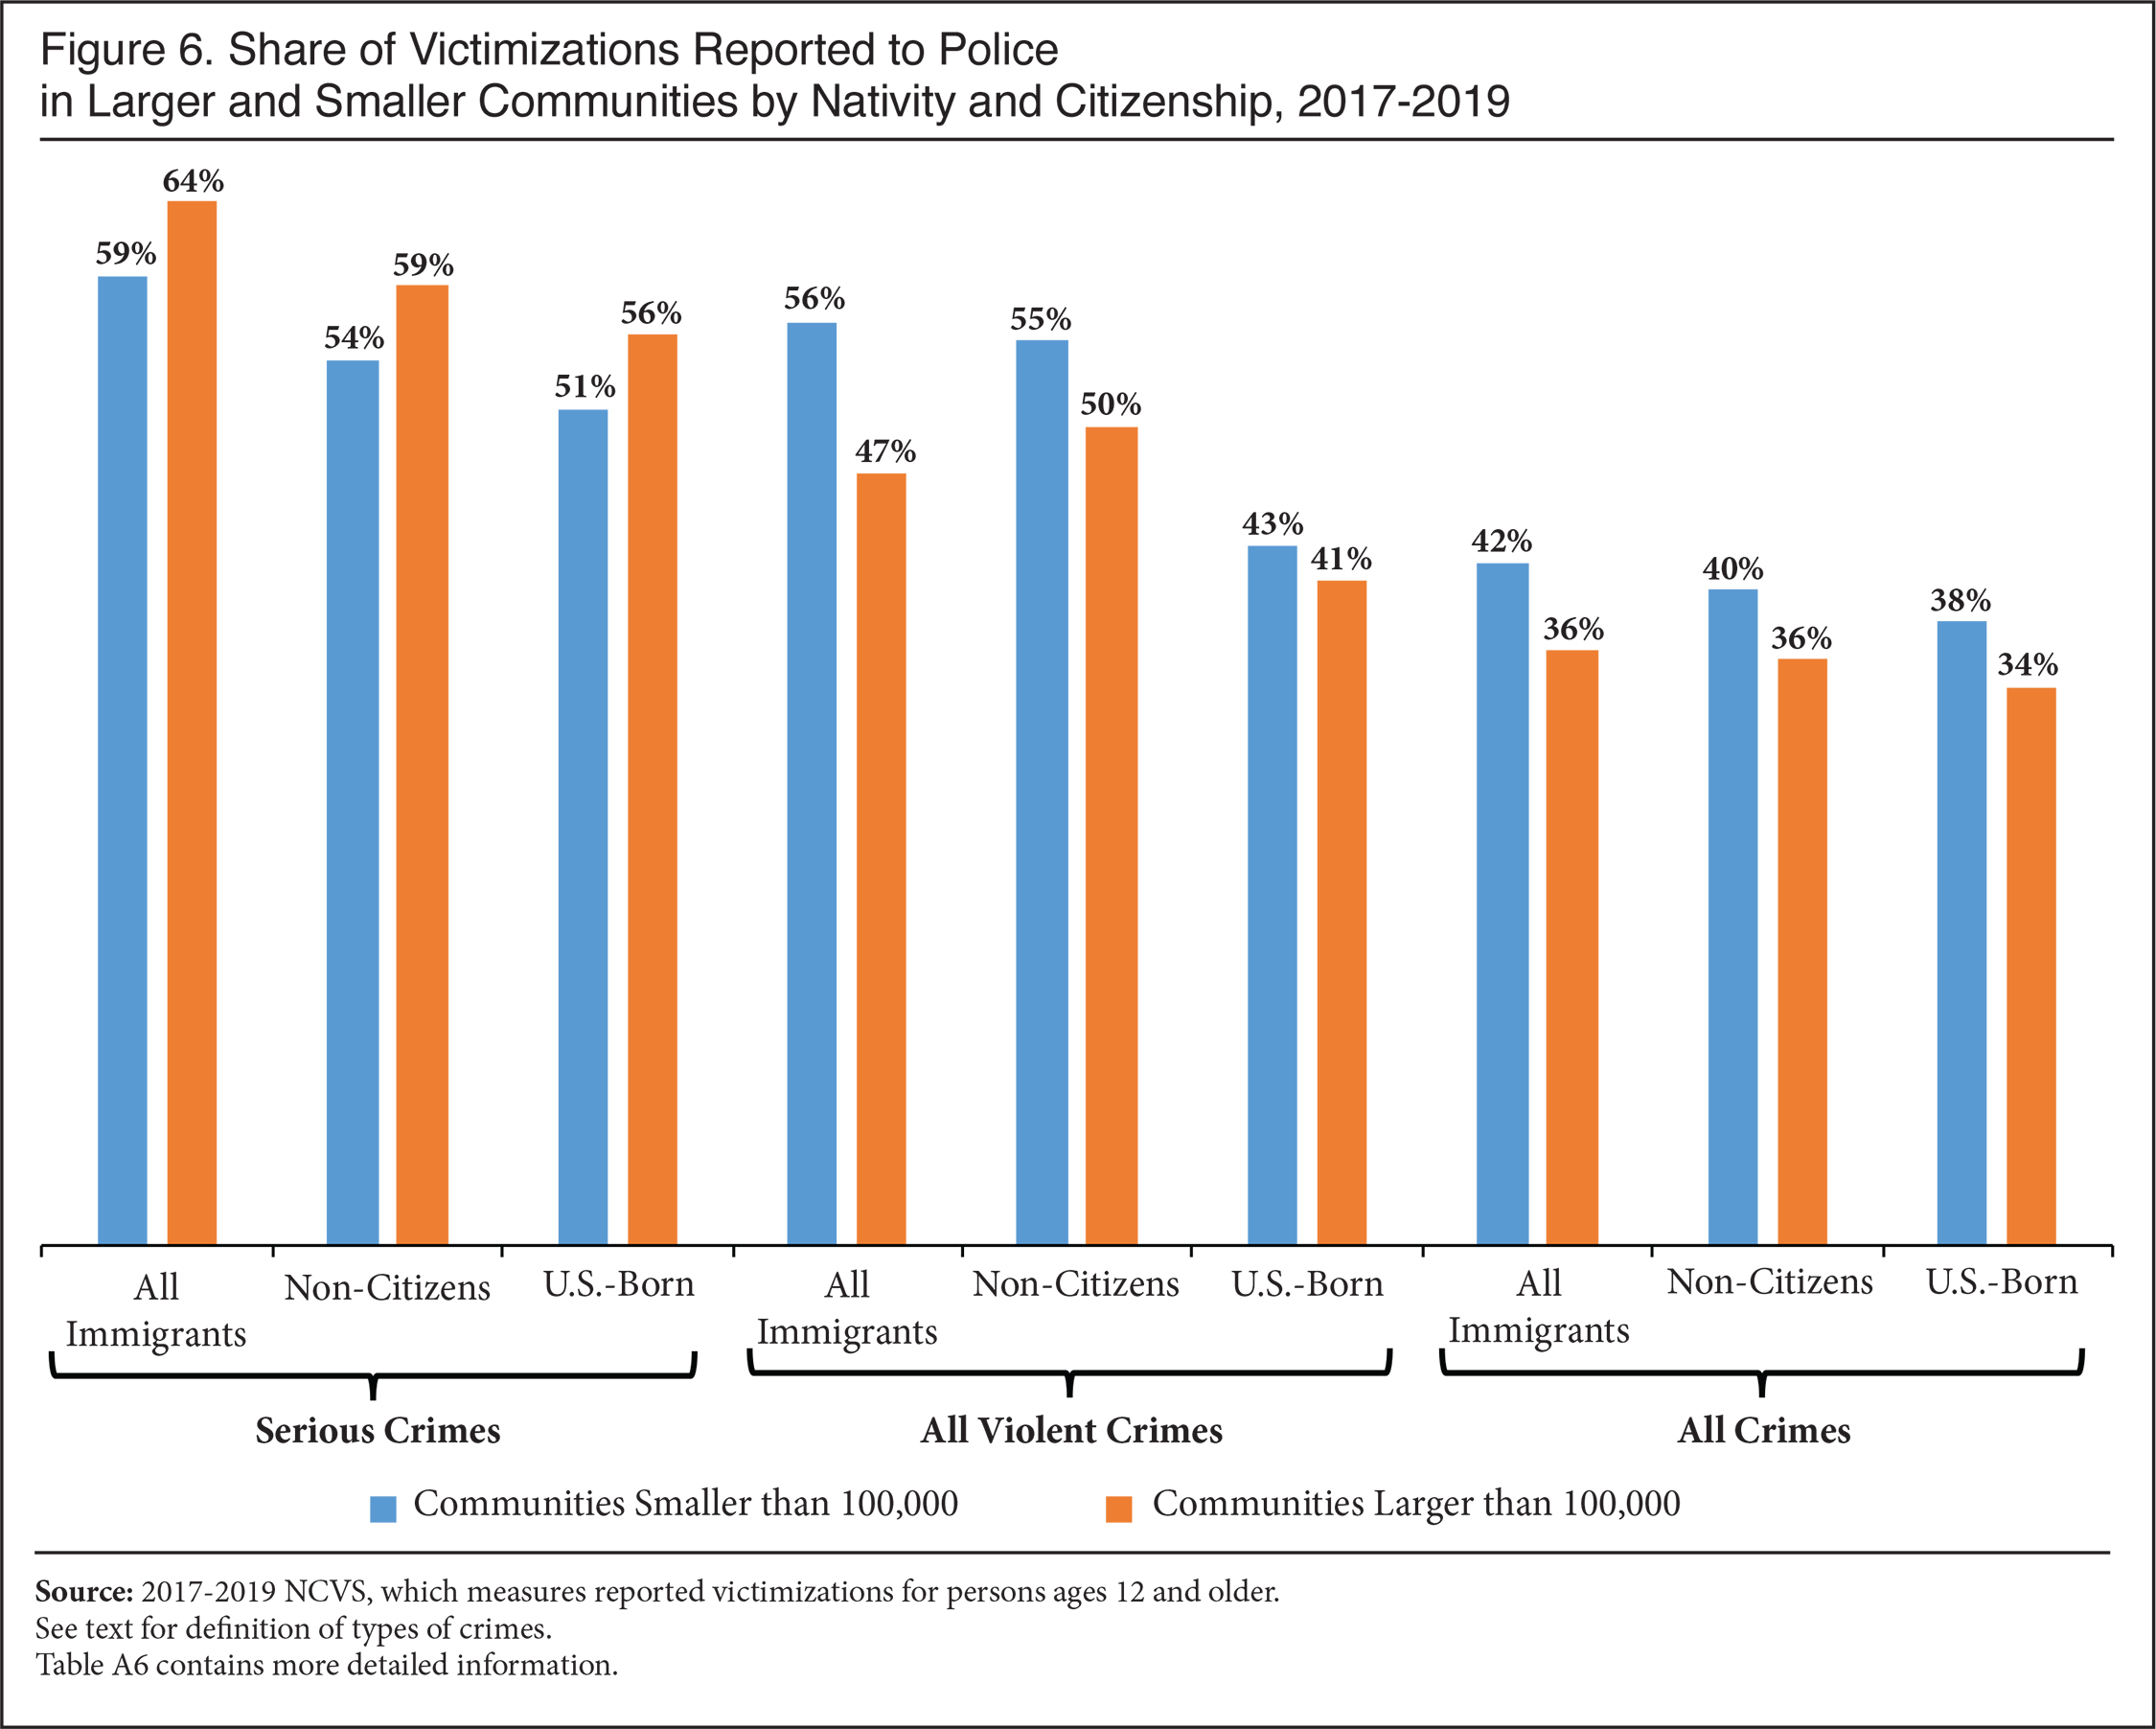 |
Table A6 in the appendix provides additional information, including sample sizes and reporting rates by community size. There are some significant differences between natives and immigrants for some types of crimes living in similarly sized communities. In every category, it is the immigrants who have the higher reporting rates. Consistently, there are more statistically significant differences between natives and immigrants in smaller communities. We believe that the most meaningful comparison is between immigrants in larger and smaller communities, as shown in Figure 6, but the data showing that immigrants report crimes at relatively high rates in small communities also supports the idea that immigrants report crimes at relatively high rates, even where local police tend to cooperate more with ICE.
Conclusion
Advocates for immigrants have long claimed that state and local law enforcement agencies should be prohibited from cooperating with federal immigration authorities because immigrant victims fear that contact with local police could result in their deportation, leading them to avoid reporting crimes. Data from the NCVS, the most authoritative national source of statistics on crime reporting, shows that crimes against immigrants (naturalized citizens and non-citizens) are reported to police at rates that match or exceed those of the U.S.-born. We find that this is consistently true for various types of crimes, and it is true for female victims, for Hispanic non-citizens (a group that includes many illegal aliens), for younger and presumably more recently arrived immigrants, across most geographic regions, and in both small and large communities. This is the case even though law enforcement in most jurisdictions routinely cooperates with federal immigration enforcement authorities. Our analysis also shows that in the overwhelming majority of victimizations, the immigrants themselves reported the crime to police. Of immigrant victims who did not report a crime, very few gave reasons stating or suggesting that they feared police or immigration enforcement.
Policy Recommendations
- While it is encouraging that immigrants apparently report victimizations to police at the same or higher rates as the native-born, federal immigration authorities and state and local law enforcement agencies should continue to emphasize to each other and to the public that victims and witnesses of crime are not targets of immigration enforcement when they report them. Continuous reinforcement of this message will help ensure that immigrants and their friends and families continue to feel comfortable reporting crimes.
- Local law enforcement agencies should not prohibit or discourage officers from cooperating with ICE based on the concern that immigrants are disproportionately less likely to report crimes.
- Local law enforcement agencies should continue to encourage immigrants to report crimes. There are many successful models for this, some of which have been supported through grants from the Department of Justice’s Community Oriented Policing programs. The NCVS data on reasons immigrants and natives may not report crimes suggest some appropriate initiatives, including:
- Conduct outreach to immigrant communities to help immigrants understand why it is important to report crimes and how they can do so, including appearances in media for non-English speakers;
- Cultivate a relationship with foreign consuls to enlist their help in explaining our laws and justice system to their citizens;
- Use existing programs like faith community jail ministry programs to forge connections with leaders in immigrant communities;
- Educate immigrants on how to prevent victimization;
- Reduce language barriers by hiring staff who speak the languages of the community;
- Consider hiring non-uniform personnel to staff sub-stations, take crime reports, and interview certain victims;
- Offer anonymous tip lines for reporting crimes; and
- Conduct outreach to help the entire community understand the law enforcement priorities of the agency.
- Local law enforcement agencies should make judicious use of the visa programs available to help illegal immigrants who are victims of serious crimes and who are assisting in the prosecution of the offender.42 The availability of these visas can be helpful in gaining the cooperation of illegal immigrants in prosecuting crimes, but the U visa program in particular has become bogged down with rampant fraud and misuse to the point where cooperating victims of serious crime cannot access the benefits promptly.43 To improve the U visa program, Congress should narrow the eligibility criteria to cover victims of recent, serious crimes, among other reforms. In the meantime, state and local agencies should ensure certifying officers are properly applying the eligibility criteria to reduce abuse.
- ICE should continue to provide services to victims of crime, including information for victims on the detention status and outcome of immigration proceedings of perpetrators. In particular, Congress should earmark funding for ICE’s victim services office.44
Appendix
 |
 |
 |
 |
 |
 |
 |
 |
 |
 |
End Notes
1 For more information, see ICE’s topical web pages on “Secure Communities”, undated, and “Updated Facts on ICE’s 287(g) Program”, updated September 17, 2021; and various CIS publications, including “Remarks of Jessica M. Vaughan before the Homeland Security Advisory Council’s Task Force on Secure Communities”, Prepared for the Homeland Security Advisory Council’s Task Force on Secure Communities, August 9, 2011, and Jessica M. Vaughan and James R. Edwards, Jr, “The 287(g) Program: Protecting Home Towns and Homeland”, October 26, 2009.
2 Jamie Eldridge, state senator from Acton, Mass, quoted in 2018 in Samantha J. Gross, “Deal Struck on Immigrant”, the Lowell Sun, February 22, 2018.
3 KC Becker, speaker of the House in Colorado, quoted in Allison Sherry, “Polis: ICE Is ‘A Legitimate Agency’ And The State Shouldn’t Step On Local Cooperation”, CPR News, March 26, 2019.
4 Chris Magnus, “Sessions’ Anti-Immigrant Policies Will Make Cities More Dangerous”, New York Times, December 6, 2017.
5 “Are Sanctuary Jurisdictions Good Policy?”, Britannica Procon.org, March 15, 2018.
6 Pedro Figueroa, an illegal alien from El Salvador, was arrested by ICE outside the San Francisco police department in February 2016 attempting to claim his stolen car after it was recovered by police. The police ran a background check on Figueroa before releasing the vehicle and discovered an ICE warrant for his arrest. Figueroa had entered illegally in 2005 and asked for asylum, but failed to appear for his immigration hearing and was ordered deported by an immigration judge. In addition, he had a misdemeanor conviction for drunk driving in 2012. He was held by ICE for two months and eventually an immigration judge allowed him to reopen his asylum case, setting a hearing in November 2019. Figueroa sued the city of San Francisco for violating its sanctuary policy, and was awarded $190,000. Reportedly, he planned to apply for a U visa available for illegal alien crime victims, saying he was the victim of “false imprisonment” by ICE. See Richard Gonzales, “Man Reports Car Stolen, Ends Up In Deportation Limbo”, NPR, February 16, 2016.
7 Aaron Martinez, “Transgender woman gets time served, stays jailed”, El Paso Times, April 13, 2017.
8 See Jessica M. Vaughan, “Top Justice Official Scoffs at Immigrant Crime Reporting ‘Chilling Effect’”, June 26, 2017, and “Sheriffs Skeptical of “Chilling Effect’ from Secure Communities”, July 11, 2012.
9 See, for example, Nik Theodore, “Insecure communities: Latino perceptions of police involvement in immigration enforcement”, Department of Urban Planning and Policy: University of Illinois at Chicago, 2013.
10 See, for example, Robert C. Davis et al., “Access to Justice for Immigrants Who Are Victimized: The Perspectives of Police and Prosecutors”, Criminal Justice Policy Review, 12:3, September 2001.
11 See, for example, Cecilia Menjivar et al., “Immigration enforcement, the racialization of legal status, and perceptions of the police: Latinos in Chicago, Los Angeles, Houston and Phoenix in comparative perspective”, Du Bois Review: Social Science Research on Race, 15(1), 2018.
12 Thomas M. Guterbock et al., “Evaluation Study of Prince William County Police Illegal Immigration Enforcement Policy”, January 2010.
13 Reva Dhingra, et al., “Immigration Policies and Access to the Justice System: The Effect of Enforcement Escalations on Undocumented Immigrants and Their Communities”, Springer Science+Business Media, January 2, 2021.
14 The higher rate for Hispanics was statistically significant in 2016, but not 2017.
15 The much higher rate for Hispanics relative to natives in 2019 is statistically significant. In itself, this seems to contradict the notion that Trump enforcement efforts reduced Hispanic reporting of crime, as the very same policies that Dhingra et al. refer to as chilling Hispanic crime reporting (Secure Communities, 287(g) and Executive Order 13768 on immigration enforcement priorities) were still in effect in 2019.
16 Figure A1 shows that, since 2007, the difference between Hispanics and non-Hispanics was only statistically significant in 2011, 2016, and 2019, with Hispanics in 2016 and 2019 being significantly more likely to report crime.
17 The sample size of Hispanic victims in the NCVS was only 289 in 2016 and 349 in 2017. The margin of error for Hispanics in 2016 using a 95 percent confidence is 54.2% ±8%, and for non-Hispanics 41.9% ±4.4%. The margin of error for Hispanics in the 2017 NCVS is 44.9% ±7.8%, and for non-Hispanics 44.6% ±4.5%.
18 This interpretation makes sense since, as Figure A1 shows, the difference in reporting rates in 2016 and 2019 for Hispanics was higher than non-Hispanics and the difference was statistically significant, while the differences in 2017 and 2018 were not.
19 In the Census Bureau’s 2018 American Community Survey (ACS), which is often used by researchers to estimate illegal immigration, we find that 46 percent of non-citizen Hispanics ages 12 and older not in institutions are in the country illegally, and that 23 percent are legal immigrants who live in the same household as an illegal alien. It is likely that a similar share of non-citizen Hispanics are illegal immigrants or live with those in the country illegally in the NCVS. For an explanation of how we identify and weight illegal immigrants in the ACS see the methods section in Steven A. Camarota, Karen Zeigler, and Jason Richwine, “How Much Would It Cost to Provide Health Insurance to Illegal Immigrants?”, Center for Immigration Studies, October 10, 2019.
20 The NCVS is a panel survey of individuals 12 and older, in which the same household is interviewed every six months over a 3.5-year period. As the survey measures crime victimization, murder is excluded from the analysis. Participants are asked if they were victims of crime in the prior six months. The public-use data and most publications from the Bureau of Justice Statistics (BJS) using the survey are based on the year the data was collected, so in some cases the crime may have occurred in the prior calendar year.
21 Serious crime includes most violent crime: rape, attempted rape, sexual assault, completed forced sexual assault without injury, completed robbery, completed robbery without injury, attempted robbery with injury, attempted robbery without injury, completed aggravated assault with injury, attempted aggravated assault with a weapon, and threatened aggravated assault with a weapon. All violent crime includes all serious crimes, plus simple assault, threatened rape or sexual assault, and unwanted sexual contact (not rape) without force. Serious property crime includes completed burglary and completed motor-vehicle theft. Completed burglary includes unlawful or forcible entry, including a permanent residence or other residence or structure, involving a theft or attempted theft. All property crimes include all serious property crimes, plus attempted burglary, residential trespassing, and all other property crimes.
See p. 17 in Rachel E. Morgan and Barbara A. Oudekerk, “Criminal Victimizations, 2018”, U.S. Department of Justice Office of Justice Programs Bureau of Justice Statistics, September 2019, NCJ 253043.
22 Tables A1 and A3 in the Appendix show the total sample sizes for different categories of crime using the 2017 to 2019 NCVS. Table A2 shows the sample size for female victimizations. Table A8 shows the sample size for each individual year for different categories of crime. While Table A8 shows that the immigrant sample is small for many types of crimes in individual years, the basic pattern exists in the individual years as the combined three-year sample.
23 The number of victimizations reflects how many criminal acts were committed against those in the NCVS. See p. 18 of the 2018 NCVS code book provided by ICPSR. Some crimes, like burglary, are not committed against individuals. In that case, all persons 12 and older in the household are considered victims.
24 Parameters for the NCVS are found in Table 2 of the NCVS code book provided by ICPSR.
25 Year-to-Year Correlation Coefficients can be found in Table 15 of the NCVS code book provided by ICPSR.
26 Like other Census Bureau-administered surveys, the NCVS asks respondents about their citizenship with five possible responses: 1) U.S. citizen, born in the United States; 2) U.S. citizen, born abroad of U.S. citizen parents; 3) U.S. citizen, born in Puerto Rico, Guam, the U.S. Virgin Islands, or the Northern Marianas; 4) U.S. citizen by naturalization; 5) Not a U.S. citizen. Responses 1 through 3 are the natives or the U.S.-born. Responses 4 and 5 are immigrants, or the foreign-born.
27 The NCVS source and accuracy statement indicates that among those excluded from the data are, “foreign visitors to the United States”. However, the NCVS Interviewing Manual for field representatives states that individuals are included in the survey if they are temporarily living (not visiting or traveling) in the United States, the sample address is not an embassy, consulate, chancellery, or any other type of office for a foreign country, and the sample address is their usual place of residence while residing in the United States. This means that like other surveys collected by the Census Bureau, long-term temporary visitors (e.g. guestworkers and foreign students) who live in the United States and are not institutionalized should be captured in the survey. This was confirmed in an email dated December 7, 2020, from Dr. Jennifer L. Truman a statistician at the BJS.
28 The term “immigrant” has a specific meaning in immigration law, which is all those inspected and admitted as lawful permanent residents of the United States. Here, we use the term “immigrant” in the non-technical sense, to include all foreign-born persons, legal or illegal.
29 Prior research indicates that most illegal immigrants are included in surveys collected by the Census Bureau, including the American Community Survey (ACS) and the Current Population Survey (CPS). The Center for Migration Studies’ latest estimate based on the 2019 ACS data can be found here. This presentation from the Pew Research Center explains how they estimate the illegal population using the ACS. The Department of Homeland Security’s newest estimate of the illegal population using the ACS can be found here.
30 In recent years, DHS, Pew, and CMS have all estimated that there are roughly 9.5 to 10 million illegal immigrants captured by the ACS. Estimates derived from the ACS are then adjusted upward by these researchers to account for undercount in the survey. The number of immigrants age 12 and older who are not in institutions is 11 to 12 percent smaller in the 2017-2019 NCVS than the ACS from 2017-2019. (The NCVS survey includes only the non-institutionalized population ages 12 and older.) The smaller total immigrant population in the NCVS relative to ACS may reflect a larger undercount of immigrants, generally, or of illegal immigrants in particular in the NCVS. But the two surveys have different designs, which might explain the difference. Still, the number of immigrants in the NCVS is not very different from the ACS, indicating that the crime survey must capture some significant share of the illegal population. It is reasonable to expect that the illegal population in the NCVS would be represented in the category of non-citizens.
31 The federal government estimates that some 70 percent of illegal immigrants come from Latin America. The Center for Migration Studies estimates a similar share.
32 The lack of significance between values that seem quite different in the NCVS is typically due to the small sample size of the sub-populations of immigrants.
33 This category is for all violent crime, except for the categories of simple assault with injury, assault without a weapon and without injury, and verbal threat of assault. In contrast to simple assault, aggravated assault often includes a weapon, and typically results in significant injury and/or is related to the intent of the crime or characteristics of the victim.
34 To determine which respondents are most likely to be illegal aliens in the ACS, we first exclude immigrant respondents who are almost certainly not illegal aliens — for example, spouses of native-born citizens, veterans, government employees, Cubans (because of special rules for that country), etc. The remaining candidates are weighted to replicate known characteristics of the illegal population (population size, age, gender, region or country of origin, state of residence, and length of residence in the United States). We use the 2018 estimates from the Center for Migration Studies (CMS), which are based on the ACS. The resulting illegal population is designed to match CMS on the characteristics listed above. See “State-Level Unauthorized Population and Eligible-to-Naturalize Estimates”, Center for Migration Studies. For some additional explanation of how we identify and weight illegal immigrants in the ACS, see the methods section in Steven A. Camarota, Karen Zeigler, and Jason Richwine, “How Much Would It Cost to Provide Health Insurance to Illegal Immigrants?”, Center for Immigration Studies, October 10, 2019.
35 See, for example, Robert C. Davis and Nicole J. Henderson, “Willingness to Report Crimes: The Role of Ethnic Group Membership and Community Efficacy”, in Crime and Delinquency, October 2003; and Cecilia Menjivar and Cynthia L. Bejarano, “Latino immigrants’ perceptions of crime and police authorities in the United States: A case study from the Phoenix Metropolitan area”, in Ethnic and Racial Studies, January 2004.
36 The NCVS “Interviewing Manual for Field Representatives Manual” indicates that those administering the survey can ask various probes to see if they can get the respondent to give one of the specific answers to this question. According to the manual, among the reasons a response might be coded as “other” is that the respondent does not know the reason why the crime was unreported.
37 Only in the 2017 NCVS did a large share of immigrants pick “other” as a response. In 2018 and 2019, of immigrant victims of serious crime who did not report it, just 5 percent in both years gave “other” as the reason they did not come forward. Of immigrant victims of serious violent crime in 2018, none gave “other” as the reason for not reporting it and just 3 percent gave it as a reason in 2019. And the sample is very small in individual years for these two categories of crime. In 2017, there were only nine unweighted cases in which an immigrant victim of serious crimes gave “other” as the reason it was not reported. For unreported serious violent crimes, only four immigrants gave “other” as the reason it was not reported. There is no obvious reason why a large number of immigrant victims would pick this specific response in 2017, but not in other years. Also, for other types of crimes shown in Table A4, very few immigrants gave “other” as the reason for not reporting a crime. It is possible that perhaps the larger number who chose “other” in 2017 reflects some kind of problem or coding error for these types of crimes in that one year.
38 See Robert C. Davis and Nicole J. Henderson, “Willingness to Report Crimes: The Role of Ethnic Group Membership and Community Efficacy”, in Crime and Delinquency, October 2003.
39 “Delegation of Immigration Authority Section 287(g) Immigration and Nationality Act”, U.S. Immigration and Customs Enforcement, undated.
40 See Jessica M. Vaughan and Bryan Griffith, “Map: Sanctuary Cities, Counties, and States”, Center for Immigration Studies, March 22, 2021.
41 Dividing communities between those with more or fewer than 100,000 residents is common convention. It is also useful in this analysis because it distributes the sample population equally for most types of crime, creating more statistically robust estimates across the categories of crime.
42 Copies of training materials are available upon request.
43 See Jessica M. Vaughan, “Visas for Victims: A Look at the U Visa Program”, Center for Immigration Studies, March 30, 2020.
44 “DHS announces launch of new office for victims of illegal immigrant crime: Office built with input from victims impacted by crime DHS Launches New Office for Victims of Illegal Immigrant Crime”, U.S. Immigration and Customs Enforcement, April 26, 2017.