Download a PDF of this Backgrounder
Steven A. Camarota is the Director of Research at the Center for Immigration Studies.

The government counts all persons when apportioning seats in the U.S. House of Representatives — citizens, green card holders, guest workers, foreign students, and illegal immigrants. As a result, if the Gang of Eight immigration bill (S.744) becomes law, we project it may redistribute three seats in the House in 2020, and five seats in 2030. This redistribution is caused by the bill's dramatic increases in legal immigration, not the bill's amnesty provisions. In addition, S.744 can also be seen as redistributing seats by allowing illegal immigrants to stay, rather than using enforcement to cause them to return home. In 2010, the presence of illegal immigrants redistributed four seats.
Among the findings:
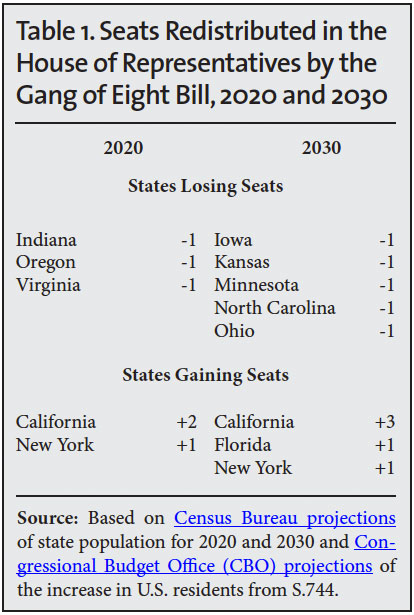
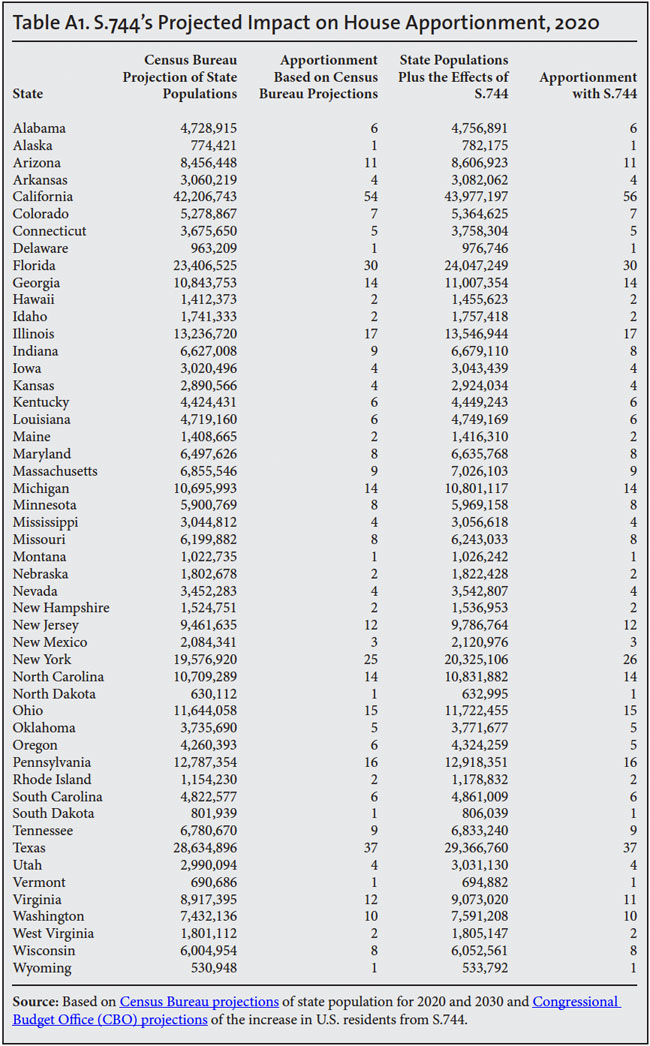
- The seven million additional new residents that the Congressional Budget Office (CBO) projects S.744 will add to the country by 2020 (above and beyond the current level of immigration) may cause Indiana, Oregon, and Virginia to each lose a seat in the House, while New York will gain a seat and California will gain two seats.
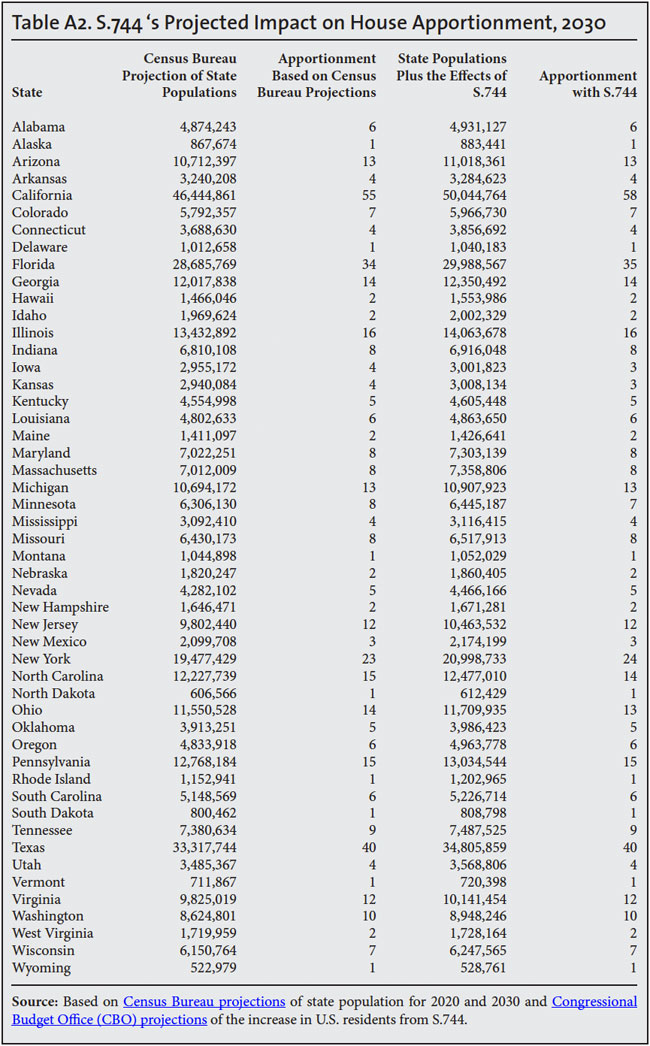
- The 14.2 million new residents that the CBO projects S.744 will add by 2030 may cause Iowa, Kansas, Minnesota, North Carolina, and Ohio to each lose a seat in the House, while California will gain three seats and New York and Florida will each gain a seat.
- This redistribution of seats is not caused by the amnesty provisions of S.744. Those illegal immigrants are already here and most were counted in the 2010 census. Rather, S.744 would redistribute seats by doubling legal immigration, adding millions of additional residents.
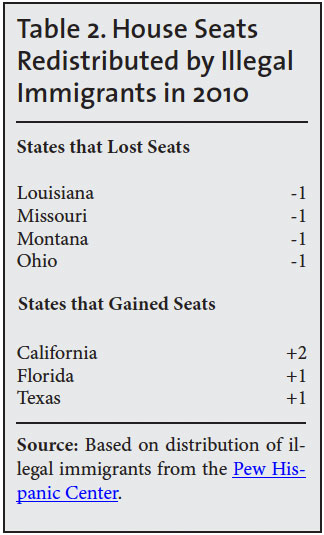
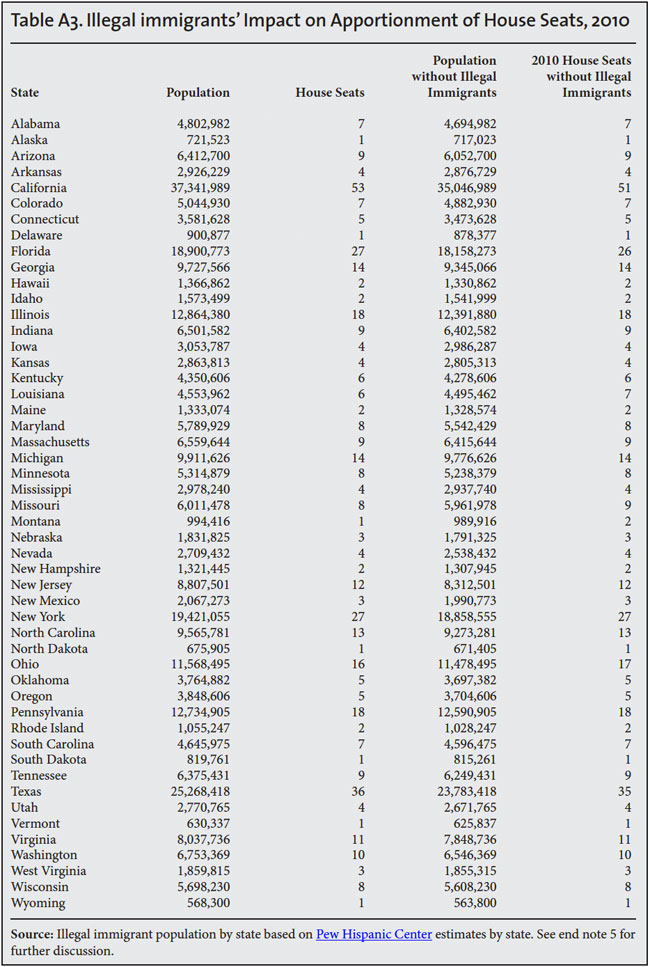
- By allowing illegal immigrants to remain in the country, S.744 can also be seen as redistributing seats. The inclusion of illegal immigrants in the 2010 Census caused Louisiana, Missouri, Montana, and Ohio to each lose a seat, while Texas and Florida each gained a seat and California gained two seats.
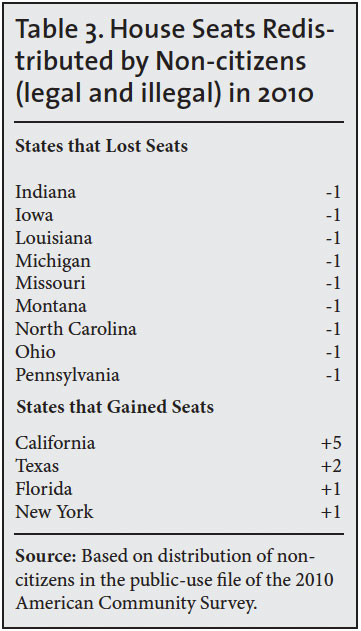
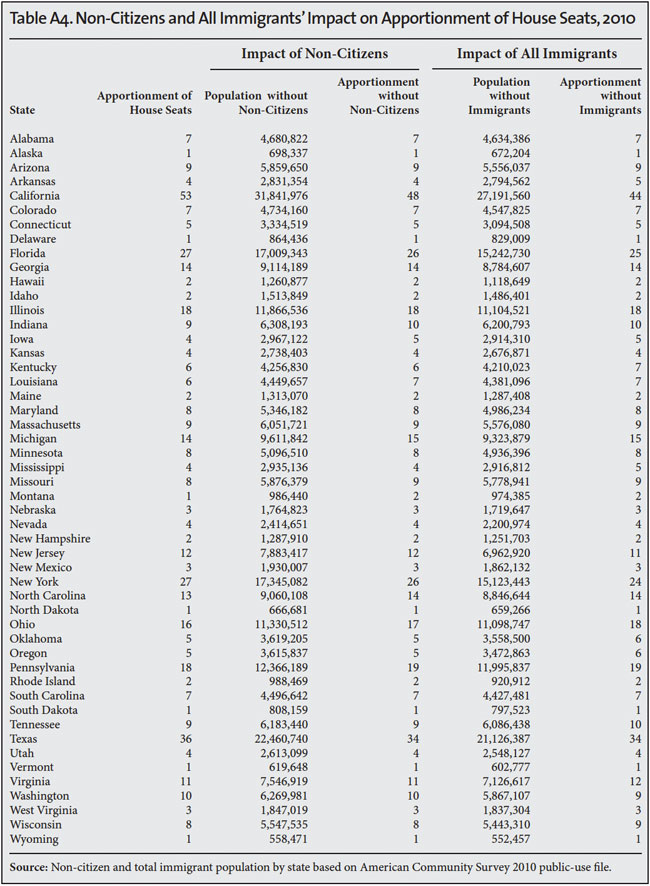
- The overall impact of immigration is very large. The 22.5 million non-citizens (both legal and illegal) in the country redistributed nine seats in the House in 2010. Indiana, Iowa, Louisiana, Michigan, Missouri, Montana, North Carolina, Ohio, and Pennsylvania each lost a seat. Florida and New York each gained a seat, Texas gained two seats, and California gained five seats.
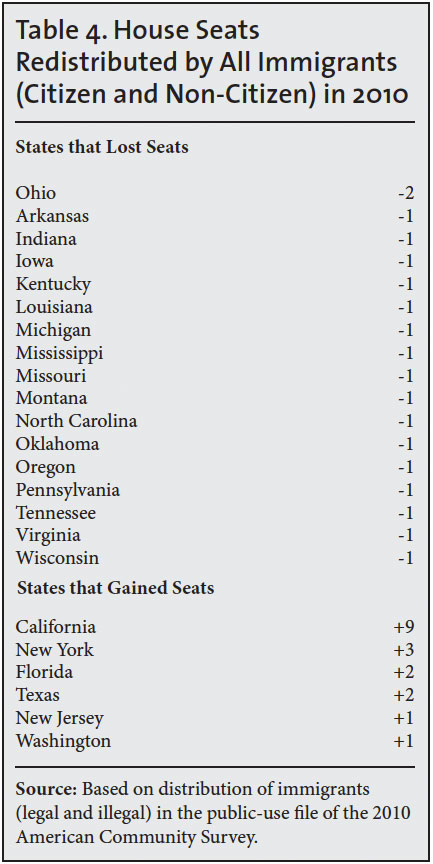
- The 40 million immigrants (citizen and non-citizen) in the 2010 census redistributed 18 seats. Arkansas, Indiana, Iowa, Kentucky, Louisiana, Michigan, Mississippi, Missouri, Montana, North Carolina, Oklahoma, Oregon, Pennsylvania, Tennessee, Virginia, and Wisconsin each lost a House seat and Ohio lost two seats. New Jersey and Washington each gained a seat, Florida and Texas each gained two seats, New York gained three seats, and California gained nine seats.
- Of the 18 seats redistributed by the 40 million immigrants in the country in 2010, 16 went to states that voted for President Obama in 2012. Thus, from a partisan perspective, immigration tends to benefit Democrats.
- The redistribution caused by immigration tends to take representation away from states comprised mostly of U.S. citizens and give it to states where a large share of residents are not citizens. In the states that lost seats due to all immigrants in 2010, 96 percent of the voting-age population were citizens in contrast to 86 percent in the states that gained seats.
- In the states that lost seats due to all immigrants in 2010, the average district had 543,243 voting-age citizens compared to 449,553 in the states that gained a seat. There is a real tension between large-scale immigration and the principle of "one man, one vote".
Introduction
This report examines the possible impact of S.744, which was passed by the U.S. Senate in June 2013, on the apportionment of seats in the U.S. House of Representatives and the Electoral College. CBO projections indicate that S.744's substantial increases in future immigration would add seven million new residents to the United States population by 2020 and 14.2 million by 2030. It must be emphasized that these new residents are not the result of the amnesty or legalization provisions of the bill. Rather it reflects the dramatic increases in legal immigration in the bill.
The bill also allows almost all illegal immigrants to remain in the country. Using the Pew Hispanic Center's estimates of illegal immigrants by state for 2010, we project the impact of these illegal immigrants on apportionment. Finally, we project the impact of the 22.5 million non-citizens (legal and illegal) in the country on apportionment, as well as the total impact of the 40 million immigrants (citizen and non-citizen) included in the 2010 Census. It is worth pointing out that the impact on seats in the House is the same as on the Electoral College.
Article 1, Section 2 of the U.S. Constitution mandates that a census be taken every 10 years expressly for the purpose of apportioning seats in the House of Representatives. To apportion seats, each state first receives one representative, with the remaining seats distributed between the states based on their share of the total U.S. population, excluding the District of Columbia1 The apportionment population of each state is defined as the state's resident population plus all the state's military and civilian personnel of the federal government and their dependents at the time of the Census. The resident population is comprised of all persons counted in the census, including legal immigrants (citizen and non-citizen) and illegal immigrants.
The inclusion of illegal aliens is probably the most controversial part of the apportionment population. Congress may have the authority to change who is included in the apportionment population, but has so far has not done so.2 Illegal immigration, coupled with high levels of legal immigration, means that in 2010 one out of every eight U.S. residents (40 million) was foreign-born. The Census Bureau defines the foreign-born as people born outside of the United States who were not U.S. citizens at birth. Immigration redistributes seats in the House and Electoral College for two reasons: The number of immigrants is so large and they are unevenly distributed throughout the country.
Findings
Immigration Increases in S.744. Table 1 shows the states that may gain or lose seats in 2020 and 2030 if S.744 becomes law. The table shows that the seven million new residents that the CBO projects S.744 will add by 2020 may cause Indiana, Oregon, and Virginia to each lose one seat in the House, while New York will gain a seat and California will gain two seats. By 2030 the 14.2 million new residents the CBO projects S.744 will add may cause Iowa, Kansas, Minnesota, North Carolina, and Ohio to each lose a seat in the House, while California would gain three seats and New York and Florida would each gain a seat. In some cases a state fails to gain a seat it otherwise would have gained or retains a seat it otherwise would have lost.
To create these projections, we used the Census Bureau's latest state population projections for 2020 and 2030 and then added in the extra residents the CBO projects S.744 will create. We distribute these new immigrants based on the current distribution of the foreign-born population.3 On the one hand, S.744 accelerates family-based immigration significantly. Thus a very large share of those entering as a result of S.744 will be joining relatives. This will tend to make the new immigration concentrated in a manner similar to the current immigrant population. On the other hand, the general trend in recent years has been for immigrants to become somewhat more dispersed. Depending on the concentration of these new immigrants, the impact of S.744 could be larger or smaller than we project in Table 1.4
It must be remembered that this redistribution of seats is not caused by the amnesty provisions of S.744. Those illegal immigrants are already here and most were counted in the 2010 census. Rather, it is caused by the dramatic increases in legal immigration found in S.744. It must also be remembered that this redistribution is in addition to any redistribution caused by the current level of legal immigration. The CBO projections are only for the increase in the number of U.S. residents, above the level of current immigration.
It is important to keep in mind that the average congressional district has about 700,000 residents. By 2020 that may grow to roughly 800,000 and by 2030 it is likely to be closer to 900,000. The population S.744 will add over the next 16 years is equal to seven to 15 congressional seats. Thus it is not surprising that the millions of new residents S.744 would add have important implications for the distribution of House seats as well as for the Electoral College.
The Impact of Illegal Immigrants. In addition to substantially increasing legal immigration, S.744 would allow illegal immigrants to remain in the country and offer them immediate legal status and eventual citizenship. Table 2 reports the impact of illegal immigrants in 2010 on apportionment. To create these estimates we used the Pew Hispanic Center's state-by-state estimates from that year.5 We removed the illegal population from the 2010 apportionment population and then allocated the seats. Table 2 shows that Louisiana, Missouri, Montana, and Ohio each lost a seat in the House in 2010 because of the inclusion of illegal aliens, while California gained two seats and Florida and Texas each gained one seat.
The Impact of All Non-Citizens. Table 3 takes the 2010 apportionment population and removes the non-citizen population.6 The impact is of course much larger than that of just illegal immigrants because the non-citizen population includes legal immigrants as well as illegal immigrants who responded to the Census. The 22.5 million non-citizens (legal and illegal) in the country redistributed nine seats in the House in 2010. Indiana, Iowa, Louisiana, Michigan, Missouri, Montana, North Carolina, Ohio, and Pennsylvania each lost a seat. Florida and New York each gained a seat, Texas gained two seats, and California gained five seats.
The Impact of All Immigrants. Table 4 takes the 40 million immigrants (citizens and non-citizen) in the country and estimates their impact on the distribution of House seats at the time of the last Census. In 2010, the entire immigrant population caused a redistribution of 18 seats. Arkansas, Indiana, Iowa, Kentucky, Louisiana, Michigan, Mississippi, Missouri, Montana, North Carolina, Oklahoma, Oregon, Pennsylvania, Tennessee, Virginia, and Wisconsin each lost a seat and Ohio lost two seats. New Jersey and Washington each gained a seat, Florida and Texas each gained two seats, New York gained three seats, and California gained nine seats. Clearly the overall impact is very large. In fact, the actual impact of immigration is a good deal larger because Tables 2, 3, and 4 do not include any of the children immigrants had after they arrived in the United States.
Partisan Implications. From a partisan perspective the states that lose seats as a result of immigration tend to be both red and blue, however the states that gain tend to be Democratic states. For example, 16 of the 18 seats redistributed by the 40 million immigrants in the country in 2010 went to states that voted for President Obama in 2012. Put a different way, immigrants tend to settle in states that vote Democratic. As a result, they tend to add to the political power of Democrats in Congress and in the Electoral College.
Tension with "One Man, One Vote". The redistribution caused by immigration tends to take representation away from states comprised mostly of U.S. citizens and redistributes it to states where a large share of residents are not citizens. In the states that lost seats due to all immigrants in 2010, 96 percent of the voting-age population were citizens, in contrast to 86 percent in the states that gained seats. In the states that lost seats due to all immigrants in 2010, the average district had 543,243 voting-age citizens, compared to just 449,553 in the states that gained one or more seats.7 It generally takes significantly fewer votes to win elections in districts where a large share of the population is not comprised of U.S. citizens. There is a very real tension between the large non-citizen populations that immigration creates and the principle of "one man, one vote".
Conclusion
Given the large number of immigrants allowed into the country and their concentration, it is inevitable that immigration will exact a political cost from those states that receive relatively few immigrants. Because S.744 roughly doubles legal immigration it will accelerate this redistribution of population power.
It is important, then, when making decisions regarding immigration policy, to take into account not only the economic, fiscal, cultural, and demographic impacts of immigration, but also the political impact, part of which is the realignment of power in Congress and the Electoral College away from states receiving relatively few immigrants. In addition to this realignment, careful consideration should also be given to the loss of representation suffered by citizens in low-immigration states. Trying to deal with this problem by excluding non-citizens, legal or illegal, from Census counts would be very difficult politically and is even more difficult as a practical matter. Moreover, it would result in many years of litigation as the courts determined its constitutionality.
Encouraging legal immigrants who are not citizens to naturalize would help to alleviate at least some of the redistribution of political representation away from U.S. citizens. Of course, increased naturalizations would have no impact on the problem created by the presence of illegal aliens, guest workers, and foreign students. In addition, the current level of legal immigration of over one million a year adds many non-citizens to the population, even assuming that a large share become citizens when they are eligible to do so after three or five years. By dramatically increasing the number of people allowed into the country, the Gang of Eight bill will further intensify the loss of political power of American citizens as the bill adds even more non-citizens to the population each year.
Since the amount of redistribution is a direct consequence of the level of immigration, a more moderate level of immigration would produce less immigration-based reapportionment. Given the apparent remoteness of the other effects of immigration on low-immigrant states, citizens of such states and their elected representatives need to be particularly sensitive to the political costs of immigration.
End Notes
1 The Congressional Budget Office report (see Table 2, p. 15) projects that the large increases in legal immigration found in S.744 would add 4.3 million U.S. residents by 2018, 10.4 million by 2023, 13.5 million by 2028, and 16.2 million by 2033. These are the additional residents the bill would add above the current level of immigration. We use a linear extrapolation of these projections to estimate the impact of the bill in 2020 and 2030.
2 In 1979, the Federation for American Immigration Reform (FAIR) sued to enjoin the Census Bureau from counting illegals in the decennial census of 1980 (FAIR v. Klutznick, 486 F. Supp. 564, D.D.C. 1980). The case was ultimately dismissed by the Supreme Court on the grounds of lack of standing. In 1988, a similar suit filed by FAIR, 40 members of Congress, and the Commonwealth of Pennsylvania was also dismissed. As a result, the constitutionality of excluding illegal immigrants from the apportionment has yet to be decided by a court of law.
3 We use the public-use file of the 2011 American Community Survey to distribute the population of additional immigrants S.744 would add. We add the seven million and 14.2 million new residents that S.744 will add to the U.S. population by 2020 and 2030 to the Census Bureau's most recent state projection of state populations (See Table A1).
4 One important area of uncertainty about these estimates stems from the state populations that the Census Bureau has projected for 2020 and 2030. Although the Bureau issued new national population projections in 2008 and 2012, it has not updated its state projections since 2005.
5 Jeffrey S. Passel and D'Vera Cohn, "Unauthorized Immigrant Population: National and State Trends", 2010, Pew Hispanic Center, 2010, Table A3. Pew bases its estimates of the illegal population on Census Bureau data. However, they are not entirely clear about the exact size of the undercount of illegal immigrants in Census data. To be conservative, we reduce Pew's state estimates by 10 percent and then calculate the distribution of seats in the House. The Department of Homeland Security assumes a 10 percent undercount in its estimates, which are also based on Census Bureau data. (See "Estimates of the Unauthorized Immigrant Population Residing in the United States: January 2011") Our estimates of the states that win and lose seats as a result of illegal immigrants is the same as a petition filed with the Supreme Court by the state of Louisiana after the 2010 Census. However, if we do not reduce Pew's 2010 state estimates by 10 percent to reflect those missed by the Census, then in addition to the four states that lose seats shown in Table 2, North Carolina would lose a seat and Texas would gain an additional seat.
6 In 2010 the Census Bureau did not include a question on citizenship. However, at the same time as the census, the Bureau collected the American Community Survey (ACS), which does ask about citizenship. The survey is by far the largest survey the government collects and included roughly two million households in 2010 as well as people living in group quarters such as prisons. We use the public-use file of the 2010 ACS to determine the distribution of U.S. citizens throughout the country.
7 Figures are from the public-use file of the 2010 American Community Survey.