A new report from the Census Bureau projects the future size and composition of the U.S.-born population under various assumptions, including different levels of immigration. The projections show that immigration is the main driver of U.S. population growth. However, while immigration will make the U.S. population larger, it does not significantly increase the working-age share of the population (18-64), which is a primary reason many advocate for high levels of immigration.
About the new projections:
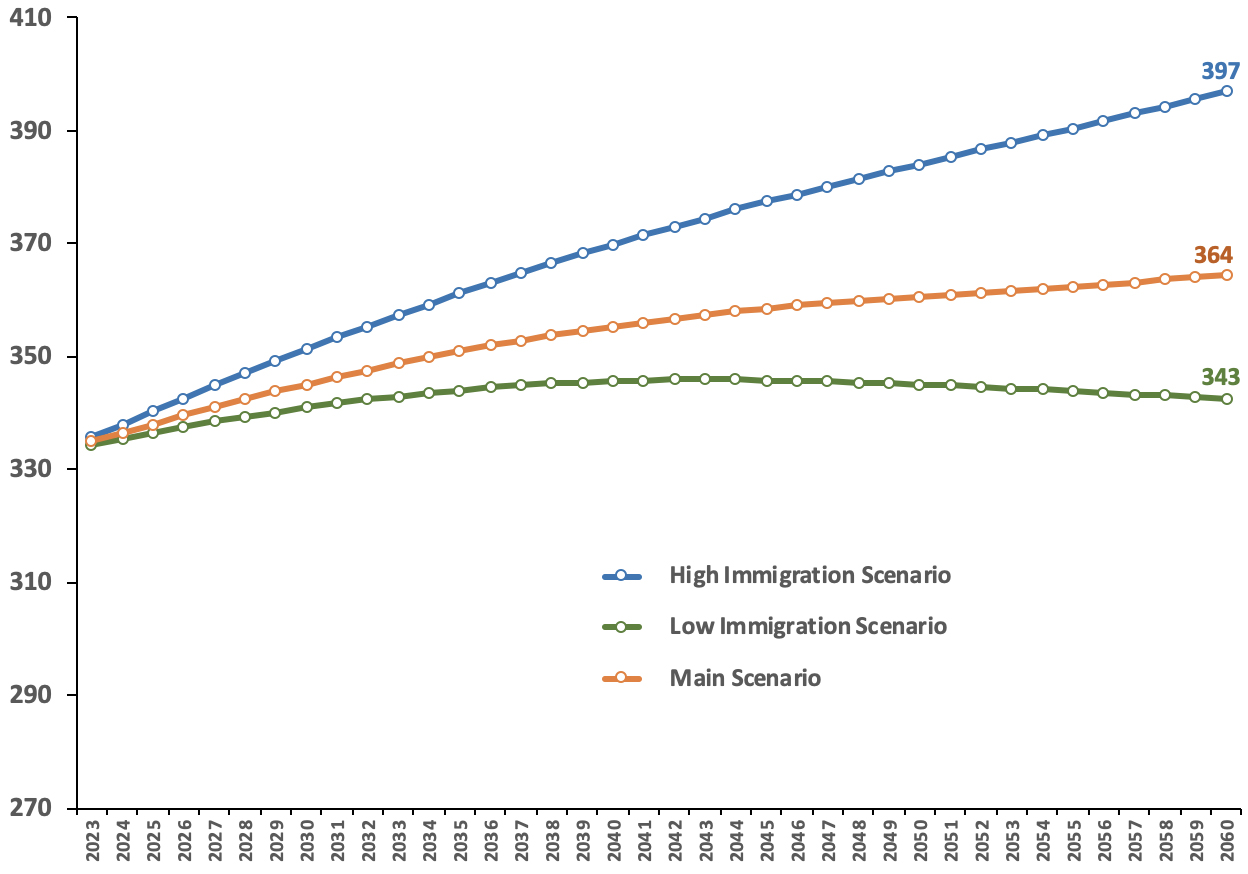
- Under the Bureau’s “low” immigration scenario, which is much lower than the current level, the U.S. population would rise from 333 million today to 343 million in 2060.1
- Under the “high” immigration scenario, the U.S. population will reach 397 million in 2060. The high scenario, which assumes 1.6 million annual net international migration — the difference between the number coming vs. leaving — better reflects the current situation.2
- The Bureau’s “main” or middle immigration scenario assumes migration is roughly half the high level. The main projection, which they emphasize, does not reflect the ongoing border crisis.3
- The primary reason immigration has become the overwhelming driver of population growth is because the Bureau assumes birth rates will remain low and deaths rates will continue to be higher than in their prior projections released in 2017. The Bureau is implicitly assuming that no set of policy interventions will stem the rise in deaths among younger people due to such factors as obesity, suicide, and overdose.4
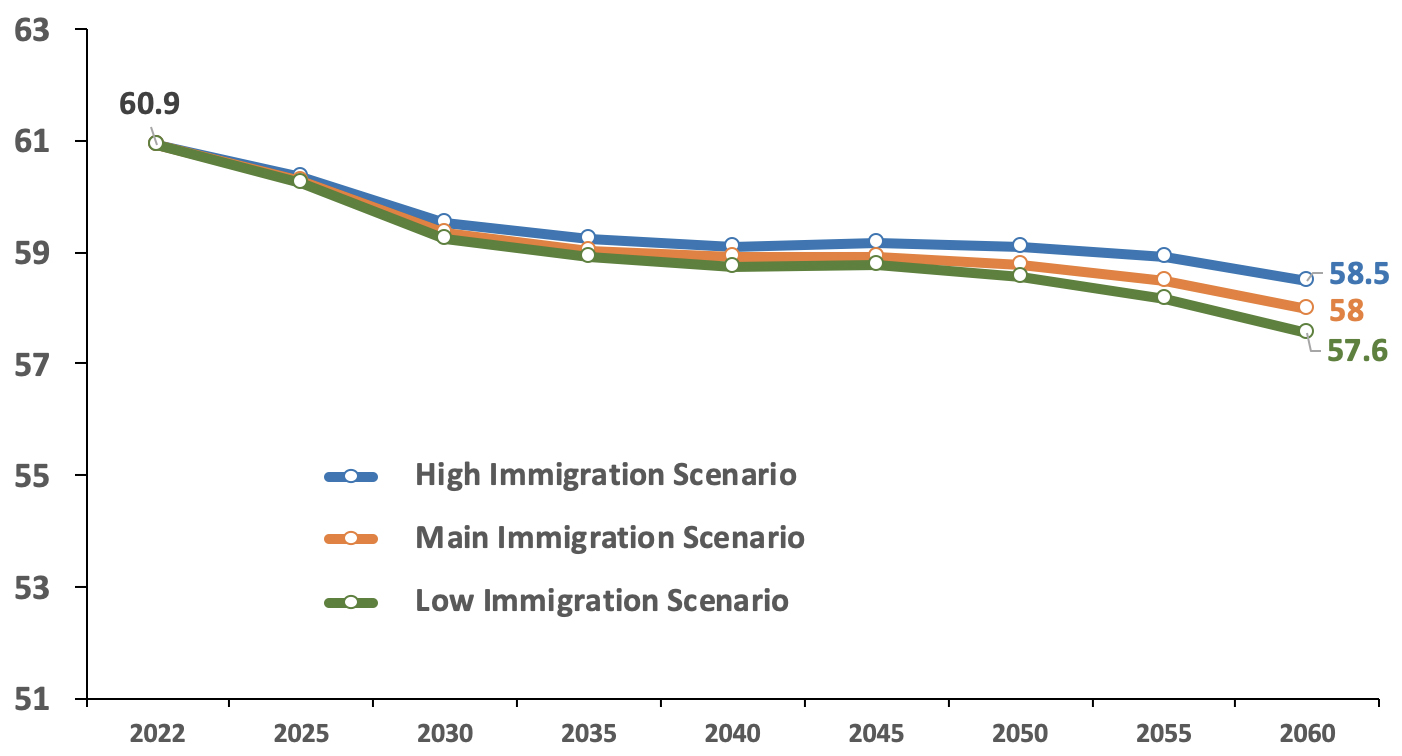
- Even as immigration grows the population, however, it increases the working-age (18 to 64) share of the population by only a small amount. In the low immigration scenario, 57.6 percent of the population will be working-age in 2060, compared to 58.5 percent in the high immigration scenario.5
- The Bureau’s new projections extend all the way to 2100. This super-long-term forecast generates the somewhat alarmist headline in the press release, “population projected to decline”. This decline is not supposed to happen until 2081. Even then, the decline is just 1 percent by 2100.6
- Even the Bureau’s low immigration scenario shows that the population will grow until 2043 and then decline by a mere 1.2 percent in the following 20 years. Even by 2100, the population would still be slightly larger than it was in 2014 under the low immigration scenario.7
- A smaller population would certainly create challenges. However, a roughly stable population or a modest decline would also help reduce congestion, traffic, sprawl, and pollution, including greenhouse gases. And it would make housing more affordable.
Further Discussion
The Bureau’s NIM Projection Ignores Its Own Estimates. The Census Bureau’s assumption in its main projection is that net international migration (NIM) is currently 850,000 a year and will increase very slowly over the next century. Putting aside what will happen in the decades to come, the current estimate for NIM is almost certainly too low for a number of reasons. The new figure ignores the bureau’s own NIM projections of slightly over one million released as part of their 2022 population estimates less than a year ago. The seemingly low level the Bureau uses for NIM in the new projections is all the more surprising because in a blog published with the estimates they show that they consistently underestimated NIM for the entire prior decade. The revised estimate they released at that time increased NIM by two million from 2010 to 2020. The Census Bureau blog itself projected a NIM of 1.01 million for 2022 and was titled, “Net Migration Between the United States and Abroad in 2022 Reaches Highest Level Since 2017”, an indication that immigration has picked up significantly since Covid. As we pointed out at the time, even this revised number was almost certainly too low. Yet, they still chose to assume that NIM is currently 850,000.
The Bureau’s NIM Assumption Ignores the Survey Data. In addition to seemingly contradicting its own estimate of NIM, the Current Population Survey Annual Social and Economic Supplement (CPS ASEC), which the Census Bureau collects, shows an increase of two million between March 2022 and March 2023, which implies net migration of at least 2.3 million immigrants when mortality is taken into account.8 The only caveat about this number is that there is a margin of error of 550,000 in the foreign-born number in the CPS ASEC, assuming a 90 percent confidence level. But even assuming a high value in 2022 and low value in 2023, it still shows growth of about 900,000 and net migration of roughly 1.2 million, which is still well above the 850,000 the Bureau is assuming for all NIM. The problem with the way the Census Bureau approaches migration in the new projections can also be seen by simply looking at the size of the foreign-born population, which the new projections show at 47 million in July 2023. However, the CPS ASEC shows it was already 48.8 million in March of this year.9
The largest Census Bureau Survey is the American Community Survey (ACS), but the latest version is only from 2022, and reflects the population in July of that year. It shows growth of about 900,000 between 2021 and 2022, which implies net migration of 1.2 million once mortality is taken into account.10 This is still much larger than the 850,000 from the Bureau’s main immigration scenario.
The Bureau Is Not Taking Account of the Border Crisis. The reason immigration is so high is in large part due to the ongoing border crisis, with 2.6 million inadmissible aliens released into the United States since January 2021 and an additional 1.5 million border “got-aways” — those observed entering illegally but not stopped — over this same time period.11 These figures significantly exceed any prior figures in the last 20 years. Legal immigration has also rebounded dramatically since Covid. All of this has caused NIM to increase significantly.
The Zero Immigration Scenario. The Census Bureau includes a “zero immigration scenario” with its new projections, but it is not clear how valuable it is. For one thing, it assumes that no new people will enter, which is practically and politically extremely unlikely. Further, while it assumes that no one enters the country, it combines this with substantial outmigration — 10 million by 2045. This does not make much sense in our view.12
Figure 1. The size of the U.S. population varies significantly assuming different immigration levels through 2060 (in millions) |
 |
|
Source: All figures are from the Census Bureau's new population projections issued in November 2023; see Tables np2023-a and np2023-b. The low immigration scenario assumes total net immigration of 18.4 million by 2060, the main scenario assumes 34.6 million by 2060, and the high scenario assumes 59 million by 2060. |
Figure 2. The level of immigration has only a small impact on the working-age share of the U.S. population in 2060 (in millions) |
 |
|
Source: All figures are from the Census Bureau's new population projections issued in November 2023; see Table np2023-d. The low immigration scenario assumes total net immigration of 18.4 million by 2060, the main scenario assumes 34.6 million by 2060, and the high scenario assumes 59 million by 2060. |
End Notes
1 Table np2023-a, which is part of the new population projections, shows the total U.S. population under each immigration scenario and Table np2023-b shows the migration assumptions under each immigration scenario.
2 See end note 1.
3 See end note 1.
4 To see Census Bureau estimates of mortality going back to 2001, see Table 3 in this recent Center for Immigration Studies publication. Also, comparing Table 13 (Excel Table np2017-t13) from the 2017 population projections to Table np2023-t13 in the new 2022 projections shows the lower fertility and higher death rate assumptions used in the new “main” series projections relative to old projections.
5 See Excel table np2023-d (second sheet with percentages), which is part of the new population projections, for the working age share.
6 Table np2023-a, which is part of the new population projections shows the total U.S. population under each immigration scenario.
7 Excel table np2023-a in the new population projections shows a U.S. population of 319 million in 2100 under a low immigration scenario, which is larger than the 318.4 the Census estimated for the U.S. population in 2014.
8 These figures come directly from our analysis of the public-use data of the CPS ASEC shown in the linked CIS blog. The Census Bureau also publishes the foreign-born population based on the survey each year in the ”Health Insurance Coverage in the United States” annual report. Table A-1 in the appendix of the report has the total foreign-born population. The survey asks about health insurance in the prior calendar year, so the figures in the table for the total 2021 foreign-born population are based on the 2022 CPS ASEC, and coverage in 2022 is based on the 2023 survey. Based on the characteristics of the foreign-born, there are six deaths per thousand in the existing population each year, or about 280,000. Net migration can be calculated by adding growth in the foreign-born population, in this case two million, to deaths for the estimate of roughly 2.3 million.
9 See end note 8.
10 The 2021 ACS showed a foreign-born population of 45.3 million and the 2022 ACS showed 46.2 million, for an increase of about 900,000. See Excel Table 1 in this report. Assuming six deaths per thousand would add 270,000 to this number for net migration of the foreign-born of roughly 1.2 million per year. As we have pointed out in the report linked in this end note, for reasons that are unclear both the CPS ASEC and the monthly CPS without the supplement both show significantly more growth in the immigrant population than the ACS.
11 From January 2021 through July 2023 there have been more than seven million “encounters” at U.S. borders. There has never been a 2.5-year period with this many encounters, which in the past were referred to as “apprehensions”. The administrative data that is probably the most relevant to growth in the illegal immigrant population and the thus the U.S. population is the number of inadmissible aliens released into the United States. Court records and other information on Department of Homeland Security (DHS) websites indicate that about 2.6 million (possibly 2.7 million) inadmissible aliens have been released into the country since the start of the Biden administration. Former immigration judge and Resident Fellow in Law and Policy at the Center for Immigration Studies Andrew Arthur has estimated this number based on information released by DHS to comply with a disclosure order in Texas v. Biden (Northern District of Texas, Amarillo Division, Case No. 2:21-cv-00067-Z), as well as limited information at the CBP “Custody and Transfer Statistics” web page and ICE’s “Detention Management” web page. All of these individuals represent new additions to the U.S. population.
12 See Excel table np2023-b, which is part of the new population projections.
