Introduction
The United States is currently experiencing the largest sustained wave of immigration in its history, with 800,000 to 900,000 legal immigrants arriving each year. In addition, the Immigration and Naturalization Service (INS) estimates that 420,000 illegal aliens settle in the country annually.1 The current influx has caused the foreign-born population to grow from 9.5 million, or roughly 5 percent of the nation¹s population, in 1970, to 27 million, or roughly 10 percent of the population, today.
While a good deal of research has been devoted to the demographic, cultural, economic, and fiscal impacts immigration has on the U.S. population, almost no attention has been paid to the effect immigration has on the distribution of political power in the country. Because immigrants tend to settle unevenly across the country — 75 percent live in just six states — immigration causes the population in some states to grow more rapidly than in others. Since House seats are apportioned to each state based on the state's population relative to the rest of the country, and all persons — citizens, legal immigrants, and illegal aliens - who are counted in the decennial census are included in the apportionment calculations, immigration is having a significant effect on the distribution of seats in the House.
This study uses population data and projections to indicate which states are losing seats in the House of Representatives as a direct consequence of the immigration that took place in the 10 years prior to the 1990 and 2000 censuses. Separate estimates are also provided for the impact of illegal immigration on the apportionment of House seats. The projections reveal that a total of 13 seats have changed hands after the last census or will do so after the next census due to immigration. In the 2000 apportionment, Colorado, Kentucky, Michigan, Mississippi, Ohio, Pennsylvania, and Wisconsin are each projected to have one fewer seat than they would have had if there had been no immigration after 1990. This is slightly larger than the six-seat redistribution by immigration after the 1990 census, when Georgia, Kentucky, Louisiana, Michigan, Montana, and Ohio were each apportioned one fewer seat because of 1980s immigration. Since the influence of a state in the House is, to a large extent, determined by the size of its delegation, immigration is not simply redistributing seats; it is also redistributing political influence in Washington.
In 1979, the Federation for American Immigration Reform (FAIR) sued to enjoin the Census Bureau from counting illegals in the decennial census of 1980 (FAIR v. Klutznick, 486 Supp 564, D.D.C. 1980). The case was ultimately dismissed by the Supreme Court on the grounds of lack of standing. In 1988, a similar suit filed by FAIR, 40 members of Congress, and the commonwealth of Pennsylvania was also dismissed. At the current time, it is assumed that all persons residing in the United States, including those here illegally, will be counted for purposes of apportionment in the 2000 census.
Methodology
The reapportionment of House seats is, of course, a zero sum proposition; one state¹s gain is another¹s loss since the number of voting members in the House has remained unchanged since 1911, when Congress voted to fix membership at 435 seats. While the number of seats could be increased by Congress (the Constitution does not specify the size of the House), a strong institutional norm has developed against any further increase. Thus, every 10 years the 435 seats have to be reapportioned among the states. Of course, even if Congress were to add additional seats, they would still have to be distributed so that high-immigration states gain proportionally the same number of seats as they would if the number remained at 435.
To determine the distribution of House seats for 2000, we rely primarily on Census Bureau population projections to estimate both the total population in each state and the size of each state¹s recent immigrant population (Campbell, 1996). Our numbers for state populations in 2000 are slightly higher than those of the Census Bureau, however, because we relied on the INS¹s estimates of illegal immigration, not those of the Census Bureau.2 For the 1990 census, we use the actual Census Bureau counts for both the total population in each state and to determine the size of the immigrant population that arrived in the 1980s. Our estimates for the size of the illegal alien population enumerated in the 1990 census are derived from estimates developed by the INS.3
To estimate the impact of immigration in the 1990 and 2000 censuses, three separate population scenarios are developed. The first includes the entire state population;4 the second excludes all immigrants who arrived in the 10 years prior to the Census; and the third excludes only illegal aliens — legal immigrants remain in the count. Once the population projections were made for each state, we calculated the distribution of House seats that would result under each scenario, thereby determining the impact of immigration on the size of each state¹s delegation in the House.
Immigration's Effect on House Seats
Table 1 (on page 2; and Maps 1, 2, and 3 on pages 6 and 7) reports the estimated redistribution of seats that is attributable only to immigration (legal and illegal) between 1980 and 2000. The states that lose seats because of immigration are listed in the top portion of the table and those that gain seats are listed in the lower portion. The first two columns show the change in House seats that has occurred or will do so because of immigration in the decade prior to each census. The last column shows the total loss or gain for each state over the 20-year period. The findings in Table 1 indicate that immigration is having a substantial effect on the distribution of seats in the House.
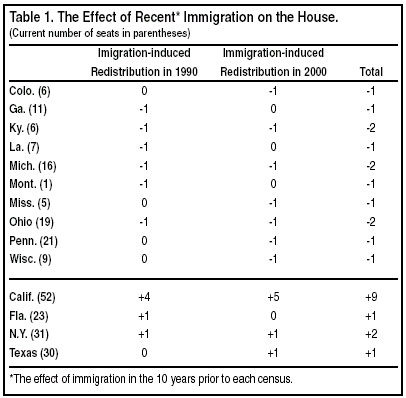
Looking at the year 2000 first, we find that seven states will be negatively effected in the next census: Michigan, Mississippi, Ohio, Pennsylvania, and Wisconsin each lose one seat that they currently have and Colorado and Kentucky both fail to gain a seat that they otherwise would have had there been no immigration after 1990. Of course, whether a state loses one of its current seats or fails to gain a seat, the end result is the same — less influence in Washington. In 1990, immigration in the 10 years prior to the census caused Louisiana, Michigan, Montana, and Ohio to each lose a seat, while Georgia and Kentucky both failed to gain a seat.
The totals found in the third column indicate that numerically Kentucky, Michigan, and Ohio are losing the most from immigration, with each state losing two seats over the 20-year period. Of course, the relative impact on each state cannot simply be measured by the number of seats lost. For example, while numerically equal to Michigan and Ohio, the two seats lost by Kentucky represent a third of that state's current apportionment. In contrast, the losses suffered by Michigan and Ohio represent 12.5 percent and 10.5 percent respectively of those states current apportionment of seats. Proportionately, Montana is the biggest loser in both censuses because the one seat it lost in 1990 represented half of its apportionment at that time. In contrast, California is a big winner, gaining most of the seats lost by other states: In 1990 and 2000, it gained or is projected to gain a total of nine seats because of immigration. In fact, all of the seats California will gain after the 2000 census are the result of 1990s immigration, without which the state would actually lose a seat.
It is worth noting that none of the states that will lose a seat because of immigration in the next census are declining in population. Together, these states have grown by over 100,000 residents per year in the 1990s and will have over one million more residents in 2000 than they had in 1990. While more people will be living in these states in 2000 than in 1990, the even more rapid (and immigration-fueled) population growth in other states is causing them to lose seats. As a result, in the states that lose seats, as well as in the country as a whole, immigration-induced population growth creates ever-more populous districts, with all that this implies about making representatives more distant from their constituents.
There is an element of irony in the loss of political representation suffered by Michigan and Ohio in particular, because Senators Spencer Abraham (R-Mich.) and Mike DeWine (R-Ohio) are two of the most passionate proponents of high immigration in Congress. In 1996, for example, Sen. Abraham successfully led the fight to defeat legislation that would have reduced legal immigration modestly. Sen. DeWine has also vigorously defended high immigration, both as a member of the House and now as a Senator. Perhaps other considerations outweighed the loss of political influence suffered by Michigan and Ohio as a result of the policies favored by these Senators. But as our estimates make clear, their support for high immigration is not in the longer-term political interests of their respective states.
Table 2 (on previous page) provides estimates for the impact of the entire illegal alien population. The table should be read as follows: If illegal aliens are included in the 2000 census, Michigan, Pennsylvania, and Wisconsin will each lose one seat and Maryland will fail to gain a seat, while California will gain three seats and Texas one seat. Because the table reports the effect of the entire illegal population at the time of the census and not just the effect of illegals who arrived in the 10 years prior to it, it is not directly comparable to Table 1. That is, it is not correct to view Table 2 as showing that three of the six seats redistributed by recent immigration in 1990 and four of the seven redistributed in 2000 are the result of illegal immigration.5 Also, because Table 2 reports the effect of all illegals, it is not appropriate to add the two censuses together to arrive at a total figure. If a total figure is desired, then it is probably best to think of the numbers reported for the 2000 census as representing the effect of all illegal aliens who arrived in the last few decades.

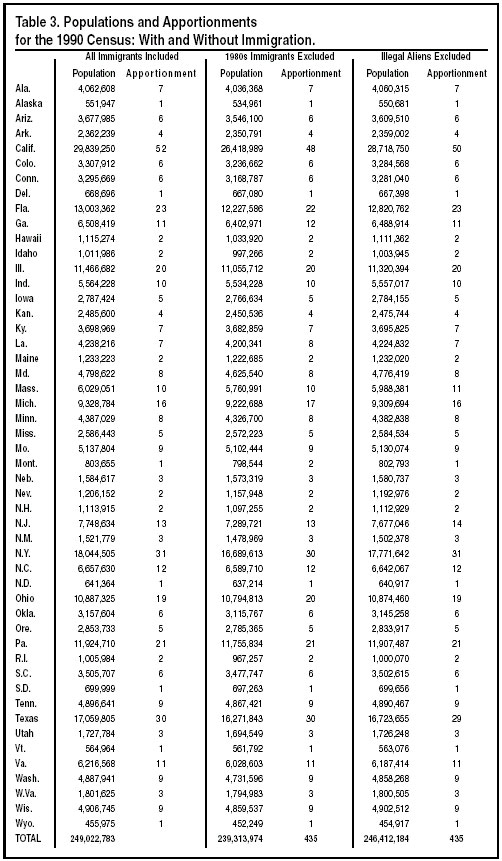
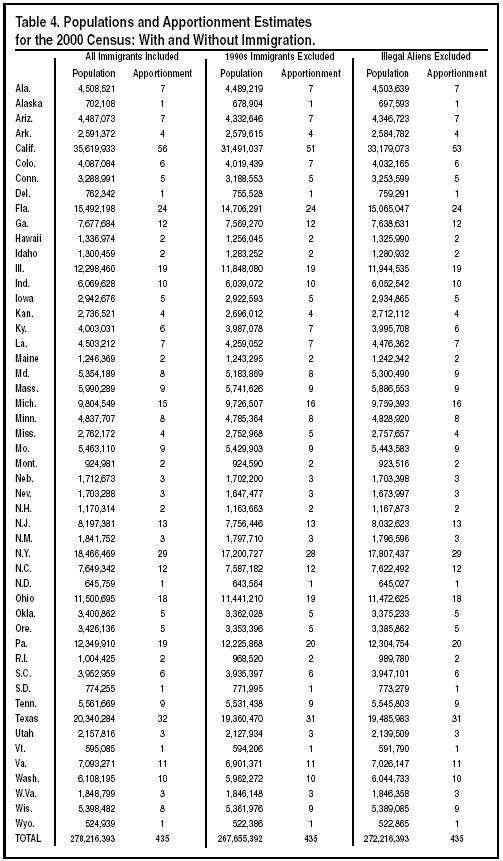
Tables 3 and 4 (on pages 7 and 8) show the state-by-state population projections that create the results in Tables 1 and 2. The first column in Table 3 reports state-by-state population figures for 1990 — all immigrants are included. The second column shows the number of House seats apportioned to each state after the 1990 Census.6 The third and fourth columns show the state populations if 1980s immigrants are excluded and the resulting apportionment of House seats. The fifth column shows state populations if all illegal aliens are excluded, and column six reports the corresponding distribution of House seats. The same pattern is repeated in Table 4 for the 2000 census.
Tables 3 and 4 indicate that the 13 seats that change hands because of immigration represent a substantial reordering of the political landscape. For comparison, consider that, based on Tables 3 and 4, a total of only 31 House seats were reallocated in 1990 or will be in 2000 for all reasons. Thus, the 13 seats that change hands in the two censuses because of immigration are equal to nearly half of the total change that has or will occur. Thus, immigration is clearly one of the most important reasons for the redistribution of House seats. It is important to note that this does not mean that 13 of the 31 seats redistributed in 1990 and 2000 are the result of immigration. Because immigration redistributes seats not just by taking seats away from some states, but also by causing New York to retain a seat it otherwise would have lost, it is not possible to directly attribute 13 of the 31 seats that change hands to immigration. What these numbers do indicate, however, is that the effect of immigration is very large in comparison to the total redistributions of 1990 and 2000.
Reducing Citizens' Voting Power
Perhaps as important as the redistribution of political power that comes with mass immigration, however, is the way immigration might be seen as distorting democracy. An examination of the states involved indicates that immigration takes away representation from states composed almost entirely of citizens and redistributes it to states with large numbers of non-citizen immigrants who cannot vote. For example, in the seven states that will either lose or fail to gain a seat in 2000 because of 1990s immigration, the latest Census Bureau survey indicates that more than 98 percent of the residents are citizens. In contrast, in the states that will gain seats from immigration, one in seven residents is now a non-citizen.7 This makes immigrant-induced reapportionment of House seats different from the reapportionment that occurs when citizens relocate to another state. High immigration produces a situation in which American citizens lose representation in Congress so that non-citizen immigrants, none of whom can vote and many of whom are illegal, can be "represented" in the House.
Consider the case of Michigan, one of the states losing the most because of immigration. In 1996, 226,000 votes were cast in the typical congressional race. Compare this to the total vote of 55,624 in the immigrant-heavy 33rd district of California, or the 73,361 votes cast in the 30th district, or the 51,288 votes cast in the 25th district of Texas. In 1996, it only took about one-quarter as many votes to elect a representative in some high-immigrant districts in California and Texas as it did in the average Michigan district. There are a total of 11 districts in California and seven in Texas where the total number of votes cast in 1996 was less than half the number cast in the typical Michigan district.
The small number of votes cast in many California and Texas districts is almost entirely a by-product of mass immigration. In a number of districts, the majority of adults are non-citizens, and therefore illegible to vote. In California alone, there were nearly six million non-citizens in 1997, enough to create seven or eight congressional districts. As a practical matter, this situation gives significantly more political power to voting citizens living in districts made up almost entirely of non-citizens. In effect, the ballots of voters in high-immigrant districts carry far more weight than the ballots of voters who live in districts made up almost entirely of citizens. This seeming contradiction of the principle of "one man one vote" exists because the courts have interpreted this principle to mean that districts should be equal in total population — not in eligible voters. If mass immigration continues, this situation may only get worse.
Conclusion
Given the large number of immigrants now entering the country and their concentration in a handful of states, it is inevitable that immigration will exact a political cost from those states that receive relatively few immigrants. Because family relationships and existing cultural ties determine where immigrants live, it is highly unlikely that there will be a substantial change in the settlement patterns of immigrants. Thus, immigrants will continue to concentrate in only a few states, and this in turn will continue to shift political power in the House of Representatives as well as the Electoral College. It should be added that the projections in this Backgrounder significantly understate the effects of immigration on congressional representation because they do not include estimates for the effect U.S.-born children of immigrants have on the distribution of House seats. If such estimates were included, the impact of immigration would be even greater.
It is important, when making decisions regarding immigration policy, to take into account not only the economic, fiscal, cultural, and demographic impacts of immigration, but also the political impact, part of which is the realignment of power in Congress away from states receiving relatively few immigrants. In addition to this realignment, careful consideration should also be given to the loss of representation suffered by citizens in low-immigration states so that districts composed largely of non-citizen immigrants who cannot vote can be created in high-immigrant states.
Since the size of the redistribution is a direct consequence of the level of immigration, a more moderate level of immigration would produce less immigration-based reapportionment. Given the apparent remoteness of the other effects of immigration on low-immigrant states, residents of such states and their elected representatives need to be particularly sensitive to the political costs of immigration.
Bibliography
Balinski, Michael L., and H. Peyton Young. 1980. "When House Seats Shift, Fractions Count." The Washington Post (November 30): D5.
Balinski, Michael L., and H. Peyton Young. 1982. Fair Representation: Meeting the Ideal of One Man, One Vote. New Haven: Yale University Press.
Campbell, Paul R. 1996. "Population Projections for States by Age, Sex, Race and Hispanic Origin, 1995 to 2025." U.S. Bureau of the Census, Population Division, PPL-47.
Davis, Sam T. 1981. "Reapportionment: Numerical Politics." American Demographics (November): 24-29.
Entin, Jonathan L. 1993. "Legal Considerations in Census Planning." Pp. 157-165 in International Union for the Scientific Study of Population, International Population Conference, Montreal 1993. Liege, Belgium: IUSSP.
Huntington, Edward V. 1920. "A New Method of Apportionment of Representatives." Quarterly Publication of the American Statistical Association 17: 859-870.
Poston, Dudley L., Jr. 1997. "The U.S. Census and Congressional Apportionment." Society 34 (March/April): 36-44.
Poston, Dudley L., Jr., Leon F. Bouvier, and Hong Dan. 1997. "The U.S. Census and Congressional Apportionment: Implications for Texas in the Year 2000." Paper presented at the annual meeting of the Association of American Geographers, Fort Worth, Texas, April 4.
Schmeckebier, Laurence F. 1941. Congressional Apportionment. Washington, D.C.: The Brookings Institution.
Schmitt, Eric. 1997. "Illegal Immigrants Rose to 5 Million in '96." The New York Times (February 8): 7.
Skerry, Peter. 1993. Mexican Americans: The Ambivalent Minority. New York: The Free Press.
U.S. Bureau of the Census. 1996. "The Plan for Census 2000." Position paper issued on February 28. Washington, D.C.: U.S. Bureau of the Census.
U.S. Immigration and Naturalization Service. 1996. Statistical Yearbook of the Immigration and Naturalization Service, 1996. Washington, D.C.: U.S. Government Printing Office.
Willcox, Walter F. 1916. "The Apportionment of Representatives." American Economic Review, Supplement 6: 1-16.
End Notes
Parts of this study are adapted from Poston (1997) and from Poston, et al. (1997).
1 The INS estimates that 420,000 new illegal aliens join the long-term illegal population each year. This number is offset by out-migration, deaths, and legalizations so that the long-term illegal population is estimated to grow by 275,000 each year (See the INS's 1996 Statistical Yearbook, page 198).
2 The INS's figure of 275,000 is somewhat higher than the 225,000 assumed by the Census Bureau (Current Population Reports P25-1130, page 28).
3 We assume that 83 percent of the illegal aliens estimated to reside in each state at the time of the 1990 census by the INS were enumerated in the 1990 census (1996 Statistical Yearbook; unpublished data provided by the Office of Policy and Planning of the INS).
4 As indicated above, for the purposes of apportionment all persons residing in a state at the time of the Census are counted including that portion of the state population residing abroad and all immigrants — including illegal aliens.
5 We did attempt to calculate the effect of illegal immigration in the 10 years prior to the 2000 census. Our preliminary results indicated that the effect is small, with one seat effected.
6 The population figures in the first column and the distribution of seats in the second column are the actual state population counts and apportionment of House seats for 1990. The population number may not precisely match some published figures because our numbers include residents living overseas at the time.
7 Based on authors' calculation of data from the March 1997 Current Population Survey.
About the Authors
Dudley L. Poston, Jr., is the head of the sociology department at Texas A&M University. Steven Camarota is a resident scholar at the Center for Immigration Studies. Leon Bouvier is a demographer and author. Godfrey Jin-Kai Li and Hong Dan are doctoral candidates at Texas A&M University.