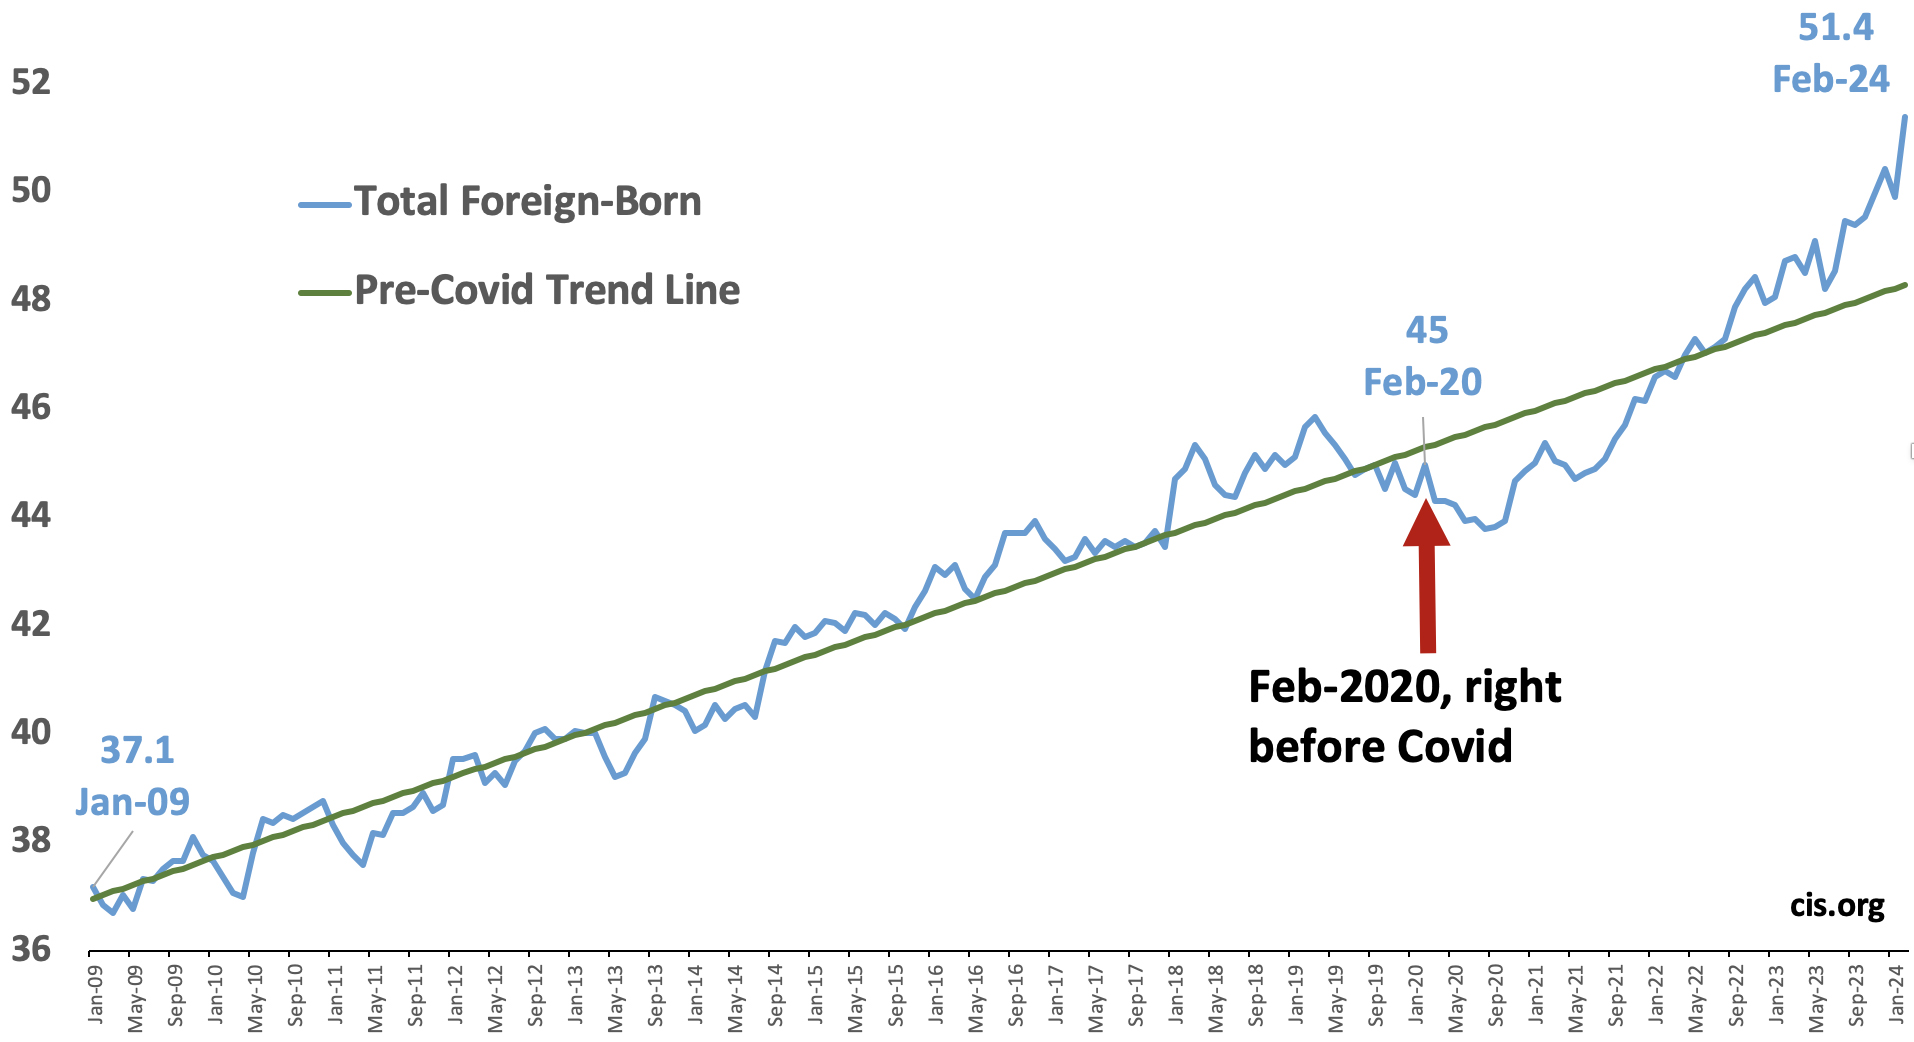
Analysis of the Census Bureau’s Current Population Survey (CPS) shows that the total foreign-born or immigrant population (legal and illegal) hit a new record high of 51.4 million in February 2024 — an increase of 6.4 million since President Biden took office. At 15.5 percent, the foreign-born share is also a new record in American history. Data such as border encounters and “got-aways” are clearly important, but they do not measure the number of immigrants actually living in the U.S., which is what ultimately determines the impact on the country. The enormous scale of immigration over the past three years has implications for nearly every aspect of American society, including public coffers, the labor market, schools, hospitals, and the balance of political power, to say nothing of whether we can assimilate this many people.
Among the findings:
- In February 2024, the foreign-born population in the United States hit a new high of 51.4 million and 15.5 percent of the U.S. population — surpassing all prior records.
- The foreign-born share of the U.S. population has more than tripled since 1970, nearly doubled since 1990, and is up 40 percent just since 2000.
- Since President Biden took office in January 2021, the foreign-born population has grown by 6.4 million — larger than the individual populations of 33 states.
- Growth in the foreign-born population is being driven primarily by immigration from Latin America, which has grown 4.2 million since January 2021, with South and Central America up 1.7 million and 1.4 million, respectively. Also, immigration from the Indian subcontinent is up 819,000 and from the Middle East is up 654,000.
- At 172,000 a month, the average increase in the foreign-born under President Biden is four times the 42,000 average monthly increase under Trump before Covid-19 hit and double the 68,000 average under Obama.
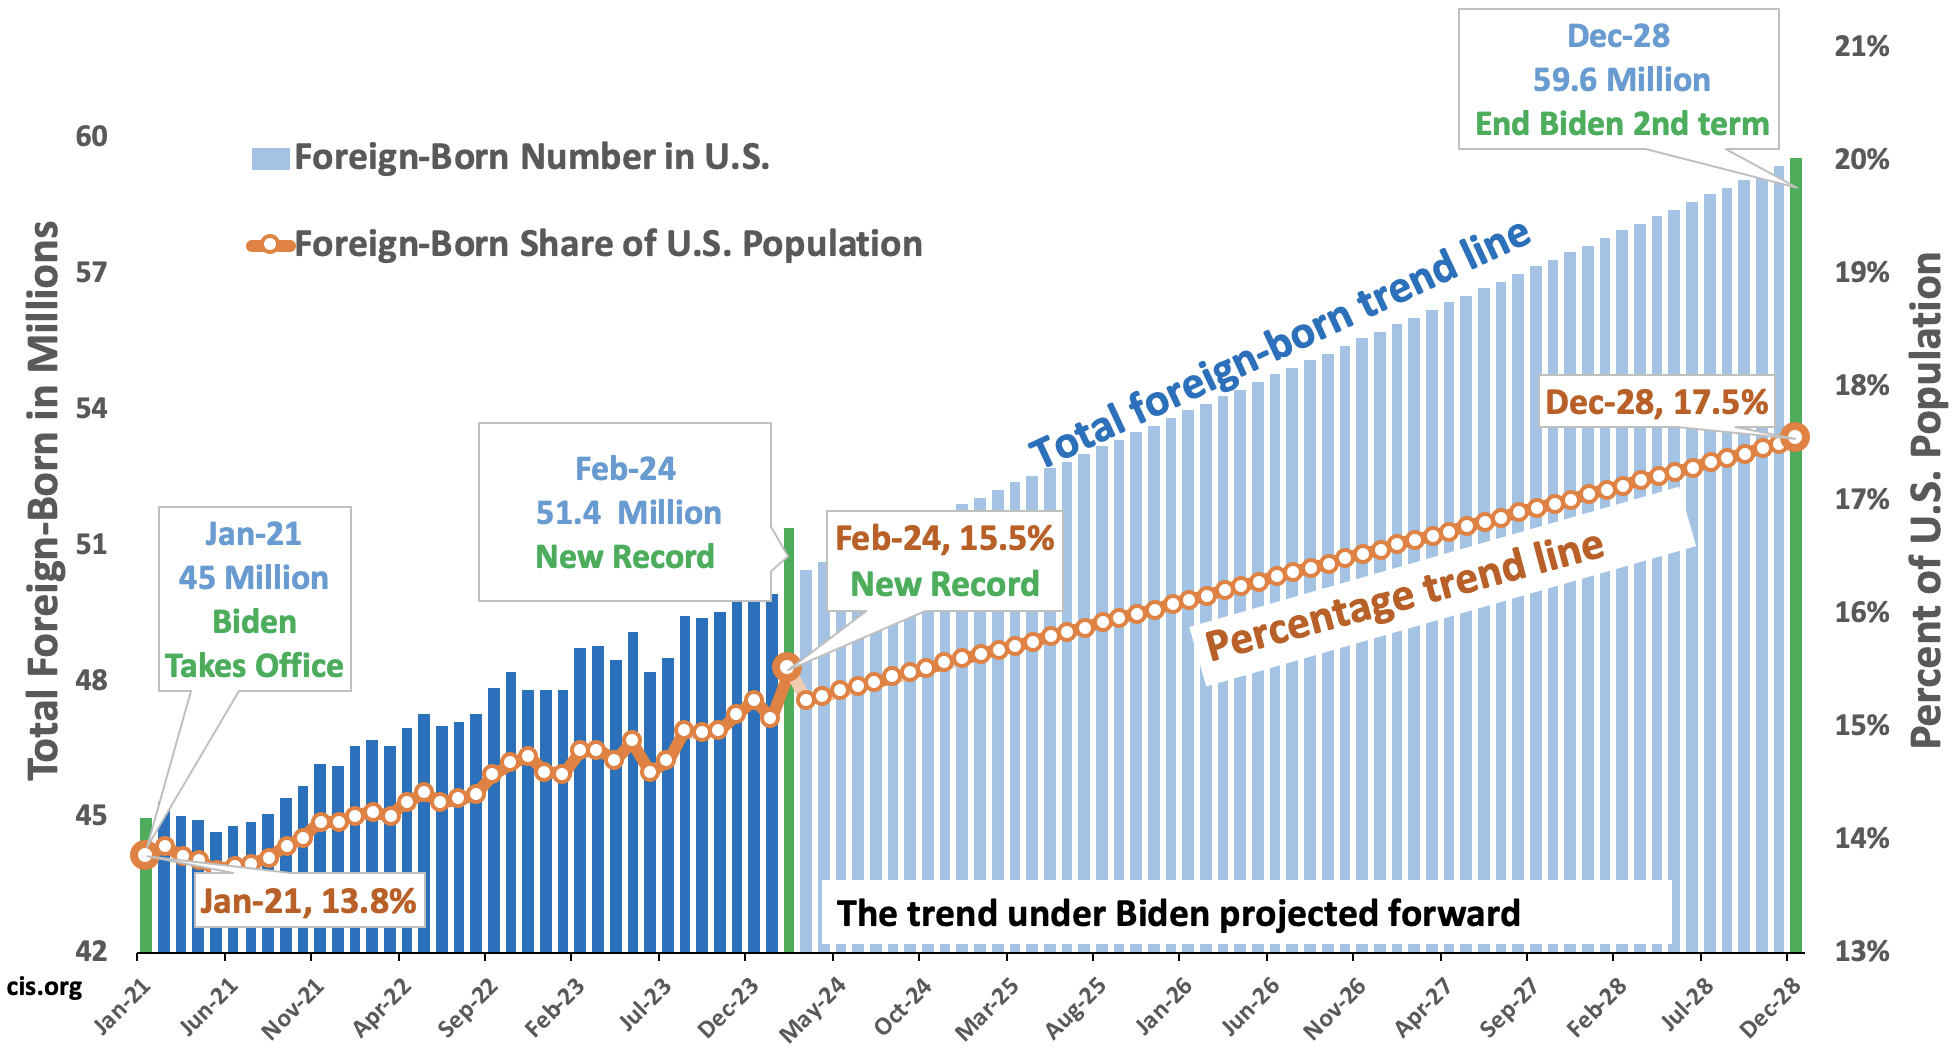
- If current trends continue, the foreign-born population will reach nearly 60 million and 17.5 percent of the U.S. population by the end of a second Biden term — both figures would be without any precedent in American history.
- We preliminarily estimate that more than half (3.7 million) of the 6.4 million increase in the foreign-born population since January 2021 is likely due to illegal immigration. If adjusted for those missed by the survey, the increase is larger.
- The 6.4 million increase overall and the 3.7 million possible increase in illegal immigrants are both net figures. The number of new arrivals was higher, but was offset by outmigration and natural mortality among the foreign-born already here.
- While a large share of the recent growth in the foreign-born population is due to illegal immigration, legal immigrants still account for roughly three-fourths of the total foreign-born population.
- Due in part to the illegal influx, the education level of new arrivals has declined. Of working-age (18-64) adults who arrived in the two years prior to February of this year, 44 percent had no education beyond high school, compared to 29 percent in 2018.
- The scale of immigration is so high that it appears to have made the Census Bureau population projections, published in November of last year, obsolete. The bureau projected that the foreign-born share would not reach 15.5 percent until 2039.
- In February 2024, the 31 million immigrant workers accounted for 19.3 percent of workers — both new record highs. Compared to February 2020, right before Covid, the number of immigrant workers is up 3.3 million, while the number U.S.-born workers is down by one million.
- The immigrant workers have made the nation’s aggregate GDP several hundred billion dollars larger. However, per-person GDP, not aggregate GDP, determines the standard of living. Immigration tends to lower per-person GDP because it causes the population to grow faster than the economy.
Introduction
This report is part of a series of recent reports (see here, here, and here) from the Center looking at the size and growth of the foreign-born population in the monthly Current Population Survey (CPS), sometimes referred to as the “household survey”. The CPS is collected each month by the Census Bureau for the Bureau of Labor Statistics (BLS).1 While the larger American Community Survey (ACS) is often used to study the foreign-born, the most recent version of the ACS reflects only the population through July 2022 and is now 19 months out of date. It does not fully reflect the ongoing border crisis and resulting surge in immigration. Using the monthly CPS allows for a much more up-to-date picture of what is happening, though there is an undercount of the foreign-born in all Census Bureau surveys. In the Appendix, we discuss the ACS compared to the CPS.
We use the terms “immigrant” and “foreign-born” interchangeably in this report.2 The foreign-born as defined by the Census Bureau includes all persons who were not U.S. citizens at birth — mainly naturalized citizens, lawful permanent residents, long-term temporary visitors, and illegal immigrants. The CPS shows a dramatic rebound in the foreign-born population after declining some in the latter half of 2019 followed by a dramatic fall-off in 2020 during the Covid-19 travel restrictions. While the monthly CPS is a very large survey of about 130,000 individuals, the total foreign-born population in the data still has a margin of error of roughly ±565,000 using a 90 percent confidence level. This means there is fluctuation from month to month in the size of this population, making it necessary to compare longer periods of time when trying to determine trends.3
Growth in the Foreign-Born Population
Recent Growth in the Foreign-Born Population. Figure 1 reports the total number of foreign-born residents in the United States from February 2019 to February 2024. The figure shows that even though the economy was expanding in the months before the pandemic, the foreign-born population was trending down in the latter part of 2019. Once travel restrictions were imposed and Title 42 was implemented at the border, the immigrant population declined through the middle of 2020, hitting a low of 43.8 million in August and September of that year. While immigrants still arrived in 2020, out-migration and natural mortality seem to have been enough to cause a decline in the total immigrant population. Since the summer of 2020, the foreign-born population has rebounded dramatically by 7.6 million. However, it is likely that the foreign-born did not decline to the extent the CPS shows. Rather it seems likely that the falloff in 2020 was due, at least in part, to the difficulty in collecting data on the foreign-born during the pandemic. That said, even at the height of the pandemic the BLS stated that “Although the response rate was adversely affected by pandemic-related issues, BLS was still able to obtain estimates that met our standards for accuracy and reliability.” Nonetheless, it still seems likely that the undercount of the foreign-born in the CPS did increase during the pandemic. As a result, comparing data from 2020 to the present may produce growth that is overstated.
Figure 1. There are fluctuations in the data, but since President Biden's election, growth in the foreign-born has been unprecedented. (in millions) | |
 | |
Source: Center for Immigration Studies analysis of the public-use Current Population Survey (CPS) from February 2019 to February 2024. |
Growth in the Foreign-Born under Biden. By January 2021 the foreign-born population had roughly returned to the size it was in February 2020, right before Covid. Comparing President Biden’s first month in office, January 2021, to February 2024, the most recent data available, shows an increase of 6.4 million. This increase over just 38 months is unprecedented.4 It is roughly the growth in the foreign-born population in the nine years prior to Covid. Even concentrating on just the last two years shows that between January 2022, well after Covid, and February 2024, the total immigrant population grew by 4.8 million. What is so striking about all of these numbers is that they represent net changes, not merely a new inflow. The foreign-born population can only grow when immigrants arrive from abroad because all births to immigrants in the United States, by definition, add only to the native-born population. The new immigrants arrive and add to the total foreign-born population, but are offset by emigration and mortality among the existing immigrant population. This means that there must always be significantly more arrivals than the growth in the foreign-born population each year.
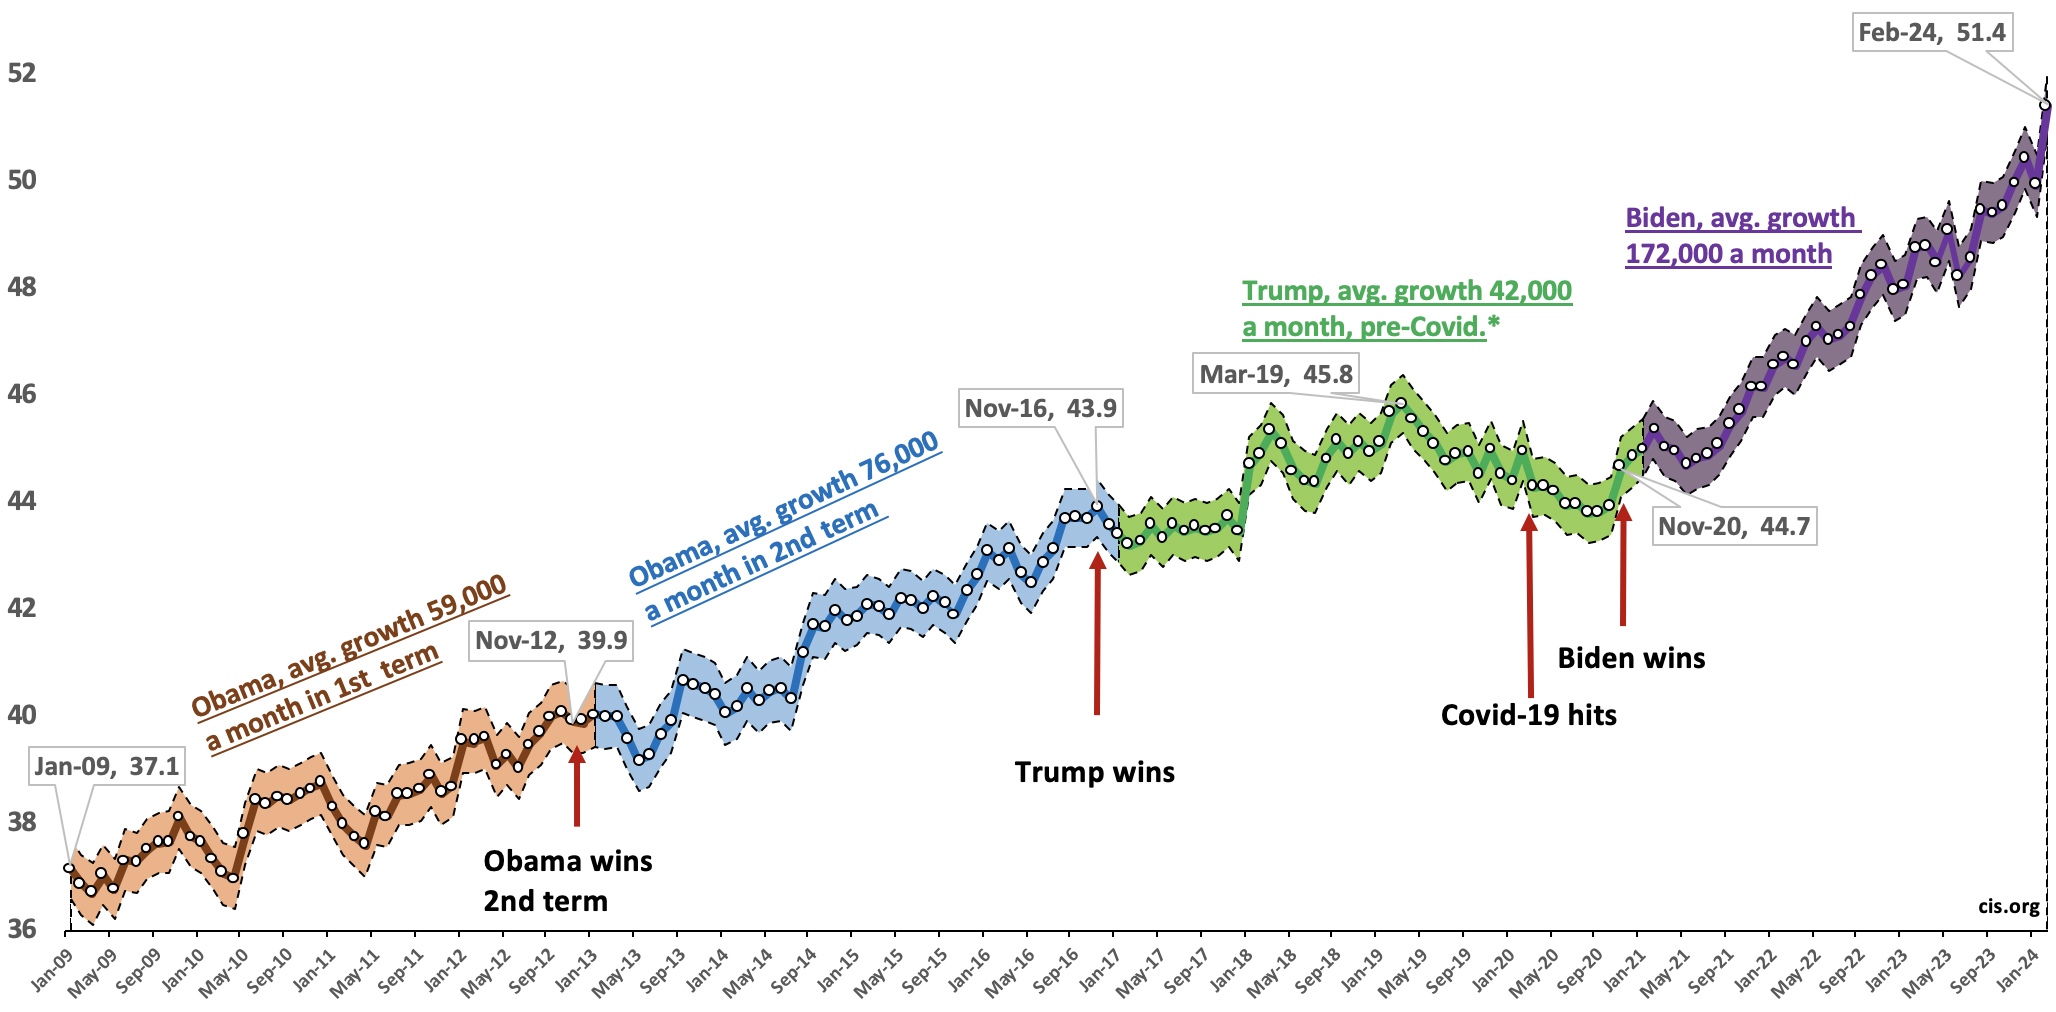
Biden Compared to His Immediate Predecessors. Figure 2 shows the size of the foreign-born population from the start of President Obama’s first term in January 2009 to February of this year, along with margins of error. There are clearly significant fluctuations in the size of the immigrant population over the last decade and a half. Short-term fluctuations almost certainly reflect the natural variability of the survey. But looking at each presidency shows that growth since the start of the Biden administration is dramatically higher than the increase during Trump’s or Obama’s time in office. So far it has averaged 172,000 a month since Biden took office compared to 42,000 a month during Trump’s presidency before Covid-19 hit — January 2017 to February 2020. The average increase during Biden’s presidency is more than double the 76,000 a month average during Obama’s second term and significantly more than double the average increase of 59,000 in Obama’s first term.5 If Obama’s presidency is taken as a whole, growth averaged about 68,000 per month. Averaging many months together reduces month-to-month fluctuation and shows that the pace of growth during the Biden administration has been spectacularly higher than his immediate predecessors.
Figure 2. The foreign-born population has grown dramatically faster during Biden's first three years than during Trump's presidency (pre-Covid) or Obama's. (in millions) | |
 | |
Source: Center for Immigration Studies analysis of the public-use Current Population Survey from January 2009 to February 2024, with shaded areas reflecting a 90% confidence interval. |
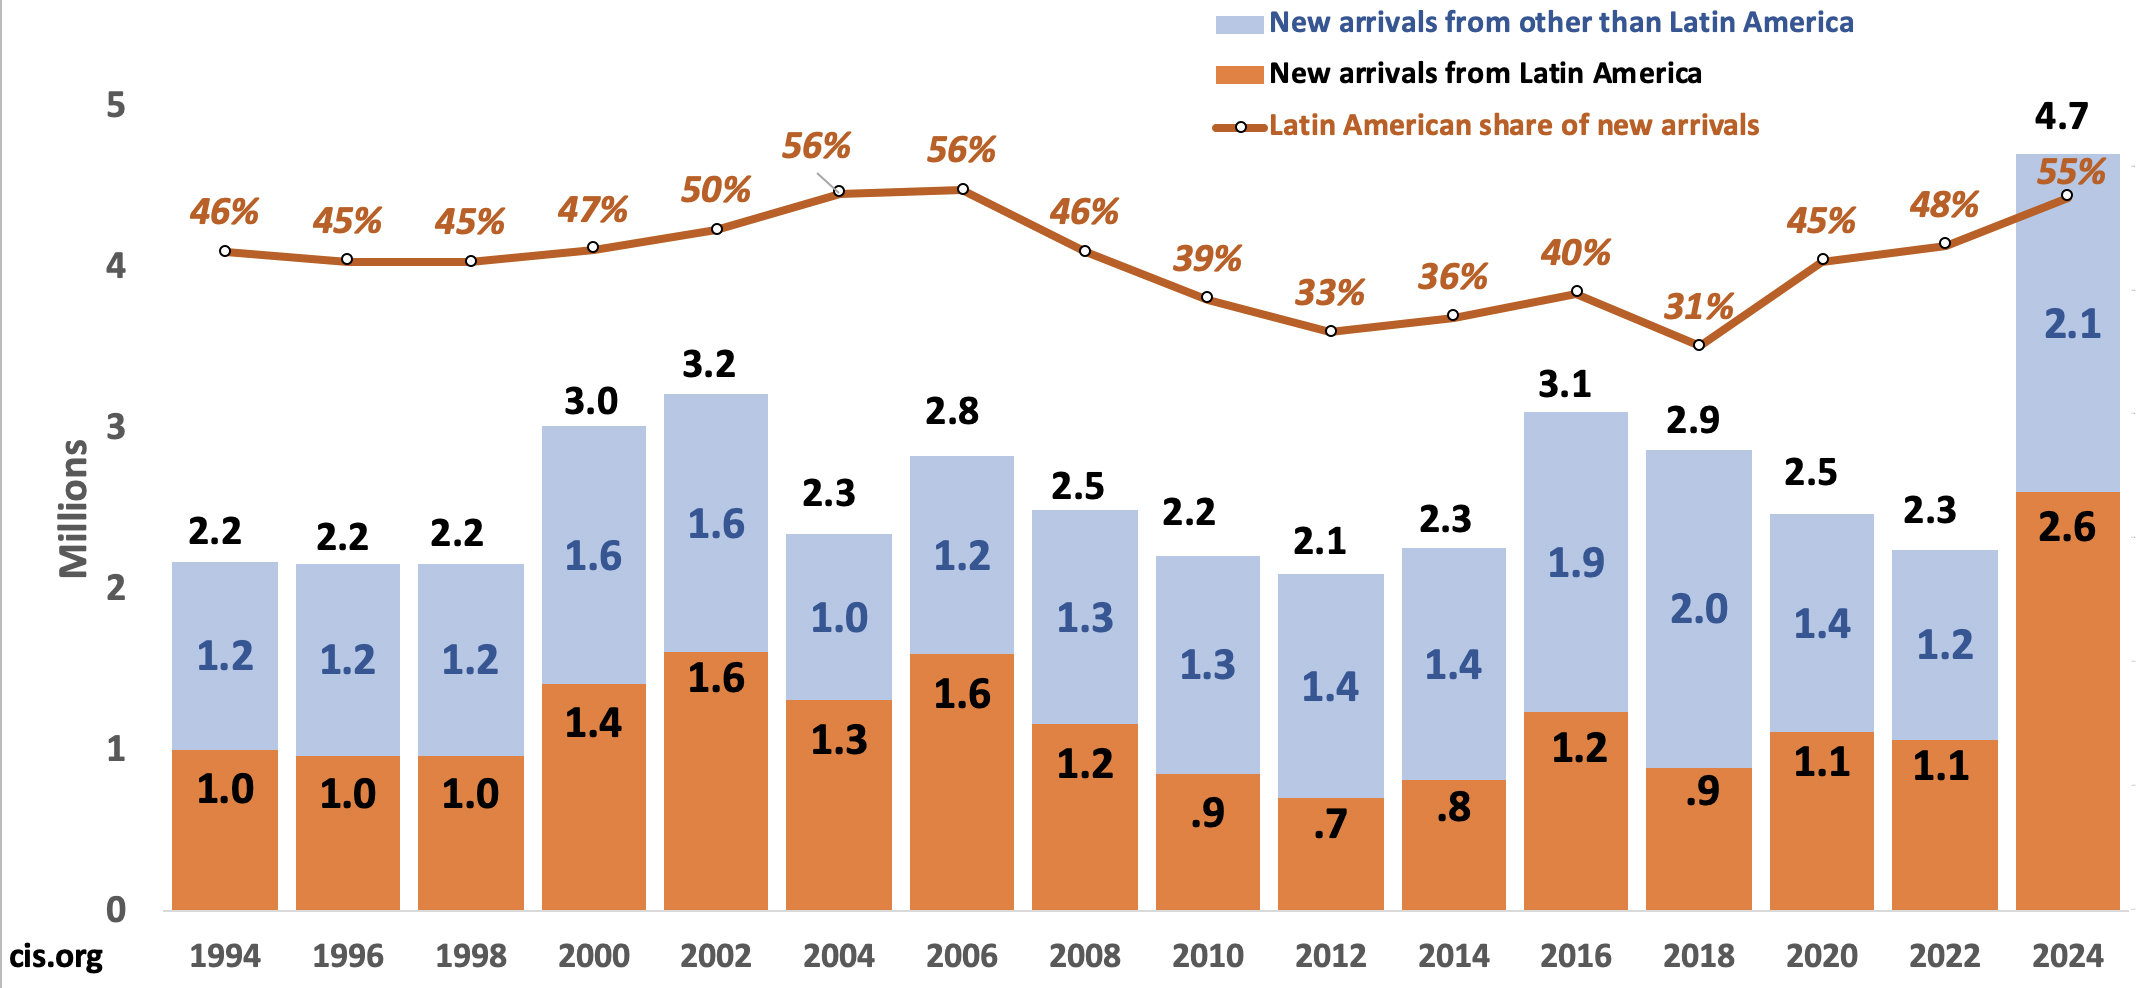
The Number of New Arrivals. Responses to the year-of-entry question in the public-use CPS can also provide some insight into the scale and composition of recent immigration. In even-numbered years like 2024, the most recent arrival cohort that can be identified is for the current year and the two prior years. (Responses to the year-of-entry question are grouped by the bureau into multi-year cohorts to preserve anonymity.) Figure 3 shows that 4.7 million immigrants indicated they arrived in 2022, 2023, and the first two months of 2024.6 This translates into about 2.3 million new arrivals on an annualized basis. The 4.7 million newcomers in the last two years is dramatically higher than at any time in the last 30 years, as measured by the CPS. In addition to the dramatic increase in new arrivals, the figure also shows that immigrants from Latin America accounted for more than half of newcomers in February 2024, something that has not been the case since 2006. Of course, Figure 3 also shows immigrants from the rest of the world surged dramatically in the last two years.
Figure 3. The number of new arrivals was dramatically higher in 2024 than any time in the last 30 years, with Latin Americans accounting for more than half of newcomers for the first time since 2006. (in millions) | |
 | |
Source: Center for Immigration Studies analysis of the public-use Current Population Survey (CPS) from February 1994 to February 2024 in even numbered years. |
Educational Level of New Arrivals. Figure 4 reports the educational attainment of working-age newly arrived immigrants, with newly arrived again defined as the current year and the two prior years. Education level is a key factor that determines everything from the type of jobs immigrants are likely to hold to their income and likely impact on taxpayers. As is true of the U.S.-born, immigrants with higher levels of education tend to do much better economically than those with modest levels of education. The figure shows that from 1994 to 2006 a much larger share of newcomers had no education beyond high school than had at least a bachelor’s degree. After 2006, there was a significant improvement in the education level of the foreign-born overall, so that by 2012 a higher percentage had a college degree than had no more than a high school diploma. However, starting in 2020 the education level of new immigrants began falling significantly, so that by 2024 the share of newly arrived, working-age immigrants with no education beyond high school in 2024 exceeded those with a bachelor's degree. This almost certainly is related to the growing share of new immigrants from Latin America; immigrants from that region tend to be among the least educated.
Figure 4. Working-age (18-64) new arrivals became significantly more educated after 2006, but that has now changed with a significant deterioration in their education levels in recent years. | |
 | |
Source: Center for Immigration Studies analysis of the public-use Current Population Survey from February 1994 to February 2024 in even numbered years. |
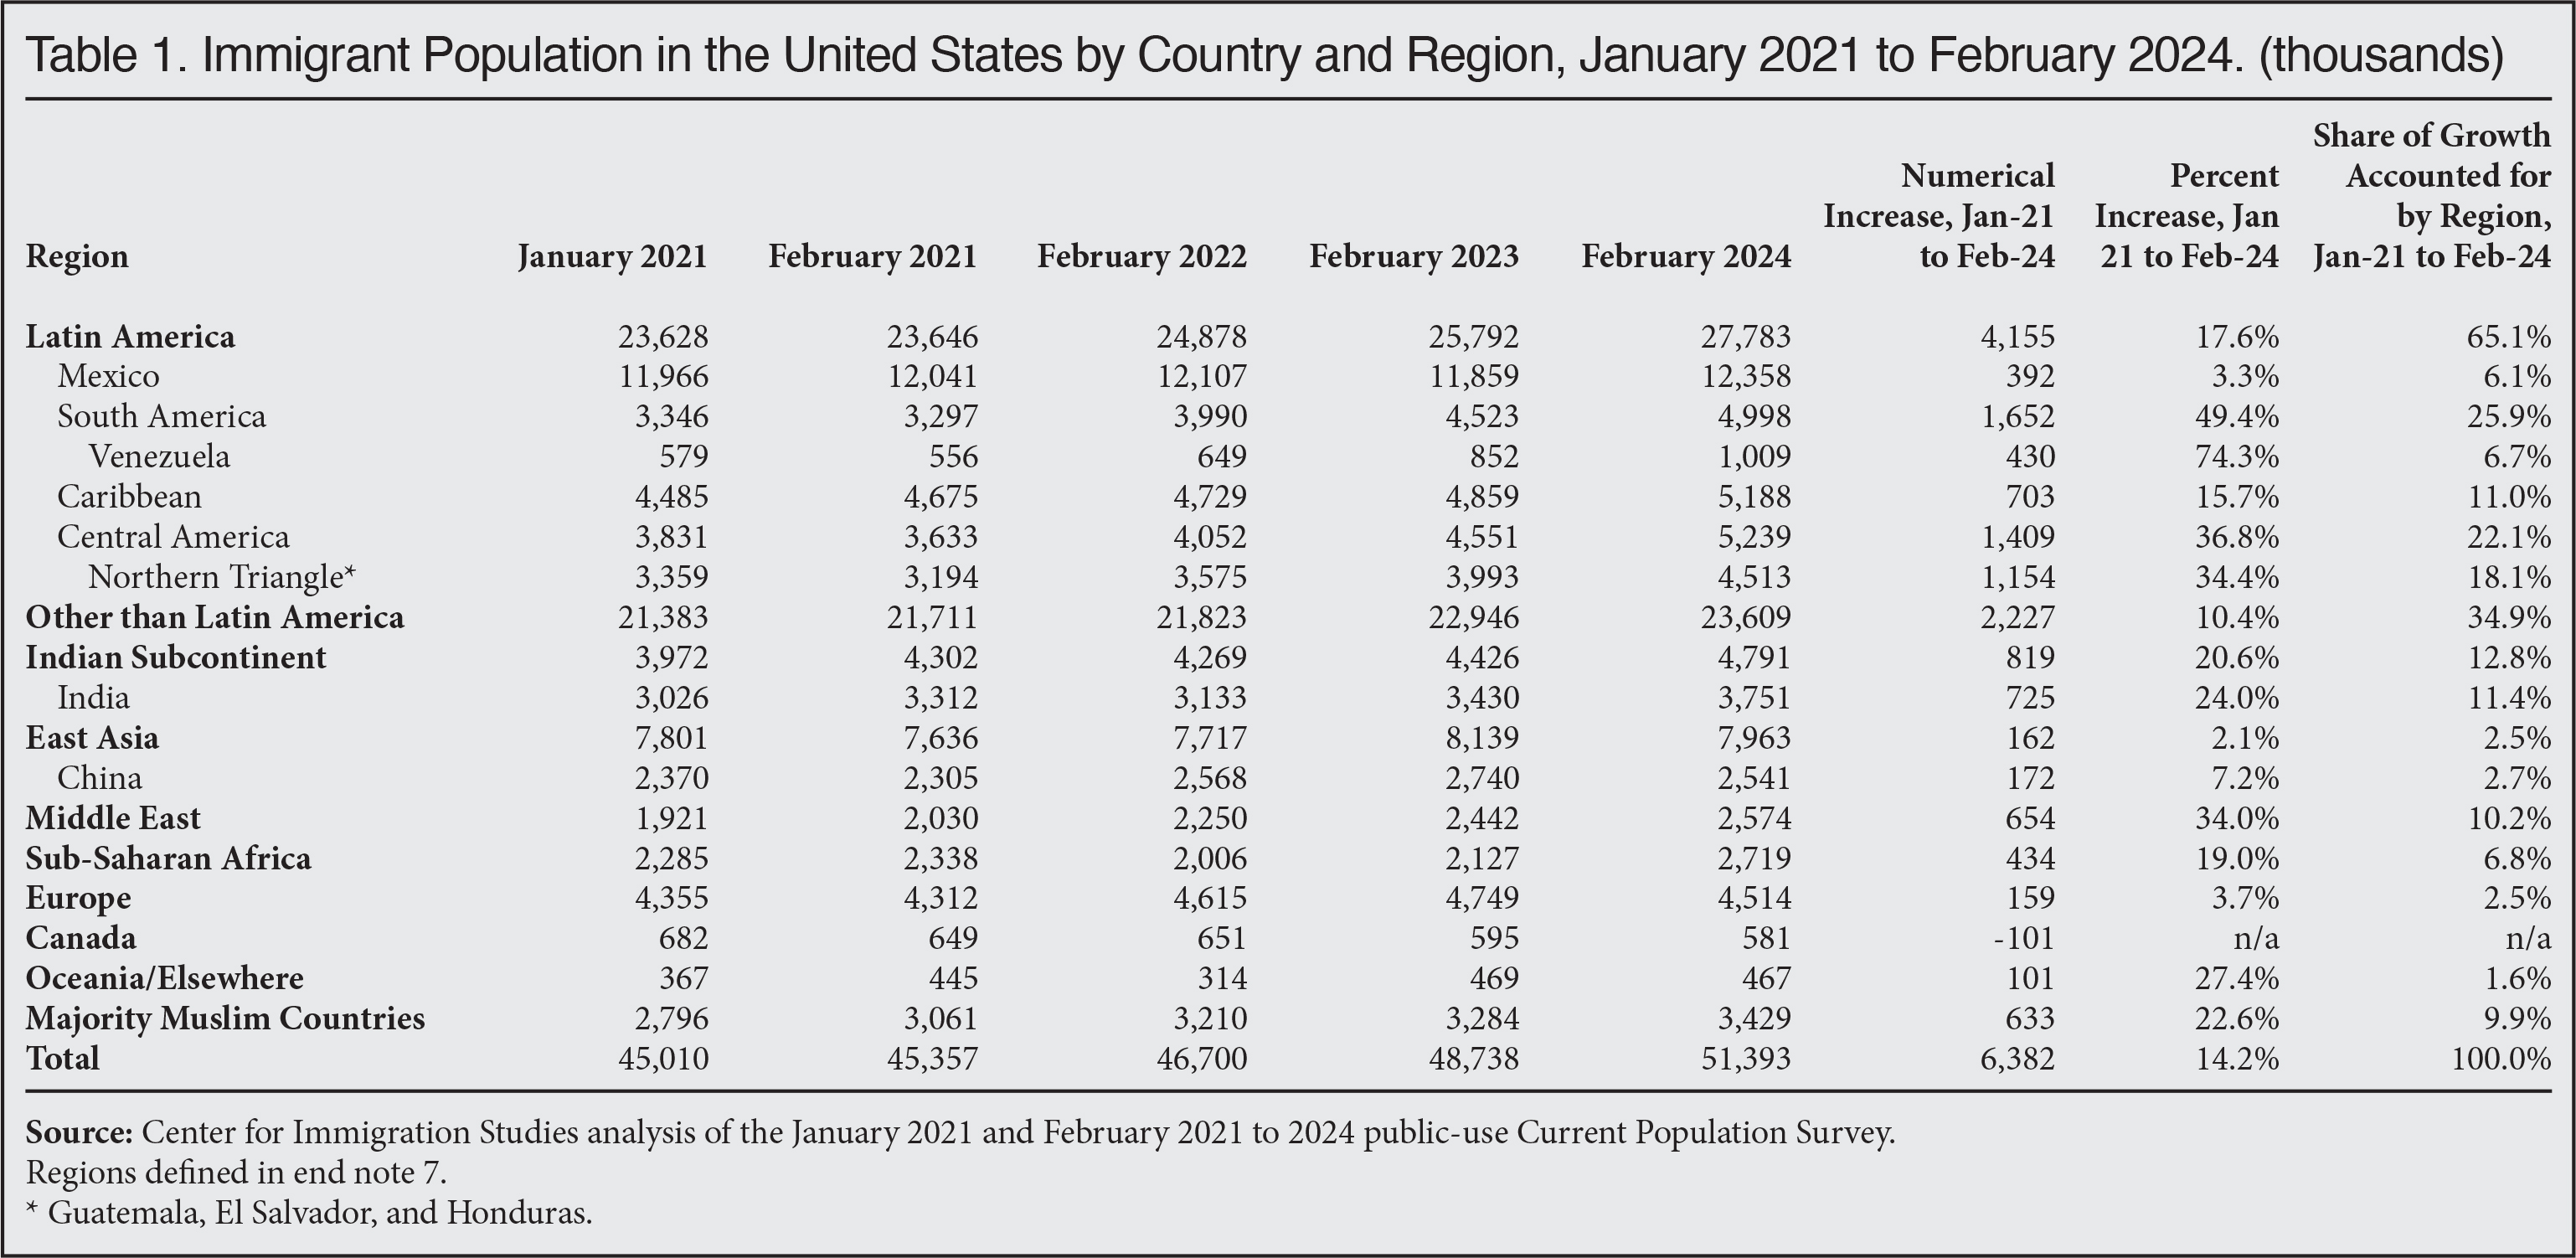
Growth by Sending Region. Table 1 shows the foreign-born by region in January 2021, the month President Biden took office, and each February from 2021 to 2024.7 Growth in the foreign-born population is being driven by immigrants from Latin America, whose number has grown 4.2 million since January 2021, with South America up 1.7 million, Central America up 1.4 million, and the Caribbean up 703,000. The number of Mexican immigrants has increased very little. Indian and the Middle Eastern immigrants have also grown by 819,000 and 654,000, respectively. Government and non-government researchers have long found that roughly three-fourths of illegal immigrants come from Latin America.8 The recent increase in the foreign-born from Latin America is an indication of the large role illegal immigration has played in the dramatic increase in the overall size of the foreign-born population since January 2021. While immigration from Latin America has clearly contributed disproportionately to the increase in the foreign-born, the number of immigrants from other regions has also increased substantially.
 |
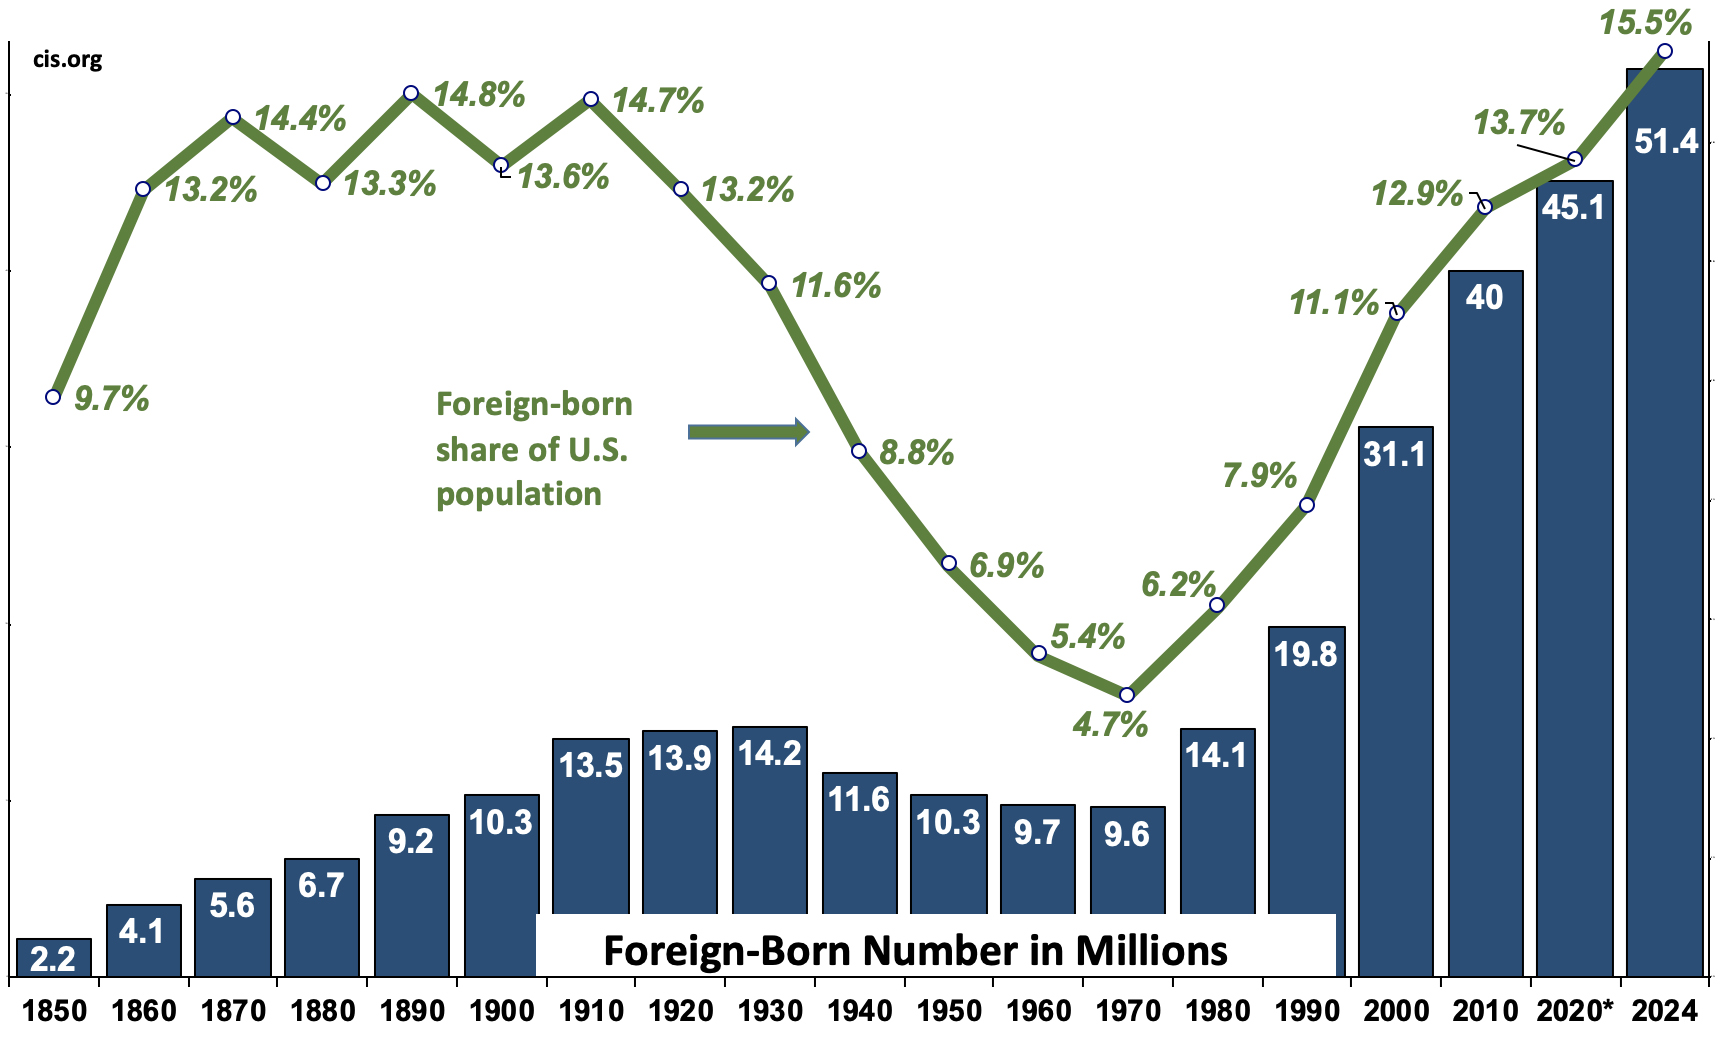
Historical Perspective. Figure 5 shows the number and foreign-born share of the U.S. population since 1850, which was the first time they were identified in the Census. The number of immigrants has increased five-fold since 1970, 2.5-fold since 1990, and 65 percent since 2000. As a share of the population, even in 1890 (14.8 percent) and 1910 (14.7 percent) during what is often called the “Great Wave” of immigration, the foreign-born were a smaller share of the population than they are today. The 15.5 percent in February of this year is the highest percentage ever reported in any Census or government survey in U.S. history.9 The share is more than triple what it was in 1970 and nearly double that of 1990. The scale of immigration is so high that it appears to have made the Census Bureau population projections, published in November of last year, obsolete. The bureau projected that the foreign-born share would not reach 15.5 percent until 2039. When thinking about the impact on American society, it seems fair to assume that both the size of the foreign-born population and its share of the population matter.10
Figure 5. The foreign-born number and share are higher now than at any time in American history. | |
 | |
Source: Decennial Census for 1850 to 2000, American Community Survey for 2010 and 2020, February Current Population Survey for 2024. |
What’s Causing the Rapid Growth?
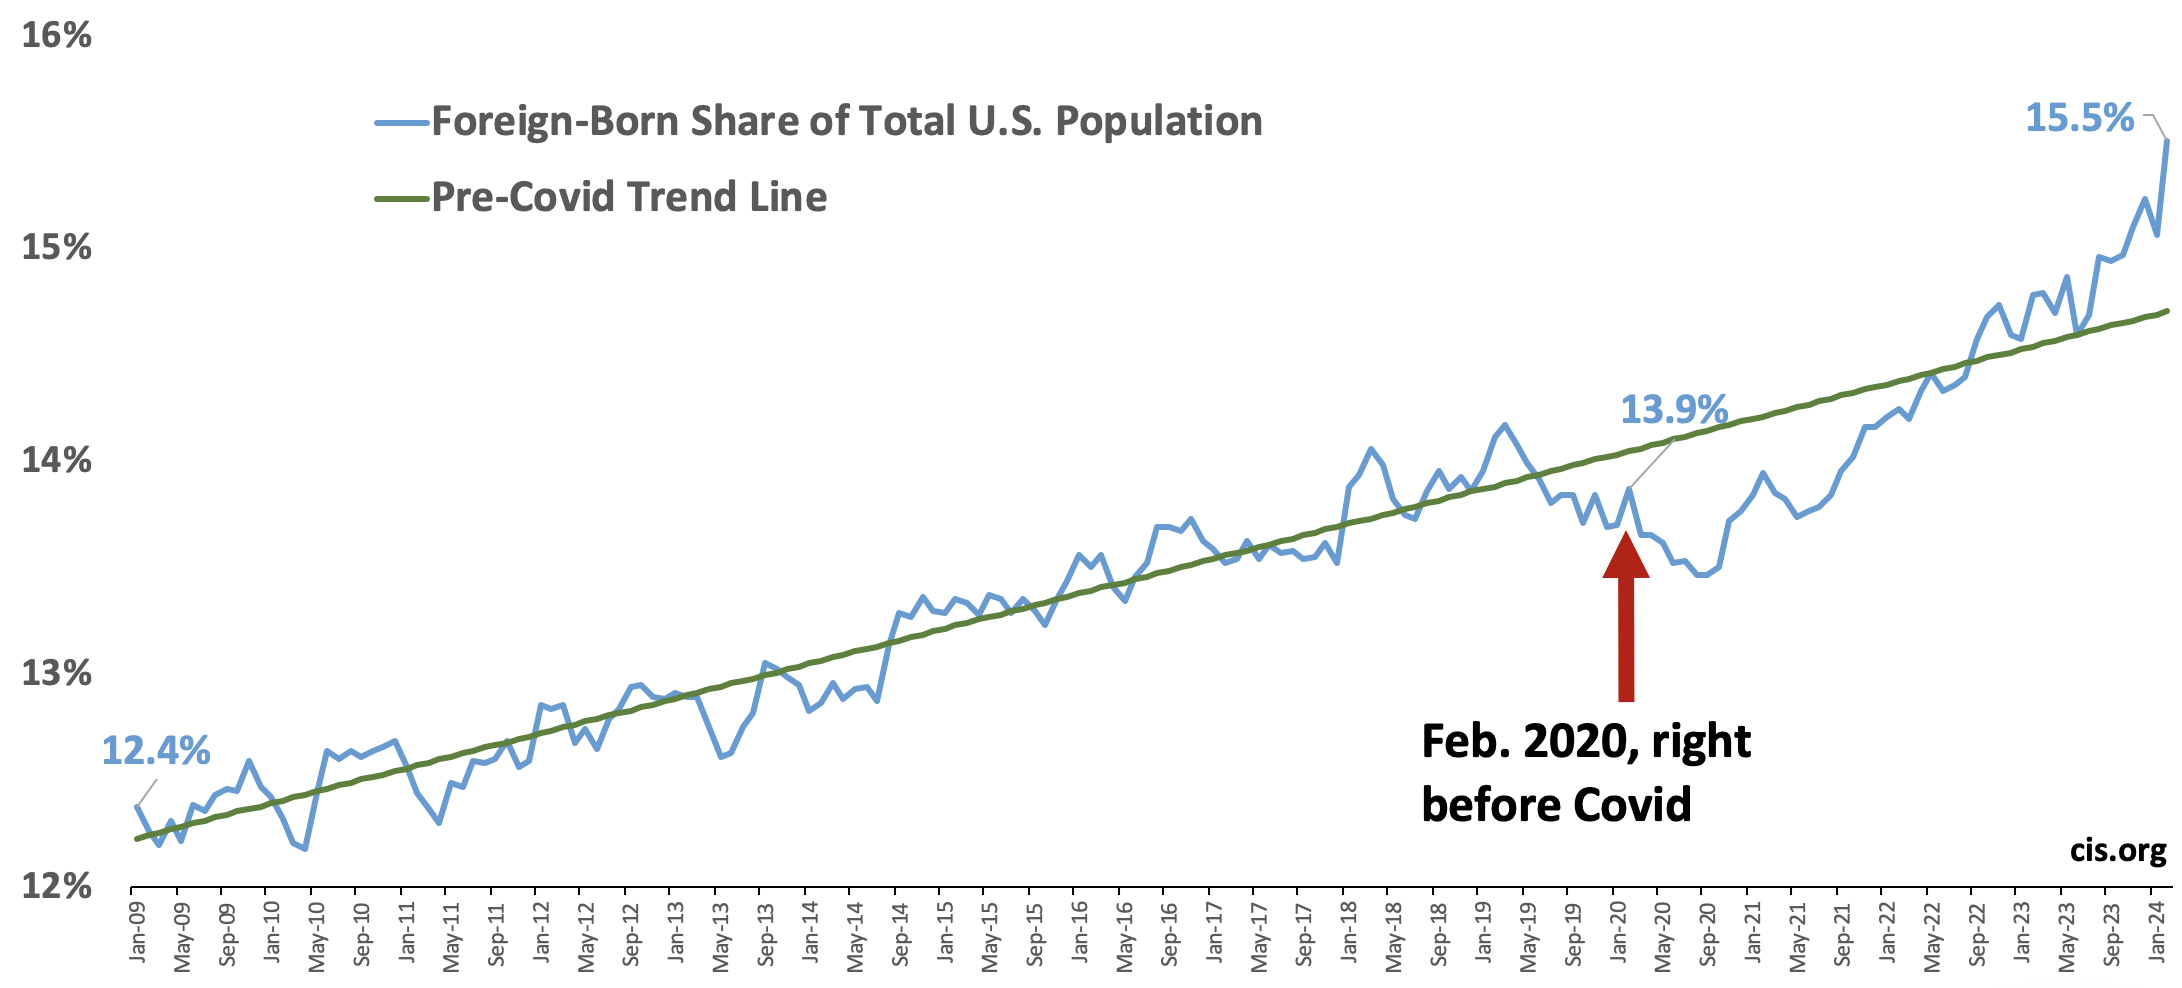
A Resumption of Prior Trends? One interpretation of the dramatic growth in the foreign-born population is that it is making up for the slowdown during Covid-19. There is truth to this, especially when it comes to legal immigration. During Covid, the processing of visas overseas greatly slowed. Of course, there is no reason legal immigration had to return to pre-pandemic levels, as the number of immigrants admitted is a discretionary policy set by Congress. The scale of illegal immigration is also certainly not pre-determined, as the level of resources and commitment to enforce the law reflects each administration’s goals and policy choices. Figure 6 shows the number of immigrants from the start of the Obama administration in January 2009 to February of this year and a line reflecting the pre-Covid-19 (January 2009 to February 2020) trend. The recent growth in the size of the foreign-born population is a good deal above the pre-pandemic trend line. Figure 7 shows the same is true for the foreign-born share of the U.S. population. At least when measured this way, it would be a mistake to argue that the recent rapid increase in the number is simply a resumption of prior trends.
Figure 6. The increase in the size of the foreign-born population is now well above the 2009 to 2020 pre-Covid trend line. (in millions) | |
 | |
Source: Center for Immigration Studies analysis of the public-use Current Population Survey from January 2009 to February 2024. |
Figure 7. The foreign-born share of the U.S. population is now well above the 2009 to 2020 pre-Covid trend line. | |
 | |
Source: Center for Immigration Studies analysis of the public-use Current Population Survey from January 2009 to February 2024. |
The Border Surge. From January 2021 to January 2024, there have been 8.9 million “encounters” at U.S. borders, though a significant share represent the same people encountered more than once.11 This appears to be a record for a three-year period, though in the past they were called “apprehensions”, which is a slightly different concept. The huge increase in border encounters seems closely related to the president’s campaign promises that created the accurate perception, well before he even took office, that he would curtail immigration enforcement. Ending the Migrant Protection Protocols (also called Remain in Mexico) for asylum applicants, and scaling back Title 42, which returned many non-Mexicans to Mexico, and then ending it all together, also helped spur more illegal immigration. The Biden administration also ended the Asylum Cooperative Agreements with El Salvador, Guatemala, and Honduras, which deterred people from transiting these countries in an effort to apply for asylum at the U.S. border.
In addition to the policy changes listed above, the administration also decided not to place a large share of individuals showing up at the border into what is called “expedited removal” and send them back home relatively quickly. In addition, virtually all non-Mexicans could have been held in detention, at least initially before the numbers became too large. Biden’s DHS chose not to do that either. Once it became clear that the administration was not going to return people across the border, detain them, send them home quickly, or require them to wait in Mexico for asylum, the number of people coming to the border skyrocketed. The asylum system quickly became overwhelmed, creating a backlog that will take a decade or more to work through. All the above policies caused ever more people to come and apply in the hopes that they too would be released into the country, where they would be allowed to remain for years awaiting court dates.
Aliens Released. One of the factors contributing most to the growth in the foreign-born population is the decision by the current administration to release so many illegal immigrants into the country. A bipartisan House resolution on January 11 of this year, based on information obtained by Congress from DHS, states that 3.3 million illegal immigrants have been released into the country by the administration. Many were originally apprehended trying to cross the border illegally; others presented themselves at a port of entry and were subsequently released. A significant number were also allowed to fly directly into the United States, including 220,000 who used the CPB One app to arrange entry. Virtually all of the individuals released into the country are considered “inadmissible aliens” and none have been formally admitted into the United States. As such, they are subject to removal, even those who have been granted parole status. This means that these individuals represent new additions to the illegal immigrant population until they are granted asylum, adjust status in some other way, or leave the country. While other administrations certainly released asylum seekers and used parole, the decision by the current administration to release more than one million inadmissible aliens a year is unprecedented.
Those Getting Past the Border Patrol. DHS has not formally published “got-away” figures for FY2023 or the first quarter of FY2024. However, the same House resolution cited above also found that there were 1.7 million got-aways at the border — individuals observed crossing but not stopped or turned back. From 2015 to 2019, got-aways averaged 118,000 a year, about one-fourth the annual level under President Biden.12 The 1.7 million got-aways does not include those who crossed the border surreptitiously without being seen. Given the number of border encounters, as well as got-aways, it seems likely that the number who successfully crossed the border undetected numbered in the millions over the last three years. Taken together, the number of illegal immigrants released into the country along with got-aways and those who entered without being seen likely totaled six or seven million since January 2021. Of course, the illegal population will not grow by this amount because some immigrants already in the country died, went home, or adjusted to legal status over this period.
Fall in Interior Enforcement. Another factor that has played a role in encouraging illegal immigration is the significant decline in interior enforcement. Putting aside 2020, when all immigration operations were curtailed due the pandemic, the latest report shows just 59,000 removals in FY 2021; this increased to 72,000 in FY 2022 and was 143,000 in FY2023. However, compared to the pre-Covid years of 256,000 and 267,000 in FY2018 and FY2019, respectively, the number of removals in the last three years has been very low.13 The administration has also refused to take custody of some non-citizens released from jails and prisons. Corey Price, acting associate director for Enforcement and Removal Operations at ICE, testified in a lawsuit brought by Florida that the administration removed many fewer illegal immigrants than were removed in earlier times as a conscious policy. The decision to reduce interior enforcement not only swells the illegal immigrant population by lowering the number who are sent home each year, it also encourages others to come and stay knowing that they will probably never be made to leave.
Visa Overstays. A significant number of new illegal immigrants, and perhaps a majority before the current border surge, were admitted legally on a temporary visa or under the Visa Waiver Program and then did not leave the country when the time limit expired. For FY 2022, DHS reports that 850,000 foreign visitors overstayed their authorized stay in that year.14 The total overstay rate for 2022 was 3.67 percent, which is more than double the rate of recent years. Of course, not all of these individuals stay long-term, and there is always some number of people who leave the country but whose departure was not properly recorded. Still, overstays have increased. Those overstayers who choose to stay long-term represent new additions to the nation’s illegal immigrant population.
Rebound in Legal Immigration. The number of legal permanent residents (green card holders) arriving from abroad — in contrast to those “adjusting status” from within the U.S. — fell significantly during Covid, but it has rebounded since. In the first quarter of 2021, only 23,000 new green card holders were admitted from abroad, but the number increased steadily thereafter and was 105,000 by the fourth quarter of that year. Moreover, the number of permanent immigrants arriving from abroad, increased from 227,000 for all of FY 2021 to 464,000 for FY 2022 and is 256,000 in just the first two quarters of FY 2023.15 The number of long-term temporary visas and refugee resettlement also show a significant rebound since Covid.16 Legal immigrants account for some 44 percent of the increase in the total foreign-born population since January 2021. It should be noted again that these figures represent new arrivals, not the net increase in the number of foreign-born residing in the country. It is also worth remembering that legal immigrants, including long-term temporary visitors, still account for three-quarters of the foreign-born population residing in the United States.
A Preliminary Estimate of Illegal Immigration
The Recent Increase in Illegal Immigrants. Before proceeding, it is important to note that the Center is in the midst of updating and improving our prior estimates, published in March 2022, of the illegal immigrant population using the CPS. The discussion that follows is based on incomplete data and is only preliminary. Using available administrative data on legal immigration (including long-term temporary visitors) and making reasonable assumptions about out-migration and mortality, we estimate that the post-1980 legal immigrant population in the CPS grew from 28.4 million in January 2021 (our prior estimate), to 31.4 million in February 2024 — a three million increase.17 The February 2024 CPS also shows 45.1 million post-1980 immigrants (legal and illegal) in the country.18 If our estimate of the post-1980 legal population is correct, then there were 13.7 million illegal immigrants in the February 2024 CPS (45.1 million minus 31.4 million).19 Using our prior estimates of undercount produces an illegal population of 14 million in February 2024, four million larger than in January 2021, when President Biden took office.
Our prior estimate of illegal immigrants in the CPS for January 2021 was 10 million, without adjusting for undercount.20 These estimates indicate that the illegal population in the survey increased by 3.7 million, accounting for about 58 percent of the 6.4 million growth in the total foreign-born population from January 2021 to February 2024. These numbers also imply that the total legal immigrant population increased by 2.7 million in the survey. It must be noted that a significant share of mortality and out-migration occurs among immigrants who arrived prior to 1980 and this is why the post-1980 legal immigrant population grew by the three million shown above, but the overall legal population grew less.
Uncertainty About These Estimates. One of the biggest areas of uncertainty concerns the undercount of the foreign-born in general and illegal immigrants in particular. The total population and the total foreign-born population in the CPS reflect in part the weights developed by the Census Bureau. Those weights are based on the bureau’s population estimates, including an estimate of Net International Migration (NIM). The Census Bureau has acknowledged that even before Covid it was difficult to estimate migration. It developed a new methodology for measuring net migration in 2021 and even issued alternative estimates of NIM for 2010 to 2020 showing that they had underestimated NIM by 1.94 million over this period. In our view, their new methodology while almost certainly an improvement is still not able to fully reflect the new reality — huge numbers of illegal immigrants released, an explosion in got-aways, and the on-going border crisis in general.
A second area of uncertainty we have about our estimates is that we do not have a clear sense of how outmigration may have changed in recent years. This means that we are unsure of how many immigrants are going home each year. The administration is certainly removing significantly fewer people from the interior of the country, but how much lax enforcement impacts overall outmigration is unknown. Finally, we do not have complete administrative data on legal immigration through February 2024. As such, we are forced to use past patterns to estimate it. Notwithstanding all these problems, given the enormous number of aliens released, the huge surge in got-aways, the likely increase in unseen illegal crossings, the continuing problem of visa overstayers, and the decline in removals, we feel our estimate of illegal immigration is conservative.
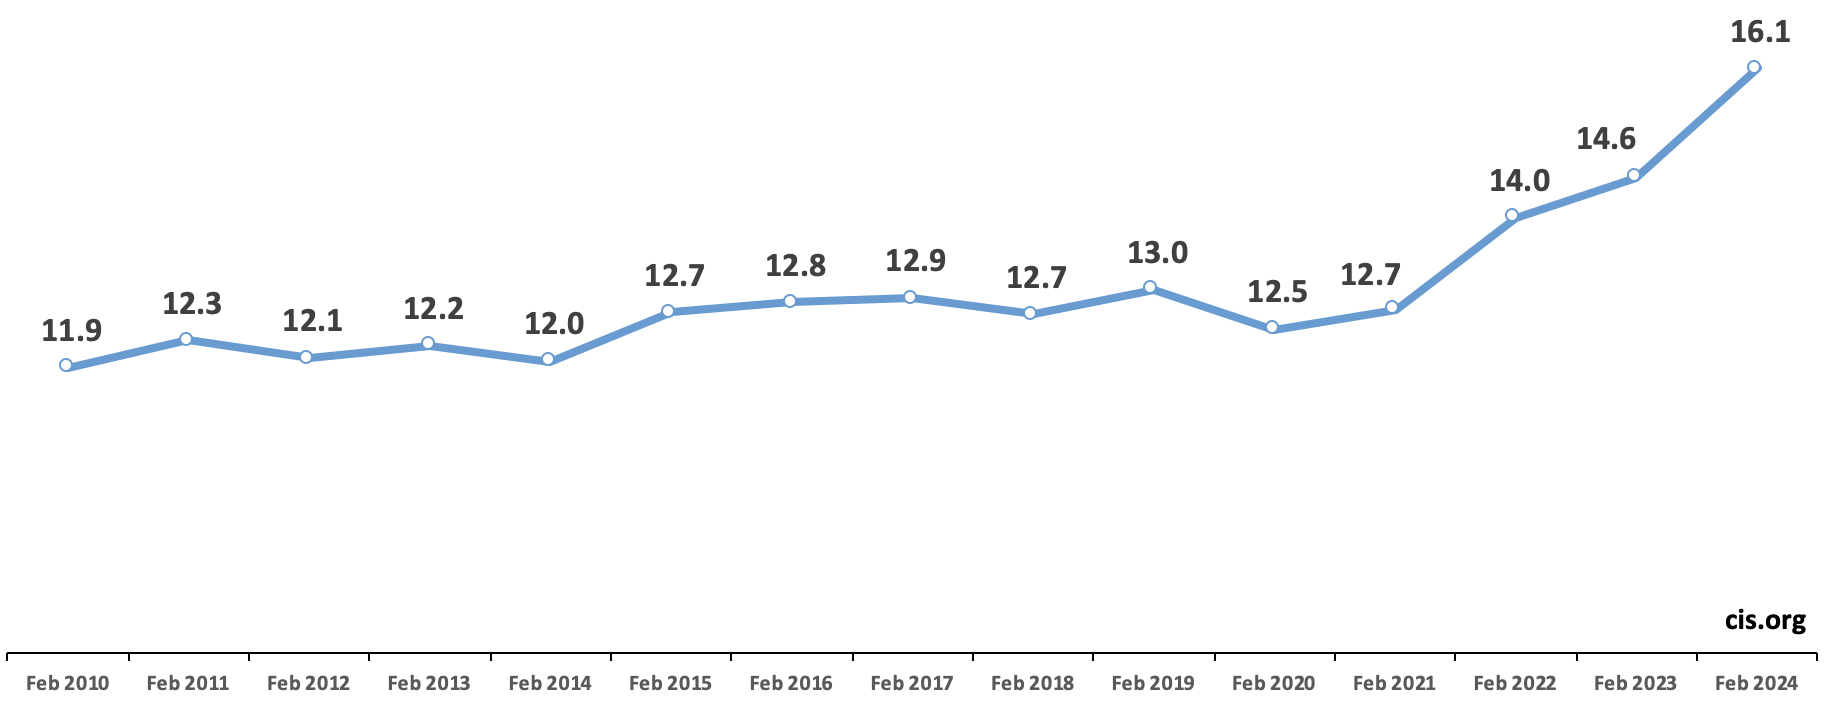
Indirect Evidence of Illegal Immigration. For the most part, illegal immigrants should show up in Census Bureau surveys as non-citizens who, because of the 1986 IRCA amnesty, arrived in 1982 or later. As already discussed, government and non-government researchers estimate that roughly three-fourths of illegal immigrants come from Latin America. As a result, the post-1982 non-citizen Latin American immigrant population overlaps significantly with the illegal immigrant population.21 Figure 8 shows the relative stability in this population from February 2010 to February 2020. The lack of significant change in the number of non-citizens from this region is consistent with the estimates by the research organizations cited above showing that the number of illegal immigrants changed only modestly in the decade before Covid.22 However, that has now changed. Compared to February 2020, right before Covid-19 hit, the post-1982 non-citizen Latin American immigrant population increased by 3.6 million, and compared to February 2019 it is up over three million. To be sure, not all illegal immigrants come from the Western Hemisphere, and there are many legal immigrants from this region. That said, the growth of non-citizens from this part of the world adds strong support to the idea that the illegal immigrant population has grown considerably after Covid.
Figure 8. A large share of the non-citizen Latin American immigrant population that arrived in 1982 or later* is comprised of illegal immigrants. This population was relatively stable in the years prior to Covid-19, but has increased dramatically since. (in millions) | |
 | |
Source: Center for Immigration Studies analysis of the public-use February Current Population Survey from 2010 to 2024. |
Labor Market and the Economy
A Larger Economy? There is no question that immigrant workers, legal or illegal, make the U.S. economy billions of dollars larger than it would be otherwise. More workers in the country means more economic activity. We can roughly estimate the likely impact of additional immigrant workers on the size of the U.S. economy using the data in the CPS and some other information. From right before Covid in February 2020 to February of 2024, the number of immigrant workers increased by 3.3 million. This increase accounted for 2.1 percent of all workers in February 2024. Based on the wage and salary data in the February CPS, immigrants earn 89 percent as much as the U.S.-born. Moreover, most research indicates that labor has accounted for 60 percent of GDP in recent years. If we multiply the percentage increase in workers from recent immigration (2.1 percent) by their income relative to the U.S.-born (89 percent) and multiply the product of these two numbers by labor share’s of GDP (60 percent) it produces an estimate of 1.12 percent of U.S. GDP or $313 billion — assuming an economy of $27.94 trillion.
It must be emphasized that this estimate is highly simplified and does not reflect the true complexity of the actual economy and the variety of ways it might respond to an increase in labor supply. For one thing, it does not consider any negative impact on the wages and labor force participation of American workers, particularly the less-educated, nor does it reflect the possibility that by increasing the supply of workers, immigration “can lead to weaker productivity growth, which ultimately determines how fast economies can expand”, as the Wall Street Journal wrote recently. Moreover, it does not include the possibility of complementarity between the new immigrant workers and the rest of the workforce. Nonetheless, this type of analysis points to two conclusions: First, by adding workers recent immigration increases the aggregate size of the economy, and second, the increase is tiny relative to overall GDP.
Figure 9. The foreign-born number and share of the U.S. population are already at record highs. If present trends continue, new records will be set every year during a second Biden term. | |
 | |
Source: Center for Immigration Studies analysis of the public-use Current Population from January 2021 to February 2024. |
Is Bigger Better? The larger economy recent immigration creates raises an important question: Is the increase in GDP a benefit to the existing population of Americans, both U.S.- and foreign-born? The standard of living in a country is determined by per-capita (i.e., per-person) GDP, not the overall size of the economy. If all that mattered was the aggregate size of the economy, then a country like India would be considered vastly richer than a country like Sweden because India’s economy is larger. It is important to understand that almost all of the increase in economic activity created by additional immigrant workers goes to the immigrants themselves in the form of wages and benefits, as it should since they are the ones doing the work. Whether the larger economy benefits U.S.-born Americans is a very different question. We can say that because the immigrants are on average less educated and poorer than the U.S.-born, the per capita GDP of the United States is lower than it otherwise would be because of immigration.
The 6.4 million immigrants added to the nation’s population was equal to 1.9 percent of the total population based on the February CPS. If the increase in immigrant workers increased GDP by 1.1 percent, while increasing the population by 1.9 percent, it must lower per-person GDP. Per-person GDP is simply the total GDP divided by total population. Just last month, the CBO addressed this question when it estimated that if the recent increase in migration continues, above what they previously projected, it would add about 2 percent to the nation’s GDP by 2034. However, CBO also states, “GDP per person, however, would be 0.8 percent smaller in 2034 because of the increase in immigration.” In sum, when you count immigrants, the total U.S. economy is clearly larger, while per-person GDP is clearly lower. Pointing to the larger economy that immigration creates, as President Biden did when he stated immigrants are “the reason our economy is growing”, and implying this is a clear benefit to U.S.-born Americans is simply wrong. Bigger is not necessarily better.
Conclusion
The current scale of immigration (legal and illegal) into the United States is enormous. The February 2024 Current Population Survey (CPS), collected by the Census Bureau, shows that 15.5 percent of the U.S. population is now foreign-born — the largest share on record. The prior record was 14.8 percent, 134 years ago in 1890. The immigrant share of the population has more than tripled since 1970 and nearly doubled since 1990. The 51.4 million foreign-born residents now living in the U.S. is a new record high in American history. The number of immigrants has increased five-fold since 1970, more than 2.5 times since 1990, and is up 65 percent since 2000. Just since President Biden took office in January 2021, it has increased by 6.4 million — larger than the individual populations of 33 U.S. states. We preliminarily estimate that more than half (3.7 million) of the 6.4 million increase in the foreign-born population since January 2021 is likely due to illegal immigration. If adjusted for those missed by the survey, the increase is larger.
Much of the news coverage on immigration has focused on the workers immigration has provided employers or by how immigration makes the economy larger. There are fewer discussions about the impact the dramatic increase has on everything from the nation’s education and healthcare systems to its physical infrastructure and political representation. Perhaps the most fundamental question these numbers raise is whether America can successfully incorporate and assimilate this many people. Moreover, the size and growth of the immigrant population is not static. If legal and illegal immigration were to continue at the current level, we project that the total foreign-born population will reach nearly 60 million and 17.5 percent of population by the end of Biden’s second term in December 2028. Adding so many people to the country so fast may please employers and immigration advocacy groups, but any serious discussion of immigration policy has to grapple with these numbers and the implications they have for American society as a whole.
Appendix: Comparing Census Surveys
Understanding Survey Data. Like virtually all modern surveys, the CPS is weighted to reflect the size and characteristics of the population of interest. Census Bureau surveys are weighted by key variables such as sex, race, age, and Hispanic origin, so that the resulting population totals reflect what the bureau believes is the actual U.S. population. The weights used in Census surveys reflect the “population estimates”, which begin with the results of the decennial census that are then added to each year based on birth and death records and estimates of net migration. The quality of survey results depends in part on the accuracy of the weights. As we have discussed earlier in this analysis and have pointed out more than once in prior publications, the big issue with the population estimates, and the resulting weights used for surveys, is the migration component.
How the Weights Impact the Foreign-Born. The ACS and CPS have somewhat different methodologies and population universes, but their weights reflect the same basic population estimates.23 If the migration component of the weights is underestimated, it means estimates of the foreign-born will be off. However, being foreign-born is not one of the variables used by the bureau to weigh the data. Being an immigrant is a characteristic, like unemployment or income, that is based on responses to the survey. Because race and being an immigrant are correlated, it does mean that if migration is underestimated, it impacts the size of the foreign-born population.
Monthly CPS Compared to ACS. The ACS is a much larger survey than the monthly CPS we use throughout this analysis.24 Figure A1 compares the foreign-born population in the ACS to a combined three-month sample (June, July, August) of the monthly CPS. Using the summer months allows us to roughly match the July control date of the ACS, and using three months creates more statistically robust CPS estimates. The ACS consistently produced much larger estimates of the foreign-born population than the summer CPS until 2018. This is expected because the ACS includes the institutionalized. However, from 2018 to 2021, the results of the surveys were similar, which is surprising. Results for 2020 should probably be ignored because the Census Bureau reports significant problems collecting the 2020 ACS due to the pandemic and, as already discussed, it is likely that the CPS also undercounted the foreign-born that year. In 2022, the summer months of the CPS show a foreign-born population that is nearly one million larger than in the ACS — a statistically significant difference. Why the relative measurement of the foreign-born in the two surveys changed is unclear.
Figure A1. The ACS once produced higher estimates of the foreign-born than the monthly CPS, but that has generally not been the case since 2018. The monthly CPS also shows very dramatic growth between 2021 and 2022, the ACS much less so. | |
 | |
Source: American Community Survey, which reflects the population in July, and Center for Immigration Studies analysis of a combined sample of the June, July, and August public-use Current Population Survey. |
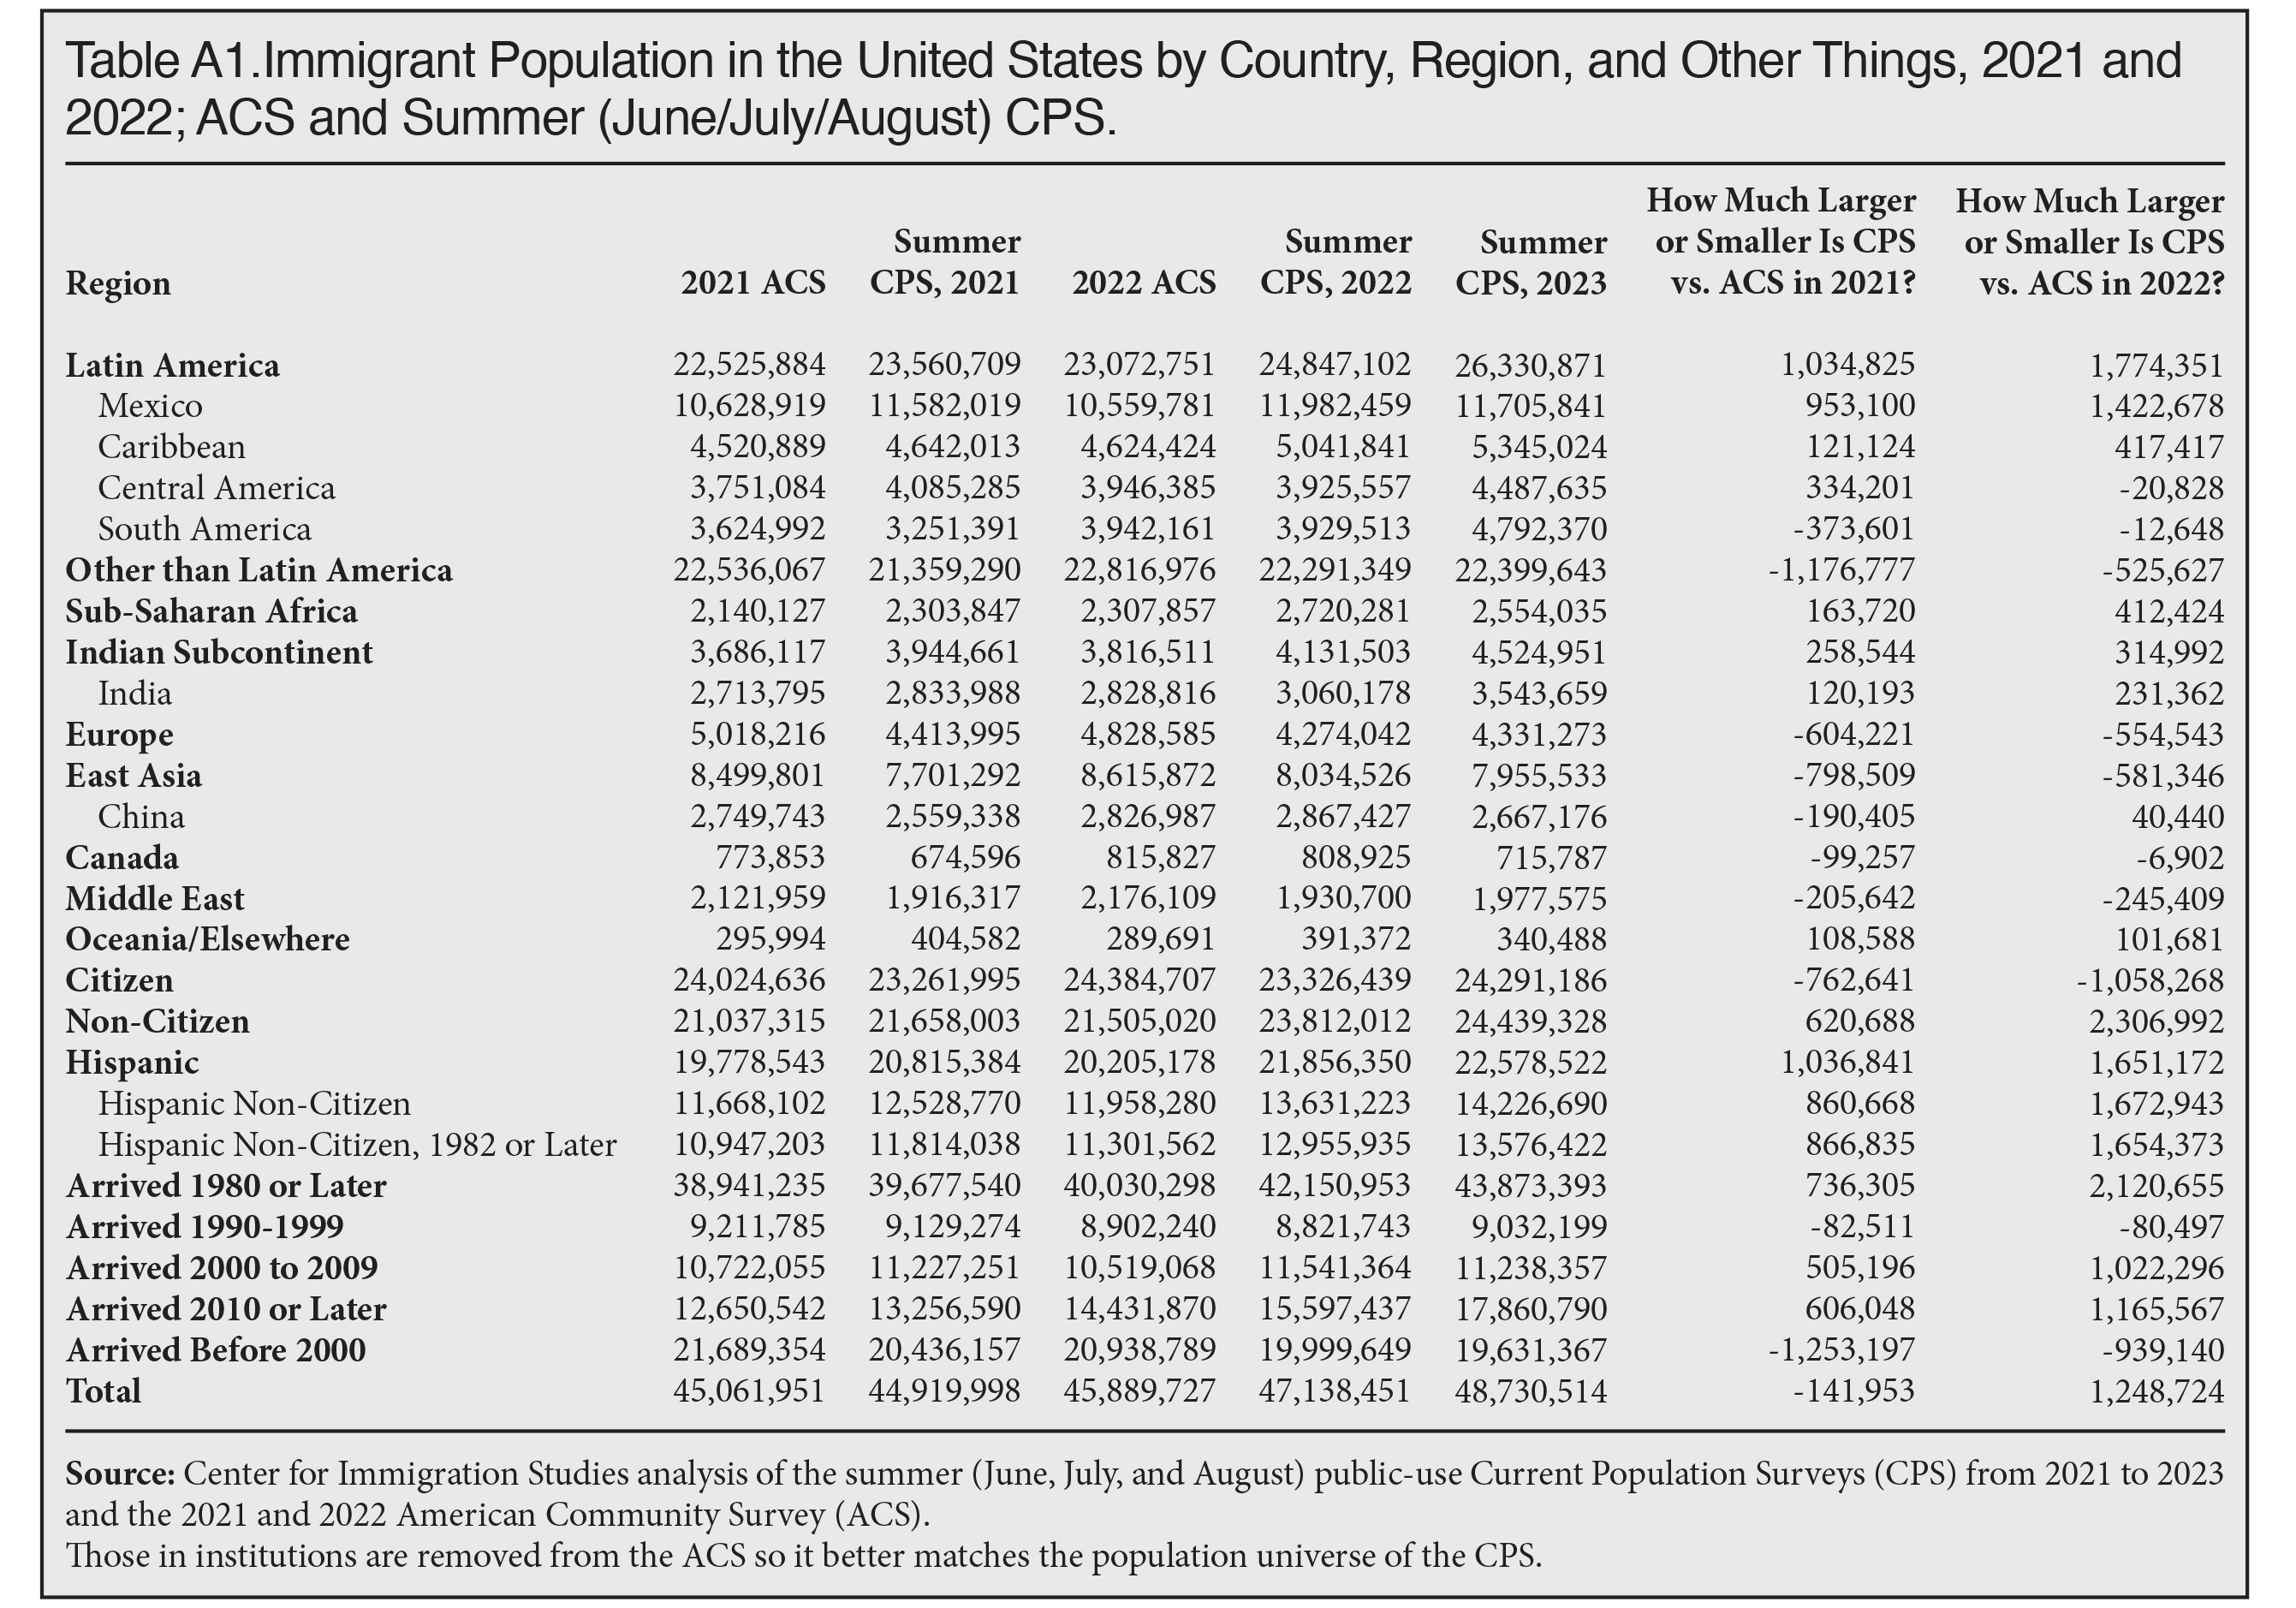
Table A1 examines sub-populations of the foreign-born using the 2021 and 2022 ACS, with the institutionalized population removed so that it matches the CPS. In 2021, the two surveys produced very similar overall numbers with the ACS (institutionalized removed), showing only about 142,000 more immigrants than the summer CPS, which is well within the margin of error. Interestingly, the Latin American population was much larger in the CPS, while the non-Latin American population was much larger in the 2021 ACS. This was primarily due to a much larger population of Mexicans in the CPS. However, as we have seen in Table 1, Mexican immigration is not what is driving the recent growth in the CPS. Table A1 shows that, between 2021 and 2022, the Latin American immigrant population from countries other than Mexico grew by nearly 900,000 in the CPS in one year, while it increased 616,000 in the ACS. The number of immigrants from non-Latin American countries grew by 932,000, from 2021 to 2022 in the CPS, more than three times the increase in the ACS. It is simply not clear why the CPS shows so much more growth for both Latin American and non-Latin American immigrants than does the ACS.
 |
Is the CPS Better? Given the unprecedented nature of the current immigration influx, it is possible that, because the CPS requires an initial in-person interview, it better captures the foreign-born when the roster of household members is first established at the time of the first interview, at least in 2022.25 By that time, the border crisis should have shown up in the data, whereas in July 2021 it had just begun. Moreover, those taking part in the CPS are told when they join that they will be in the survey for four months, leave for eight months, and then rejoin for four additional months. Knowing they will have seven future interactions with the government may make them more likely to tell the bureau about foreign-born individuals in the household. Repeated interviews also create a relationship with Census employees that could increase the probability that respondents will let the bureau know when a person joins the household. In contrast, ACS respondents are surveyed only once, and most participants do so on paper or online. How all the methodological differences between the CPS and ACS impact what they show on the foreign-born, especially during the ongoing border crisis, is difficult to say. What is clear is that the CPS provides the most up-to-date picture of the rapidly evolving immigration situation.
End Notes
1 The primary purpose of the survey is to collect information about the U.S. labor market, such as the unemployment rate, but starting in 1994 questions about citizenship, country of birth, and year of arrival were added.
2 The term “immigrant” has a specific meaning in U.S. immigration law, which is all those inspected and admitted as lawful permanent residents. In this analysis, we use the term “immigrant” in the non-technical sense to mean all those who were not U.S. citizens at birth.
3 The margins of error shown in Figure 2 or reported elsewhere in the analysis are based on standard errors calculated using parameter estimates and an adjustment for foreign-born respondents, which reflects the survey’s complex design. To the best of our knowledge, neither the BLS nor the Census Bureau has provided parameter estimates or an adjustment specifically for the foreign-born that applies to the general population in the monthly CPS. For this reason, we use the parameter estimates and foreign-born adjustment provided by the government for the labor force.
4 Since the monthly CPS first asked about citizenship on a regular basis in 1994, there has never been a 38-month period that witnessed this kind of growth.
5 The average increase for Obama’s first term reflects growth in the foreign-born population between January 2009 and December 2012 of 2.76 million, divided by 47 months to reflect the changes that occurred after January 2009 when he took office. (Although each presidential term lasts 48 months, there are only 47 monthly changes in the data in a single term, unless we count the change from the December before an administration begins to January of the next year when they take office.) The average increase for Obama’s second term reflects growth in the foreign-born population between January 2013 and December 2016 of 3.56 million divided by 47 months. For Trump’s term before Covid, the average increase reflects growth in the foreign-born population between January 2017 and February 2020 (before Covid-19) of 1.57 million divided by 37 months. We chose February 2020 to reflect pre-Covid growth in the foreign-born population because Covid lockdowns did not begin until March of that year. For Biden, the average reflects growth in the foreign-born population between January 2021 and February 2024 of 6.38 million divided by 37 months. Of course, adding one additional month to each presidency would produce very similar results for each administration. So, for example, if we divided by 48 months for each of Obama’s terms it would show 57,000 for his first term and 74,000 for his second, which is very similar to the 59,000 and 76,000 when we divide by 47 months for each term. If we divide Trump’s pre-Covid time in office by 38 months we get average growth per month of 41,000 compared to 42,000 if we divided by 37 months. For President Biden, if we divide by 38 months we get an average monthly increase of 164,000 rather than 172,000 if we use 37 months.
6 At 4.7 million, the number of newcomers in February 2024 is not only higher than in any similar period in the CPS, it is also much higher than annual immigration measured by the ACS through 2021. However, as high as this number is, it does not line up with the enormous increase in the foreign-born from January 2022 to February 2024, which was 4.8 million. As already discussed, new arrivals should exceed growth in the foreign-born because newcomers are offset by outmigration and deaths among the existing foreign-born. However, several factors likely account for this difference. First and foremost, there are margins of error around all of these numbers. The margin of error for the 4.7 million arrivals 2022 to 2024 is ±200,000, using a 90 percent confidence level. Moreover, the margin of error around the total foreign-born of 51.4 million in February 2024 is ±572,000 and it was ±554,000 for the 46.6 million in January 2022. Equally important, capturing newly arrived immigrants is difficult, so the undercount in the CPS is likely heavily concentrated among the newest immigrants. Finally, people who had lived in the United States previously and returned in 2022 to 2024 might have told the Census Bureau they came to the United States during their prior stay and not the most recent year they arrived. As a result, they add to the overall foreign-born population but do not show up as new arrivals. All of these factors likely explain why the arrivals data 2022 to 2024, though very high, seems low relative to growth in the immigrant population. The total foreign-born population in the CPS is a much more statistically robust number because it is based on a larger sample of all immigrants, not the smaller share who are newcomers. One other factor to keep in mind is that the figure for new arrivals does not include those who came in 2022 or 2023 and left the country or passed away before February 2024. The 4.7 million represents only those who were in the country in February 2024 and came in the prior 25 months.
7 We define regions in the following manner: Central America: Belize/British Honduras, Costa Rica, El Salvador, Guatemala, Honduras, Nicaragua, Panama, Central America NS.; Caribbean: Cuba, Dominican Republic, Haiti, Jamaica, The Bahamas, Barbados, Dominica, Grenada, Trinidad and Tobago, Antigua and Barbuda, St. Kitts-Nevis, St. Lucia, St. Vincent and the Grenadines, and the Caribbean NS; South America: Argentina, Bolivia, Brazil, Chile, Colombia, Ecuador, Guyana/British Guiana, Peru, Uruguay, Venezuela, Paraguay, and South America NS; East Asia: China, Japan, Korea, Mongolia, Cambodia, Indonesia, Laos, Malaysia, Philippines, Singapore, Thailand, Vietnam, Burma, Asia NEC/NS (not elsewhere classified or not specified); Indian Subcontinent: India, Bangladesh, Bhutan, Pakistan, Sri Lanka, Nepal; Middle East: Afghanistan, Iran, Iraq, Israel, Palestine, Jordan, Lebanon, Saudi Arabia, Syria, Turkey, Kuwait, Yemen, United Arab Emirates, Azerbaijan, Uzbekistan, Kazakhstan, Northern Africa, Egypt, Morocco, Algeria, Sudan, Libya, and Middle East NS; Sub-Saharan Africa: Ghana, Nigeria, Cameroon, Cape Verde, Liberia, Senegal, Sierra Leone, Guinea, Ivory Coast, Togo, Eritrea, Ethiopia, Kenya, Somalia, Tanzania, Uganda, Zimbabwe, South Africa, Zaire, Congo, Zambia, and Africa NS/NEC. Unless otherwise specified; Europe: Denmark, Finland, Iceland, Norway, Sweden, United Kingdom, Ireland, Belgium, France, Netherlands, Switzerland, Greece, Italy, Portugal, Azores, Spain, Austria, Czechoslovakia, Slovakia, Czech Republic, Germany, Hungary, Poland, Romania, Bulgaria, Albania, Yugoslavia, Bosnia and Herzegovina, Croatia, Macedonia, Serbia, Kosovo, Montenegro, Estonia, Latvia, Lithuania, Other USSR/Russia, Ukraine, Belarus, Moldova, USSR NS, Cyprus, Armenia, Georgia, and Europe NS; Oceania/Elsewhere: Australia, New Zealand, Pacific Islands, Fiji, Tonga, Samoa, Marshall Islands, Micronesia, Other, NEC, North America NS, Americas NS/NEC and unknown; Majority Muslim: the Middle East (excluding Israel) as well as Bangladesh, Pakistan, Somalia, Indonesia, and Malaysia. Mexico is included in the Latin America total. Canada is not included in any other region.
8 The Migration Policy Institute’s estimates of illegal immigrants by country can be found here. Pew Research’s estimates by country can be found here. Estimates by the Department of Homeland Security can be found here. Those from the Center for Migration Studies by country can be found here.
9 The CPS does not include the institutionalized population, which is included in the decennial census and American Community Survey (ACS). The institutionalized are primarily those in nursing homes and prisons. We can gauge the impact of including the institutionalized when calculating the foreign-born percentage by looking at the public-use 2022 ACS, which shows that when those in institutions are included it lowers the foreign-born share of the population by less than one-tenth of 1 percent. This is because immigrants are a somewhat smaller share of the institutionalized than they are of the non-institutionalized. However, the institutionalized share is not a very large relative to the overall population, so it makes very little difference to the foreign-born share of the total population. Also, the distribution of immigrants in the institutionalized and non-institutionalized population changes very little from year to year. The bottom line is that the inclusion of the institutionalized in February 2024 might have reduced the foreign-born share of the overall population by about one-tenth of 1 percent. A one-tenth of a percentage point reduction in the 15.5 percent share would still be a new record high. Also, the margin of error for the foreign-born share of the population is ± 0.2 percent assuming a 90 percent confidence level. But even the lower bound of the confidence interval would still place the foreign-born share well above the 14.77 percent in 1890, which also likely had some error that is lost to history. The bottom line is we can say with confidence that at 15.5 percent in February 2024 the foreign-born share is the highest share ever recorded by any U.S. government census or survey.
10 When considering the impact of immigration on the country, the foreign-born share may seem like the only factor that matters. While percentages are important, the absolute size matters as well. For example, when thinking about the successful integration of immigrants, 500,000 foreign-language speakers may be enough to create linguistic and cultural enclaves, whether this 500,000 constitutes 10 percent of an urban area or 30 percent.
11 “Nationwide Encounters”, U.S. Customs and Border Protection.
12 See Table 2b in the “Border Security Metrics Report: 2022”, U.S. Department of Homeland Security, July 3, 2023.
13 See Figure 20 on p. 26 in “ICE Annual Report Fiscal Year 2023”.
14 “Fiscal Year 2022 Entry/Exit Overstay Report”, Department of Homeland Security, June 2022.
15 For FY2021 and FY2022, figures for adjustments can be found here. For FY2023 they can be found here.
16 The State Department’s Bureau of Consular Affairs website on “Monthly Immigrant Visa Issuance Statistics” shows that the number of new legal immigrants issued a visa abroad quickly returned to pre-pandemic levels and now exceeds those levels. The Refugee Processing Center’s website shows the same thing.
17 This includes an adjustment down from the actual legal immigrant population because of undercount in the survey.
18 The foreign-born who arrived before 1980 should contain virtually no illegal immigrants because the IRCA amnesty should have legalized them and the passage of time further reduces the illegal immigrant population that came in this time period. Also, because of special provisions in the law that allow Cuban immigrants to adjust to legal status, it is very difficult for them to be in the country illegally, so they are excluded from this population.
19 For a detailed discussion of how we estimate the size of the total illegal immigrant population, see Steven A. Camarota and Karen Zeigler, “Estimating the Illegal Immigrant Population Using the Current Population Survey”, Center for Immigration Studies, March 29, 2022. The key administrative data necessary for updating our prior estimate of the legal immigrant population comes from the State Department’s Bureau of Consular Affairs website at “Monthly Immigrant Visa Issuance Statistics”; the Department of Homeland Security website for “Legal Immigration and Adjustment of Status Report Fiscal Year”, for FY2021 and FY2022 and for FY2023; the Refugee Processing Center’s website; and the Executive Office for Immigration Review’s Adjudication Statistics.
20 Steven A. Camarota and Karen Zeigler, "Estimating the Illegal Immigrant Population Using the Current Population Survey: Data shows number fell from 2019 to 2021 but rebounded by more than one million by early 2022", Center for Immigration Studies, March 29, 2022. See Table 1 in the Methodology section for the unadjusted illegal immigrant population in prior Current Population Surveys.
21 While many new immigrants from Latin America entered since 1982 over the time period shown in Figure 8, these new arrivals were offset in part by out-migration and natural mortality. In addition, large numbers of legal immigrants from this region have naturalized over the years and thereby “left” the non-citizen population. It should be noted that in prior analyses we looked at non-citizen Latin Americans who arrived in 1980 or later, not 1982 or later when looking for indirect evidence of trends in illegal immigration. We think that 1982 or later makes somewhat more sense; however, the inclusion or exclusion of those who arrived in the first few years of 1980s make no difference to the recent trend.
22 The Migration Policy Institute has figures from all of these organizations as part of its latest estimates.
23 The population estimates reflect the population in July of each year and are issued at the end of the same calendar year. Thus, the ACS weights, which also reflect the population in July of each year, match the population estimates for that year. However, because the monthly CPS is available almost immediately each month starting in January, it must be weighted based on what are, in effect, preliminary population estimates that are then carried forward until the following January, when the data is readjusted.
24 In a 2019 publication, we compared the CPS Annual Social and Economic Supplement (CPS ASEC) to the ACS. The CPS ASEC, or simply ASEC, includes the March CPS and an oversample of minorities. It also asks many additional questions and is the source for poverty rates and health insurance coverage. Unfortunately, like the ACS, there is a significant delay in the release in the ASEC, which comes out about half a year after it is collected. Like the monthly CPS, the ASEC consistently produces lower foreign-born estimates than the ACS until 2018. Since then it has generally produced higher estimates, even though, like the monthly CPS, it does not include the institutionalized and so should produce a slightly lower number than the ACS. The ASEC should also show a slightly lower foreign-born population because it reflects the population in March of each year, not July like the ACS. Although we outline some of the most important methodological differences between the ASEC and the ACS in our 2019 discussion, then as now we are not able to explain why the ACS stopped producing larger estimates of immigrants relative to the ASEC or the monthly CPS.
25 Respondents can be confused about who is supposed to be considered part of the household, particularly if someone just arrived or is expected to stay only for a short time. Speaking with a survey taker may help clear up any confusion, who will also reassure the respondent that all their answers are kept confidential.