An analysis of the Census Bureau’s monthly Current Population Survey (CPS) shows that the total foreign-born population (legal and illegal) in the U.S. hit 47 million in April of 2022 — a record high in American history. The foreign-born population includes all persons who are not U.S. citizens at birth. The size and growth of the foreign-born population in the CPS are important because, unlike arrival figures for legal immigrants or border apprehensions, the CPS measures the total number of legal and illegal immigrants actually living in the country, which is what ultimately determines immigration’s impact on American society.
There is a good deal of variation month-to-month in the data, but the two million increase in the foreign-born population since President Biden took office last January is both large and statistically significant. The dramatic growth is also quite striking because for the foreign-born population to grow at all, new arrivals must exceed both emigration and deaths, as all births to immigrants in the U.S., by definition, add only to the native-born population.
- The 47 million foreign-born residents (legal and illegal) in the country in April of 2022 is the largest number ever recorded in any U.S. government survey or decennial census.
- The total foreign-born population (legal and illegal) increased by two million in the first 16 months of the Biden administration — January 2021 to April 2022 — twice as fast as the U.S.-born population grew.
- We preliminarily estimate that illegal immigrants accounted for two-thirds of the growth in the foreign-born population since January 2021 — 1.35 million.
- Taking a longer view, since 2000, the total foreign-born population has grown by 50 percent; it’s doubled since 1990, tripled since 1980, and quintupled since 1970.
- As a share of the total population, the foreign-born now account for 14.3 percent of the population, or one in seven U.S. residents — the highest percentage in 112 years. As recently as 1990 they were one in 13 U.S. residents.
- If present trends continue, the foreign-born share of the population will reach 14.9 percent of the U.S. population in September 2023, higher than at any time in the nation’s 246-year history.
- On average the foreign-born population has grown by 132,000 a month since President Biden took office, compared to 59,000 per month in Obama’s first term, 76,000 per month in Obama’s second term, and 42,000 per month under Trump before Covid-19 hit.
- While much of the recent increase in the total foreign-born population is due to illegal immigration, those in the country legally still account for three-fourths of all foreign-born residents.
- The states with the largest increase in the total foreign-born population from January 2021 to April 2022 are California (up 527,000), Florida (up 390,000), Pennsylvania (up 375,000), Michigan (up 247,000), Georgia (up 152,000), Arizona (up 148,000), New York (up 145,000), Tennessee (up 130,000), and South Carolina (up 128,000).
Introduction
This analysis is based on the Current Population Survey (CPS), sometimes referred to as the “household survey”, collected each month by the Census Bureau for the Bureau of Labor Statistics (BLS). We use the terms “immigrant” and “foreign-born” interchangeably in this report.1 The foreign-born or immigrant population in Census Bureau data includes all persons who were not U.S. citizens at birth — mainly naturalized citizens, lawful permanent residents, long-term temporary visitors, and illegal immigrants. The CPS shows a dramatic rebound in the foreign-born population after declining in the latter half of 2019 and then a dramatic fall-off in 2020 due to Covid-19 travel restrictions. While the CPS is a very large survey of about 130,000 individuals, the total foreign-born population in the monthly data still has a margin of error of about ±500,000 using a 90 percent confidence level. This means there is a good deal of fluctuation from month to month in the size of this population, making it necessary to compare longer periods of time when trying to determine trends.2
The Foreign-Born Population in the Last Decade
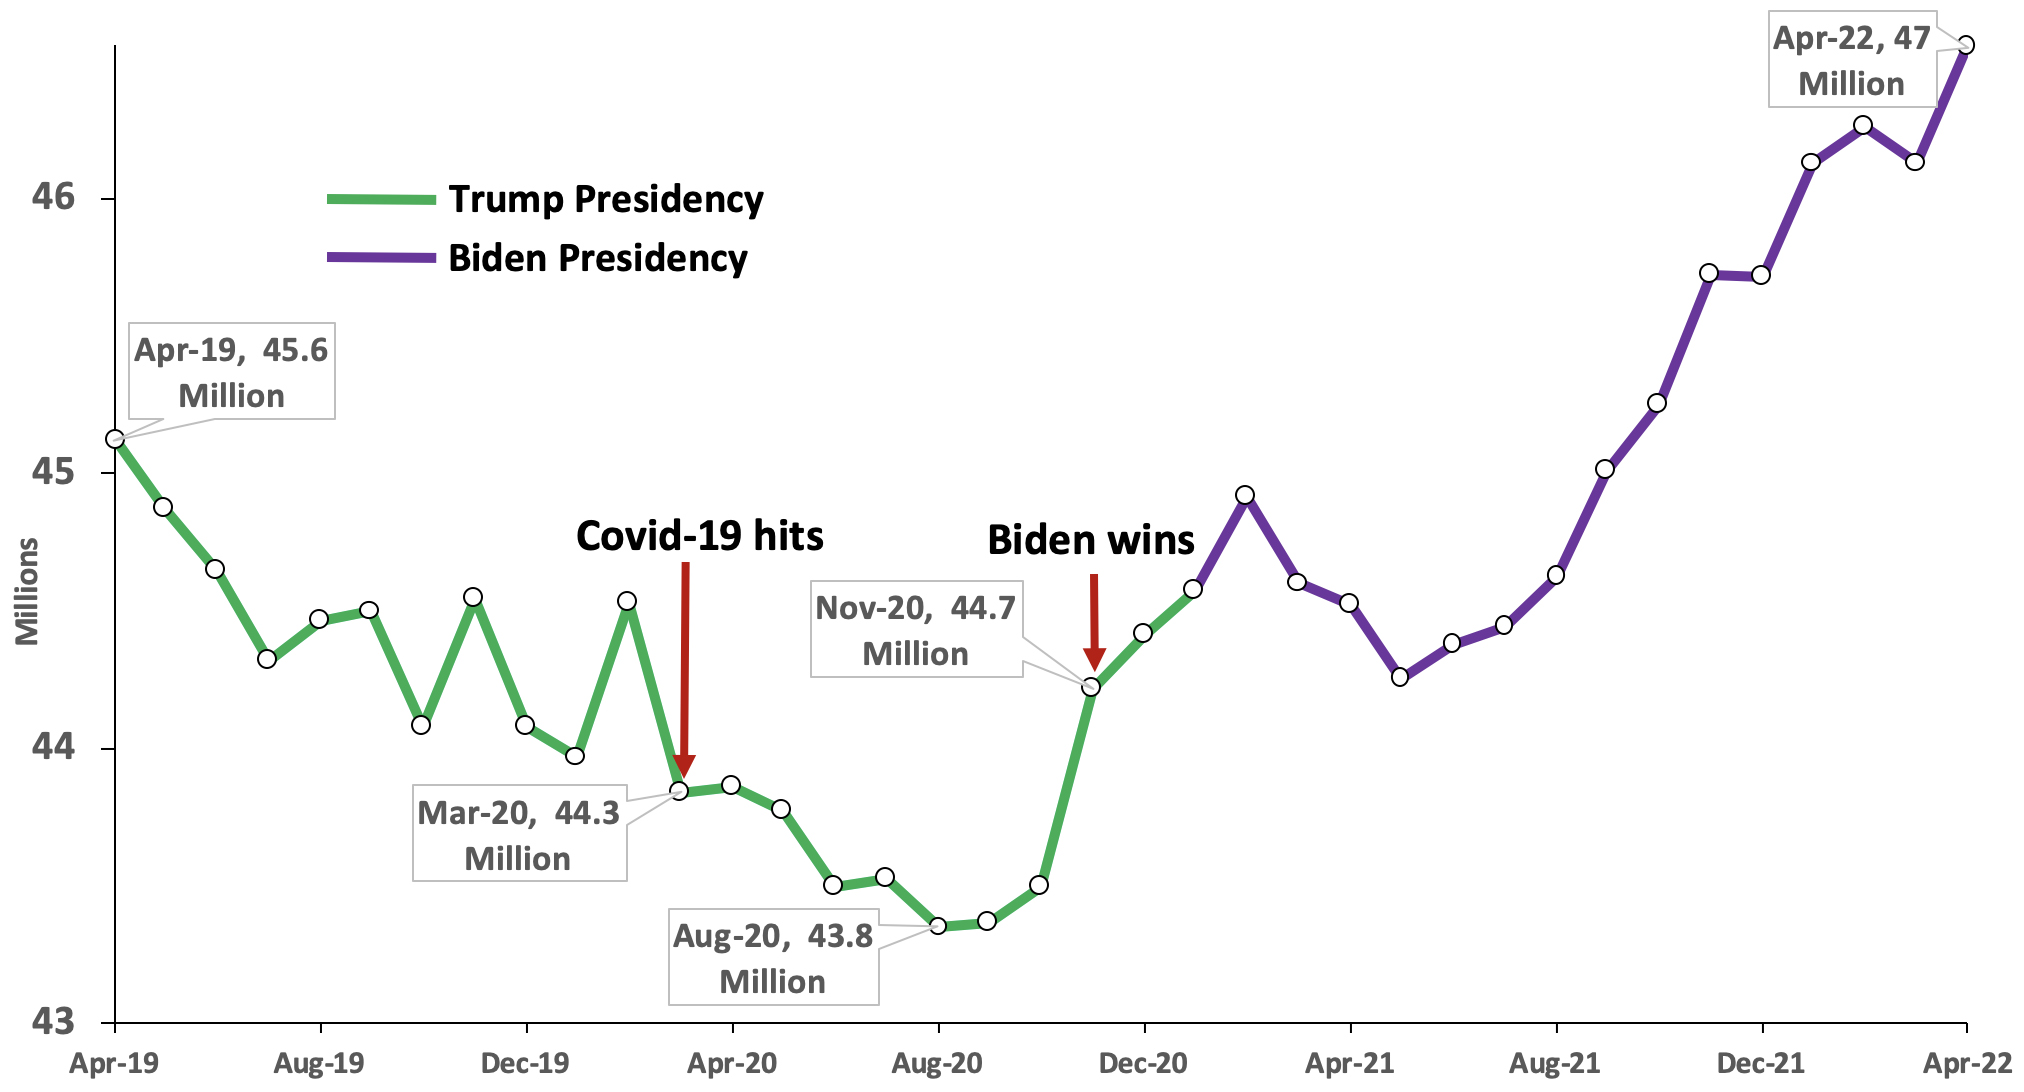
Recent Growth in the Foreign-Born Population. Figure 1 reports the total number of foreign-born residents in the United States from April 2019 to April 2022. Despite a strong economy before Covid-19 affected the country in March 2020, the figure shows the foreign-born population was declining. Once travel restrictions were imposed and Title 42 expulsions began at the border, the immigrant population declined through the middle of 2020, hitting a low of 43.8 million in August and September of that year. The foreign-born population has rebounded by 3.2 million since the summer of 2020. There has not been a 20-month period in which the immigrant population grew this much since the CPS first began to identify the foreign-born on a regular basis in 1994. Since President Biden took office in January 2021, the foreign-born population has increased by two million. In fact, the big upturn in growth began the month before he won office. It should be noted that it is possible that some of the increase immediately after the summer of 2020 may be due to better data collection as the pandemic abated; however, the BLS states that it has confidence in the quality of the data even at the height of Covid-19 in 2020.3
Figure 1. Foreign-Born Population, April 2019 to April 2022There are fluctuations in the data, but the overall trend shows some decline before Covid, then a large drop-off during the pandemic, followed by dramatic growth. (in millions) |
 |
Source: April 2019 to April 2022 public-use files of the Current Population Survey. |
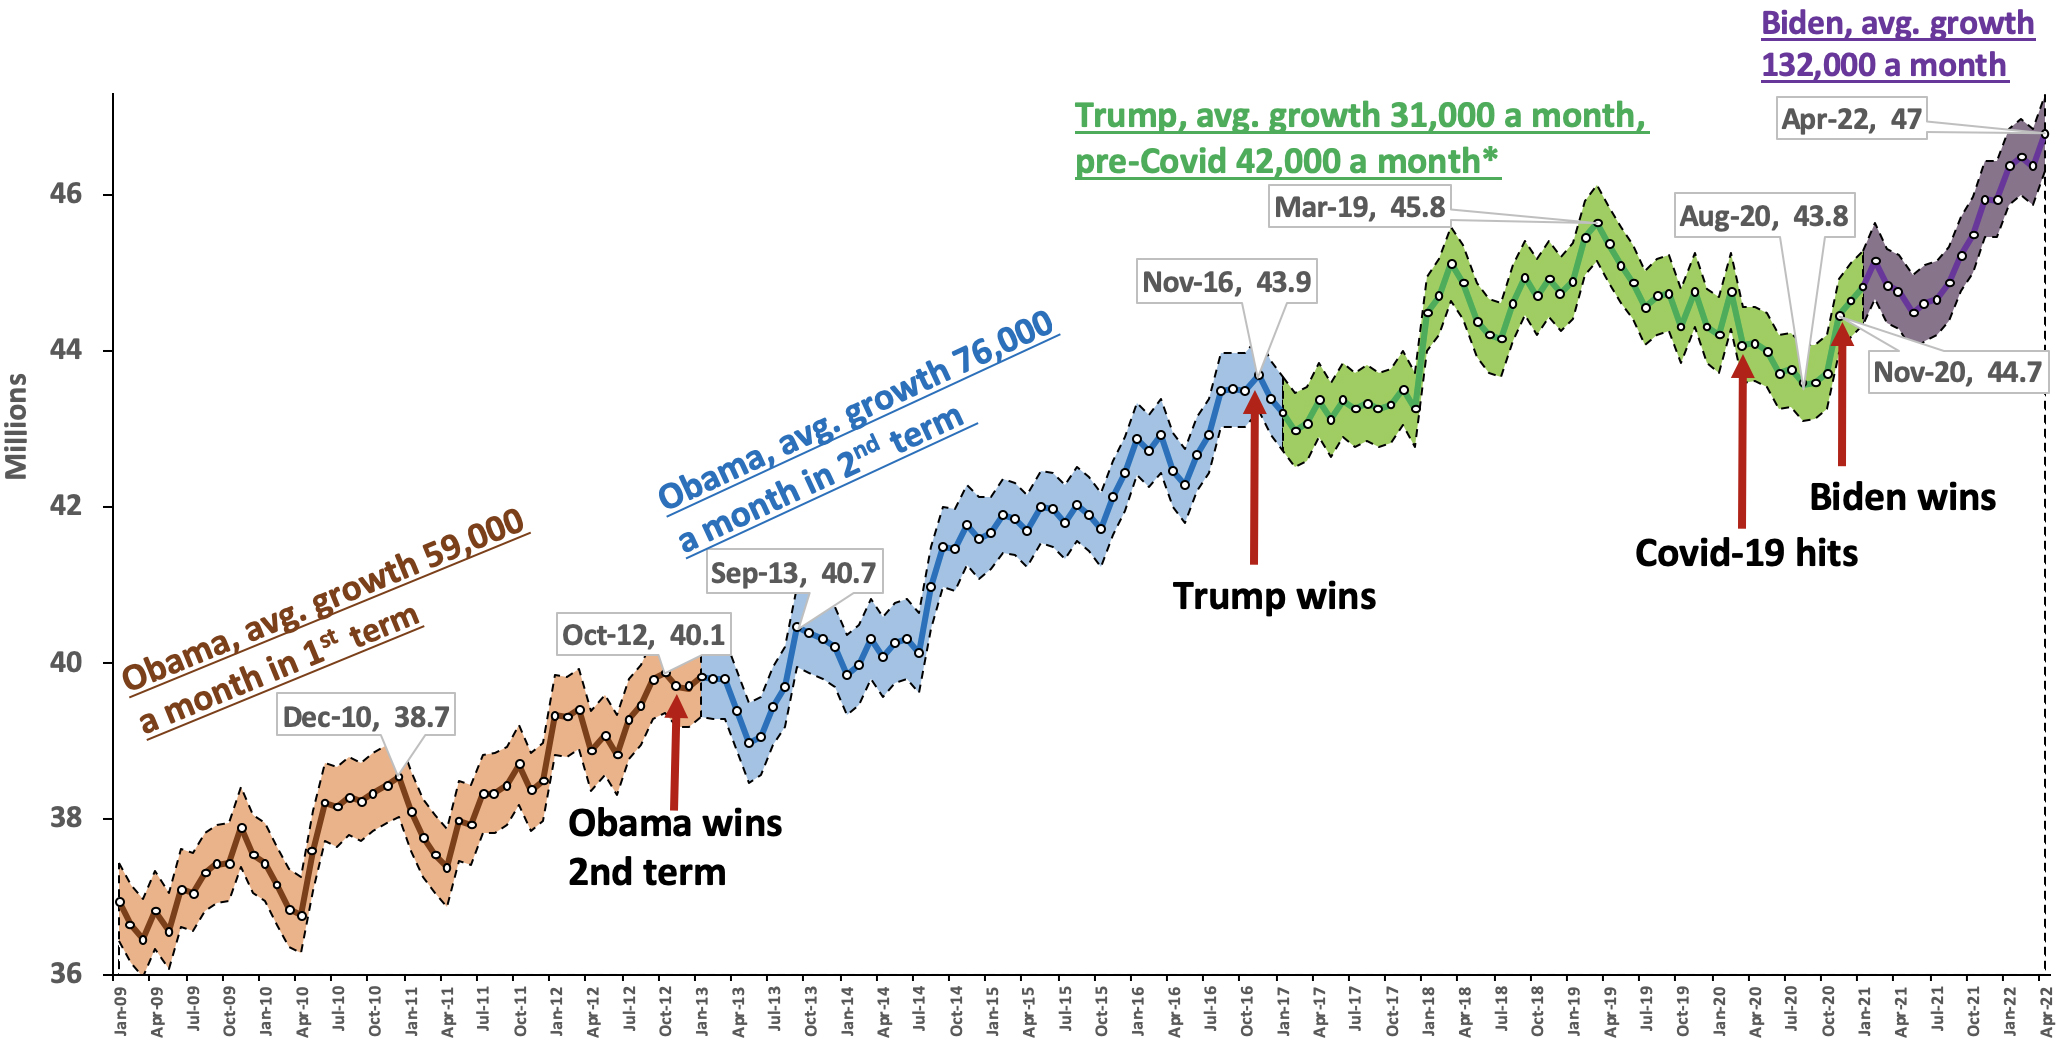
Growth in the Foreign-Born Population in the Last Decade. Figure 2 shows the size of the foreign-born population from the start of President Obama’s first term in January 2009 to April of this year, along with margins of error. The 47 million in April of 2022 is the largest number ever in American history. Numerically, the foreign-born population grew more than twice as fast as the U.S.-born population since the start of the Biden administration. Proportionally, the increase is 14 times faster — 0.3 percent versus 4.4 percent.4 What is so striking about the recent run-up in the number of immigrants is that growth represents the net change in their numbers in the country. For this population to grow so much, significantly more than two million new immigrants had to arrive to offset emigration, which we previously estimated at about one million annually, and deaths among the existing foreign-born immigrant population of about 300,000 each year.5 As a share of the total population, the foreign-born now account for 14.3 percent of the population, or one in seven U.S. residents — the highest percentage in 112 years.6
Figure 2. Foreign-Born Population, January 2009 to April 2022The average pace of growth in the foreign born in Biden's first 16 months is much faster than during Trump's or Obama's presidencies. (in millions) |
 |
Source: January 2009 to April 2022 public-use files of the Current Population Survey. Shaded area shows the margins of error around the point estimates, assuming a 90% confidence level. |
Fluctuations During the Trump Years. It is worth pointing out that, during the Trump administration, change in the size of the foreign-born population was somewhat more volatile than in Obama’s two terms or even Biden’s. Using absolute values to calculate the standard deviations (the average difference with the mean) of the change month-to-month in each administration shows that during Trump’s time in office it was 223,000, compared to 189,000 in Obama’s first term and 206,000 in his second, and 147,000 in Biden’s first 16 months.7 Figure 2 shows a particularly large spike in the foreign-born population from December 2017 to January 2018. This is partly explained by adjustments made in the CPS sample weights every January, though the size of the change that year was not particularly large. (We discuss the January re-weighting more in the appendix.) The total immigrant population shows fluctuations in the rest of Trump’s term as well, with a peak in March 2019 and then some decline in the months before Covid-19 followed by a significant fall-off as the pandemic unfolded in 2020. It is possible the peak in 2019 is related to the border crisis that year. In particular, the number of individuals in family units and unaccompanied minors, which had been increasing in 2018, exploded starting in February of 2019 and it took time for the administration to develop effective strategies to deal with it. It must be kept in mind that short-term trends in the CPS can represent real changes or they may represent “random walks” in the data that are common when any series of surveys is compared over time. That said, the dramatic growth in the foreign-born population in the last 16 months is both large and statistically significant.
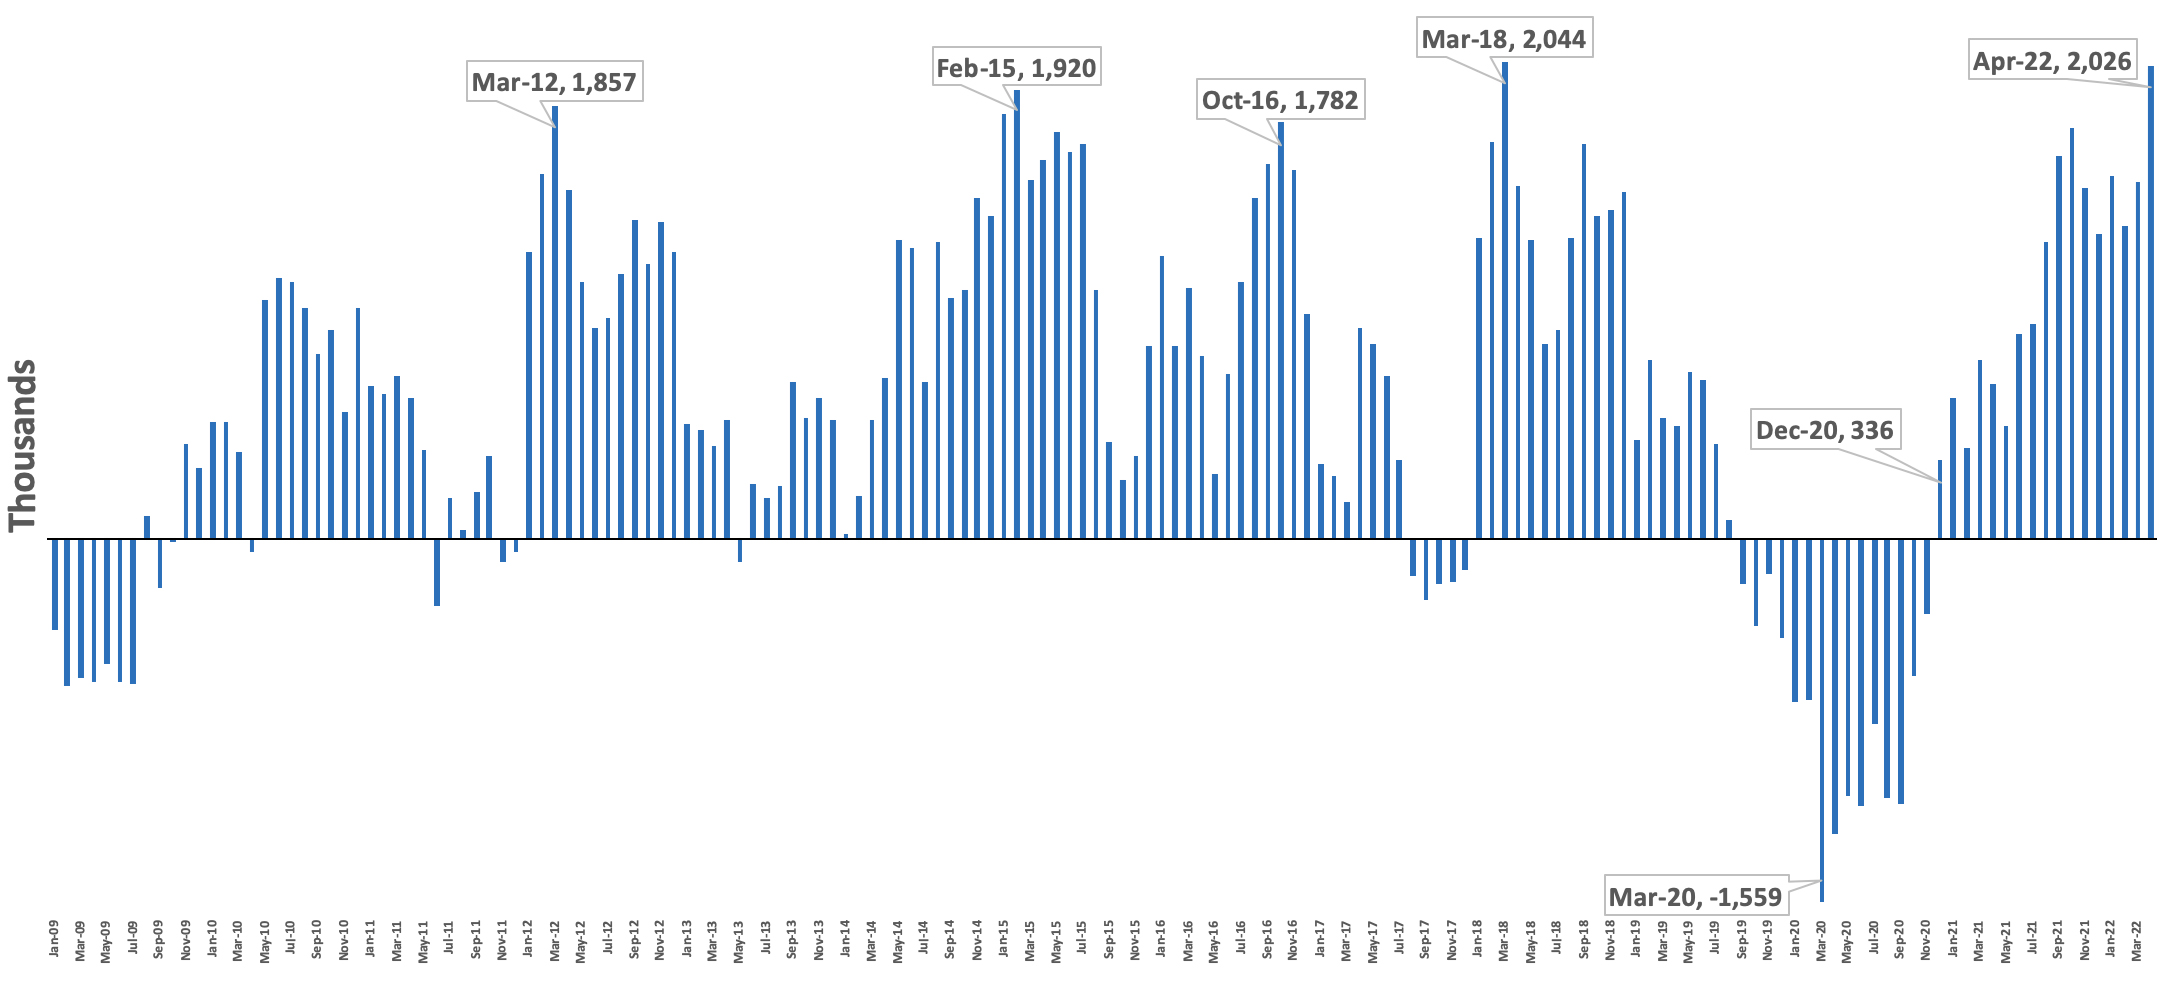
Yearly Growth. Figure 3 shows the change in the immigrant population when compared to the same month in the prior year. The impact of Covid-19 is clearly evident in the data, with large year-over-year declines from March to November 2020. However, as already mentioned, the foreign-born population was declining before Covid, beginning in September 2019. The figure shows that the foreign-born population began to grow, relative to the same month in the prior year, in December 2020 and has continued to increase every month thereafter. However, it is worth pointing out that Figure 3 shows that there have been other sustained periods of year-over-year growth in the foreign-born population since 2009 that are similar to the current increase. But it is also important to keep in mind that as the foreign-born population increases in size it makes it less likely it will grow unless ever more people are entering. This is because a larger immigrant population means there is a larger pool of people from which emigration can occur.8 Also, as the foreign-born population grows, the number of deaths among the existing population will tend to increase some as well.
Figure 3. Change in the Total Foreign-Born Population Compared to the Same Month in the Prior Year, January 2009 to April 2022 (in thousands) |
 |
Source: January 2009 to April 2022 public-use files of the Current Population Survey. |
Historical Context
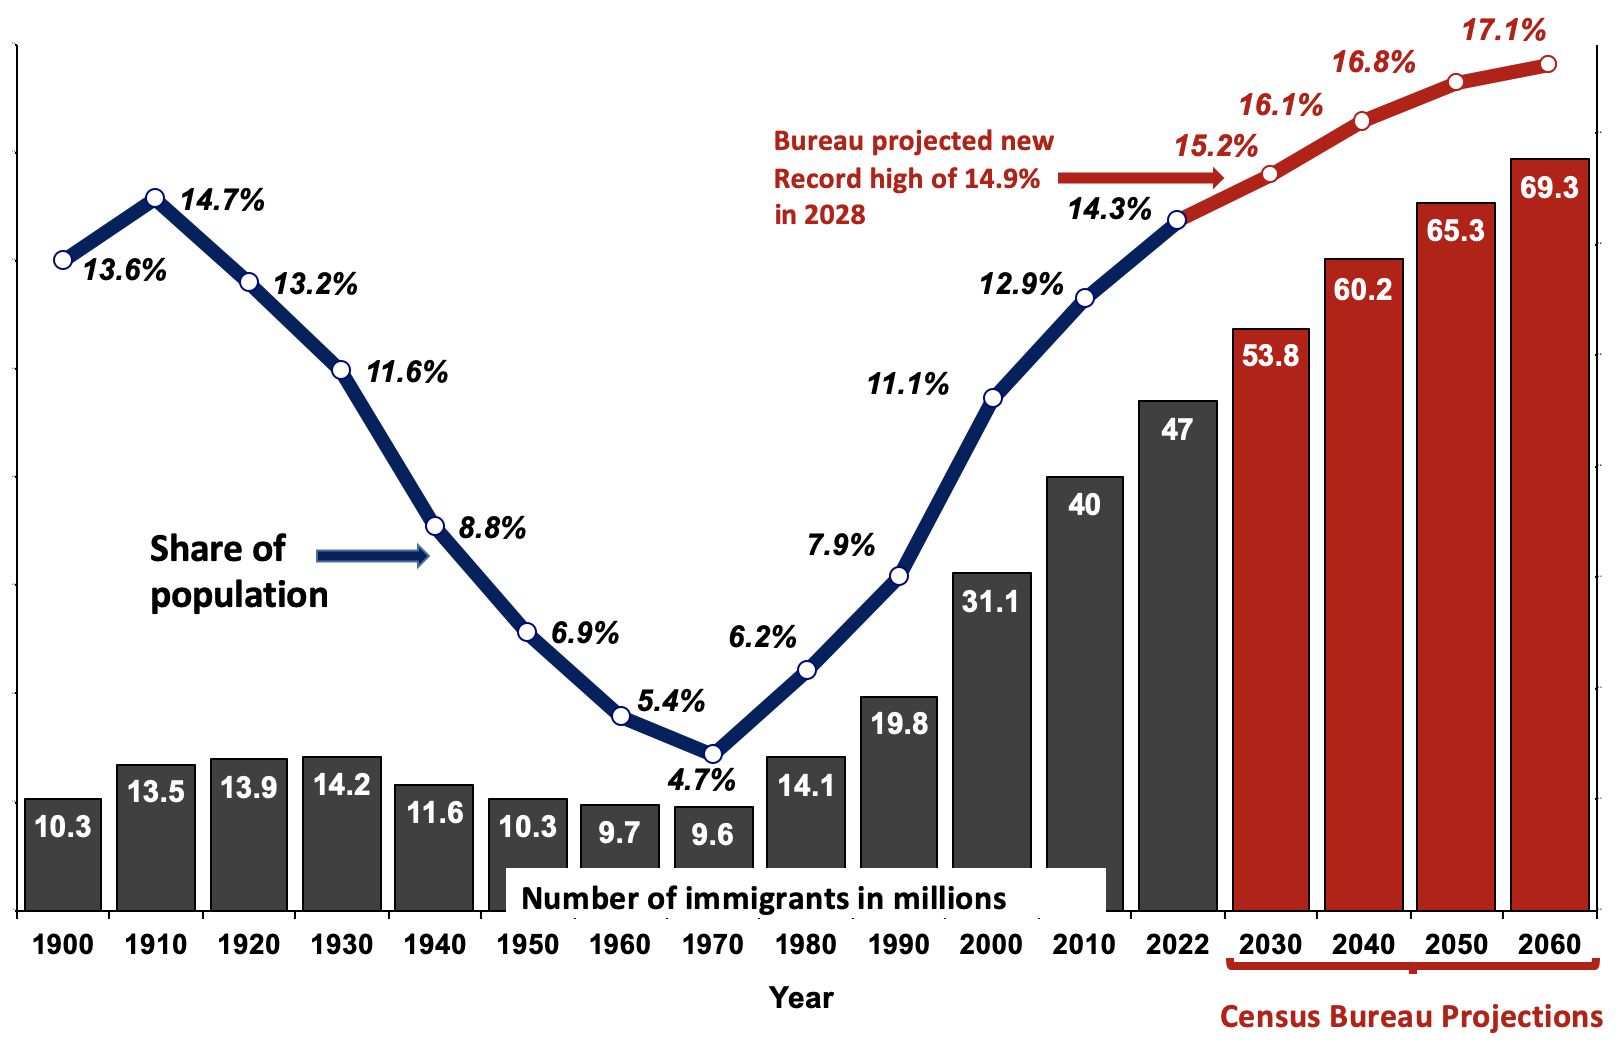
The Numbers Relative to the Past. Figure 4 shows that the 47 million foreign-born individuals in the country is a much larger population than in any year since 1900. In fact, it is larger than the foreign-born population measured in any prior decennial census or survey going back to 1850 when the foreign-born were first identified in the census. Of course, this is to be expected since the U.S. population was so much smaller in the 1800s relative to today. Although the increase in the last two years is dramatic in a relatively short period of time, taking the longer view, the growth over the last half-century has been truly enormous. Since 2000, the foreign-born population has grown by 51 percent; it has doubled since 1990, more than tripled since 1980, and quintupled since 1970.
Figure 4. Foreign-Born in the U.S., Number and Percent, 1900-2022, Plus Census Bureau Projections to 2060 |
 |
Source: Decennial censuses for 1900 to 2000; American Community Survey for 2010; April Current Population Survey (CPS) for 2022. The CPS does not include the institutionalized. For 2030 to 2060, see Census projections through 2060, reissued in September 2018 (See Table 8). |
The Percentages Relative to the Past. The foreign-born share of the U.S. population at 14.3 percent in April of this year is triple the share in 1970 and nearly double the share in 1990. Looking at prior censuses shows that 1870 (14.4 percent), 1890 (14.8 percent), and 1910 (14.7 percent) were the only times the foreign-born share was higher than today. At 14.3 percent, the foreign-born share in April is approaching the all-time highs reached more than a century ago. When thinking about the impact on American society and the importance of absolute numbers versus percentages, it seems fair to assume that both the size of the foreign-born population and its share of the population both matter.9
Where We’re Headed
Census Bureau Projections. In addition to the size of the foreign-born population and its share of the total U.S. population through April of this year, Figure 4 also shows the Census Bureau’s most recent “main series” projections in red. (The projections include both legal and illegal immigrants) In its methodology, the bureau assumed new immigration would be quite high in the coming decades, rising steadily from about 1.6 million a year in 2020 to just under 1.9 million a year in 2060. Net migration (the difference between the number coming versus leaving) is assumed to increase more slowly, from one million a year to 1.1 million annually over this time period.10 The large-scale immigration projected by the Census Bureau is expected to cause the foreign-born population to reach a record share of the population in 2028 of 14.9 percent and increase to levels thereafter not seen before in American history through the middle of this century.11 The bureau also projects that the total number of immigrants will be nearly 54 million by the end of this decade, and will continue to grow thereafter. In sum, the Census Bureau projections assume high levels of immigration in the coming years that will cause the foreign-born population to surpass all prior highs, both in terms of their share of the population and in absolute numbers.
Current Trends. The Census Bureau’s most recent projections were developed in 2017 and could not, of course, foresee the slowdown in immigration caused by the election of Donald Trump or as a result of the Covid-19 travel restrictions. As a result, the 47 million immigrants in the country in April of this year is lower than the 48.1 million the bureau projected for July 2022 (Census Bureau projections are for July of each year). But if the current rapid increases continue, both the number of immigrants in the country and their share of the total population will very quickly overtake even what the Census Bureau projected.
Figure 5 projects the foreign-born population to the end of President Biden’s first term using a linear model based on trends in the foreign-born population since January 2021. It shows that the foreign-born share will hit 14.9 percent of the total U.S population in September 2023. This record percentage is five years earlier than what the bureau projected.12 Figure 5 also shows that the total number of immigrants will reach 51.3 million by the end of President Biden’s first term — a good deal higher than the 49.6 million the Census Bureau projected for 2024.13 To be clear, Figure 5 is not a prediction, it simply reflects what will happen if recent trends continue.
Figure 5. If the foreign-born population continues to grow at the current pace, it will reach 51.3 million and 15.4 percent of the U.S. population by the end of Biden's term; both will be new records highs in U.S. history. |
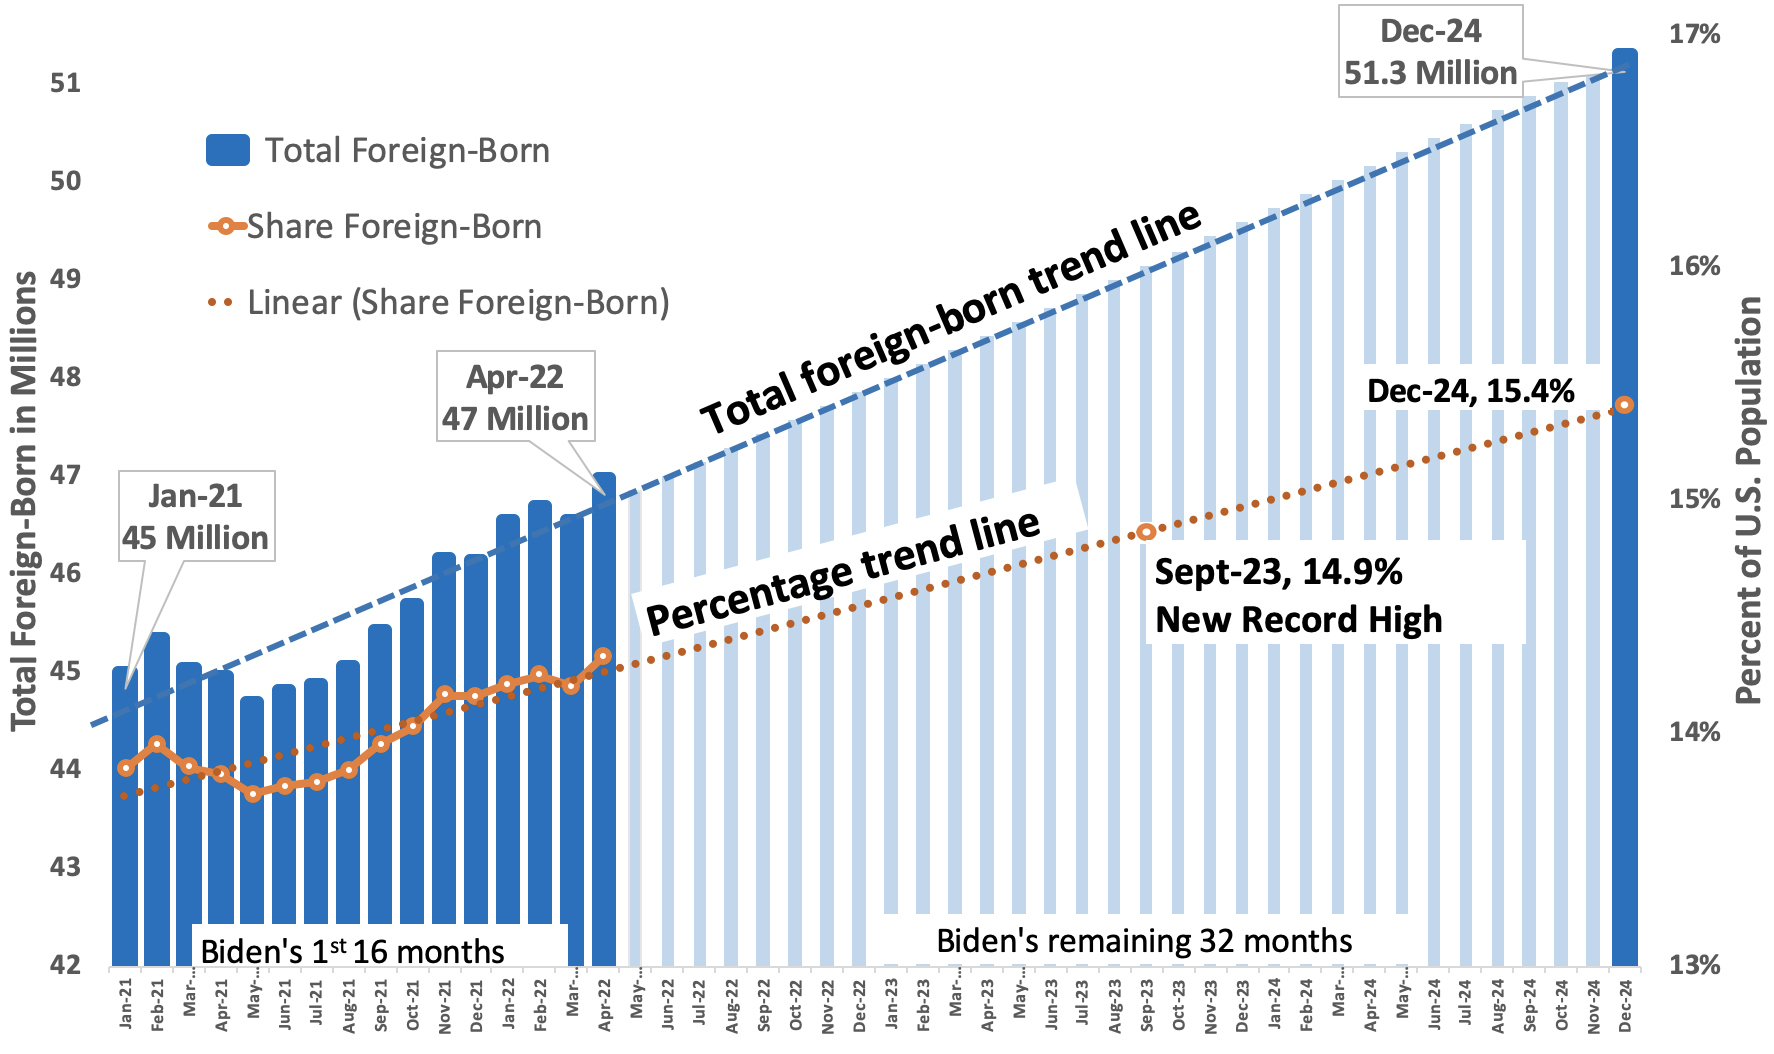 |
Source: Trend lines reflect linear projections of the size of the foreign-born population and its share of the U.S. population based on the public-use files of the Current Population Surveys from January 2021 to April 2022. |
A Resumption of Prior Tends? One interpretation of the dramatic growth in the foreign-born population is that it simply is making up for the slowdown during Covid-19. There is some truth to this when it comes to legal immigration since during Covid the processing of visas overseas greatly slowed. Of course, there is no reason legal immigration had to necessarily return to pre-pandemic levels, as the number of immigrants admitted is entirely a discretionary policy of the federal government, which is set by Congress. As we have seen, the rapid growth in the foreign-born population is so high that if the pace continues the overall number of immigrants and their share of the U.S.-population will quickly overtake even what the Census Bureau projected. The scale of immigration also exceeds prior recent administrations. The immigrant population in President Biden’s time in office has grown by an average of 132,000 per month, compared to 59,000 per month in Obama’s first term, 76,000 per month in his second, and 42,000 per month in the first 38 months of Trump’s presidency, before Covid-19 hit.14 The current scale of immigration would seem to be very different than anything in the last 13 years.
Another way to look at the long-term trend versus the current rapid growth is to plot a trend line in the growth of the foreign-born back to the first Obama administration in January 2009 to the present. Such a line shows that by April of this year the total foreign-born population was already 400,000 above trend. Of course, it not at all clear that it makes sense to compare the trend going back that far. In the year prior to Covid-19, February 2019 to February 2020, the foreign-born population did not increase at all in size, despite a strong economy. The recent run-up in the numbers is certainly not a resumption of a trend that existed immediately before Covid.15 In our view, it makes more sense to see the current increase as a direct result of policy changes, particularly changes that spurred illegal immigration.
Illegal Immigration
Illegal Immigrants in the CPS. The Census Bureau is clear that illegal immigrants are part of the foreign-born in its surveys. The Bureau of Labor Statistics also acknowledges the inclusion of illegal immigrants in the CPS. In an analysis done in March of this year based on the monthly CPS, we estimated the illegal immigrant population grew from 10.22 million in January 2021 to 11.35 million in January 2022, with a preliminary estimate for February of 11.46 million. Due to limited availability of administrative data, we have not updated our illegal immigrant estimate for April of this year. However, as we explain below, it is likely that the illegal population increased to 11.6 million by April 2022. This means that illegal immigrants accounted for some 1.35 million (about two-thirds) of the two million growth in the total foreign-born population since President Biden took office.16 This growth is extraordinary because for the illegal immigrant population to grow, new arrivals do not simply have to exceed deaths and emigration, as is true for the total foreign-born, they also have to exceed legalizations, which are substantial every year.17 This means that the number of new illegal immigrants who settled in the country in the last 16 months must be a good deal larger than 1.35 million.
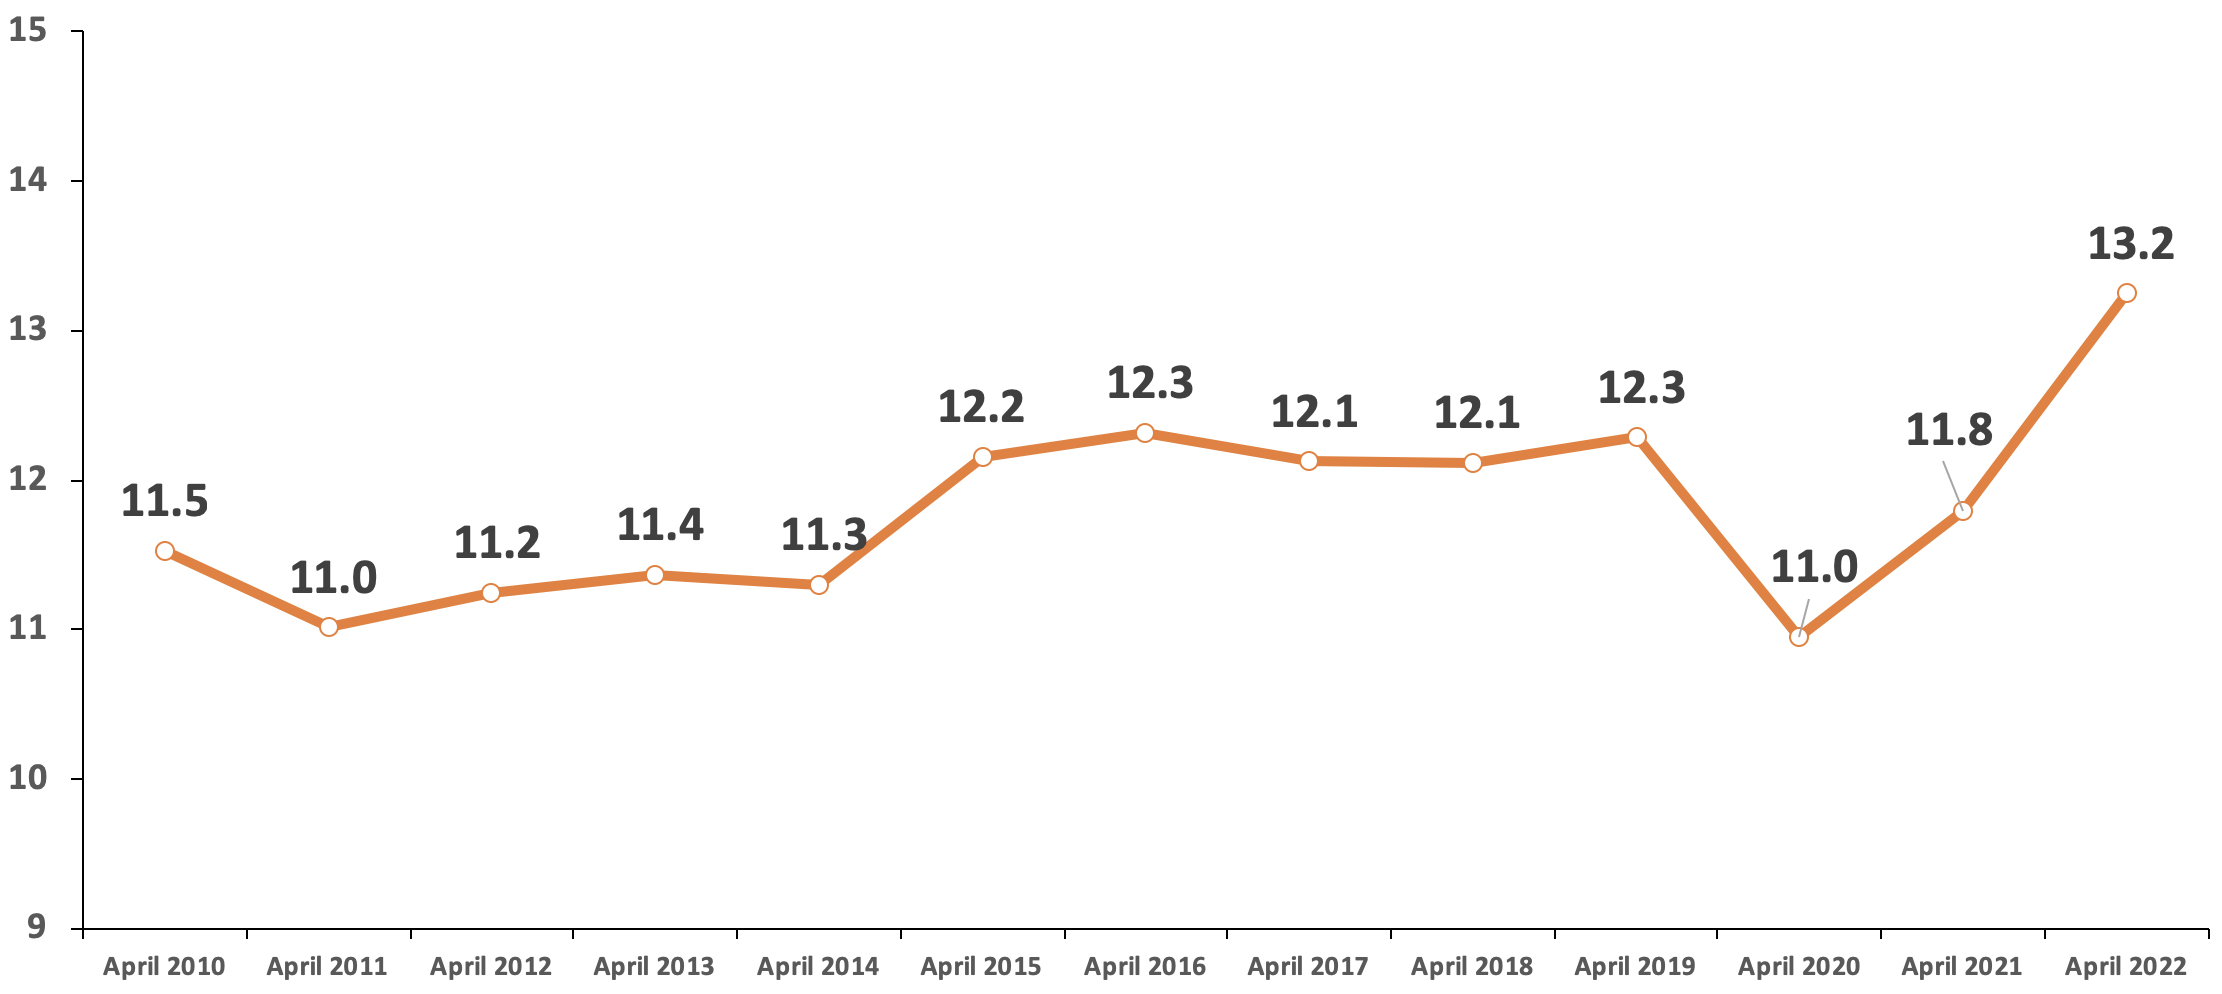
Indirect Evidence of Illegal Immigration. For the most part, illegal immigrants should show up in Census Bureau surveys as non-citizens. Moreover, the federal government, as well as outside researchers, have estimated that nearly three-quarters of illegal immigrants are Hispanic. Because of the 1986 IRCA amnesty there are also virtually no illegal immigrants who arrived prior to 1980 currently living in the country.18 Figure 6 reports the number of non-citizen Hispanics from April 2010 to April 2022 who indicated in the CPS that they arrived in the United States in 1980 or later. The relative stability in this population between 2010 and 2019 is consistent with DHS, Center for Migration Studies, and Pew Research Center’s estimates showing only modest changes in the size of the illegal population in recent years.
Figure 6. Non-Citizen Hispanics, April 2010 to April 2022The number of non-citizen Hispanics who arrived in 1980 or later,* which substantially overlaps with illegal immigrants, was relatively stable from 2010 to 2019. It then declined in 2020, followed by a sharp increase in 2021 and 2022. (in millions) |
 |
Source: Public-use files of the April 2010 to April 2022 Current Population Survey. |
Figure 6 shows that the number of non-citizen Hispanic immigrants who arrived in 1980 or later grew significantly from April 2021 to April 2022, after dipping during 2020, and is now well above pre-Covid levels. This is consistent with our prior estimate showing a large increase in the number of illegal immigrants from 2021 and 2022. Moreover, between just February and April of this year, the non-citizen Hispanic population grew by 158,000 (1.2 percent). If we assume that the illegal-immigrant population grew in a similar fashion, it would mean there were roughly 11.6 million illegal immigrants in the country in April 2022 — a 1.35 million increase over January 2021. If correct, illegal immigrants account for two-thirds of the increase in the total foreign-born population since the start of 2021.19 It seems clear that something has fundamentally changed and the illegal immigrant population has grown dramatically after being relatively stable for a number of years.
What’s Causing the Rapid Growth
What’s Changed? At least some of the dramatic increase in the foreign-born population corresponds to the large surge of illegal immigrants at the southern border. This dramatic increase in border encounters seems closely related to President Biden’s campaign promises that created the perception, well before he even took office, that he would curtail immigration enforcement. Further, the administration’s decision to end the Migrant Protection Protocols (also called Remain in Mexico) for many asylum applicants, the scaling back of Title 42 expulsions, and more recently the decision to end it all together, coupled with the release of some three-quarters of a million illegal immigrants encountered at the border as well as 146,000 unaccompanied minors, almost certainly has encouraged even more illegal immigrants to arrive at the southern border in the hope they, too, will be released into the country. The administration’s suspension of nearly all interior deportations and the resulting dramatic decline in immigration enforcement, including deportations, plus its refusal to automatically take custody of non-citizens released from jails and prisons have all likely made illegal immigrants feel safer, reducing emigration of those already here and encouraging new illegal immigration. Finally, efforts by some in Congress to pass a bill legalizing illegal immigrants and the White House’s continued support for such legislation cannot help but persuade some illegal immigrants in the country not to leave, as well as causing more to come.
Legal Immigration. Illegal immigration is not the only factor causing the sudden growth in the overall foreign-born population. Legal immigration accounts for an estimated one-third of the increase since January 2021. A number of factors have likely contributed to the recent growth in the legal foreign-born population. The restarting of visa processing at American consulates has allowed many more permanent immigrants (green card holders) to arrive from abroad, as well as short-term (e.g., tourists) and long-term temporary visitors (e.g., guestworkers and students). While much of the recent increase in the total foreign-born population is due to illegal immigration, overall those in the country legally account for three-fourths of foreign-born residents. Legal immigration has a much larger impact on American society than illegal immigration.
Conclusion
Immigration has many impacts on American society, including cultural, fiscal, economic, demographic, and political. The effect is directly related to the scale of immigration. The latest data shows the scale of migration into the county has been enormous in the last year. The government’s monthly Current Population Survey shows that the foreign-born population (legal and illegal) reached 47 million in April 2022, the highest number ever in American history and an increase of two million just since January 2021. We estimate that illegal immigrants accounted for about two-thirds or 1.35 million of this increase.
As a share of the total population, the foreign-born now account for 14.3 percent of the U.S. population — the highest percentage in 112 years. If present trends continue, the foreign-born share of the population will surpass the all-time high in American history by September of next year. Immigration is sometimes seen as like the weather — something outside the control of public policy. In fact, it must be understood that the level of legal immigration as well as policies and resources directed at controlling illegal immigration all represent policy choices. The dramatic growth in the foreign-born population in the last 16 months are the direct result of those choices.
Appendix
The Data. The monthly Current Population Survey (CPS) used in this analysis is collected by the Census Bureau. It is used primarily by the Bureau of Labor Statistics (BLS) to measure unemployment and other labor-force statistics every month. The CPS surveys the non-institutionalized civilian population and, like virtually all modern surveys, the Census Bureau weights the data to reflect the total population. Each January, the population controls are readjusted to reflect updated information about births, deaths, and net international migration. The January 2022 adjustment had the effect of increasing the civilian non-institutionalized 16 and older population by 973,000. Of course, only a share of this increase was among immigrants. The whole point of the adjustments by the Census Bureau is to make the numbers more accurate. But it does mean that every January there is some break in the continuity of the data, which of course is true for all the information in the CPS, such as unemployment or labor force participation.
Potential Problems with the Data. The BLS reports that response rates to the CPS after March 2020 have been lower than prior to Covid-19, though rates have improved since hitting a low in June 2020. These lower rates increase the sampling error of the survey. It is not known if this problem had any specific impact on estimates of the foreign-born in the data. However, in June 2020, when the problem was most pronounced, BLS stated that “Although the response rate was adversely affected by pandemic-related issues, BLS was still able to obtain estimates that met our standards for accuracy and reliability.” This is in contrast to the American Community Survey, which is the other large survey collected by the Census Bureau that identifies the foreign-born.
The Census Bureau’s Other Survey. Consistent with the monthly CPS, the Census Bureau’s much larger American Community Survey (ACS) from 2020 also shows a significant decline in the foreign-born population between 2019 and 2020. Unfortunately, the Census Bureau encountered significant problems collecting the 2020 ACS due to disruptions caused by Covid-19. As a result, the bureau states that it was “unable to collect information from certain segments of the population” in 2020, particularly lower-income and less-educated individuals.20 So we do not have a clear picture of the foreign-born in 2020 based on the ACS. But even if there were no problems with the 2020 ACS, it is collected throughout the year and weighted to reflect the population in July 1 each year. Therefore, it would only reflect conditions before the restarting of legal immigration or the border surge that began after July 2020. Moreover, the 2021 ACS is still being processed and will probably not be released until September or October 2022, by which time it too will be more than a year out of date. Normally, this would not be a problem, but the dramatic run-up in the numbers in just the last year means that even the 2021 ACS will not reflect the rapidly evolving immigration situation. For these reasons, the monthly CPS currently represents the best option for studying the rapidly changing immigration situation in the United States.21
End Notes
1 The term “immigrant” has a specific meaning in U.S. immigration law, which is all those inspected and admitted as lawful permanent residents. In this analysis, we use the term “immigrant” in the non-technical sense of the word to mean all those who were not U.S.-citizens at birth.
2 The margins of error shown in Figure 2 are based on standard errors calculated using parameter estimates, which reflect the survey’s complex design. To the best of our knowledge, neither the BLS nor the Census Bureau has provided parameter estimates for the general population in the monthly CPS, so we use those for the labor force.
3 See appendix section on data at the end of this document.
4 The CPS shows that the U.S.-born population grew 0.30 percent (852,000), while the foreign-born population grew 4.4 percent or just under two million. It is worth noting that the CPS, like virtually all modern surveys, is weighted to reflect the size and composition of the nation’s population. Though the weighting process is multi-stage and very complex, the key demographic characteristics used to weight the survey are race, Hispanic origin, sex, and age. Nativity is not one of the characteristics used in weighting. The identification of the foreign-born reflects what survey respondents tell interviewers, much like unemployment or educational attainment. Since respondents can be only either U.S. or foreign-born, this means that, for the most part, within the same calendar year faster growth in the foreign-born is offset by slower growth in the U.S.-born and vice versa. This reflects the way the survey is controlled to a total target population, which can vary based on what the Census Bureau believes is the actual size and composition of the U.S. population across demographic and other characteristics. This fact has implications for the relative growth in the foreign-born and native-born populations. Each January, the weights are readjusted to reflect updated information about births, deaths, and net international migration.
5 Some research indicates that emigration in the recent past was even higher.
6 The CPS does not include the institutionalized population, primarily those in nursing homes and prisons. We can gauge the impact of including the institutionalized when calculating the foreign-born percentage by looking at the public-use annual American Community Survey (ACS), which does include the institutionalized. In 2019, immigrants (legal and illegal) were 13.64 percent of the total population in the ACS if the institutionalized were included and 13.72 percent when they were not included — less than one-tenth of a percentage-point difference. The distribution of immigrants across the institutionalized and non-institutionalized changes very little from year to year, so the foreign-born share of the population in April 2022 might have been about a one-tenth of 1 percent lower if the institutionalized were included.
7 Absolute values measure the magnitude of the change month-to-month so, for example, negative 200,000 (a decline) is treated the same as a positive 200,000 (growth).
8 To understand why this happens consider a constant emigration rate of 2 percent. If the foreign-born population is 40 million then it means about 800,000 people would be leaving each year, but if the population is 47 million then it would create emigration of 940,000 immigrants annually. Of course, actual emigration varies from year to year, but a larger foreign-born population means that the potential pool of immigrants who might leave in any given year is larger.
9 When considering the impact of immigration on the country, the foreign-born share may seem like the only factor that matters. While percentages are certainly important, the absolute size almost certainly matters as well. For example, when thinking about the successful integration of immigrants, 500,000 foreign-language speakers may be enough to create linguistic and cultural isolation or conversely an ethnic enclave that fosters entrepreneurship, whether this 500,000 constitutes 10 percent of an urban area or 30 percent.
10 This is partly because the bureau applies constant emigration rates by age, sex, Hispanic origin, and arrival cohort (see Table 2 of the projections methodology) to an ever-growing foreign-born population, which means that the number leaving the country is a bigger number over time. This has the effect of offsetting, to some extent, the larger number of new immigrants the Census Bureau foresees in the coming decades, resulting in net immigration that increases more slowly than new arrivals.
11 As for the historical size of the foreign-born population, the decennial Census did not identify all of the foreign-born until 1850, though the 1820 and 1830 censuses did report the number of “foreigners not naturalized”, though only among the white population. Those numbers along with immigrant arrival data and other research indicates that prior to 1850 the foreign-born were not more than 10 percent of the U.S. population.
12 The Census Bureau projected (Table 8) that the foreign-born share of the population would research 14.9 percent in 2028. The higher than expected number of projected deaths due primarily to obesity and opioids, and then the huge increase in mortality caused by Covid-19 coupled with lower than expected fertility has meant that the native-born population is smaller than the bureau projected and this has had the effect of increasing the foreign-born share of the overall population, once immigration began to increase rapidly in the last 18 months.
13 Table 8 in the Census Bureau projections shows the projected size of the foreign-born population by year. The key reason the immigrant population is now growing so much faster than the Census Bureau projected is that net migration has been much higher than the bureau assumed. It is possible to estimate net migration by simply adding the growth in the foreign-born to the number of expected deaths. While the monthly CPS, with its relatively large margin of error is not ideal for estimating net migration, if we add growth in the foreign-born year over year in the same month (as shown in Figure 3) beginning in January 2021, and add in deaths (six per 1,000), it produces an average annualized net migration figure of roughly 1.4 million among the foreign-born. This is about 40 percent higher than what the Census Bureau projected for this time period. If we just compare growth in the foreign-born in April 2021 to the foreign-born in April 2022, then the implied level of net immigration is 2.3 million. But given the limitations of the CPS it makes more sense in our view to average a whole year of data to obtain a more statistically robust estimate of net migration rather than just two months of data.
14 The average increase for Obama’s first term reflects growth in the foreign-born population between January 2009 and December 2012 of 2.76 million divided by 47 months to reflect the changes that occurred after January 2009 when he took office. (Although each presidential term lasts 48 months, there are only 47 monthly changes in the data in a single term.) The average increase for Obama’s second term reflects growth in the foreign-born population between January 2013 and December 2016 of 3.56 million divided by 47 months. For Trump’s first 38 months, the average increase reflects growth in the foreign-born population between January 2017 and February 2020 (before Covid-19) of 1.57 million divided by 37 months. We chose February 2020 to reflect pre-Covid growth in the foreign-born population because Covid arrived in a big way in March. For Biden, the average reflects growth in the foreign-born population between January 2021 and April 2022 of two million divided by 15 months. Of course, dividing by 48 months for each of Obama’s terms, 38 months for Trump’s time in office through February 2020, and for all of Biden’s 16 months in office would produce very similar monthly averages: 57,000 for Obama’s first term, 74,000 for his second, 41,000 for Trumps first 38 months, and 124,000 for Biden’s first 16 months.
15 Recently, some have argued specifically that the number of immigrant workers remains below the pre-Covid trend line, and we are, in effect, “missing” some two million foreign-born workers. However, that analysis ends in December 2021, so it does not take into account increases this year. The “missing worker” analysis also ignores the trends in the number of workers before Covid hit. In April 2019, before Covid, there were 27.61 million immigrants holding a job in the United States, 347,000 more than in April 2018. If the number of immigrant workers had continued to increase at that pace, then by April 2022 there would have been 28.65 million immigrant workers, which is nearly identical to the 28.45 actually working in April of this year. In fact, there is not a statistically significant difference between these two numbers. In short, it is hard to find any evidence of “missing” workers now.
16 It must be remembered that our estimates of illegal immigrants based on the CPS include an undercount adjustment of 2.3 percent that impacts both the baseline January 2021 estimate and our estimates in 2022. Our unadjusted January 2021 estimate is 10 million and 11.35 million for April 2022 — an increase of 1.35 million since January 2021, or equal to about two-thirds of the increase in the overall foreign-born population in the last 16 months.
17 Illegal immigrants can legalize in a number of different ways, including when asylum applicants are granted asylum or sometimes when they marry a U.S. citizen. Former INS researchers Robert Warren and his son estimate that 104,000 illegal immigrants adjusted status in 2009 alone. In a more recent paper, Warren estimates that between 2010 and 2019, 390,000 illegal immigrants from Mexico “left” the illegal population by adjusting to legal status.
18 In addition to IRCA, Section 249 of the Immigration and Nationality Act (INA) allows individuals who have lived in the United States since January 1972 to apply for lawful permanent residency under what is often referred to as the “registry provision” of the law. This provision also makes it very unlikely that there are substantial numbers of pre-1980 illegal immigrants in the country.
19 By itself, Figure 6 provides confirmation that much of the increase in the total foreign-born population is due to illegal immigration. The figures show that the post-1979 non-citizen Hispanic population grew 1.45 million from April 2021 to April 2022, which is equal to 73 percent of the total increase in the total foreign-born population.
20 The Census Bureau has published a detailed analysis showing some of the problematic results in the 2020 ACS. Due to these problems with the 2020 ACS, the bureau has only put out a limited number of tables from the 2020 ACS.
21 In addition to the monthly CPS there is also the Annual Social and Economic Supplement to the CPS (CPS ASEC) collected in March each year that does identify immigrants. It oversamples minorities and asks many more questions than the monthly CPS and has been for many years an invaluable source of information on the nation’s foreign-born. However, that survey is still basically part of the CPS and it is typically released in August or September of the year it is collected, so it is never as up to date as the monthly CPS.