Download a pdf of this Memorandum
While the current high rate of official unemployment is well known, there is a broader measure of employment that the Bureau of Labor Statistics calls U-6. It includes the unemployed as well as people who would like to work, but who have not looked for a job recently and those involuntarily working part-time. In addition, there are individuals who are not in the labor force at all. A look at these numbers shows the situation is particularly bad for minorities, the young, and less-educated Americans. These are the workers who face the most competition from immigrants ─ legal and illegal. (All figures in this report are seasonally unadjusted and are from the third quarter of 2009.)
Number unemployed or underemployed:
- As of the third quarter of 2009, there are 12.5 million unemployed native-born Americans, but the broader U-6 measure shows 21 million natives unemployed or underemployed.
- There are 6.1 million natives with a high school education or less who are unemployed. Using the U-6 measure, it is 10.4 million.
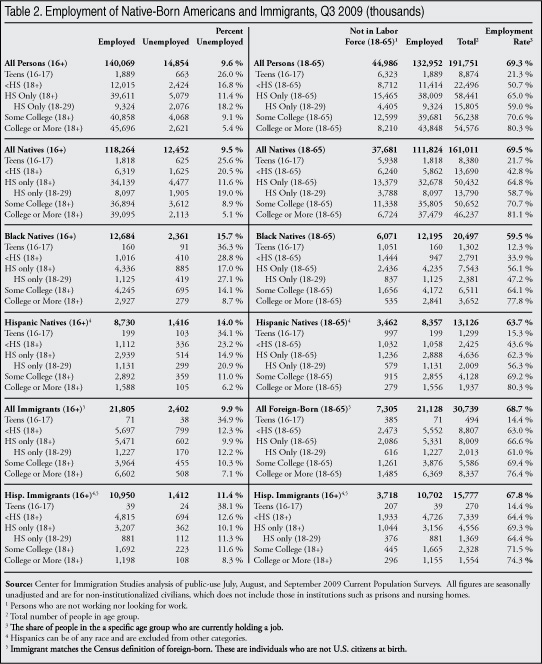
- In addition to those less-educated natives covered by U-6, there are another 18.7 million natives with a high school education or less not in the labor force, which means they are not looking for work.
- The total number of less-educated (high school education or less) natives who are unemployed, underemployed, or not in the labor force is 29.1 million.
- There also are 6.6 million native-born teenagers (16 and 17) not working.
- To place these numbers in perspective, there are an estimated seven to eight million illegal immigrants holding jobs.
Unemployment rates for less-educated and younger workers:
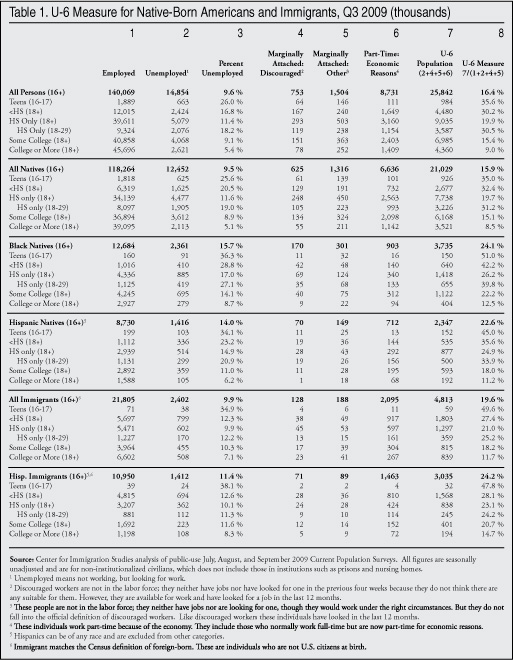
- As of the third quarter of 2009, the overall unemployment rate for native-born Americans is 9.5 percent; the U-6 measure shows it as 15.9 percent.
- The unemployment rate for natives with a high school degree or less is 13.1 percent. Their U-6 measure is 21.9 percent.
- The unemployment rate for natives with less than a high school education is 20.5 percent. Their U-6 measure is 32.4 percent.
- The unemployment rate for young native-born Americans (18-29) who have only a high school education is 19 percent. Their U-6 measure is 31.2 percent.
- The unemployment rate for native-born blacks with less than a high school education is 28.8 percent. Their U-6 measure is 42.2 percent.
- The unemployment rate for young native-born blacks (18-29) with only a high school education is 27.1 percent. Their U-6 measure is 39.8 percent.
- The unemployment rate for native-born Hispanics with less than a high school education is 23.2 percent. Their U-6 measure is 35.6 percent.
- The unemployment rate for young native-born Hispanics (18-29) with only a high school degree is 20.9 percent. Their U-6 measure is 33.9 percent.
- The overall unemployment rate for immigrants (legal and illegal) is 9.9 percent. Their U-6 measure is 19.6 percent, which is significantly higher than the rate for natives.
- The unemployment rate for immigrants with less than a high school education is 12.3 percent. Their U-6 measure is 27.4 percent. The unemployment rate for young immigrants (18-29) with only a high school education is 12.2 percent. Their U-6 measure is 25.2 percent.
Discussion
The unemployment rate excludes some people who may want to work, but who are not actively looking for a job and are therefore not officially unemployed. Also, the official unemployment figures do not include those working part-time, but who want to work full-time. In order to get a broader or more comprehensive measure of unemployment and underemployment, the Bureau of Labor Statistics (BLS) developed the U-6 measure (the official unemployment rate is referred to as U-3). The methodology section of this report explains in detail who is included in the U-6 measure of unemployment. Table 1 reports unemployment figures and the broader U-6 measure of unemployment and underemployment. This more comprehensive measure of unemployment includes those who are officially unemployed, those who are involuntarily working part-time, and those “marginally” attached to the labor market. People who are marginally attached indicate that they would like to work but are not actively looking for a job because economic conditions and their own experience indicate that it is futile. Table 2 reports the percentage and number employed and unemployed, and the number of people who are not in the labor force. People not in the labor force are not working nor have they looked for work in the last four weeks. As already indicated, some of those people not in the labor force are included in the U-6 measure as marginally attached.
Number Unemployed, Underemployed, or not in the Labor Force
The left side of Table 1 shows that, as of the third quarter of 2009, the total number of unemployed natives is 12.5 million using the standard U-3 measure of unemployment. Using the U-6 measure, 21 million natives are unemployed or underemployed. Looking at the U-6 measure for natives without a high school degree, there are 2.7 million unemployed or underemployed. For those natives with only a high school education, there are 7.7 million unemployed or underemployed. In total, 10.4 million natives with a high school education or less are unemployed or underemployed using the U-6 measure.
People not in the labor force are neither working nor looking for work. The right half of Table 2 shows those ages 18 to 65 not in the labor force. In addition to the 10.4 million unemployed and underemployed less-educated natives covered by U-6, there are another 18.7 million natives who have a high school education or less not in the labor force.1 In total there are 29.1 million less-educated natives who are unemployed, involuntarily working part-time, or not in the labor force. Moreover, there are 6.6 million native-born teenagers (16 and 17) who are either unemployed or not in the labor force as of the third quarter of 2009. To place these numbers in perspective, there are an estimated seven to eight million illegal immigrants holding jobs.
This extremely large number of less-educated natives not working or forced to work part-time is relevant to the immigration debate because they are the individuals most in competition with immigrants ─ legal and illegal. Of course, a significant share of those not in the labor force do not wish to work or are unemployable for some reason. But if only one-fourth of these less-educated adult natives became employed or worked full-time, coupled with one-tenth of native-born teenagers, it would equal the entire illegal immigrant workforce.2
Unemployment Rates for Young And Less-Educated Natives
Table 1 shows that over 30 percent of natives with less than a high school education are unemployed or underemployed using the U-6 measure. This is also the case for young natives (18-29) with only a high school degree. Moreover, Table 1 shows that the situation is even worse for young and less-educated black and Hispanic natives. Among black native-born high school dropouts, the U-6 rate is 42.2 percent; among young (18-29) black natives with only a high school diploma, U-6 is 39.8 percent. The very high rates of unemployment and underemployment and the number of those discouraged from looking for work among less-educated Americans are a clear indication that there is no shortage of workers at the bottom end of the job market.
The fact that unemployment and the U-6 measure look so bad for less-educated and young workers is not proof that immigration has caused this situation. The severity of the current recession clearly is part of the problem. But unemployment, underemployment, and declining rates of labor force participation were a problem for less-educated natives long before this recession began. What we can say from the data is that those types of workers most in competition with immigrants face the most dire labor market situation. This is consistent with the possibility that immigration has harmed their job prospects. The other conclusion that we can draw from this data is that there is no shortage of less-educated workers in the country. If the United States were to enforce immigration laws and encourage illegal immigrants to return to their home countries, we would seem to have an adequate supply of less-educated natives to replace these workers.
Additionally, the United States could alter its immigration policy in response to the recession. The number of natives unsatisfied with their employment status (represented by U-6) raises the question of why new foreign workers are needed. In 2008, an average of 112,000 new foreign workers were authorized each month to work in the United States. This includes new adult permanent residents (green card holders) and long-term temporary visas for guest workers and others authorized to work. It does not include several hundred thousand illegal immigrants who are already in the country when they change their status and are therefore technically not new arrivals. However, they too could be counted as new work authorizations.3
Although some foreign workers are in the high-tech sector, a very large share of temporary workers and green card holders have relatively little education. The “New Immigrant Survey,” for example, indicates that one-third of adult legal immigrants (new green card holders) have not completed high school. Given the deterioration in the economies of many of the primary immigrant-sending counties, it seems likely that legal immigration to the United States will remain high, absent a change in U.S. policy.
State Data
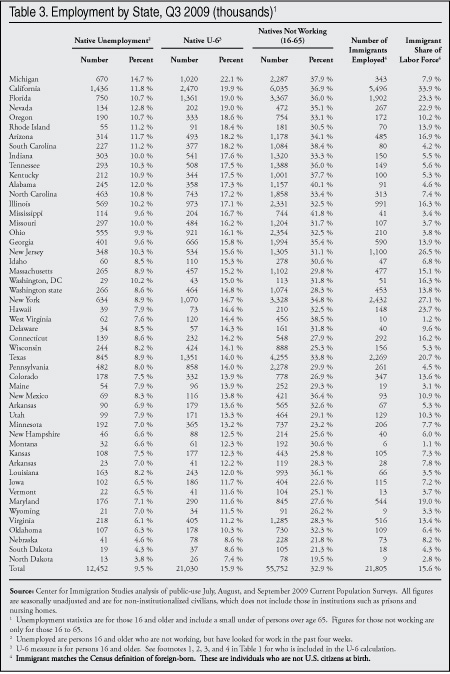
Table 3 reports unemployment figures by state using both the U-3 and U-6 measures for natives 16 and older. It also reports the number and share of working-age (16 to 65) natives who are not in the labor force. The last two columns of the table show the number of employed immigrants in the state and their share of the labor force. Table 4 reports the same information for those with only a high school degree or less. Since we are looking at individuals by education level, it is necessary to exclude those under age 18 in Table 4. Table 3 shows high unemployment in most of the country for natives, with 17 states having an overall U-6 measure of unemployment higher than the 15.9 percent national average. Given the severity of the problems in the U.S. auto industry, Michigan tops the list with the highest unemployment rates.
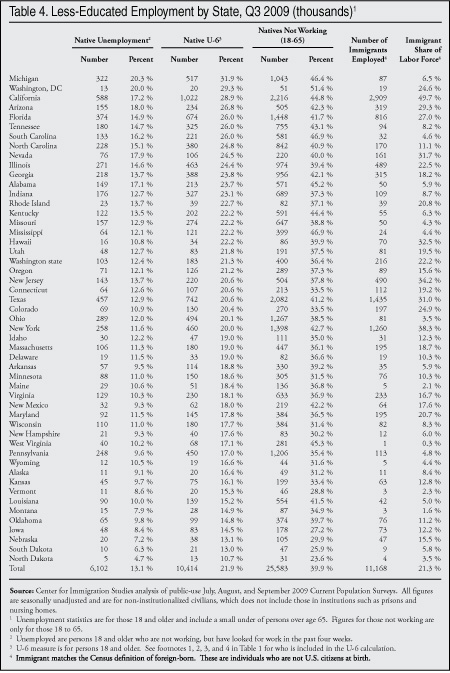
Turning to the less-educated population, Table 4 shows that in almost every state the U-6 unemployment rate for natives with a high school education or less is higher than the national average for all native workers (15.9 percent). If we look at the states where the U-6 rate is the highest for less-educated natives, we find that many have very large immigrant populations, including California, Arizona, Florida, Nevada, and Illinois. In addition to high immigration states, other states where U-6 is very high for less-educated natives are those with large African American populations, such as the District of Columbia and South Carolina, or states hit hard by the recession in the auto industry, such as Michigan and Indiana. Table 4 also shows that the share of less-educated natives not working is very high throughout the country. In 41 states (including the District of Columbia), one-third or more of less-educated natives 18 to 65 years of age are not working as of the third quarter of 2009.
Methodology
The data for Tables 1 and 2 come from the public-use files of the July, August, and September 2009 Current Population Surveys (CPS), collected monthly by the Census Bureau for the Bureau of Labor Statistics (BLS). Each CPS includes about 131,000 respondents, roughly half of whom are in the labor force. The tables presented here are reported by quarter. Quarterly data are more statistically robust, especially for smaller populations like immigrants and minorities, due to the inclusion of three months of data. Persons in institutions like prisons or nursing homes are not included. The CPS is the nation’s primary source for unemployment and other labor force statistics. Like all government surveys, the data are weighted to reflect the actual size and demographic makeup of the U.S. population.
The government publishes employment statistics that are both seasonally adjusted and seasonally unadjusted from the survey. The figures in this analysis are seasonally unadjusted. Unadjusted figures are computationally simpler and easy for other researchers to replicate. In general, BLS does not provide separate estimates for the foreign-born (immigrants) and native-born. However, CPS respondents are asked if they are immigrants, and we have divided the population based on this question. The Census Bureau defines the foreign-born as persons who are not U.S. citizens at birth, which includes naturalized citizens, legal immigrants who are not citizens (green card holders), temporary visitors and workers, and illegal immigrants. All figures for the total U.S. population at the top of Tables 1 and 2 match those from the BLS.
The U-6 measure divides the sum of the unemployed population, involuntary part-time workers, and marginally attached people (discouraged and other) by the civilian labor force (employed and unemployed) plus marginally attached workers. The column headings in Table 1 show this calculation. An unemployed worker is someone who does not currently hold a job, but is available to work and has looked for a job in the previous four weeks. Marginally attached workers indicate that they want and are available for jobs, and they have looked for work in the past 12 months.4 However, they are not considered unemployed because they have not searched for a job in the previous four weeks. Involuntary part-time workers are those individuals who report that they are working part-time for economic reasons. They want and are available for full-time work, but must instead settle for part-time hours.5 Because the total U-6 measure includes the unemployed, those working involuntarily part-time, and those marginally attached to the labor market (discouraged and other), it provides the broadest possible measure of problems in the U.S. work force.
End Notes
1 To avoid double counting, the 18.7 million figure excludes the roughly one million less-educated natives who are not in the labor force, but are included in the U-6 measure as marginally attached to the labor market. They are shown in columns 4 and 5 of Table 1. The 29.1 million figure includes those over age 65 who are unemployed; that is, they are looking for work. But it does not include those who are over age 65 who are not in the labor force.
2 Our best estimate is that the illegal labor force in the March 2009 Current Population Survey was 6.55 million. If we assume a 10 percent undercount, which is what the Department of Homeland Security uses for its estimates of the illegal population, then the total illegal population was 7.2 million in the first part of 2009. While there may have been some change in the number of illegal immigrants holding a job between March 2009 and the third quarter of 2009, that number should not have changed dramatically.
3 See Table 10 in “Trends in Immigrant and Native Employment,” Center for Immigration Studies, at www.cis.org/FirstQuarter2009Unemployment.
4 Marginally attached workers indicate that they looked for work in the last 12 months, but not in the prior four weeks. The marginally attached are comprised of two groups, both of which are included in U-6. One group is considered “discouraged.” Discouraged workers provide a reason related to the market conditions for why they are not currently looking for a job. The second group of marginally attached workers indicate that they are conditionally interested in finding work and are referred to as “other marginally attached workers.” These individuals provide reasons such as family responsibilities, school attendance, illness, and transportation problems for why they have not searched for work in the previous four weeks.
5 Involuntary part-time workers respond that they are working part-time (one to 34 hours a week) for economic reasons; this category includes those who usually work full-time and those who usually work part-time. They share in common a desire to work full-time.