Download a PDF of this Backgrounder.
Steven A. Camarota is the director of research and Karen Zeigler is a demographer at the Center. Jason Richwine, PhD, is a public policy analyst based in Washington, D.C., and a contributing writer at National Review.
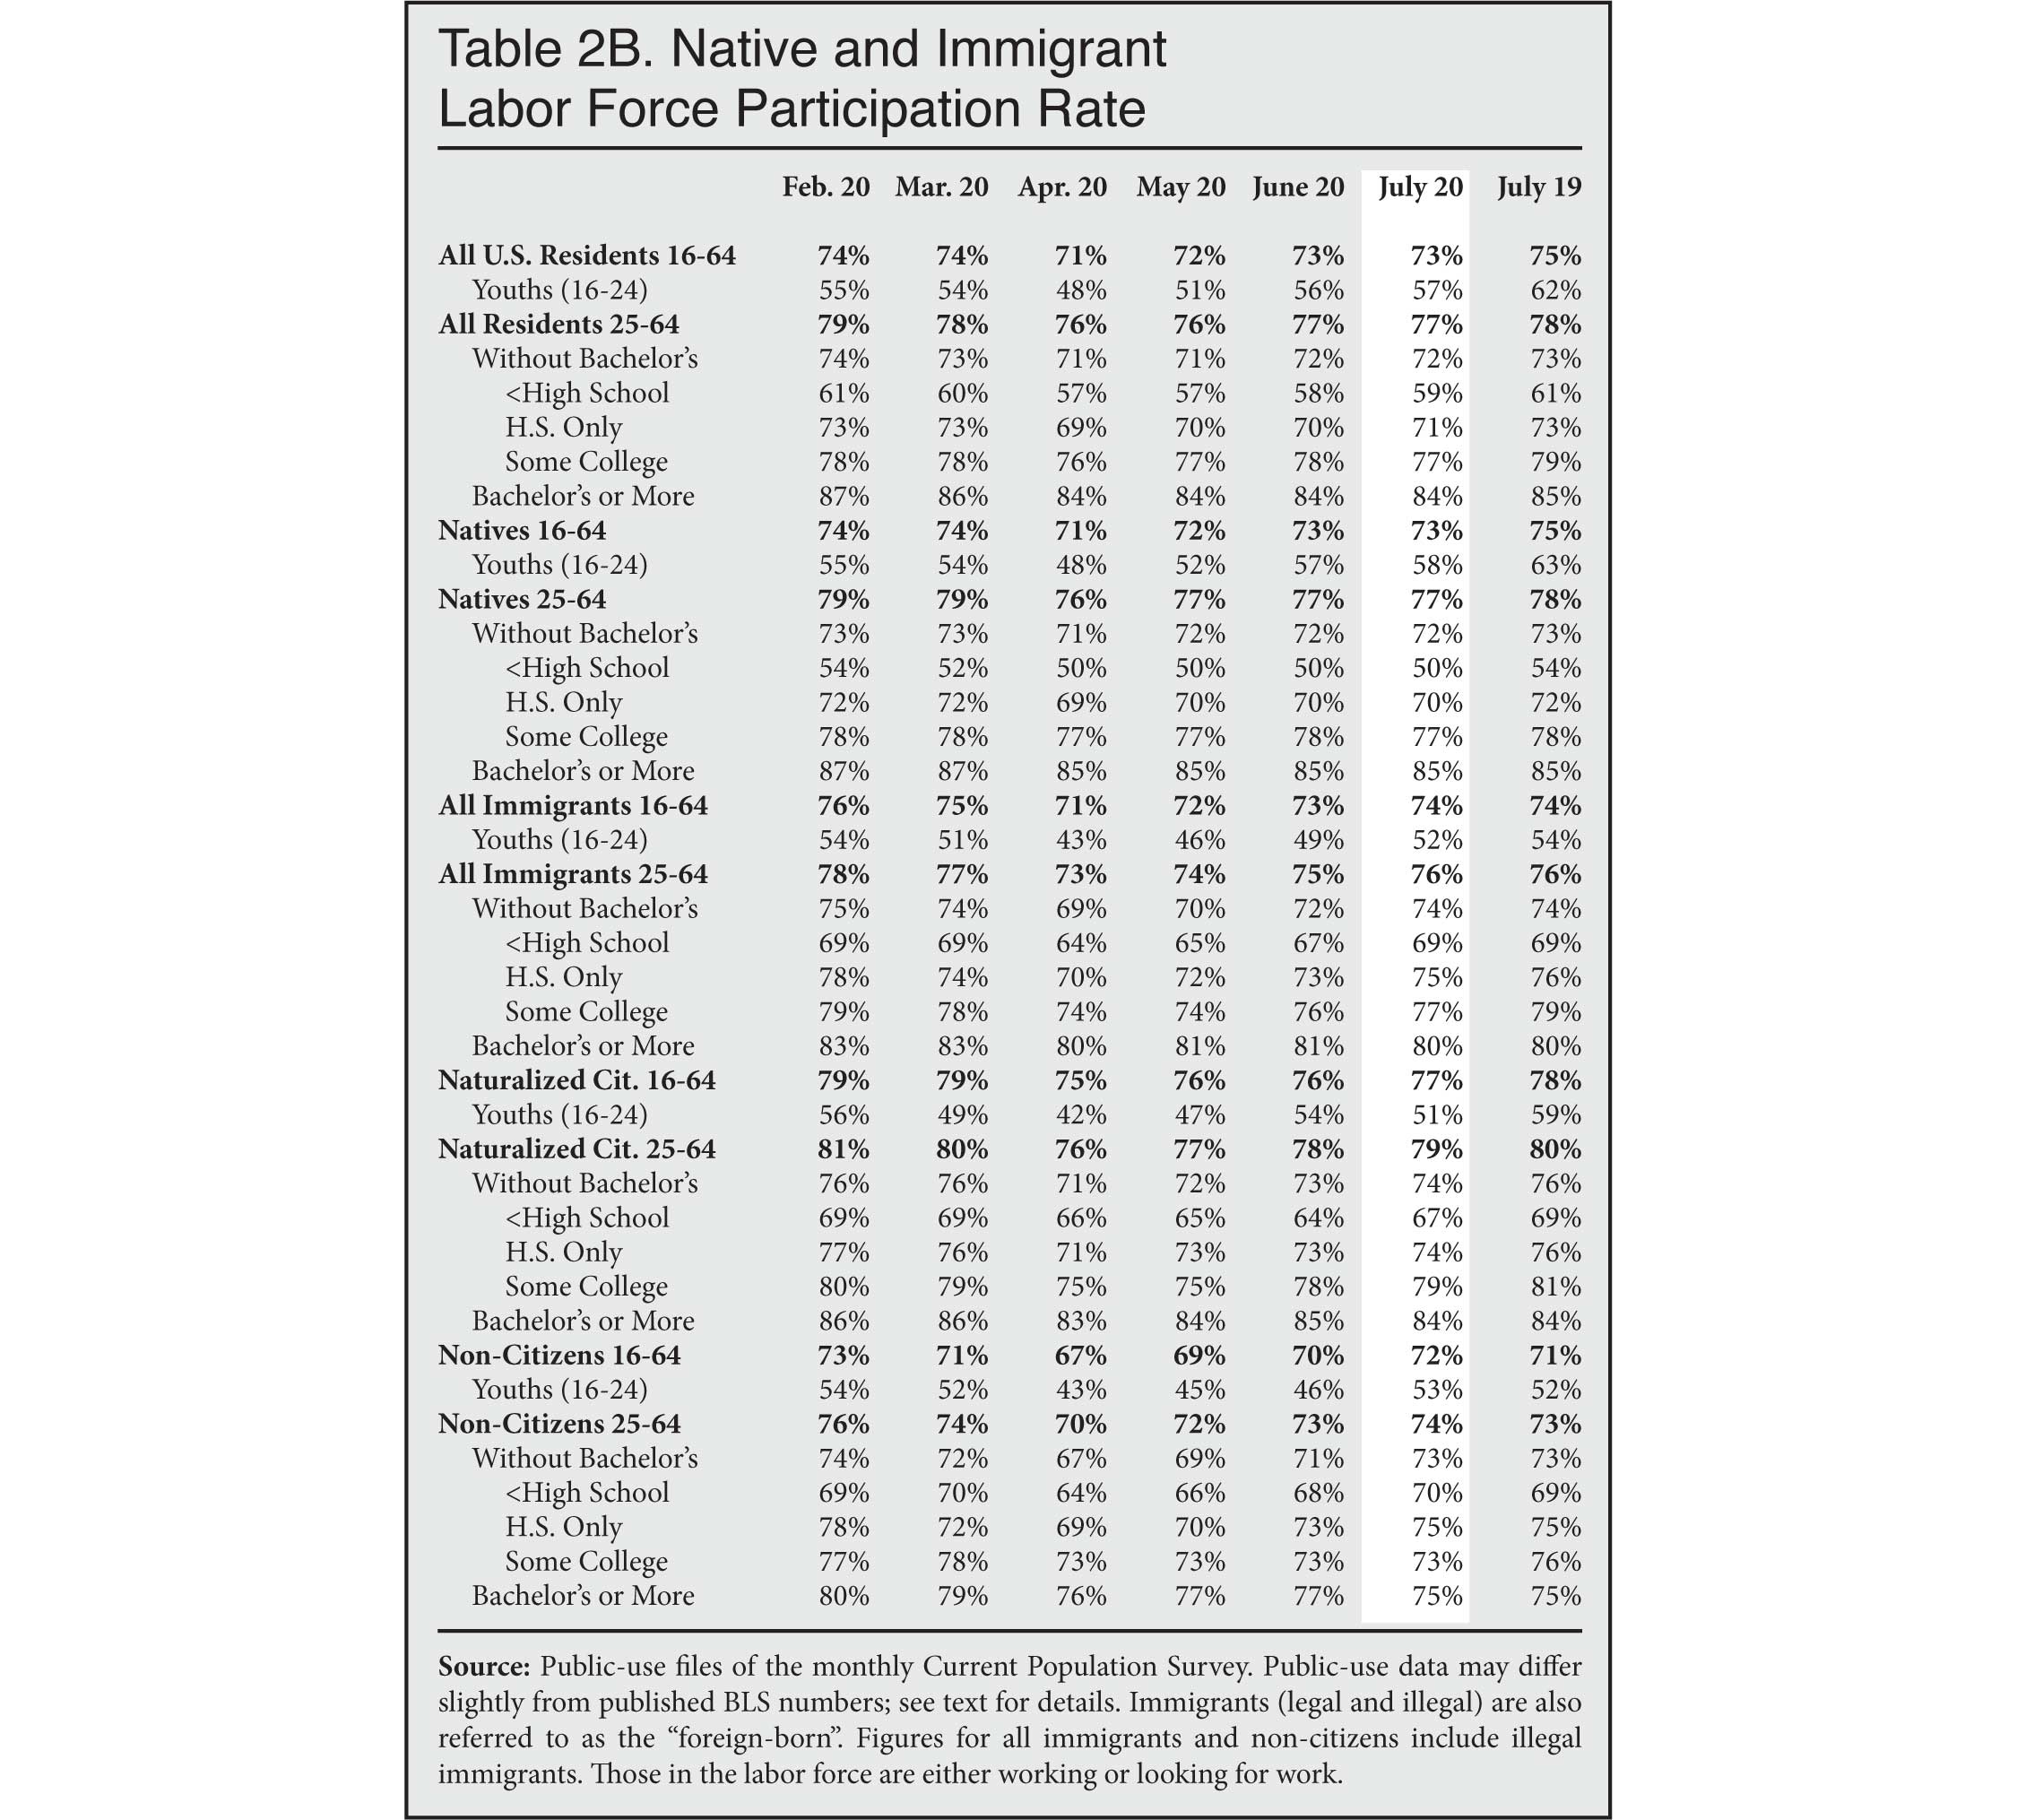
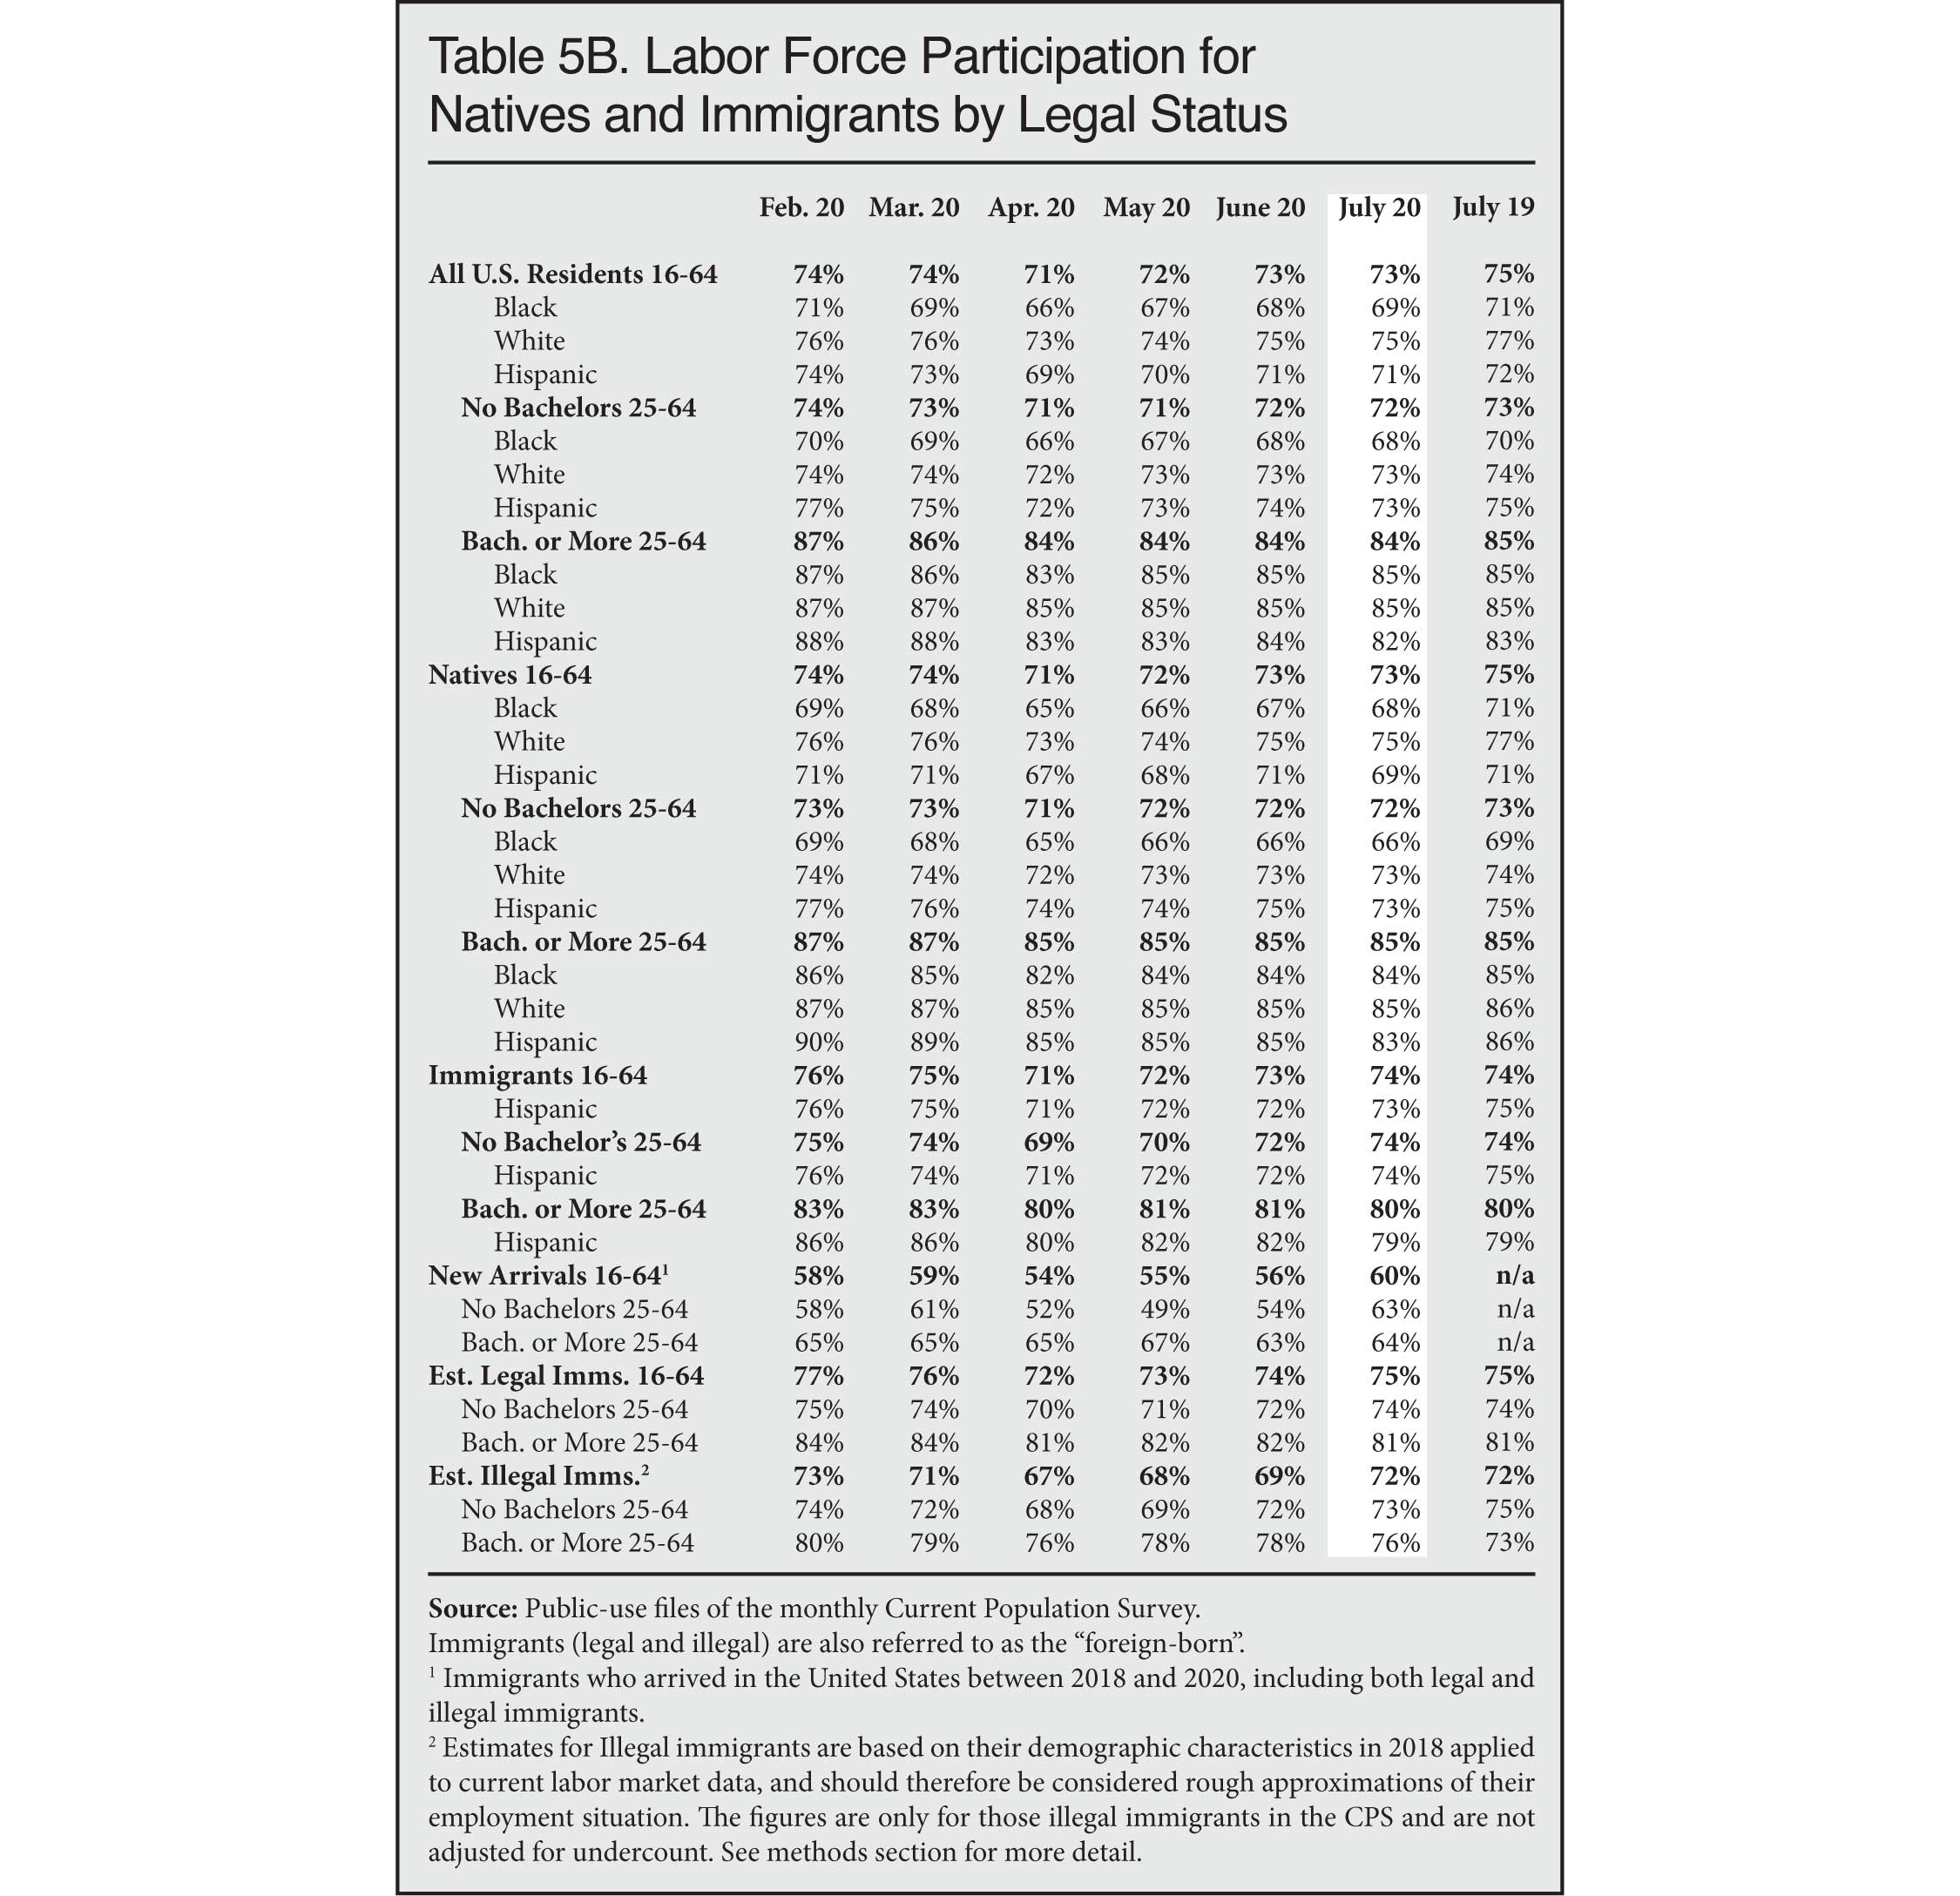
An analysis by the Center for Immigration Studies of recently released data for July 2020 from the Bureau of Labor Statistics shows that the share of immigrants (legal and illegal) unemployed improved more than the share for the native-born, though the unemployment rate remains very high for both groups. In terms of labor force participation rate (share working or looking for work), the percentage of working-age (16-64) natives in the labor force showed no improvement between June and July, while among immigrants it improved somewhat. While workers of every education level have experienced significant job losses since the Covid-19 epidemic began, the situation for workers without a college education is especially bad. It remains extremely difficult to justify the continued entry of new immigrants on the grounds of any "labor shortage".
Among the findings:
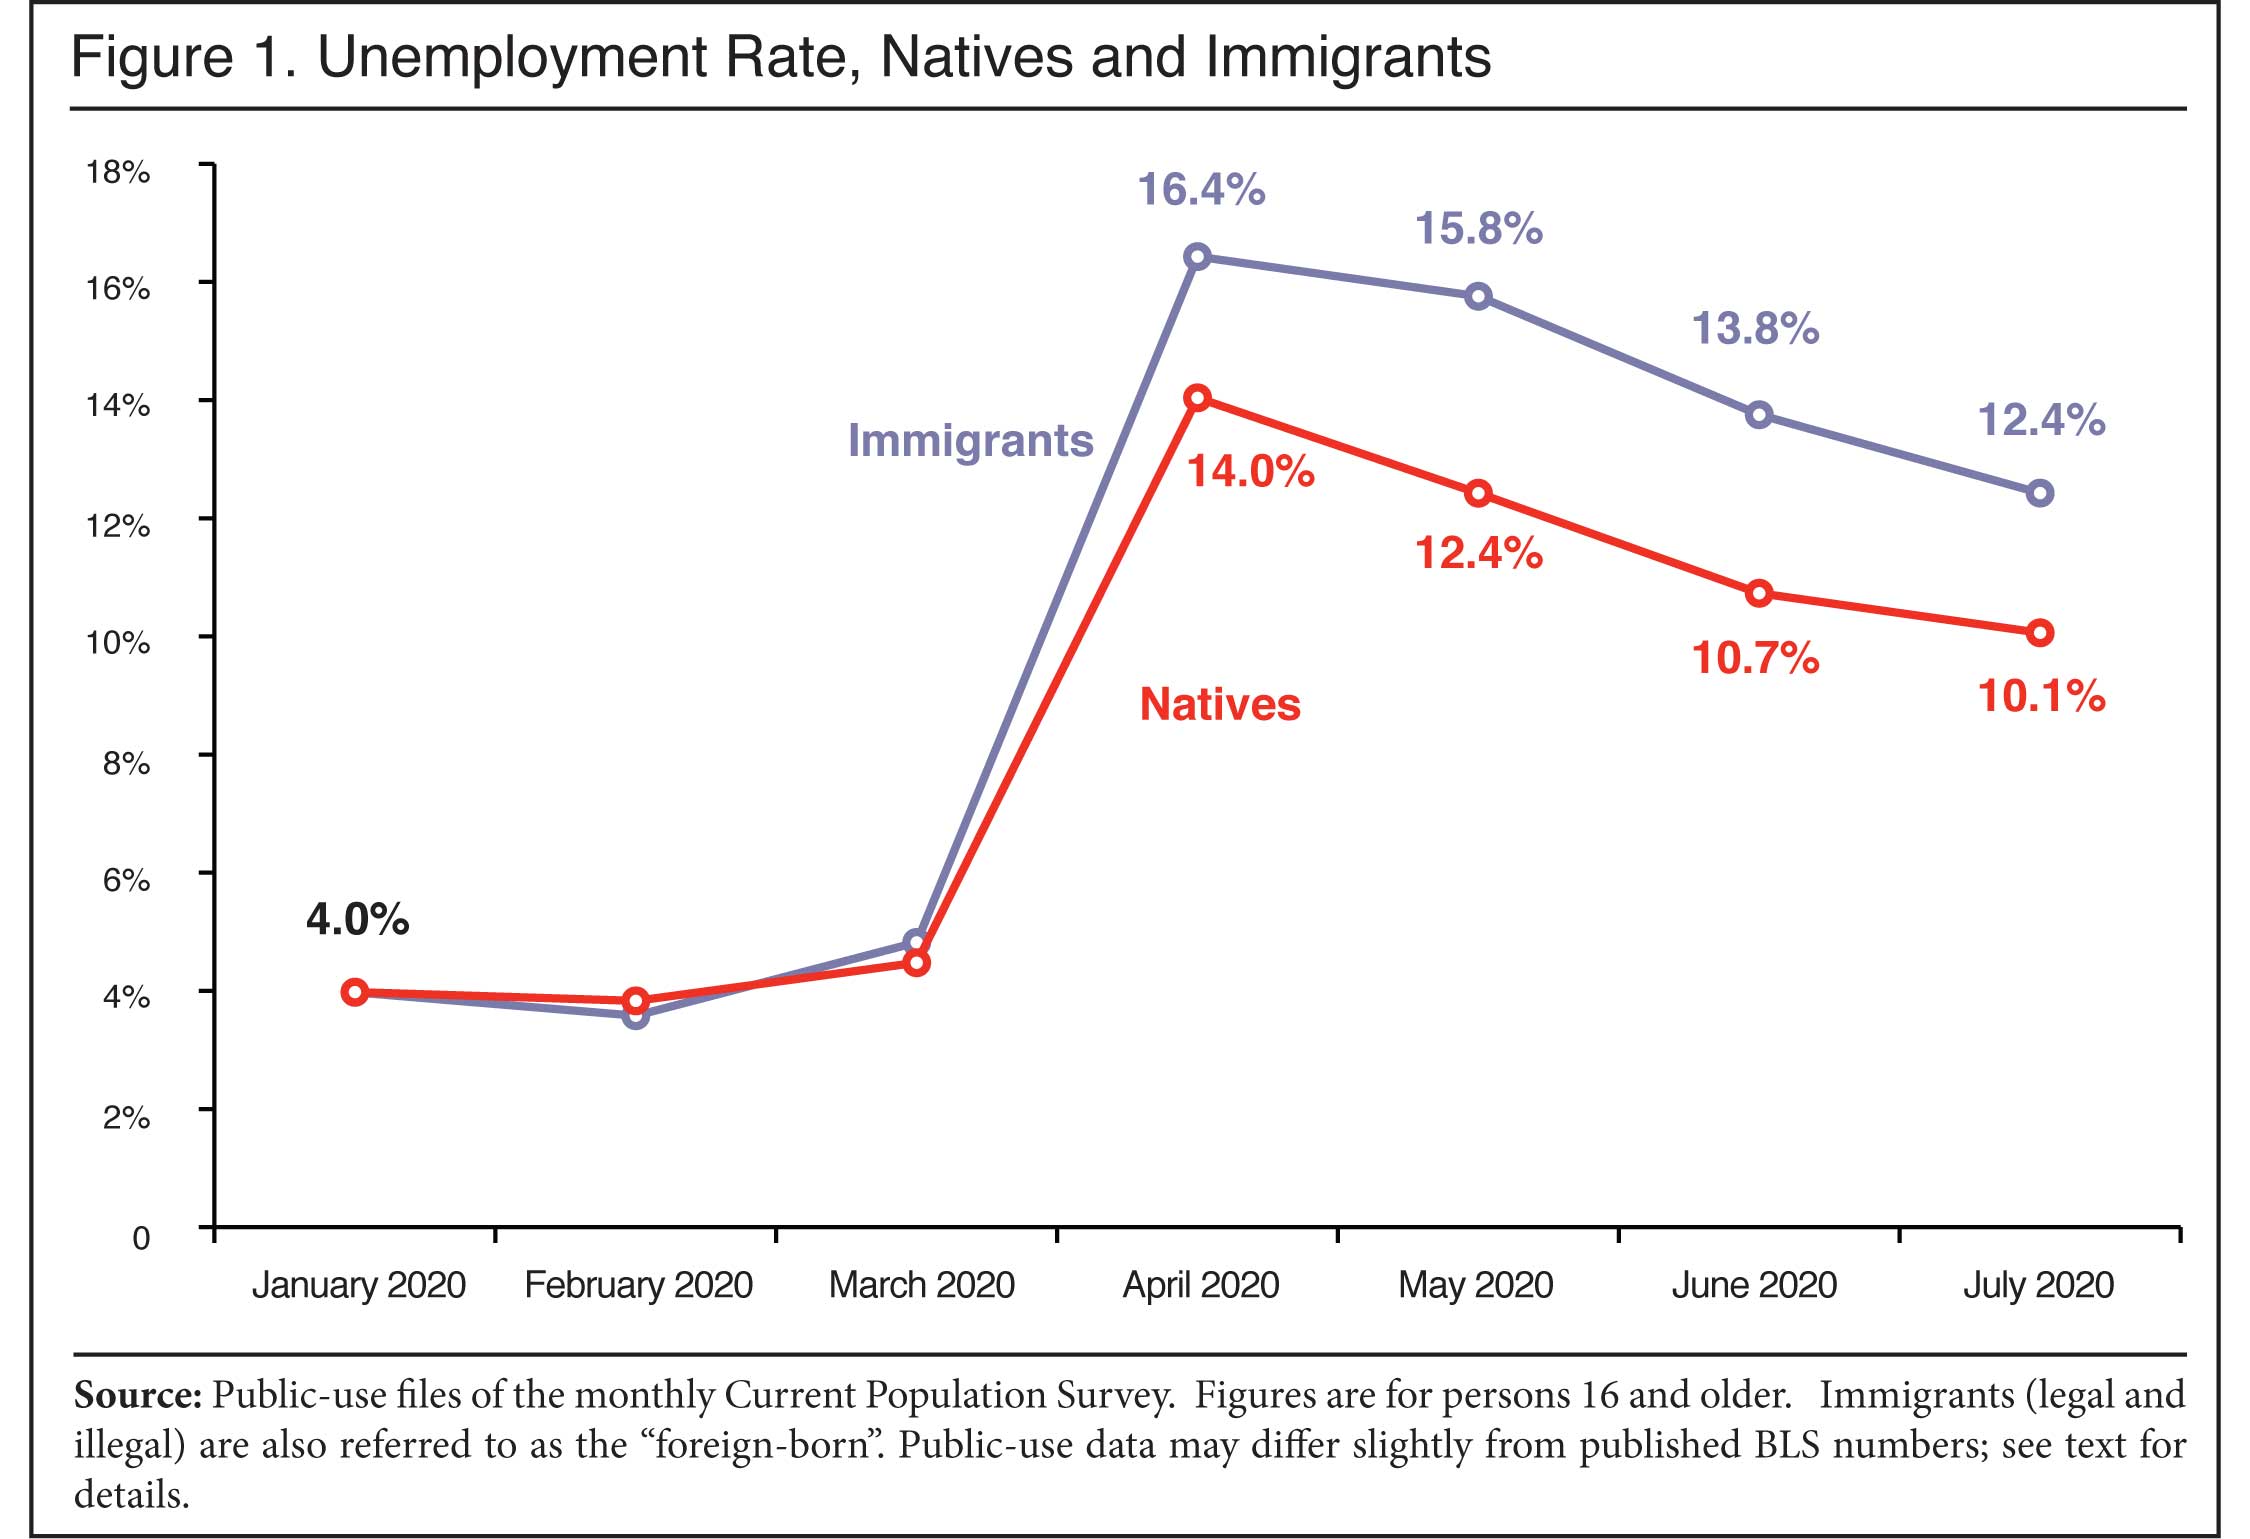
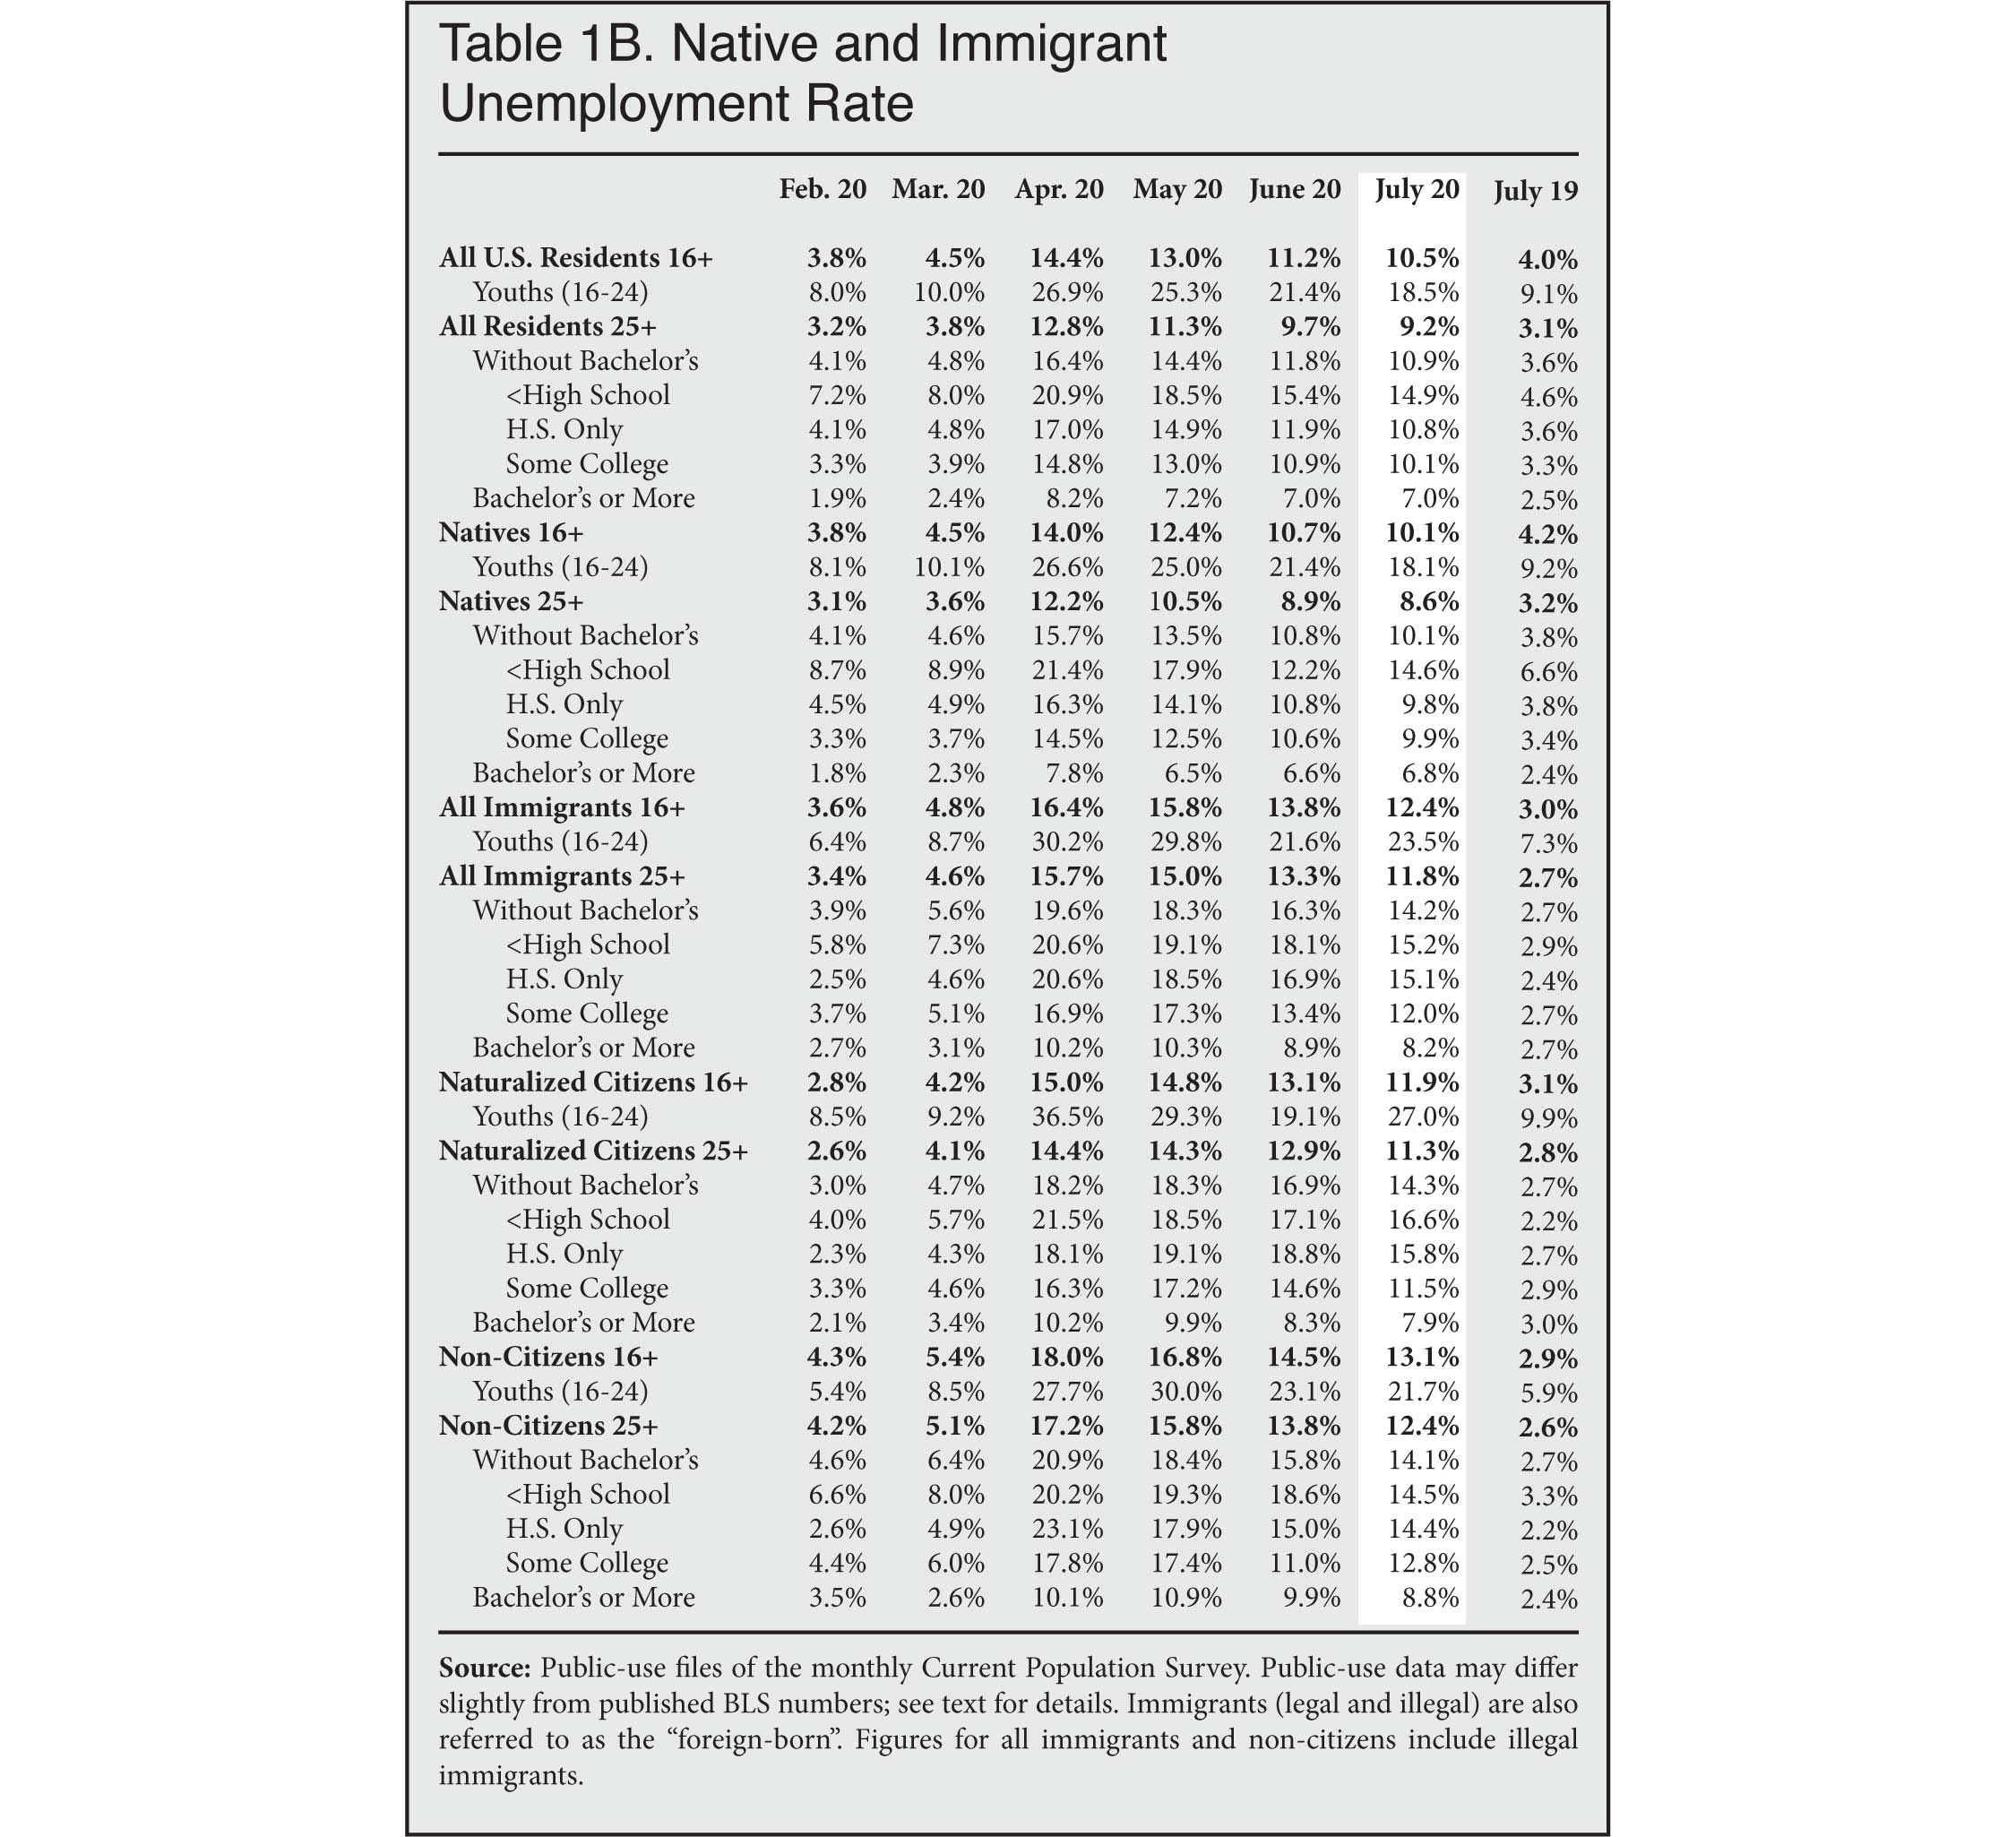
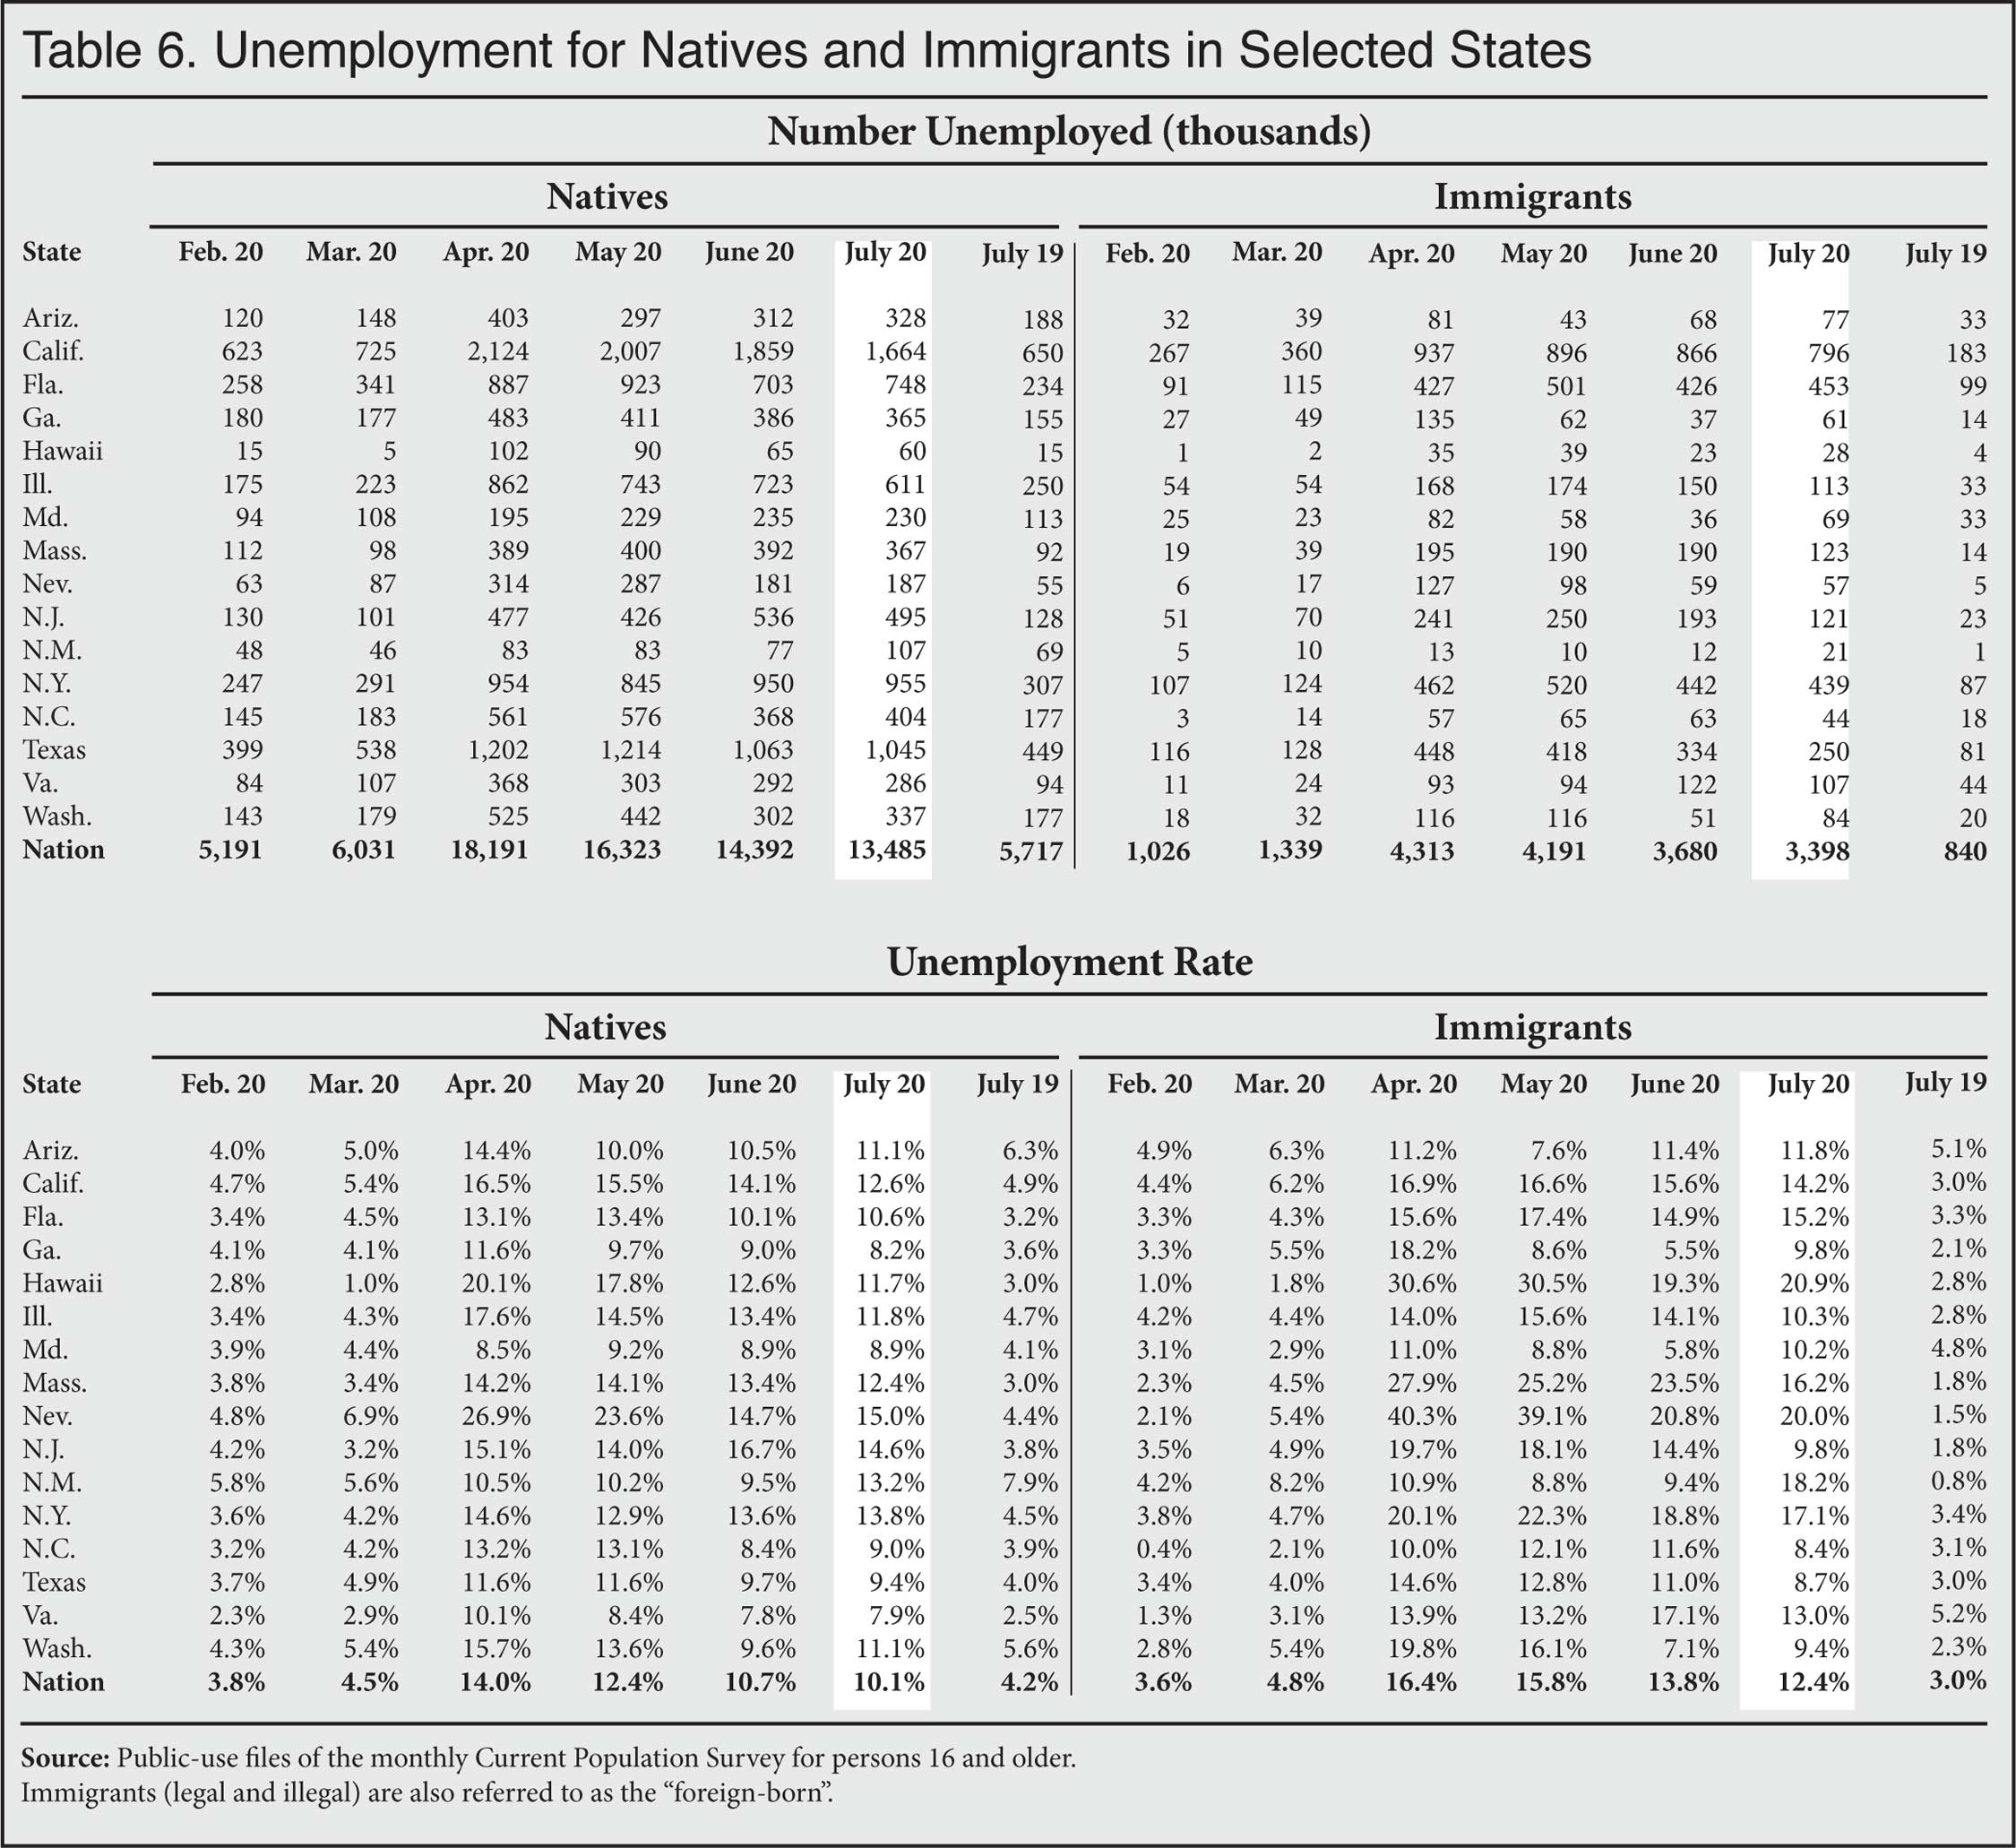
- The unemployment rate for native-born Americans (age 16-plus) was 10.1 percent in July. While lower than the 10.7 percent in June, it is still well more than double what it was before Covid-19. The rate improved more rapidly among immigrants (age 16-plus), from 13.8 percent in June to 12.4 percent in July. Still, the immigrant rate remains substantially higher than that of the native-born. (Figure 1, Table 1B)
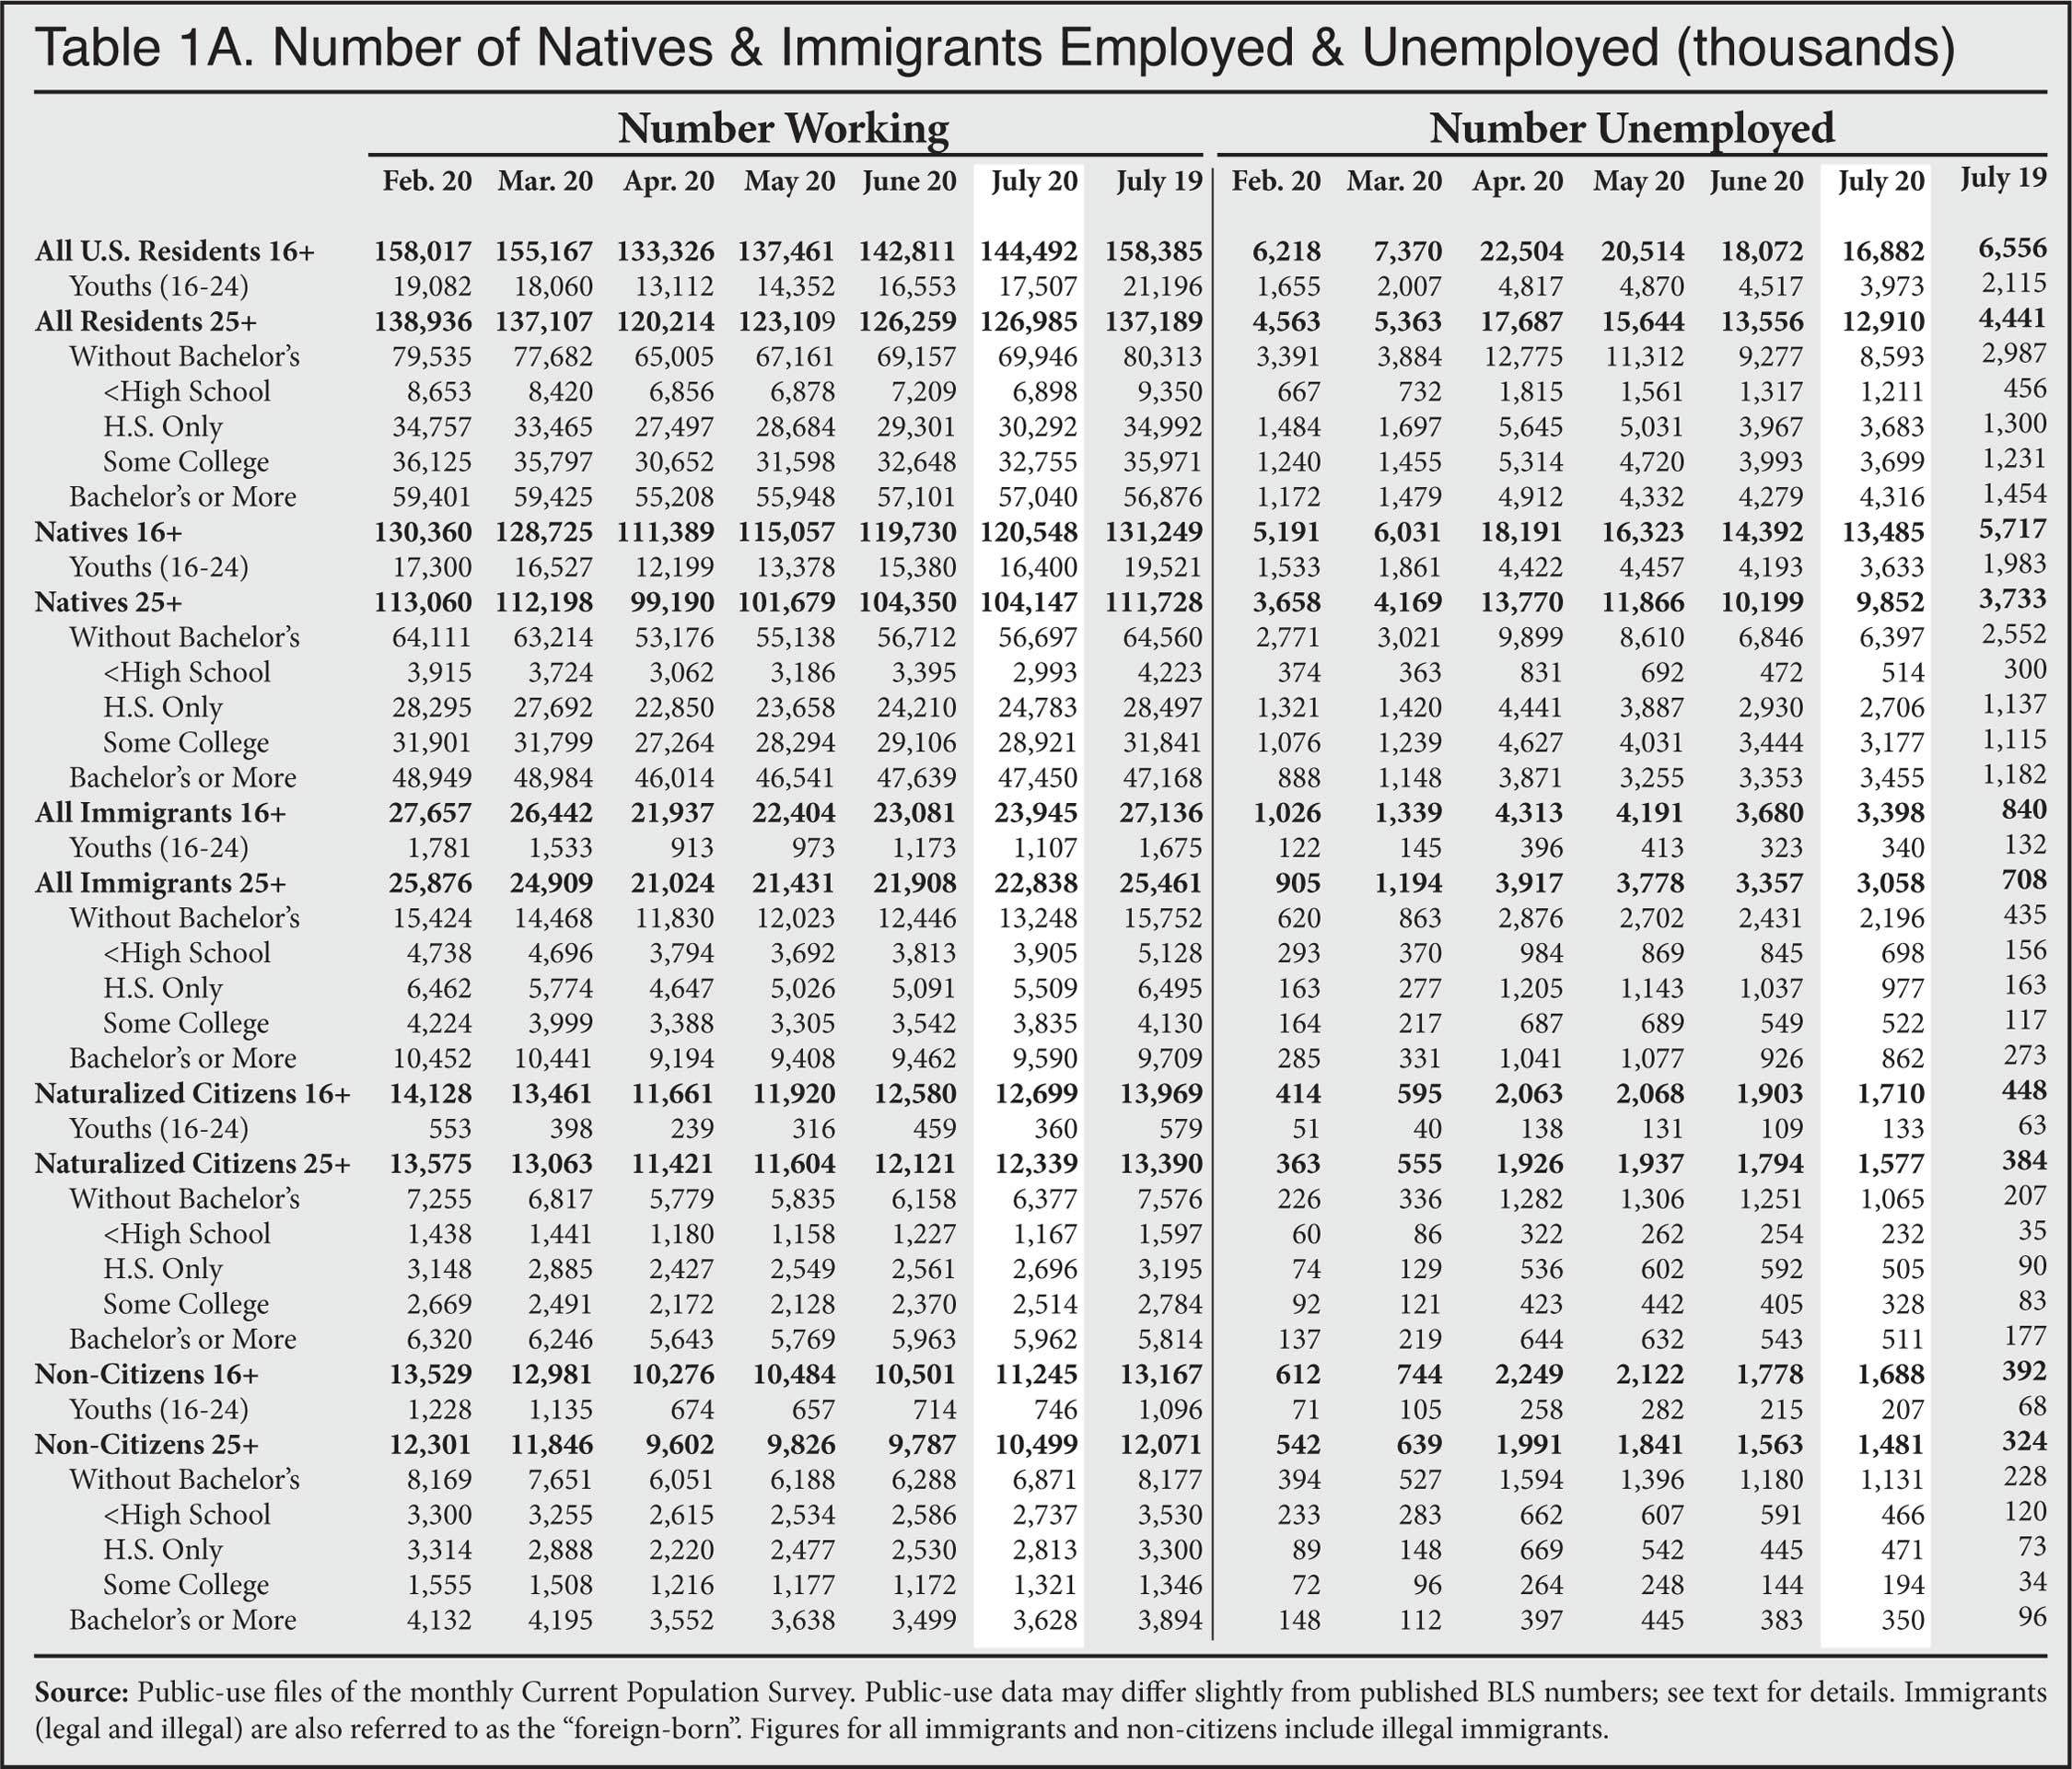
- The number unemployed declined by about 6 percent for natives and 8 percent for immigrants between June and July. This is smaller than the 12 percent decline for both groups May to June. (Table 1A)
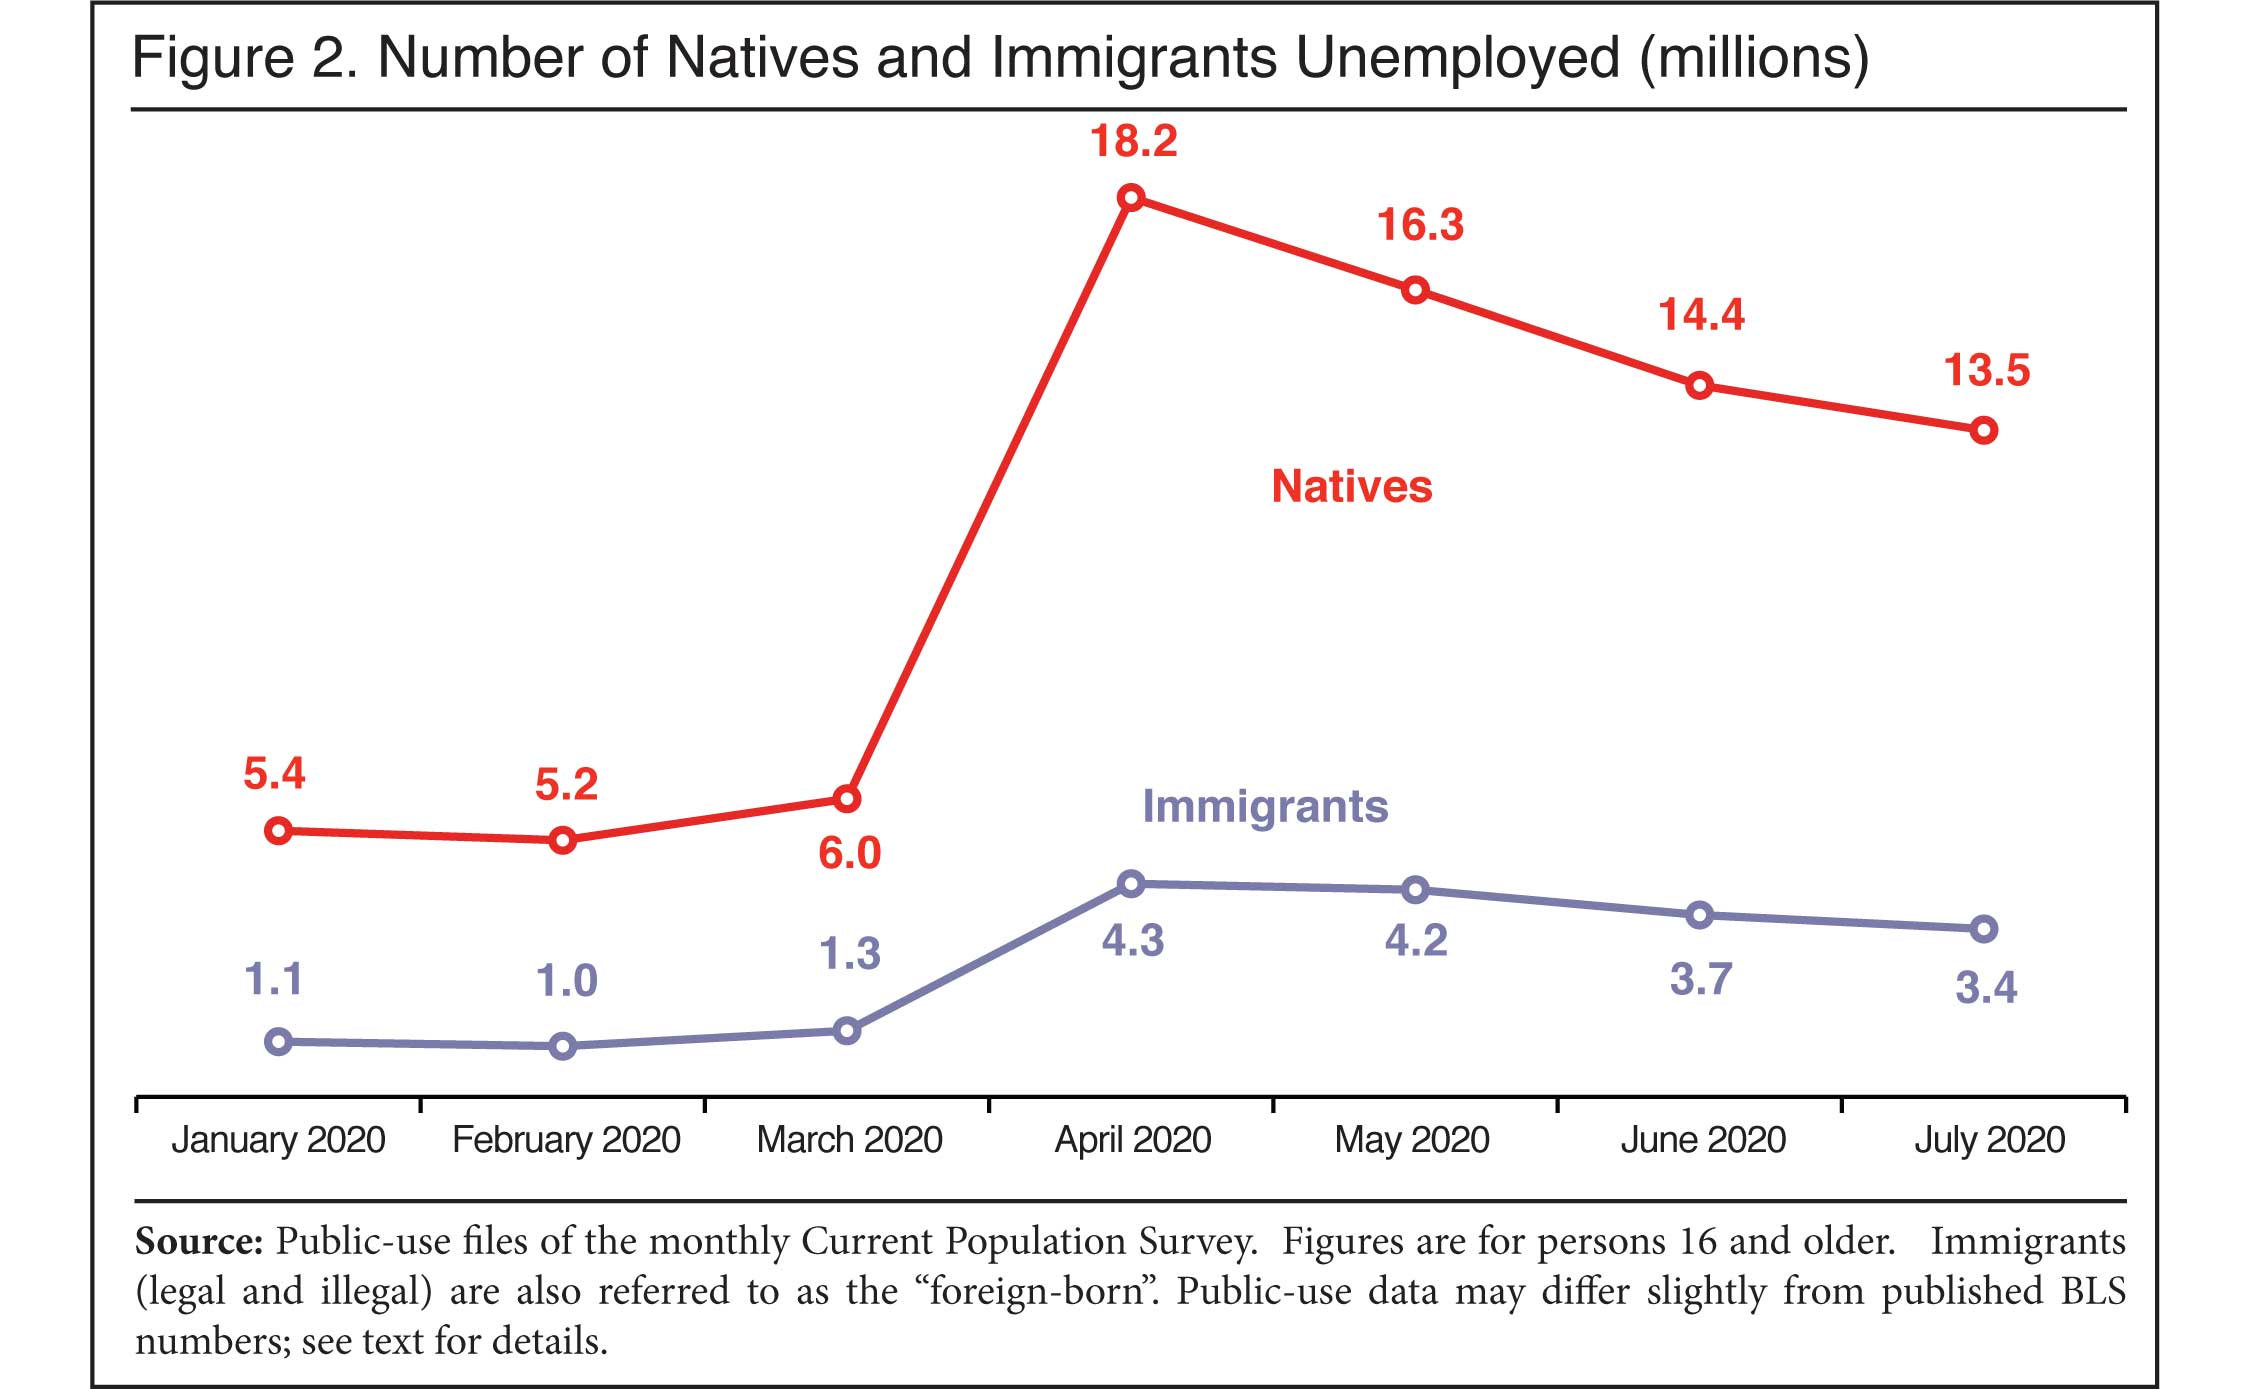
- The total number of natives and immigrants unemployed stood at 16.9 million, 2.5 times what it was in February before Covid-19. (Figure 2, Table 1A)
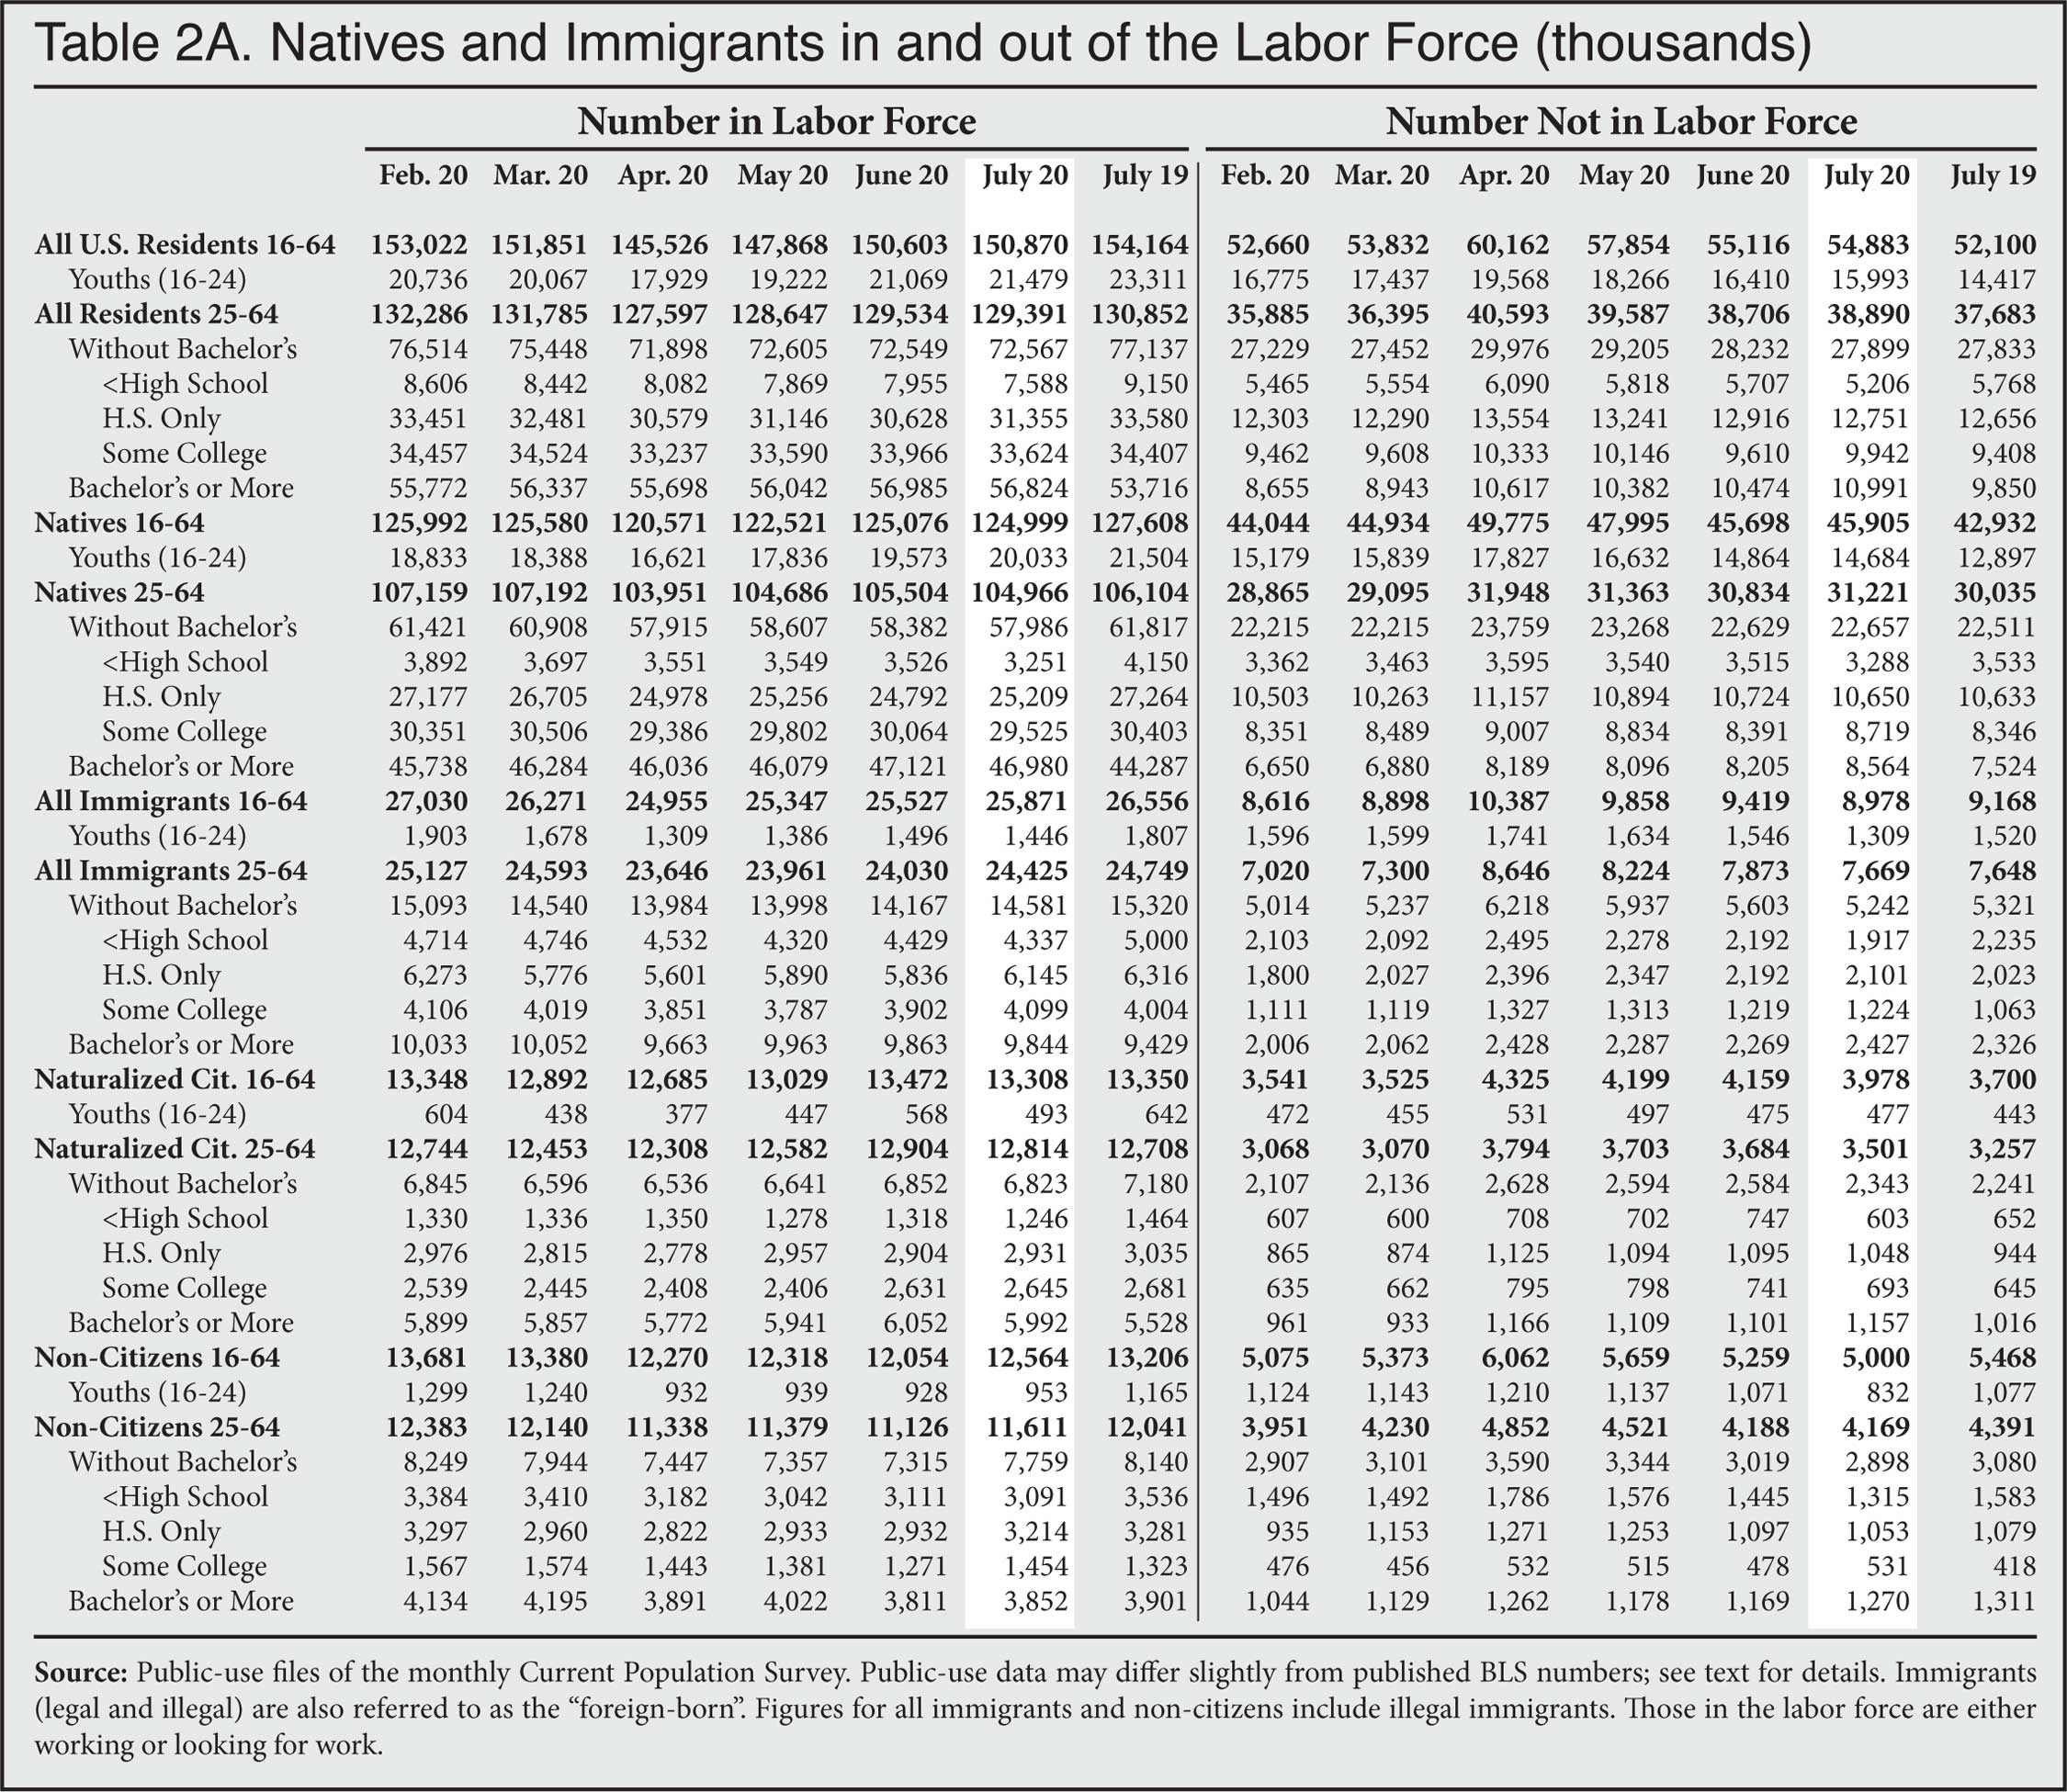
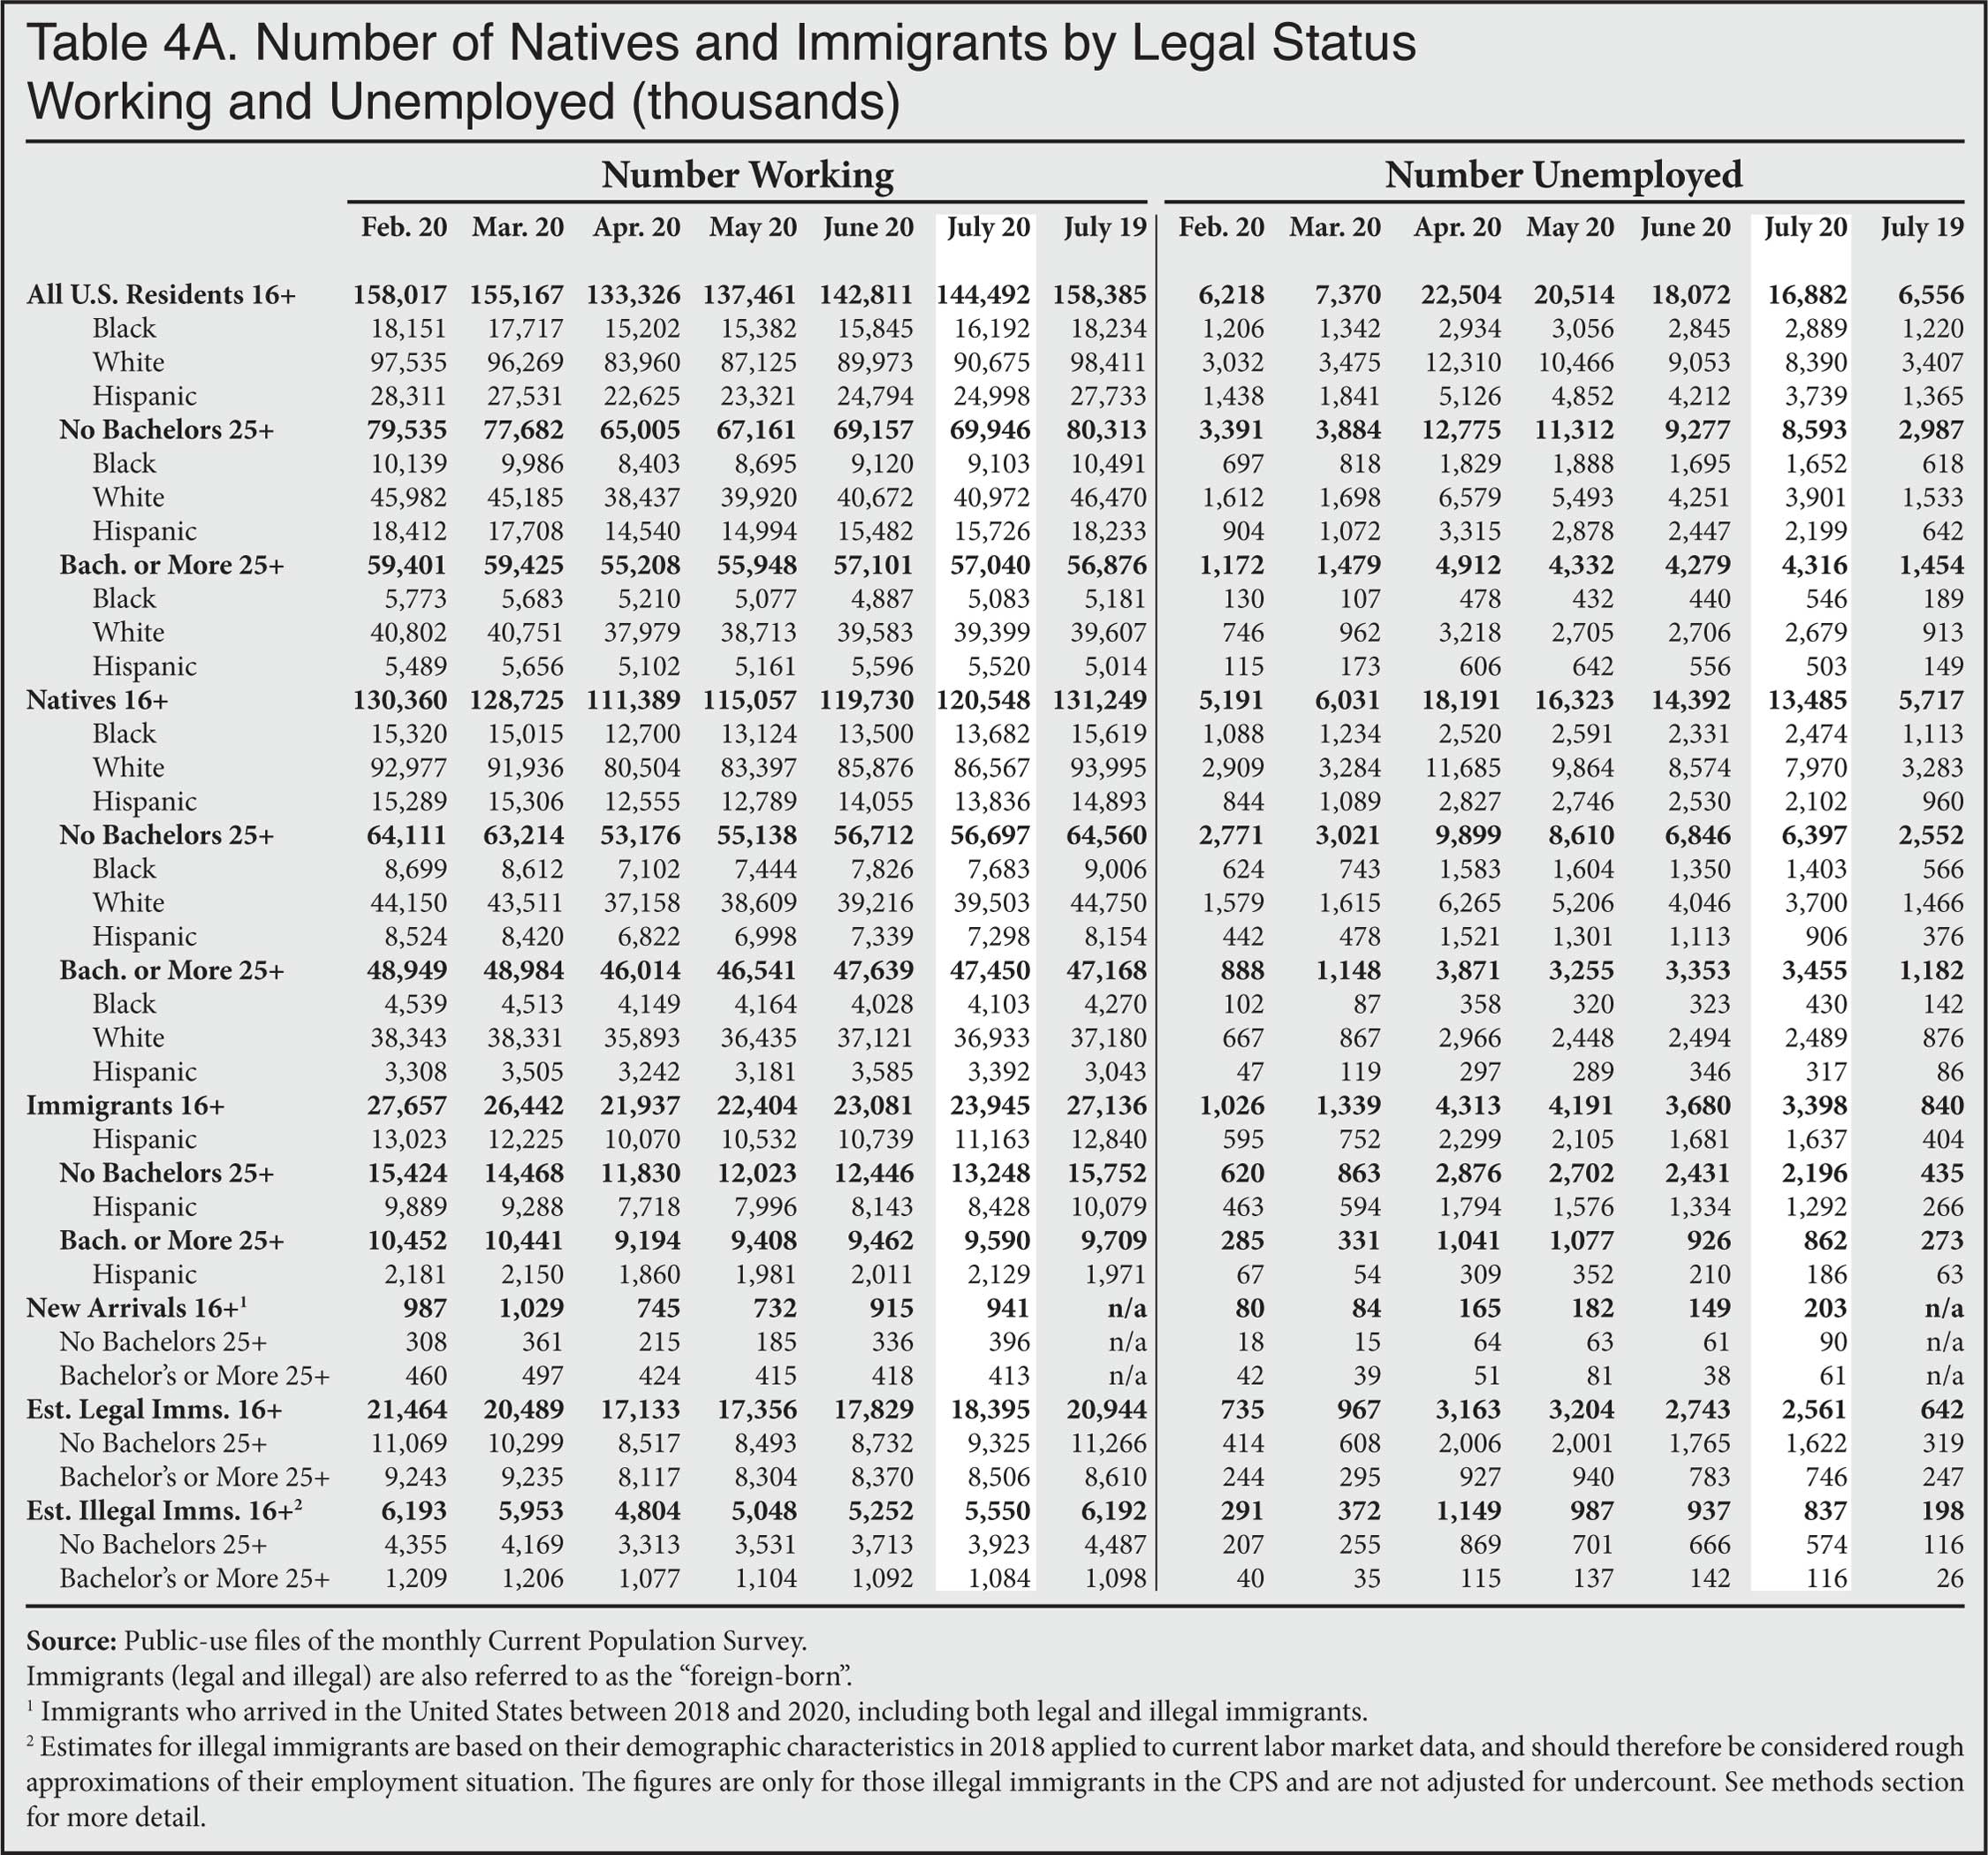
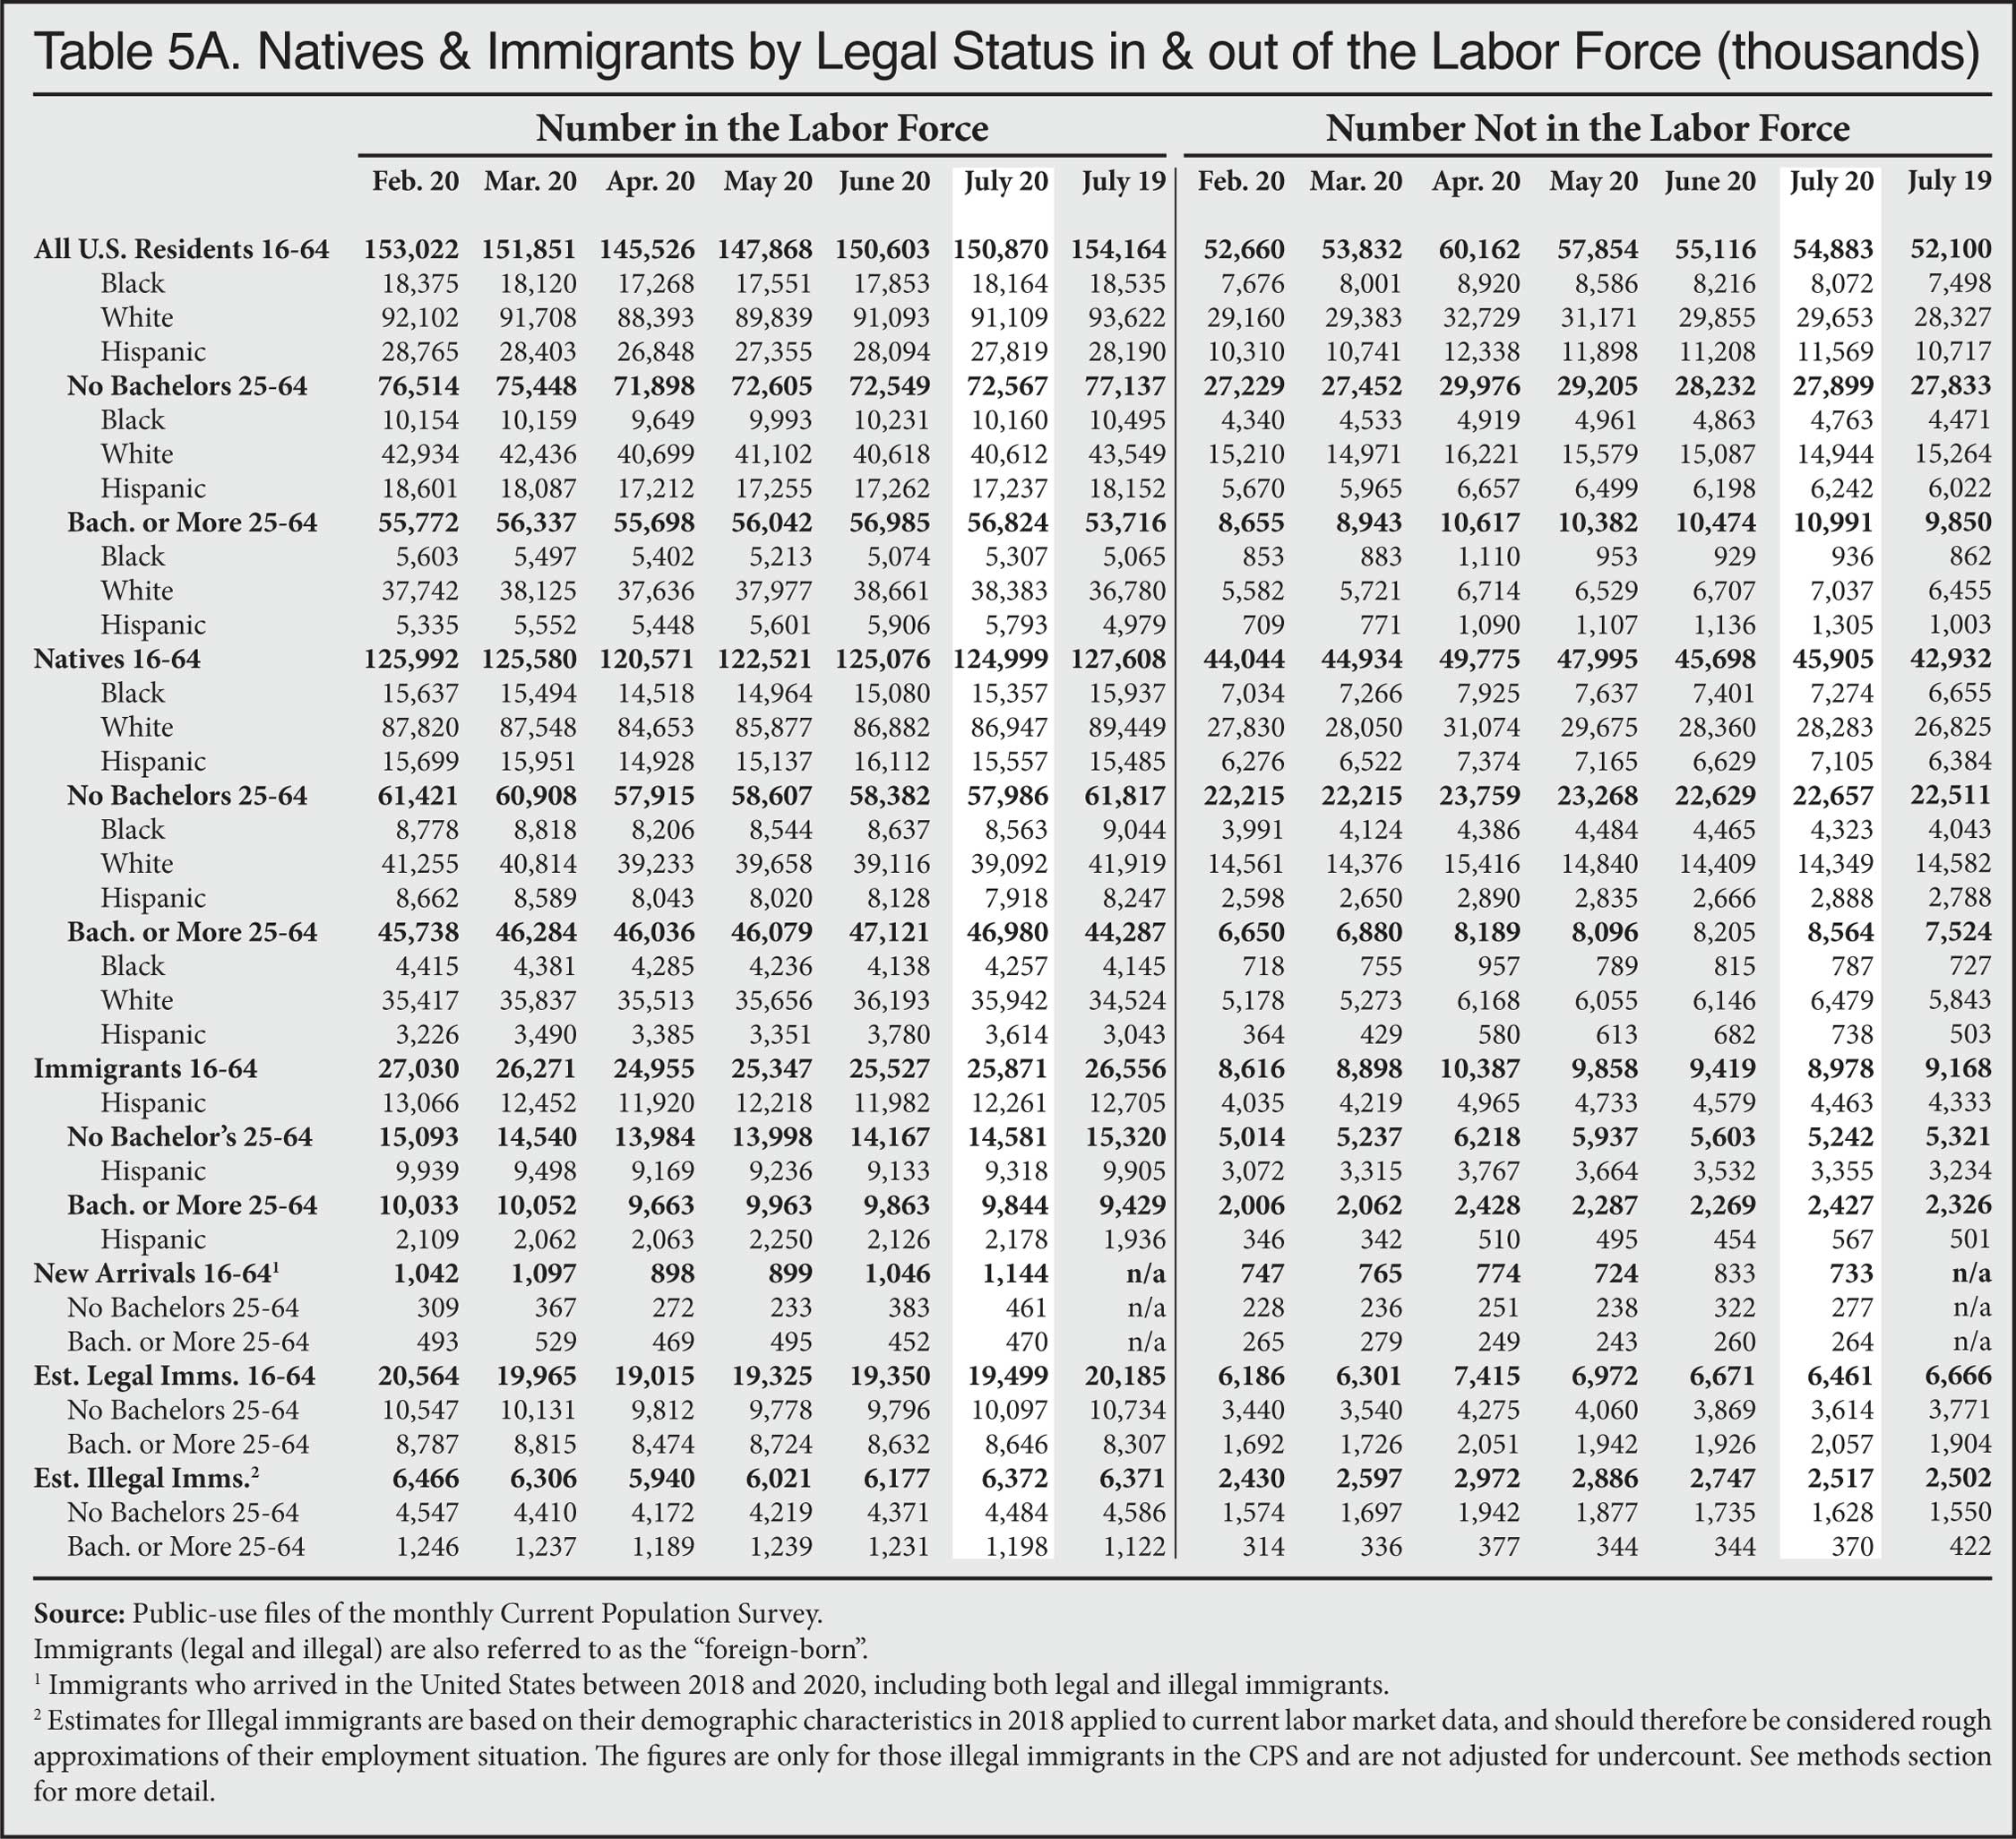
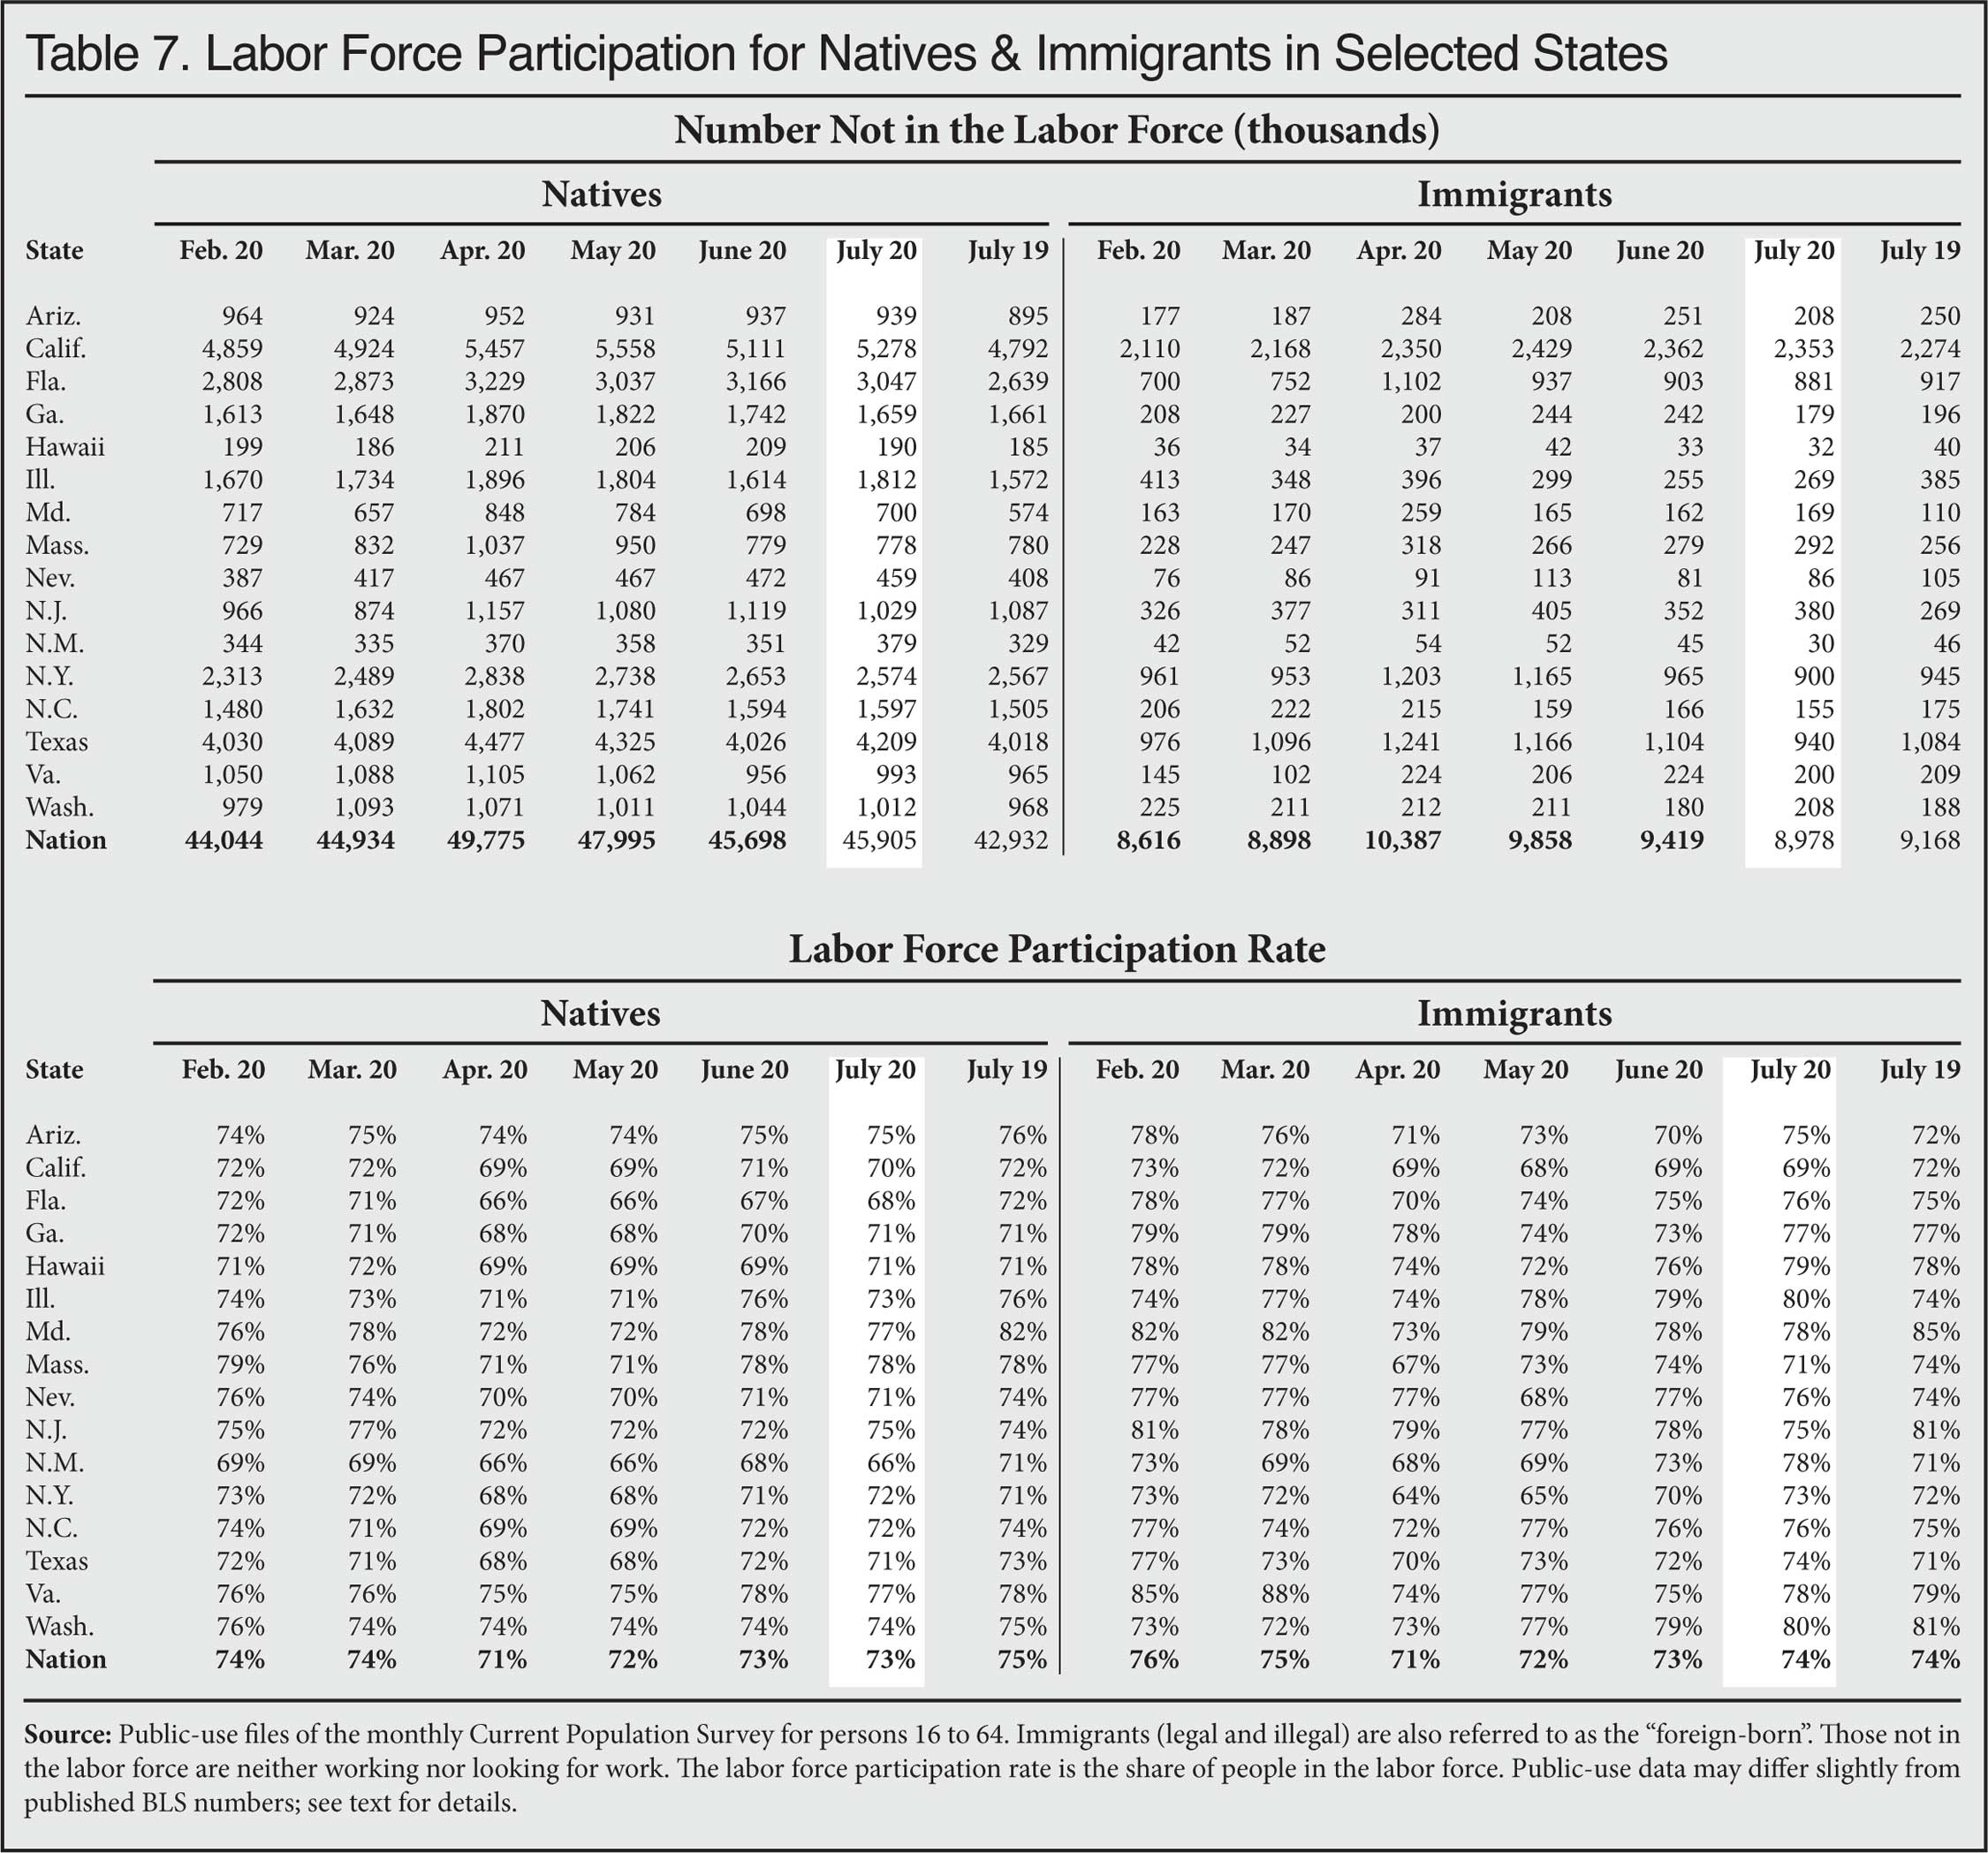
- In addition to the unemployed, there were 45.9 million working-age (16-64) native-born Americans out of the labor force in July — neither working nor looking for work — an increase of 207,000 compared to June. In contrast, the number of immigrants not in the labor force improved by 440,000 to nine million between June and July. (Table 2A)
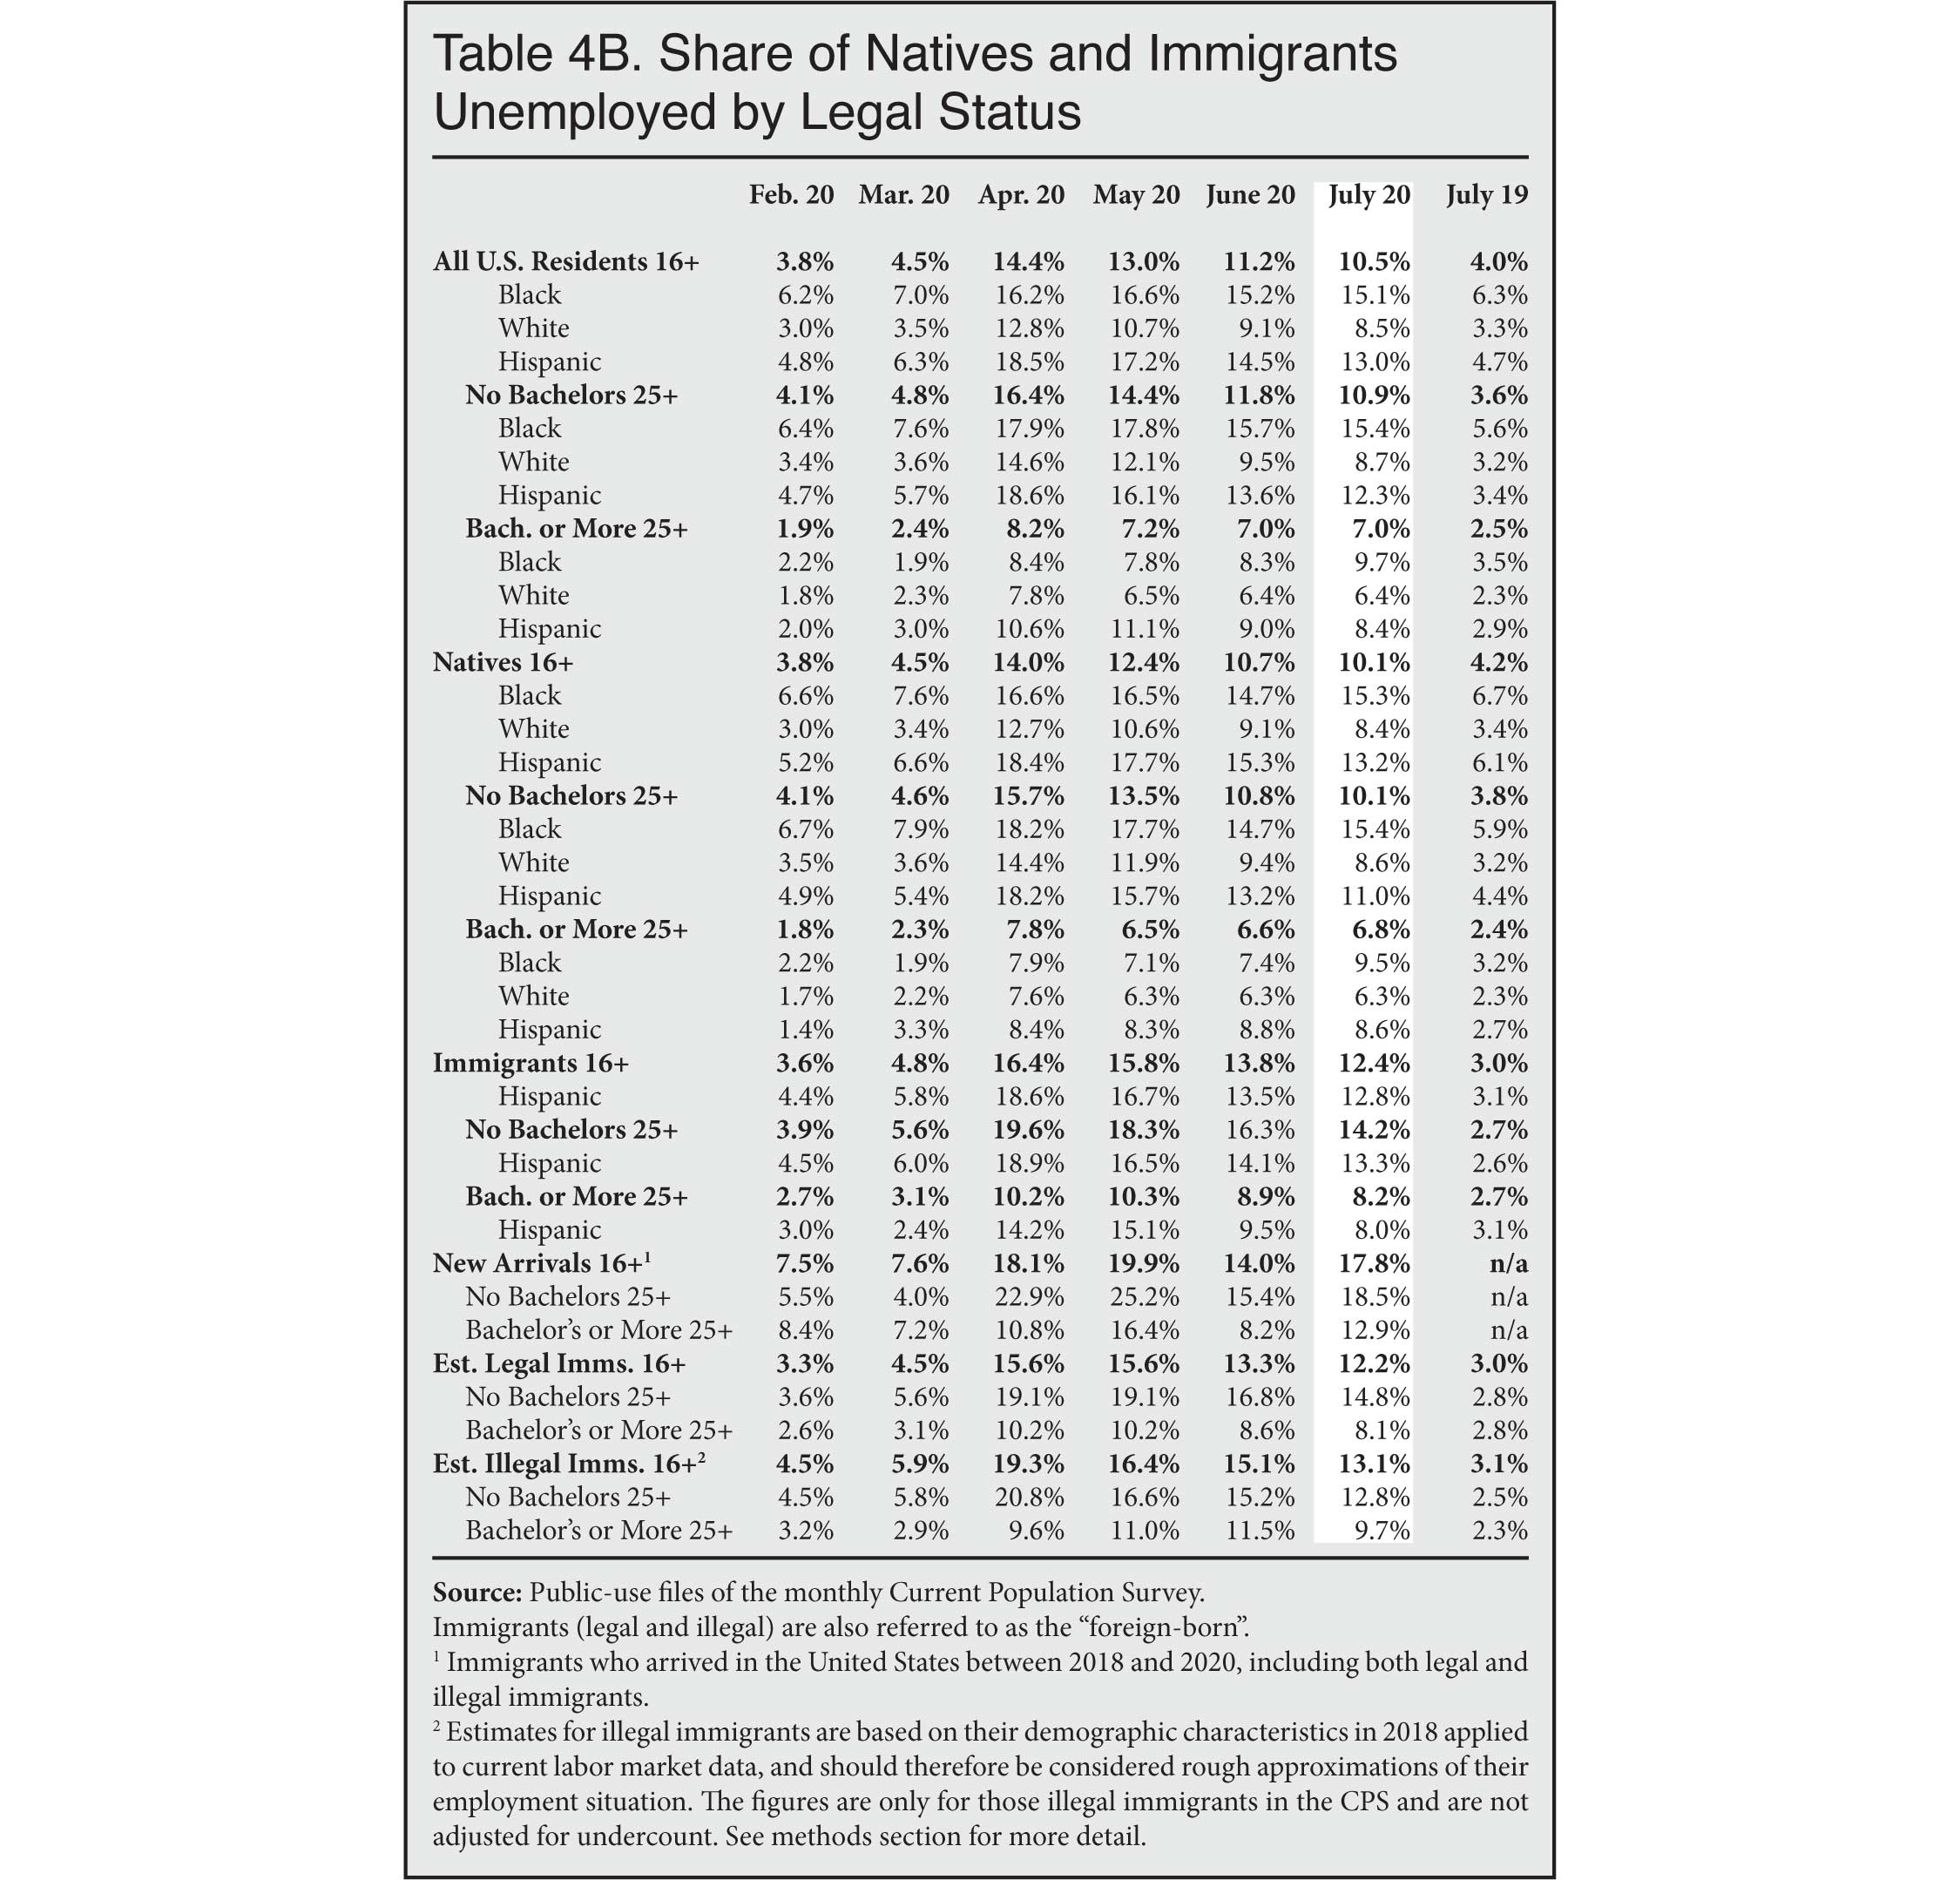
- We estimate the unemployment rate for legal immigrants in July was 12.2 percent, an improvement from the 13.3 percent in June. The unemployment rate for illegal aliens was 13.1 percent, an improvement from 15.1 percent in June. (Our estimates by legal status are approximations only.) (Table 4B)
- Unemployment among recent immigrants, those in the country for less than three years, was 17.8 percent — one of highest rates for any subgroup of immigrants.
Among the less-educated:
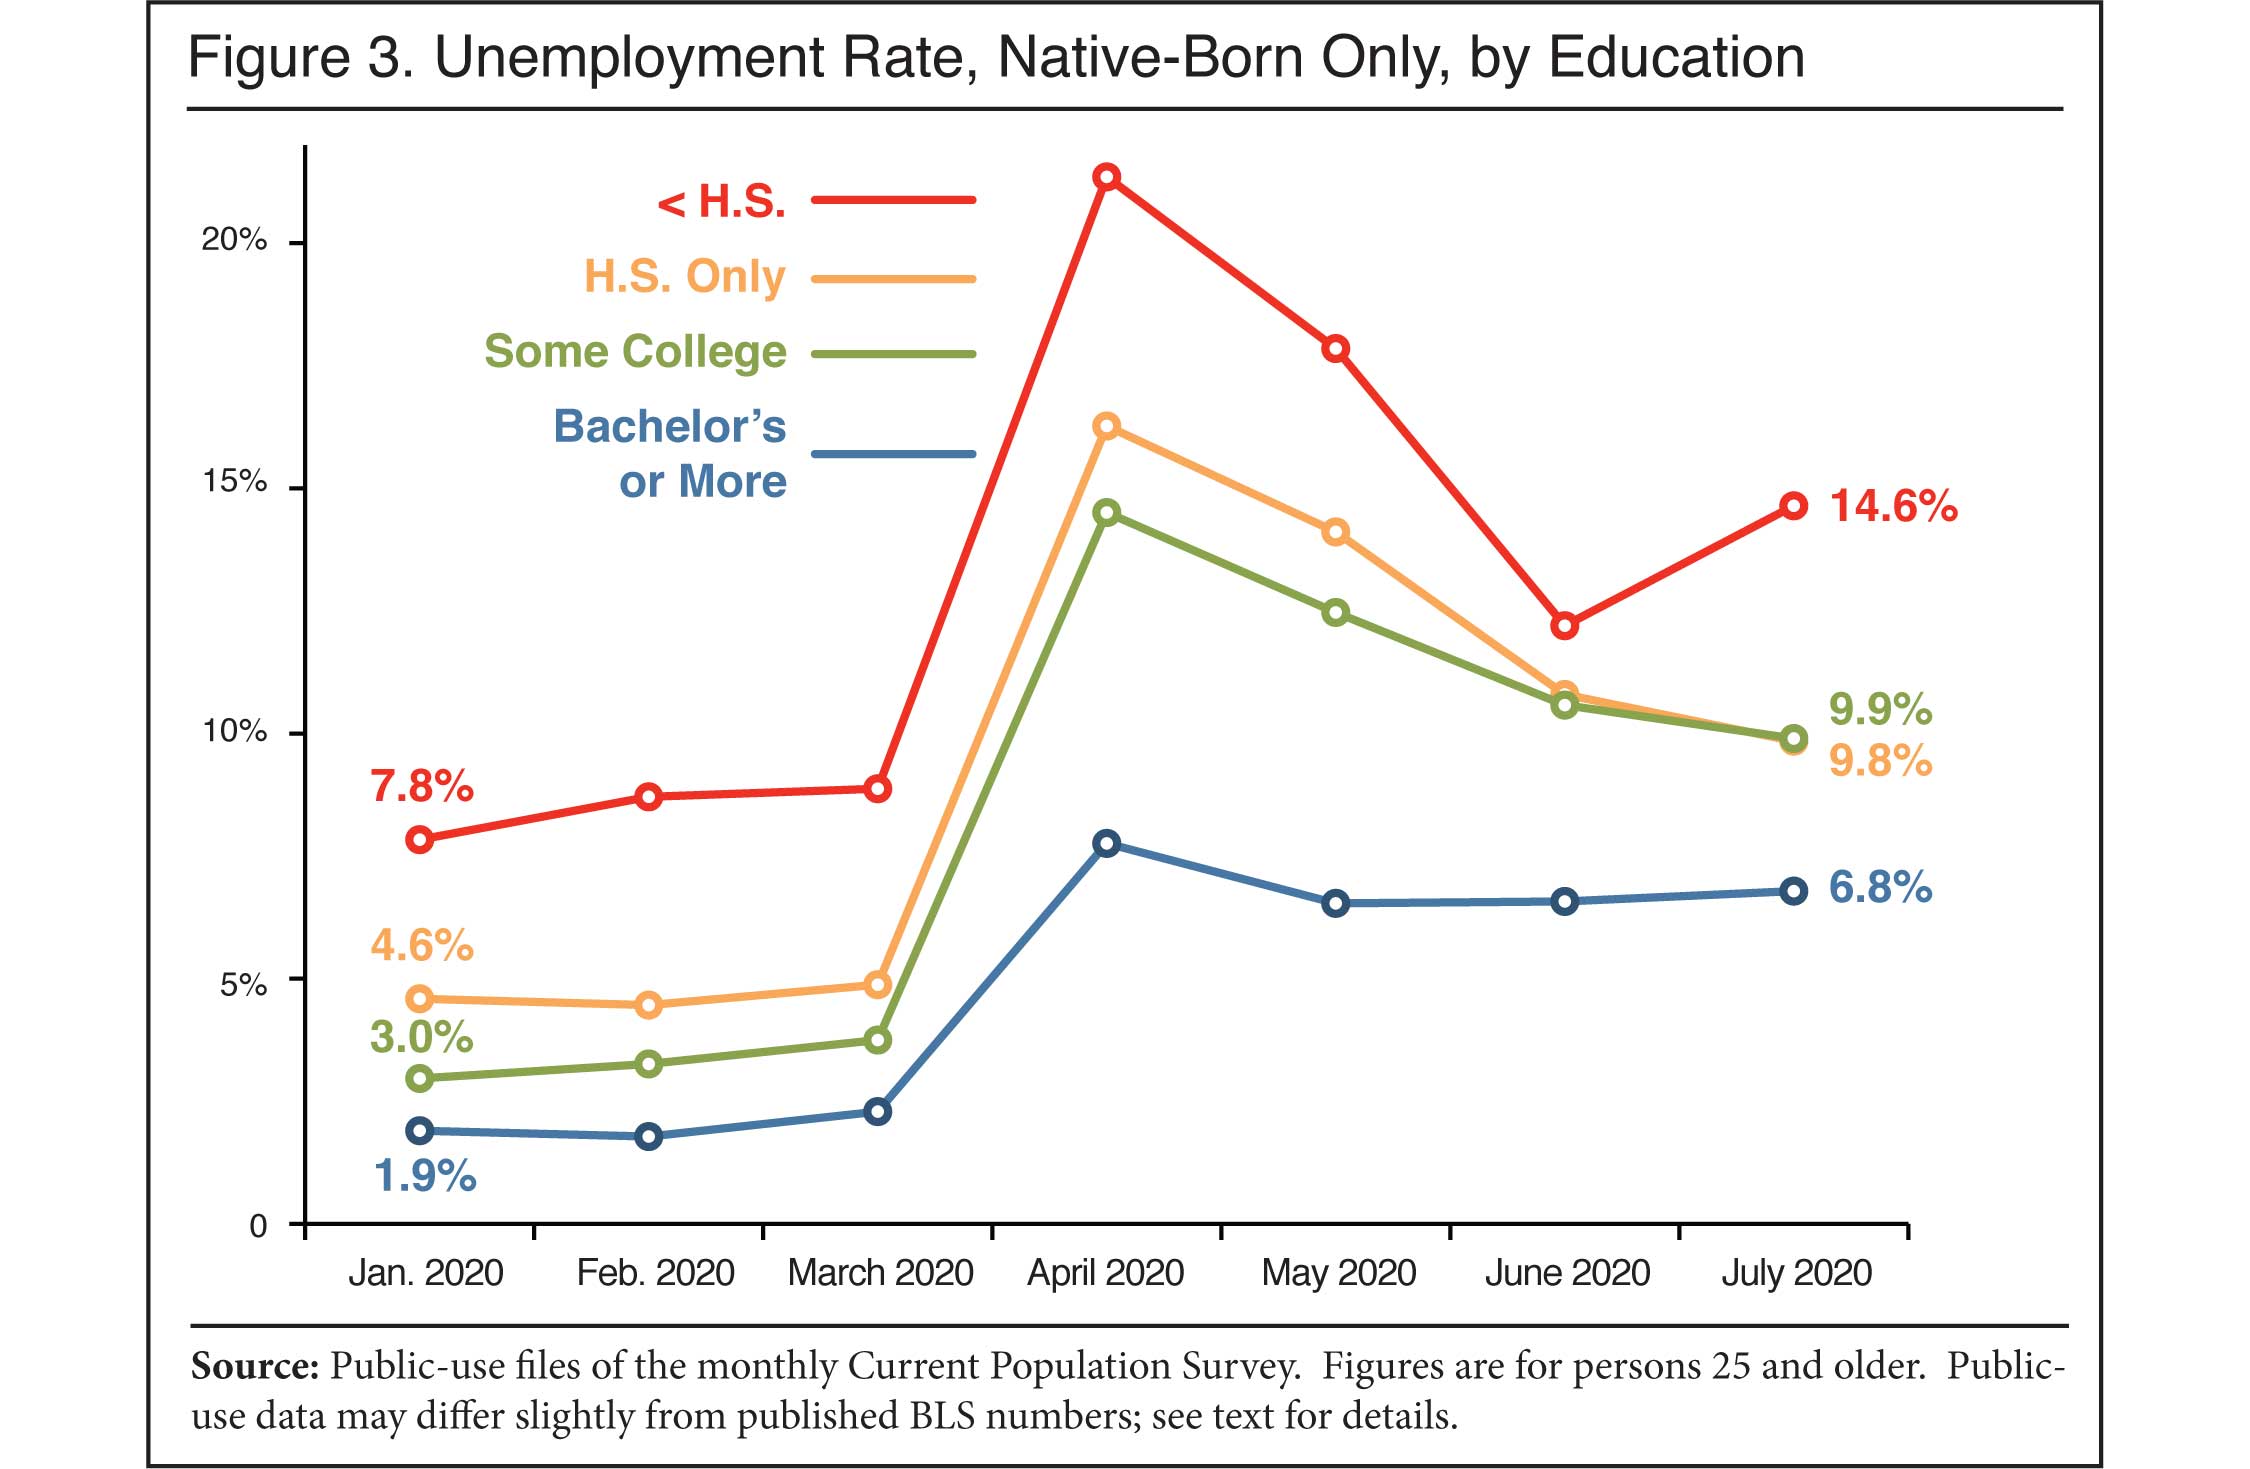
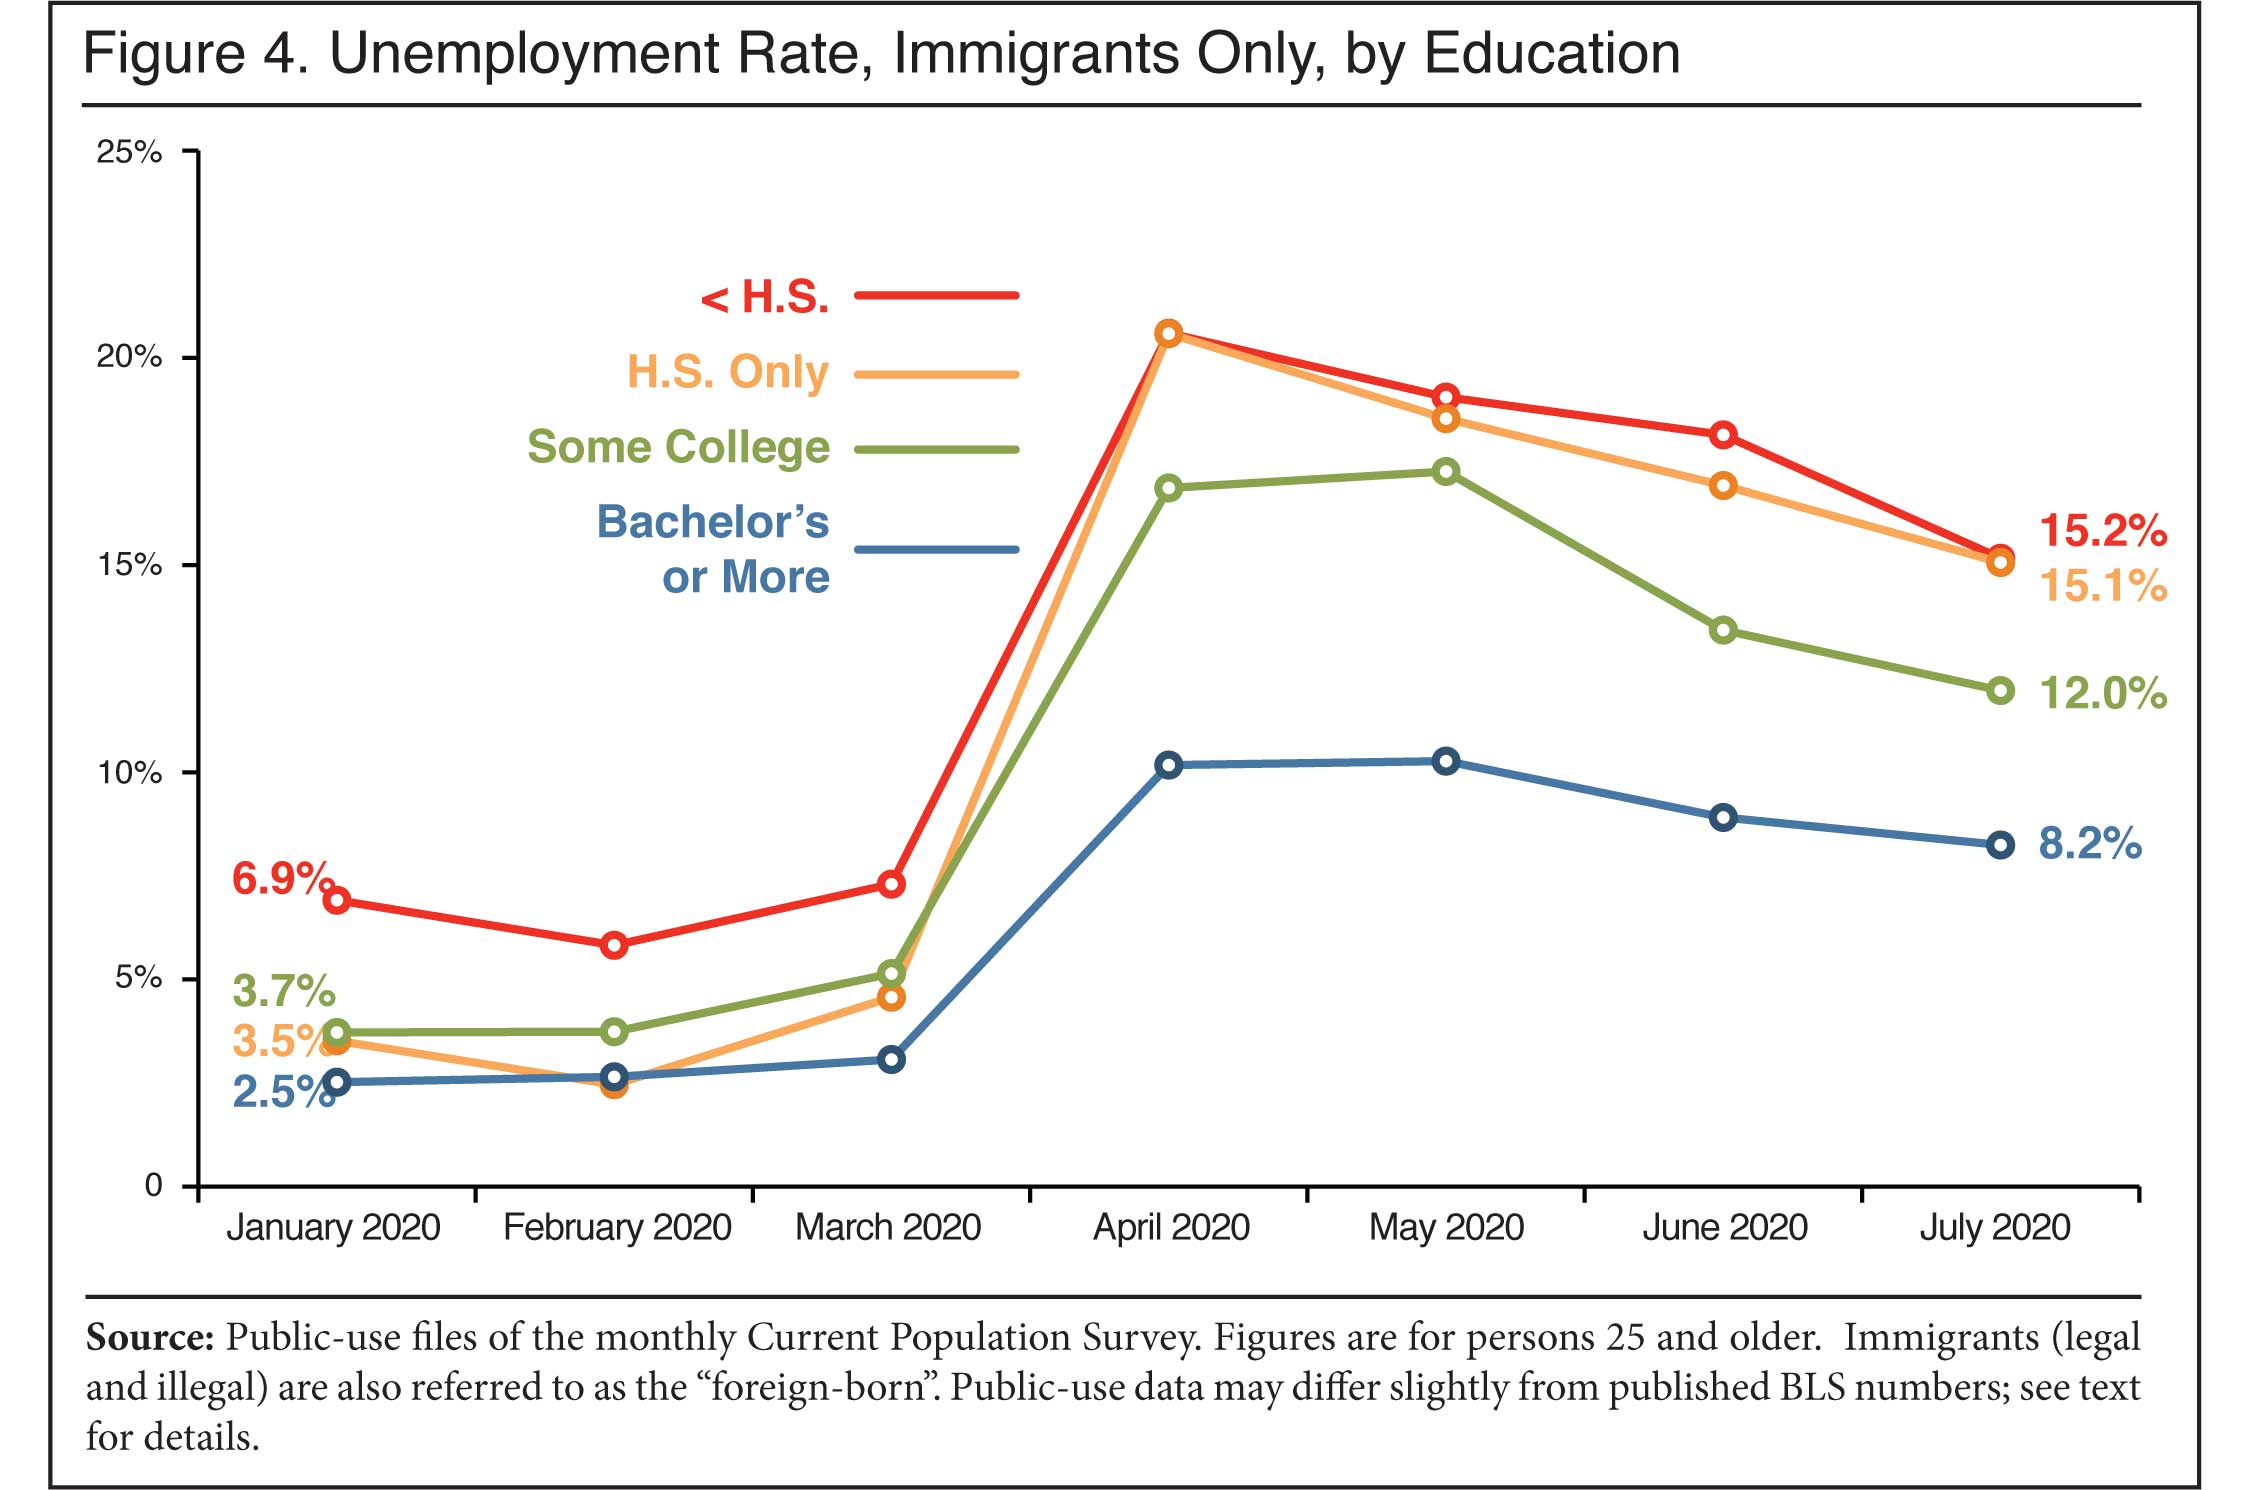
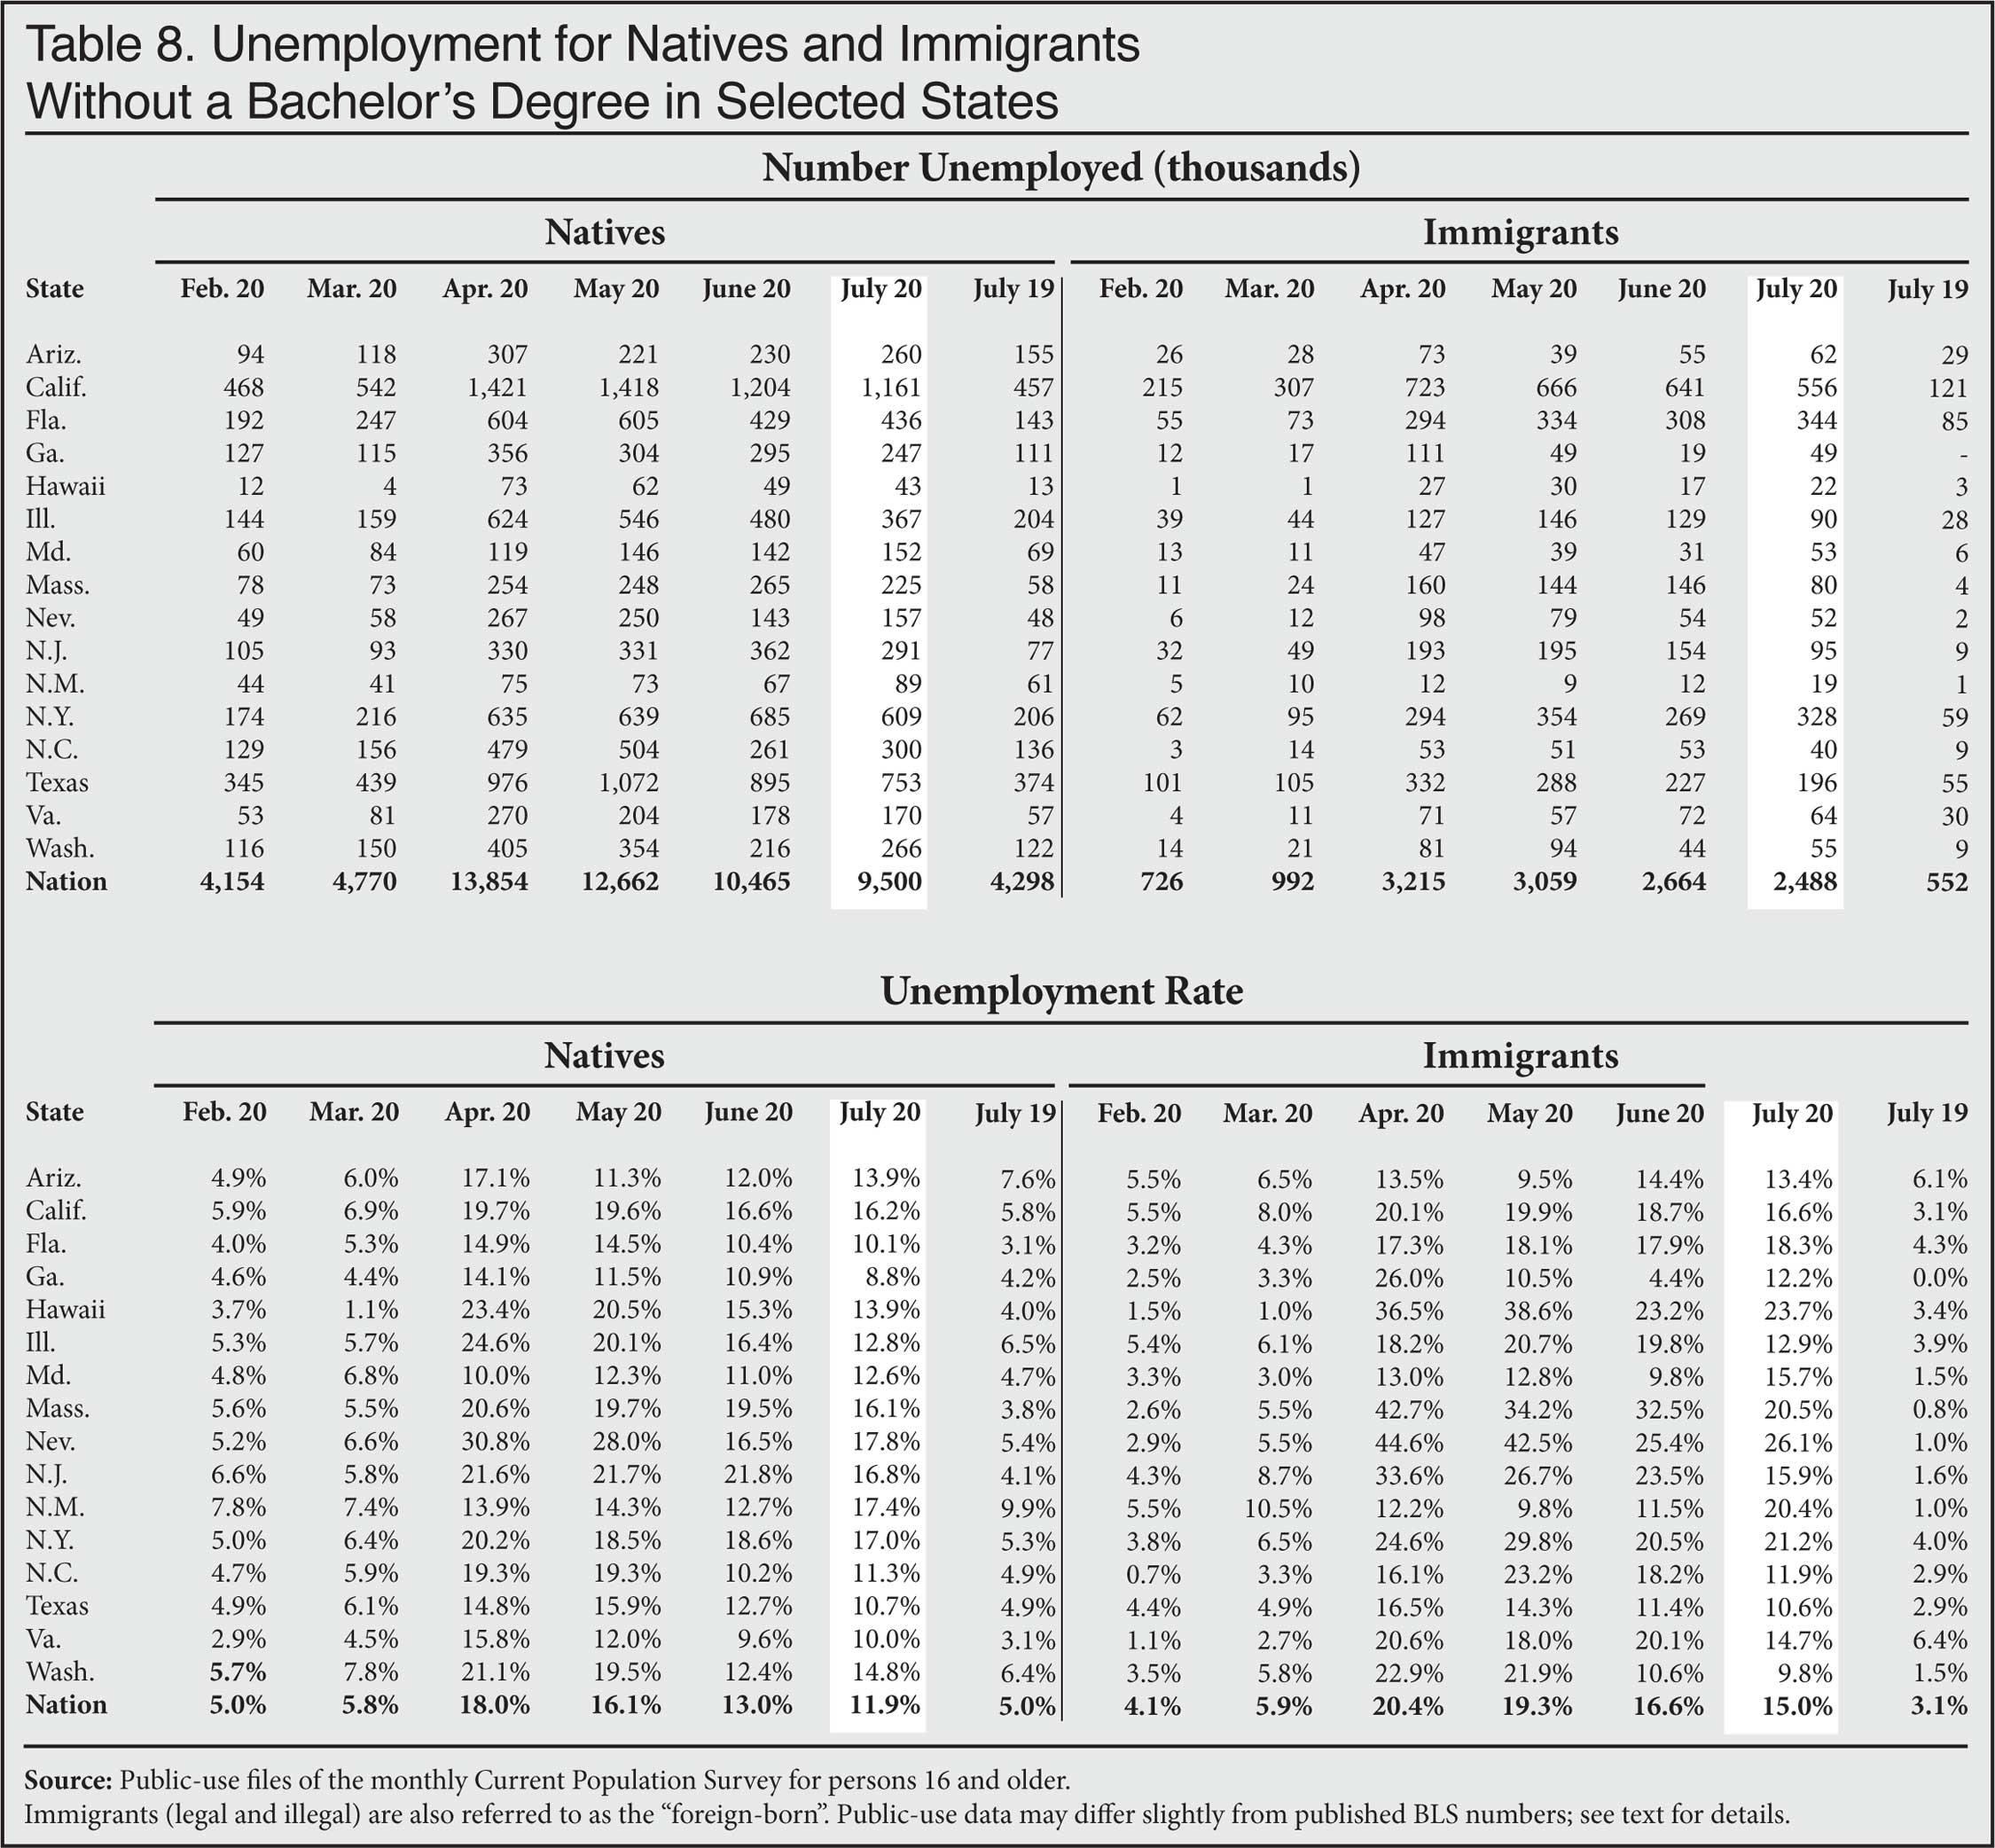
- The unemployment rate for native-born Americans (ages 25-plus) without a bachelor’s degree was 10.1 percent in July, compared to 6.8 percent for those with at least a bachelor’s. Among immigrants (ages 25-plus), 14.2 percent without a bachelor’s degree were unemployed, compared to 8.2 percent with a bachelor’s. (Table 1B)
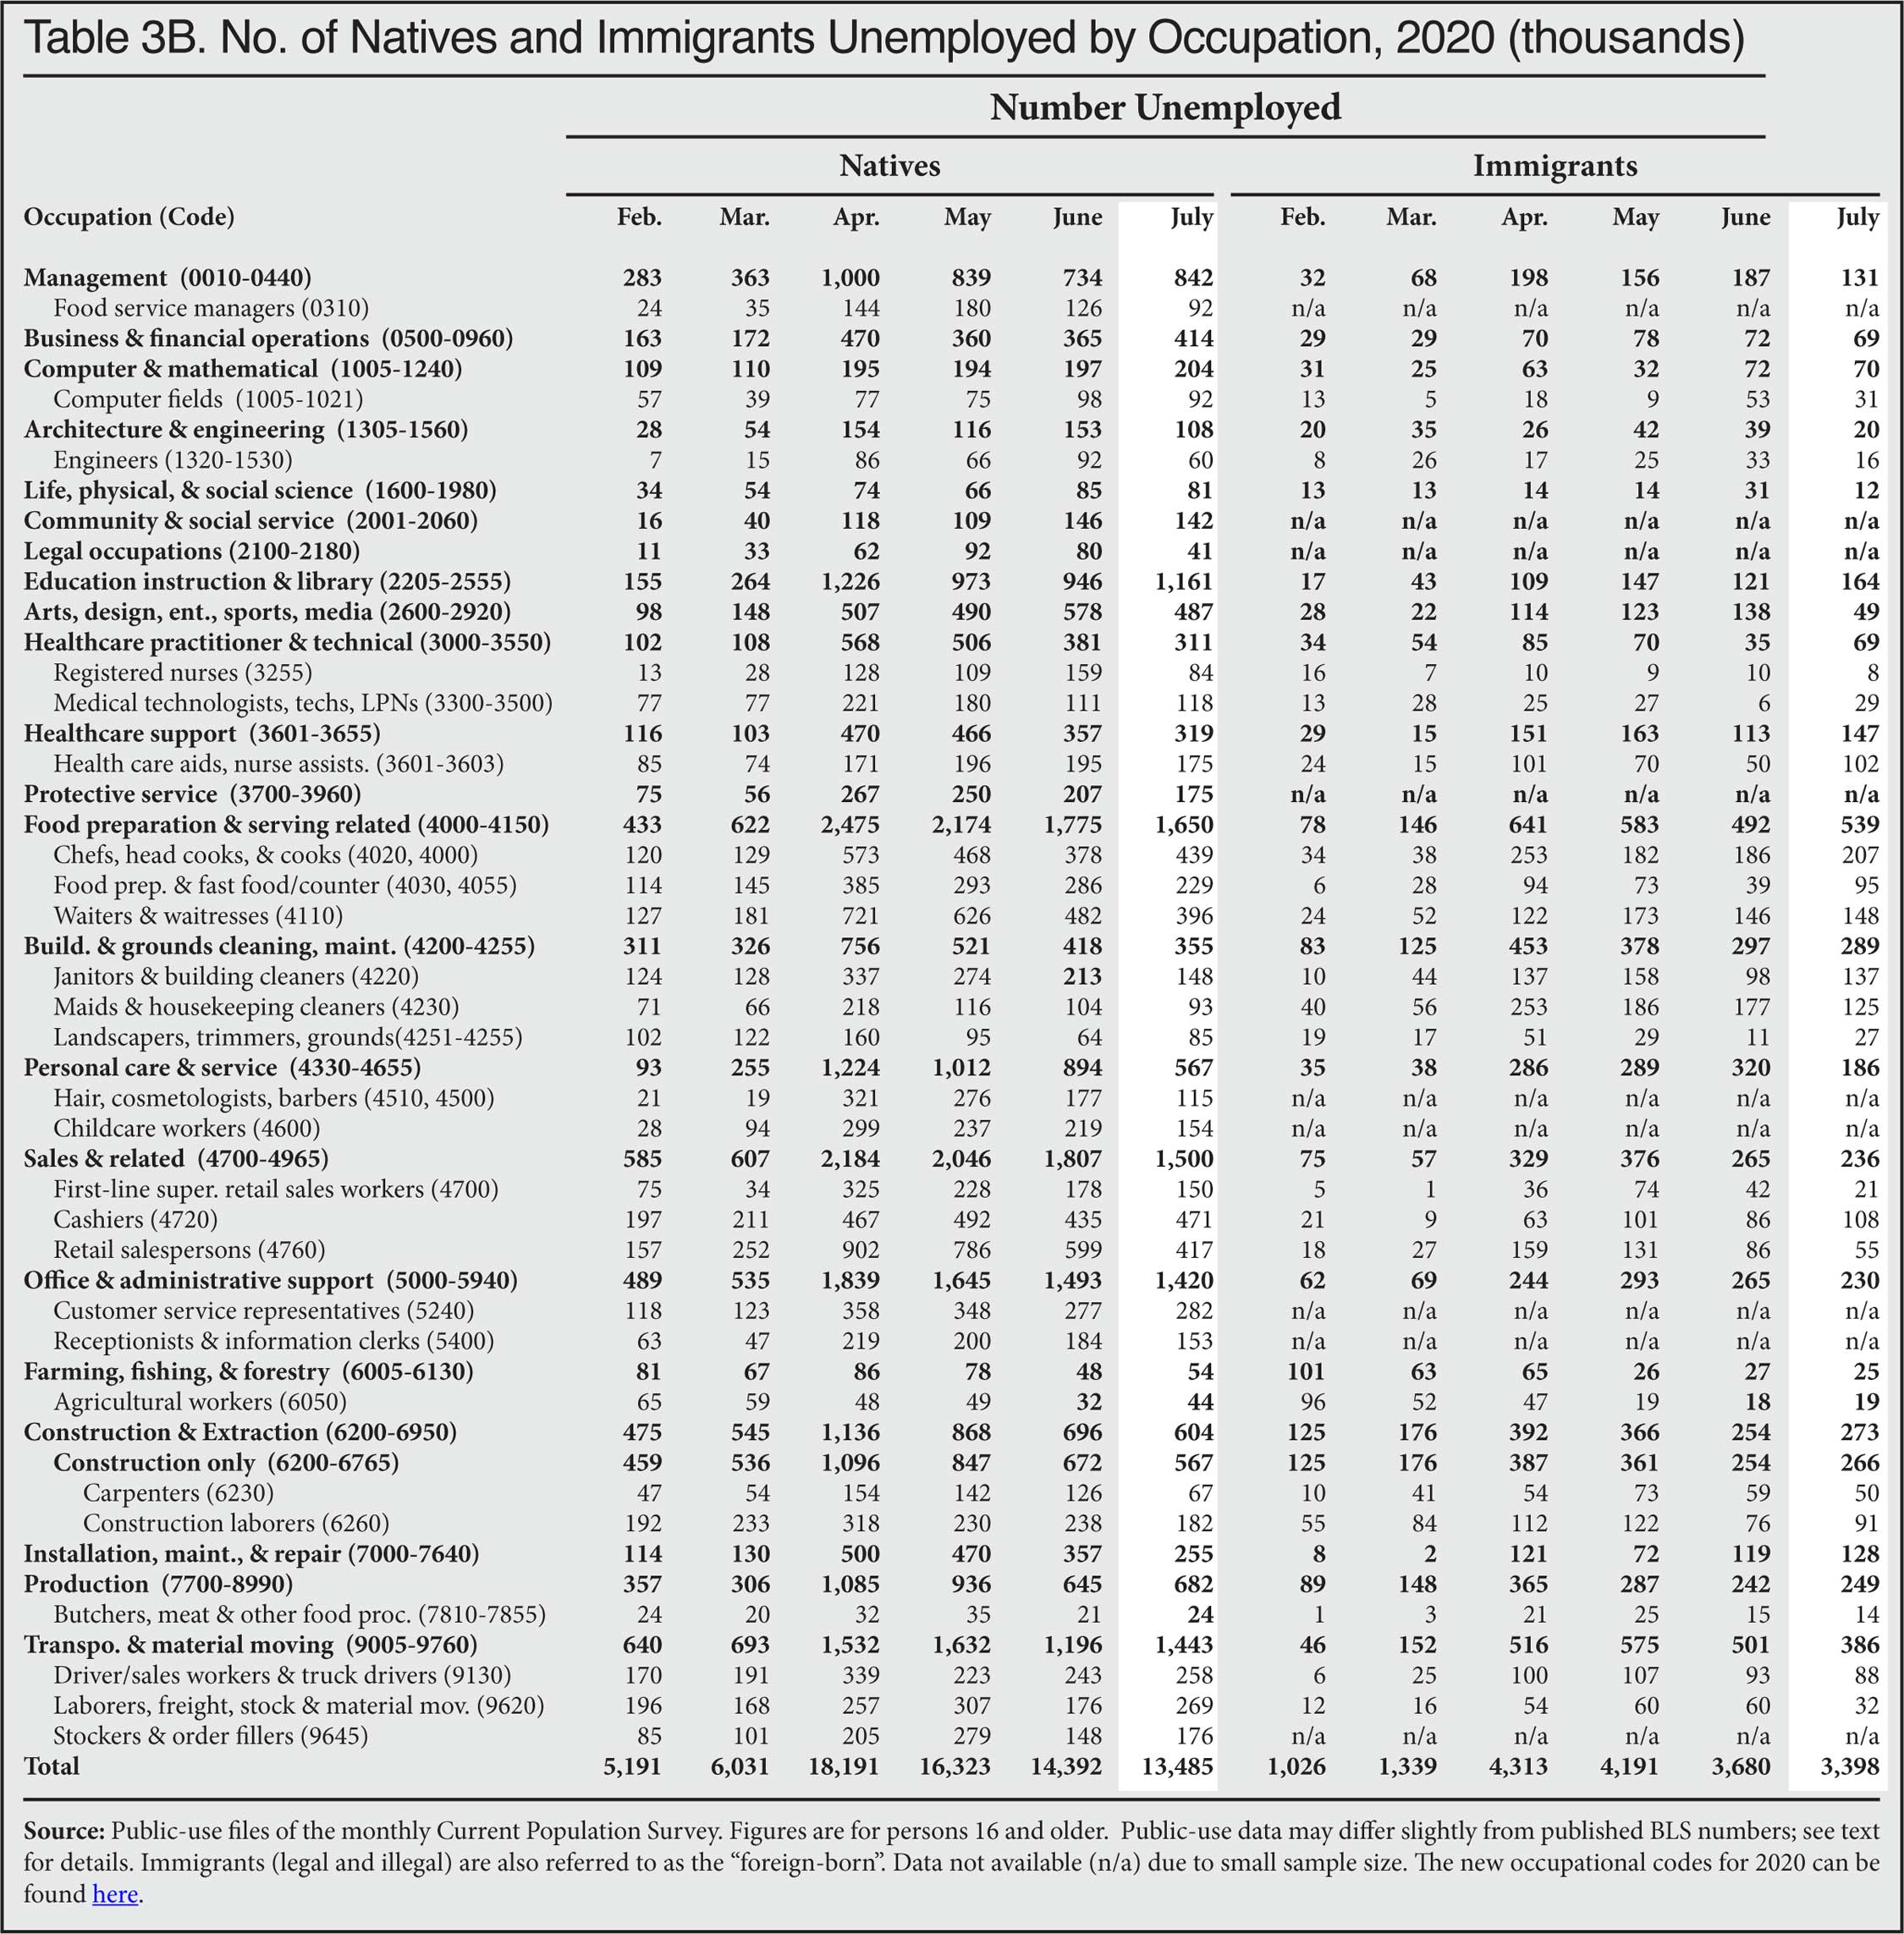
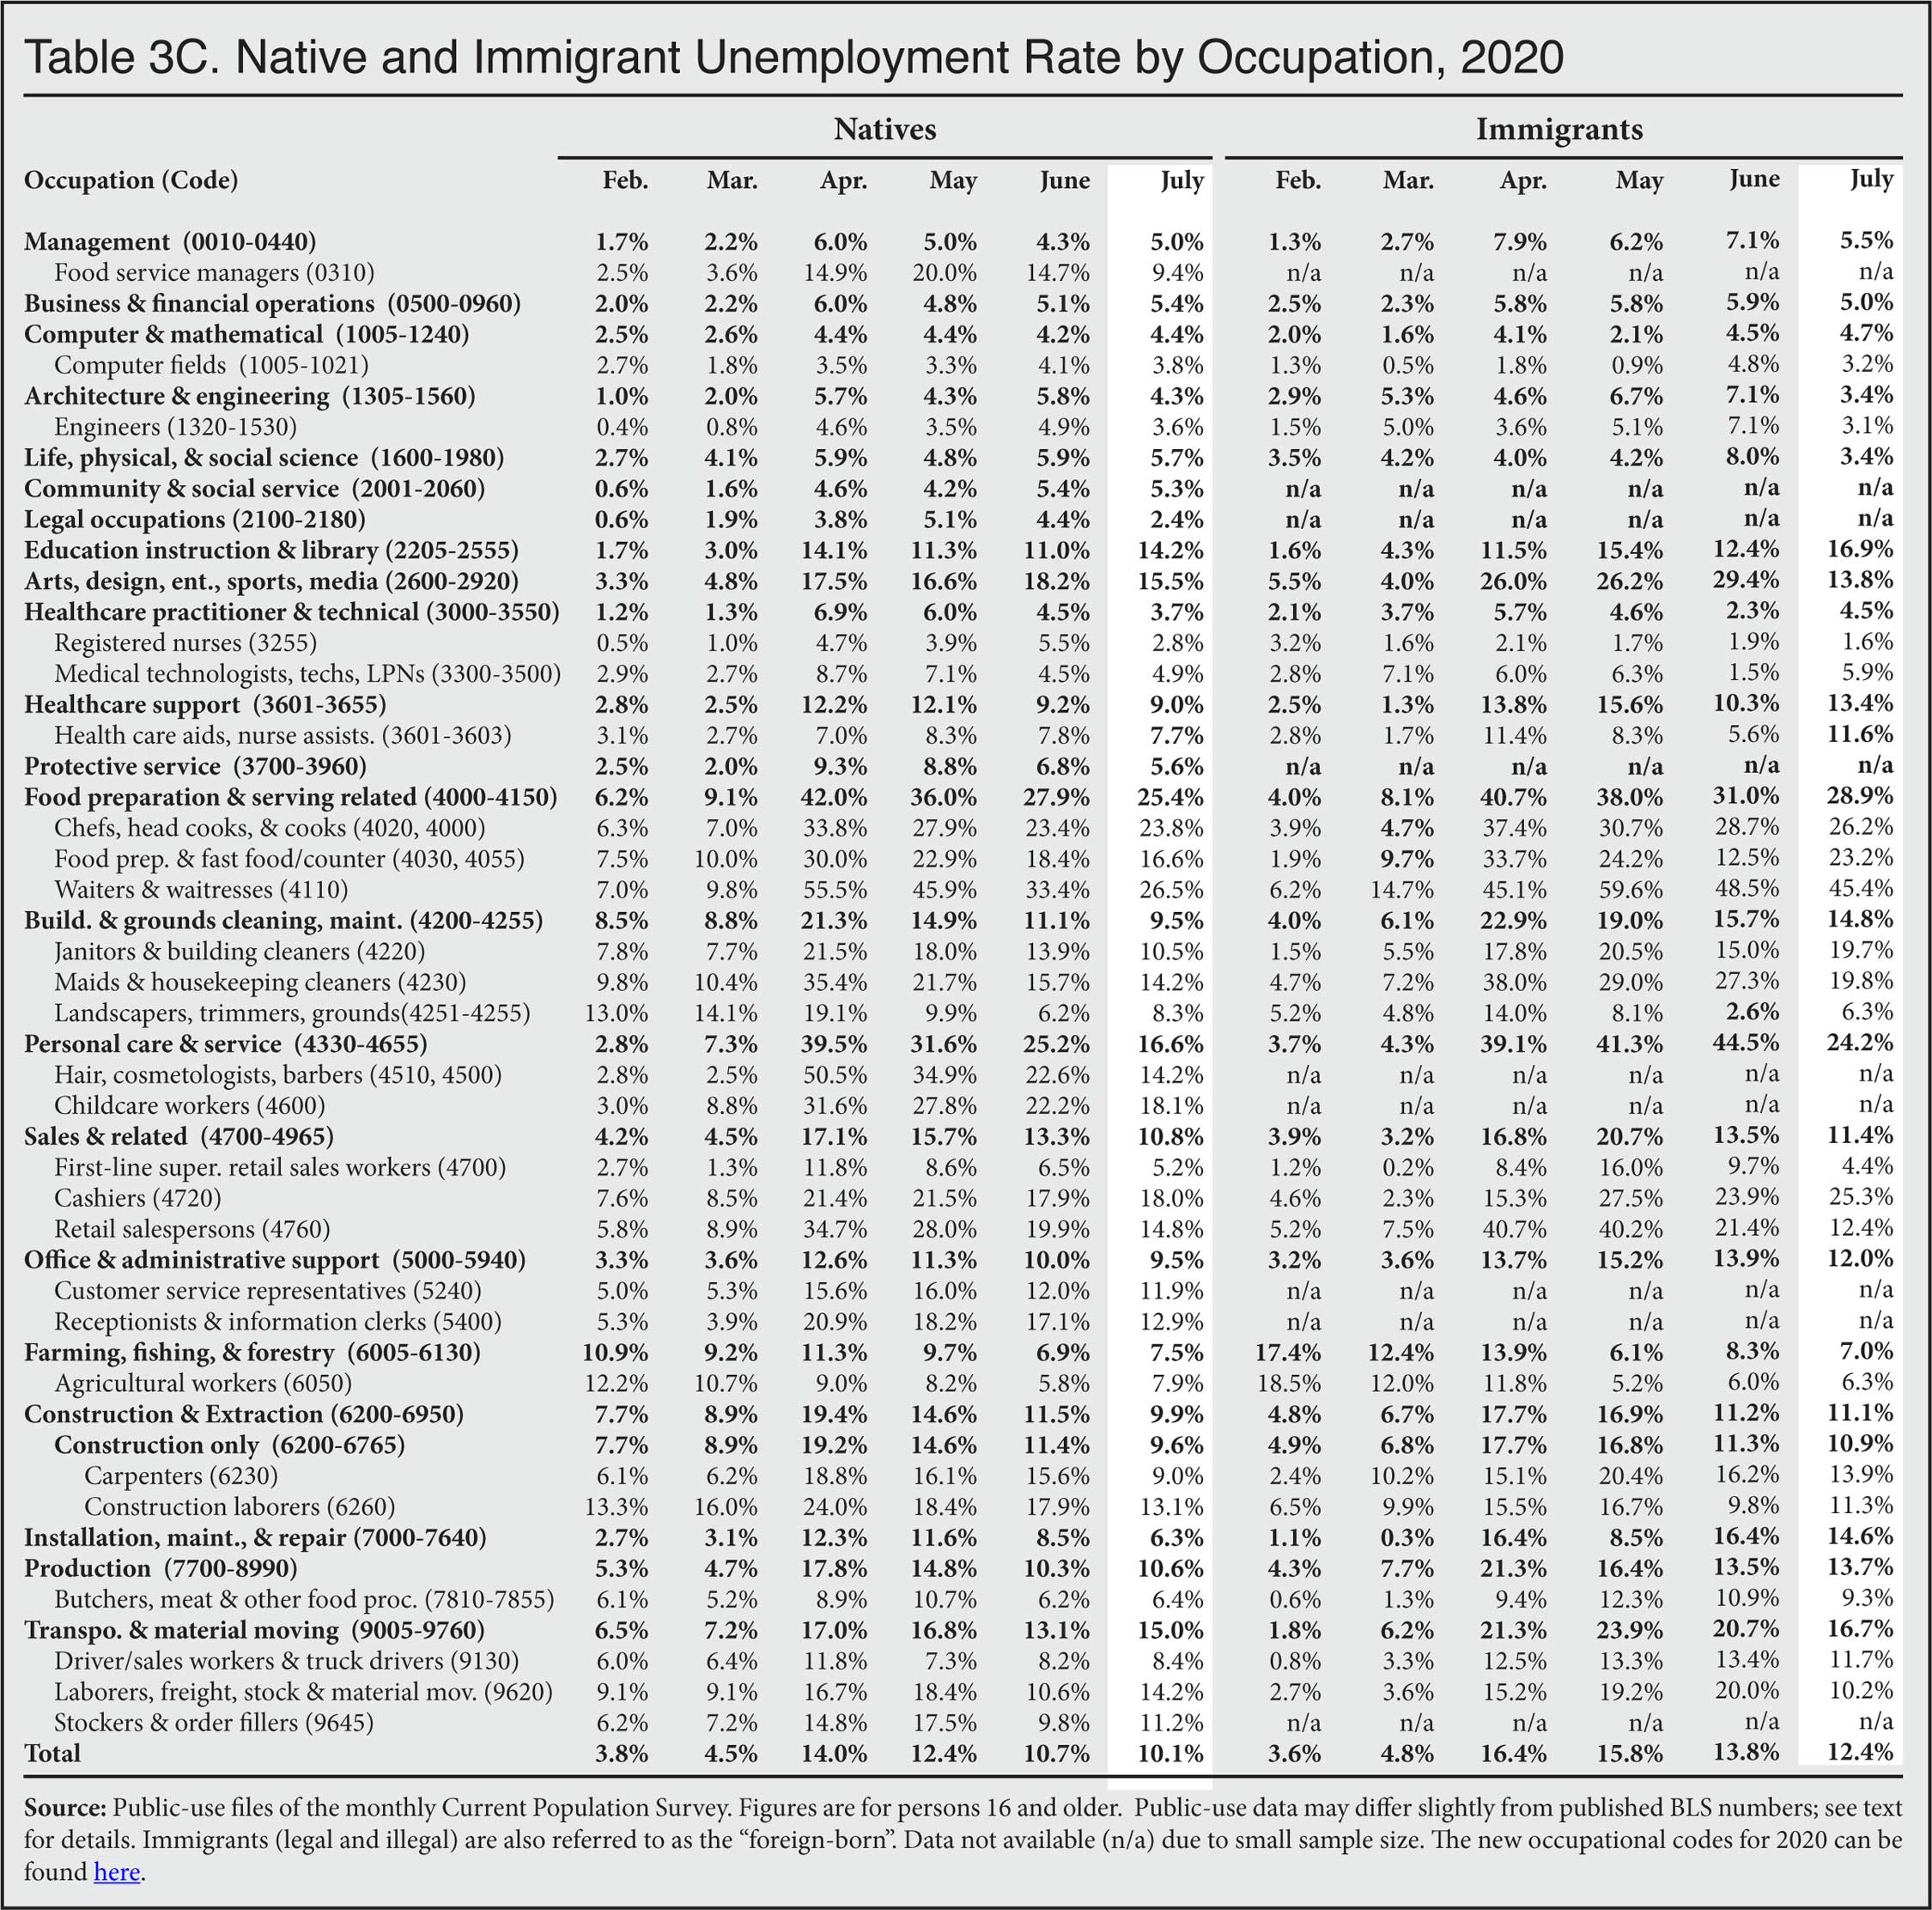
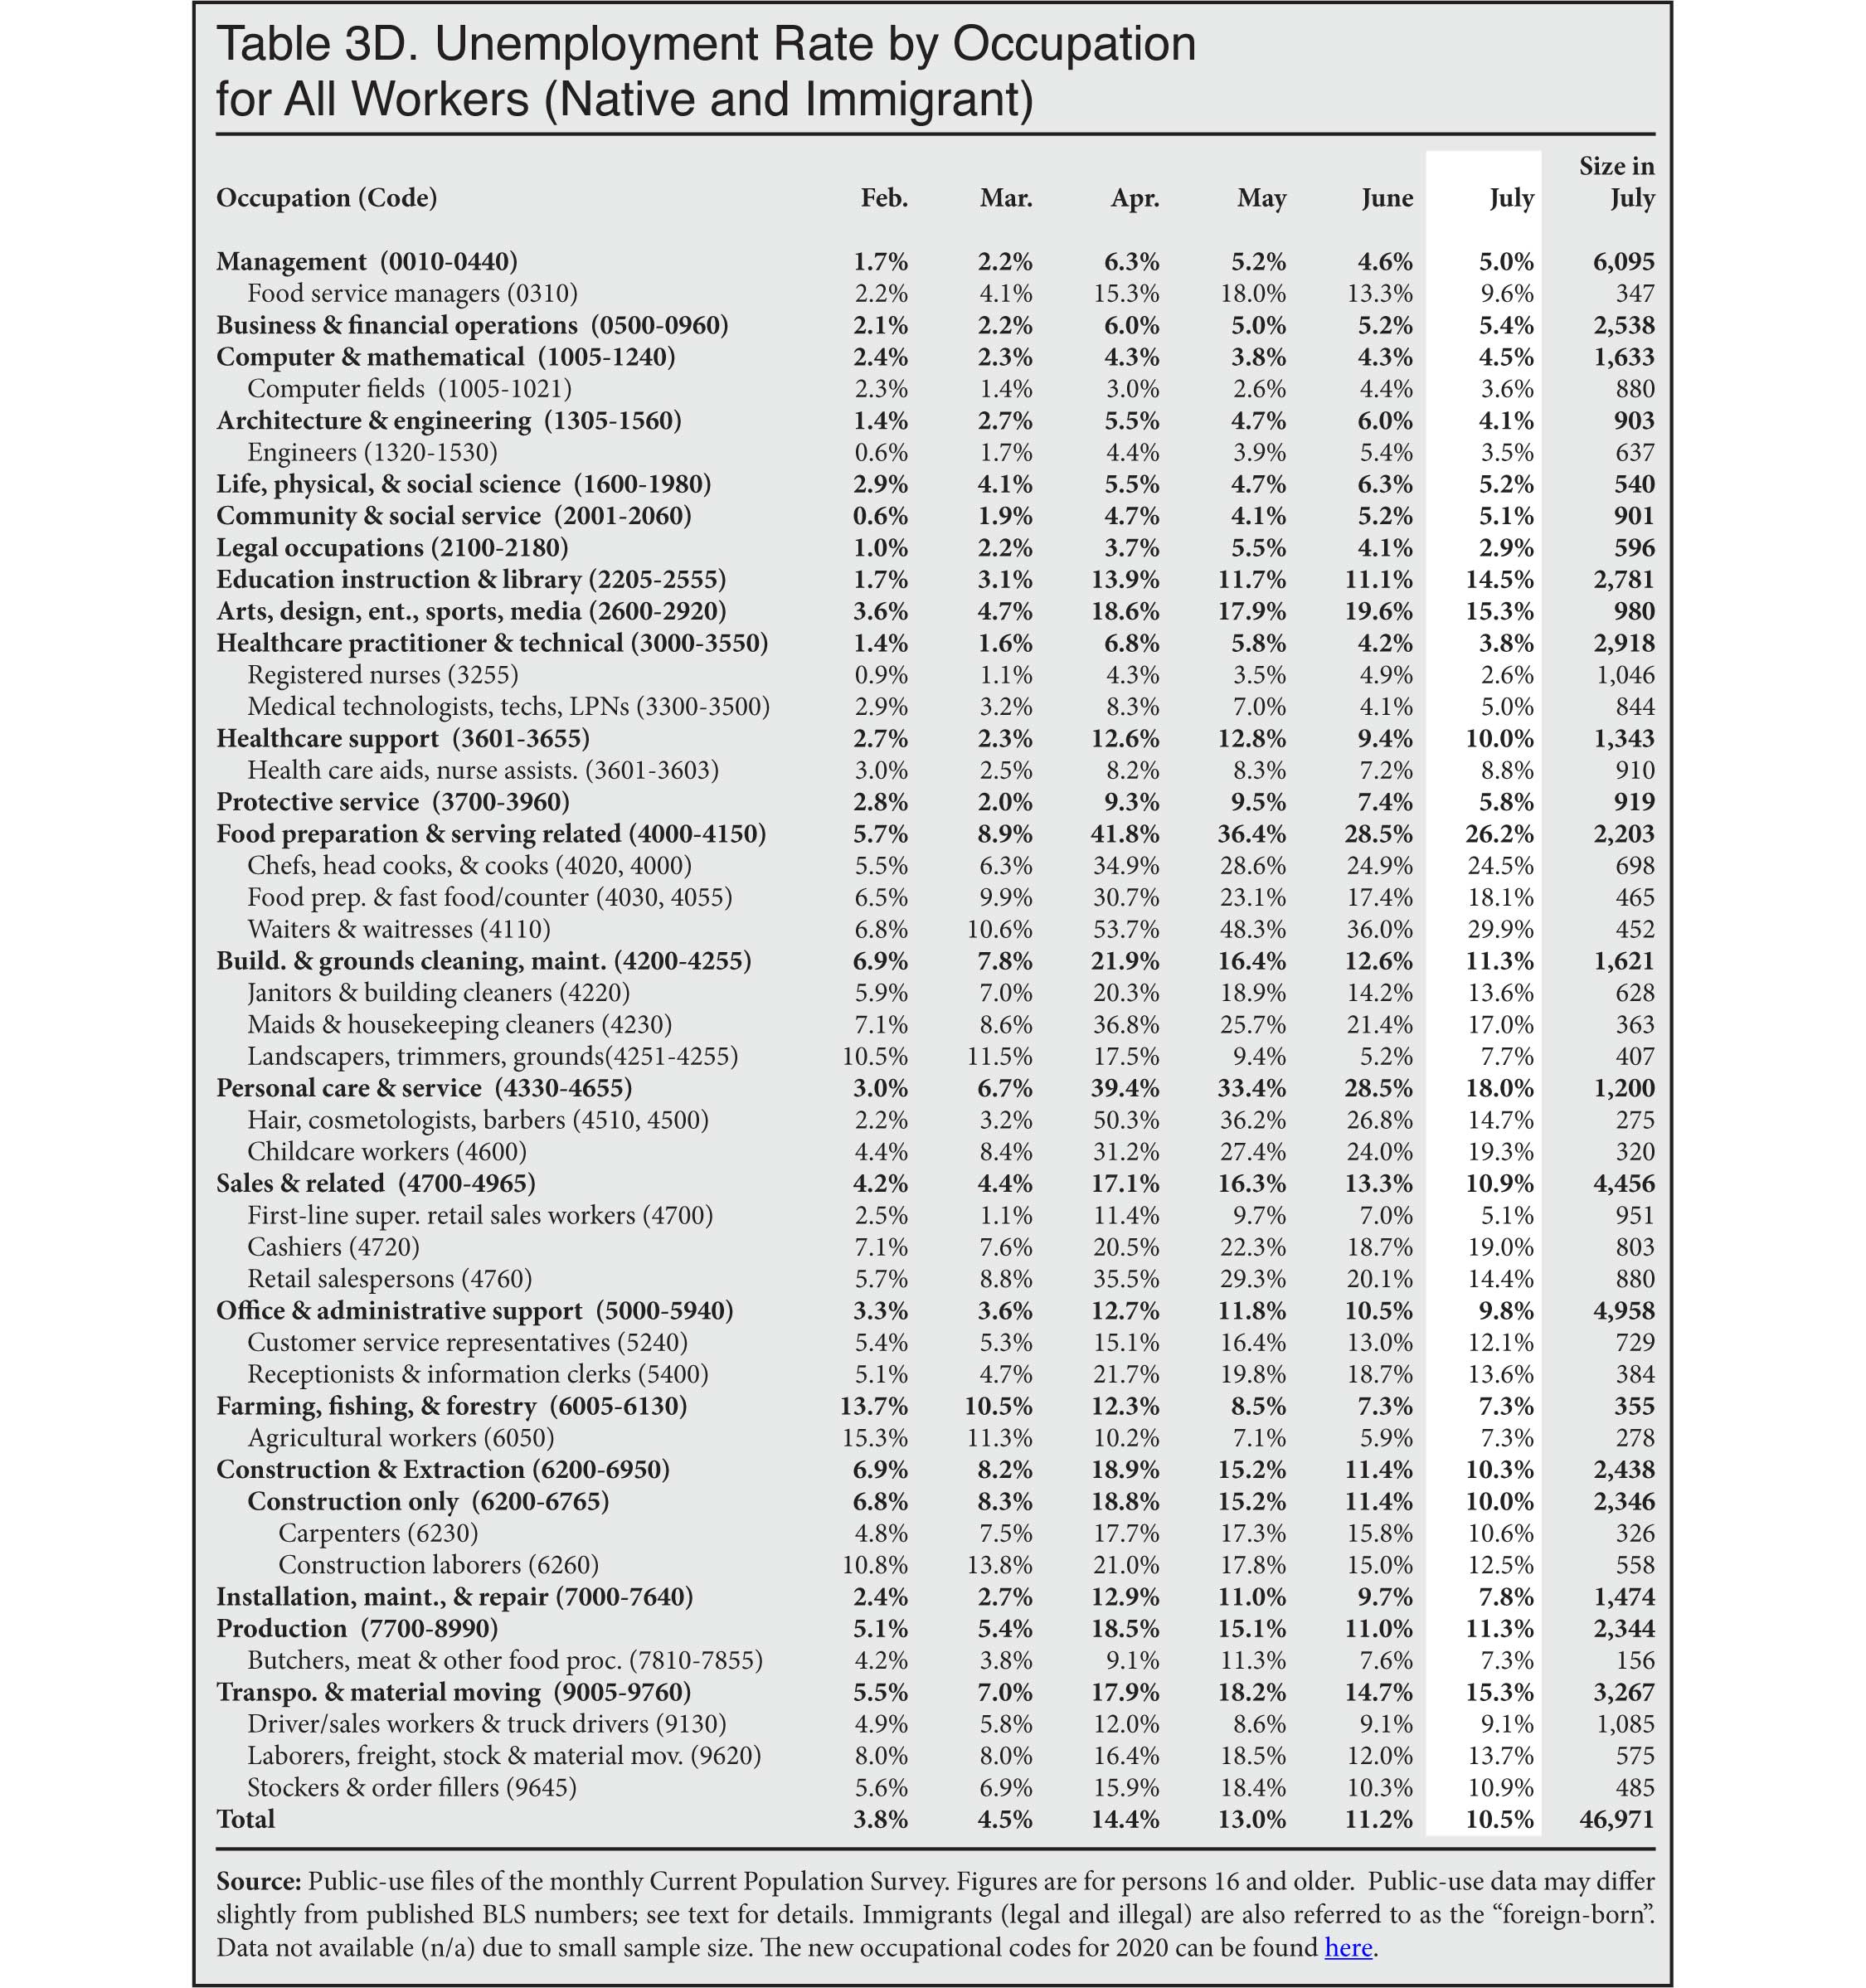
- The unemployment rate (immigrant and native-born) in many jobs typically performed by the less-educated has improved but remains high. (Table 3D)
- 26.2 percent for food preparers and servers
- 17.0 percent for maids and housekeepers
- 19.0 percent for cashiers
- 14.4 percent for retail sales persons
- 12.5 percent for construction laborers
- 8.8 percent for healthcare aides and nursing assistants
- 7.7 percent for landscapers, trimmers, and groundskeepers
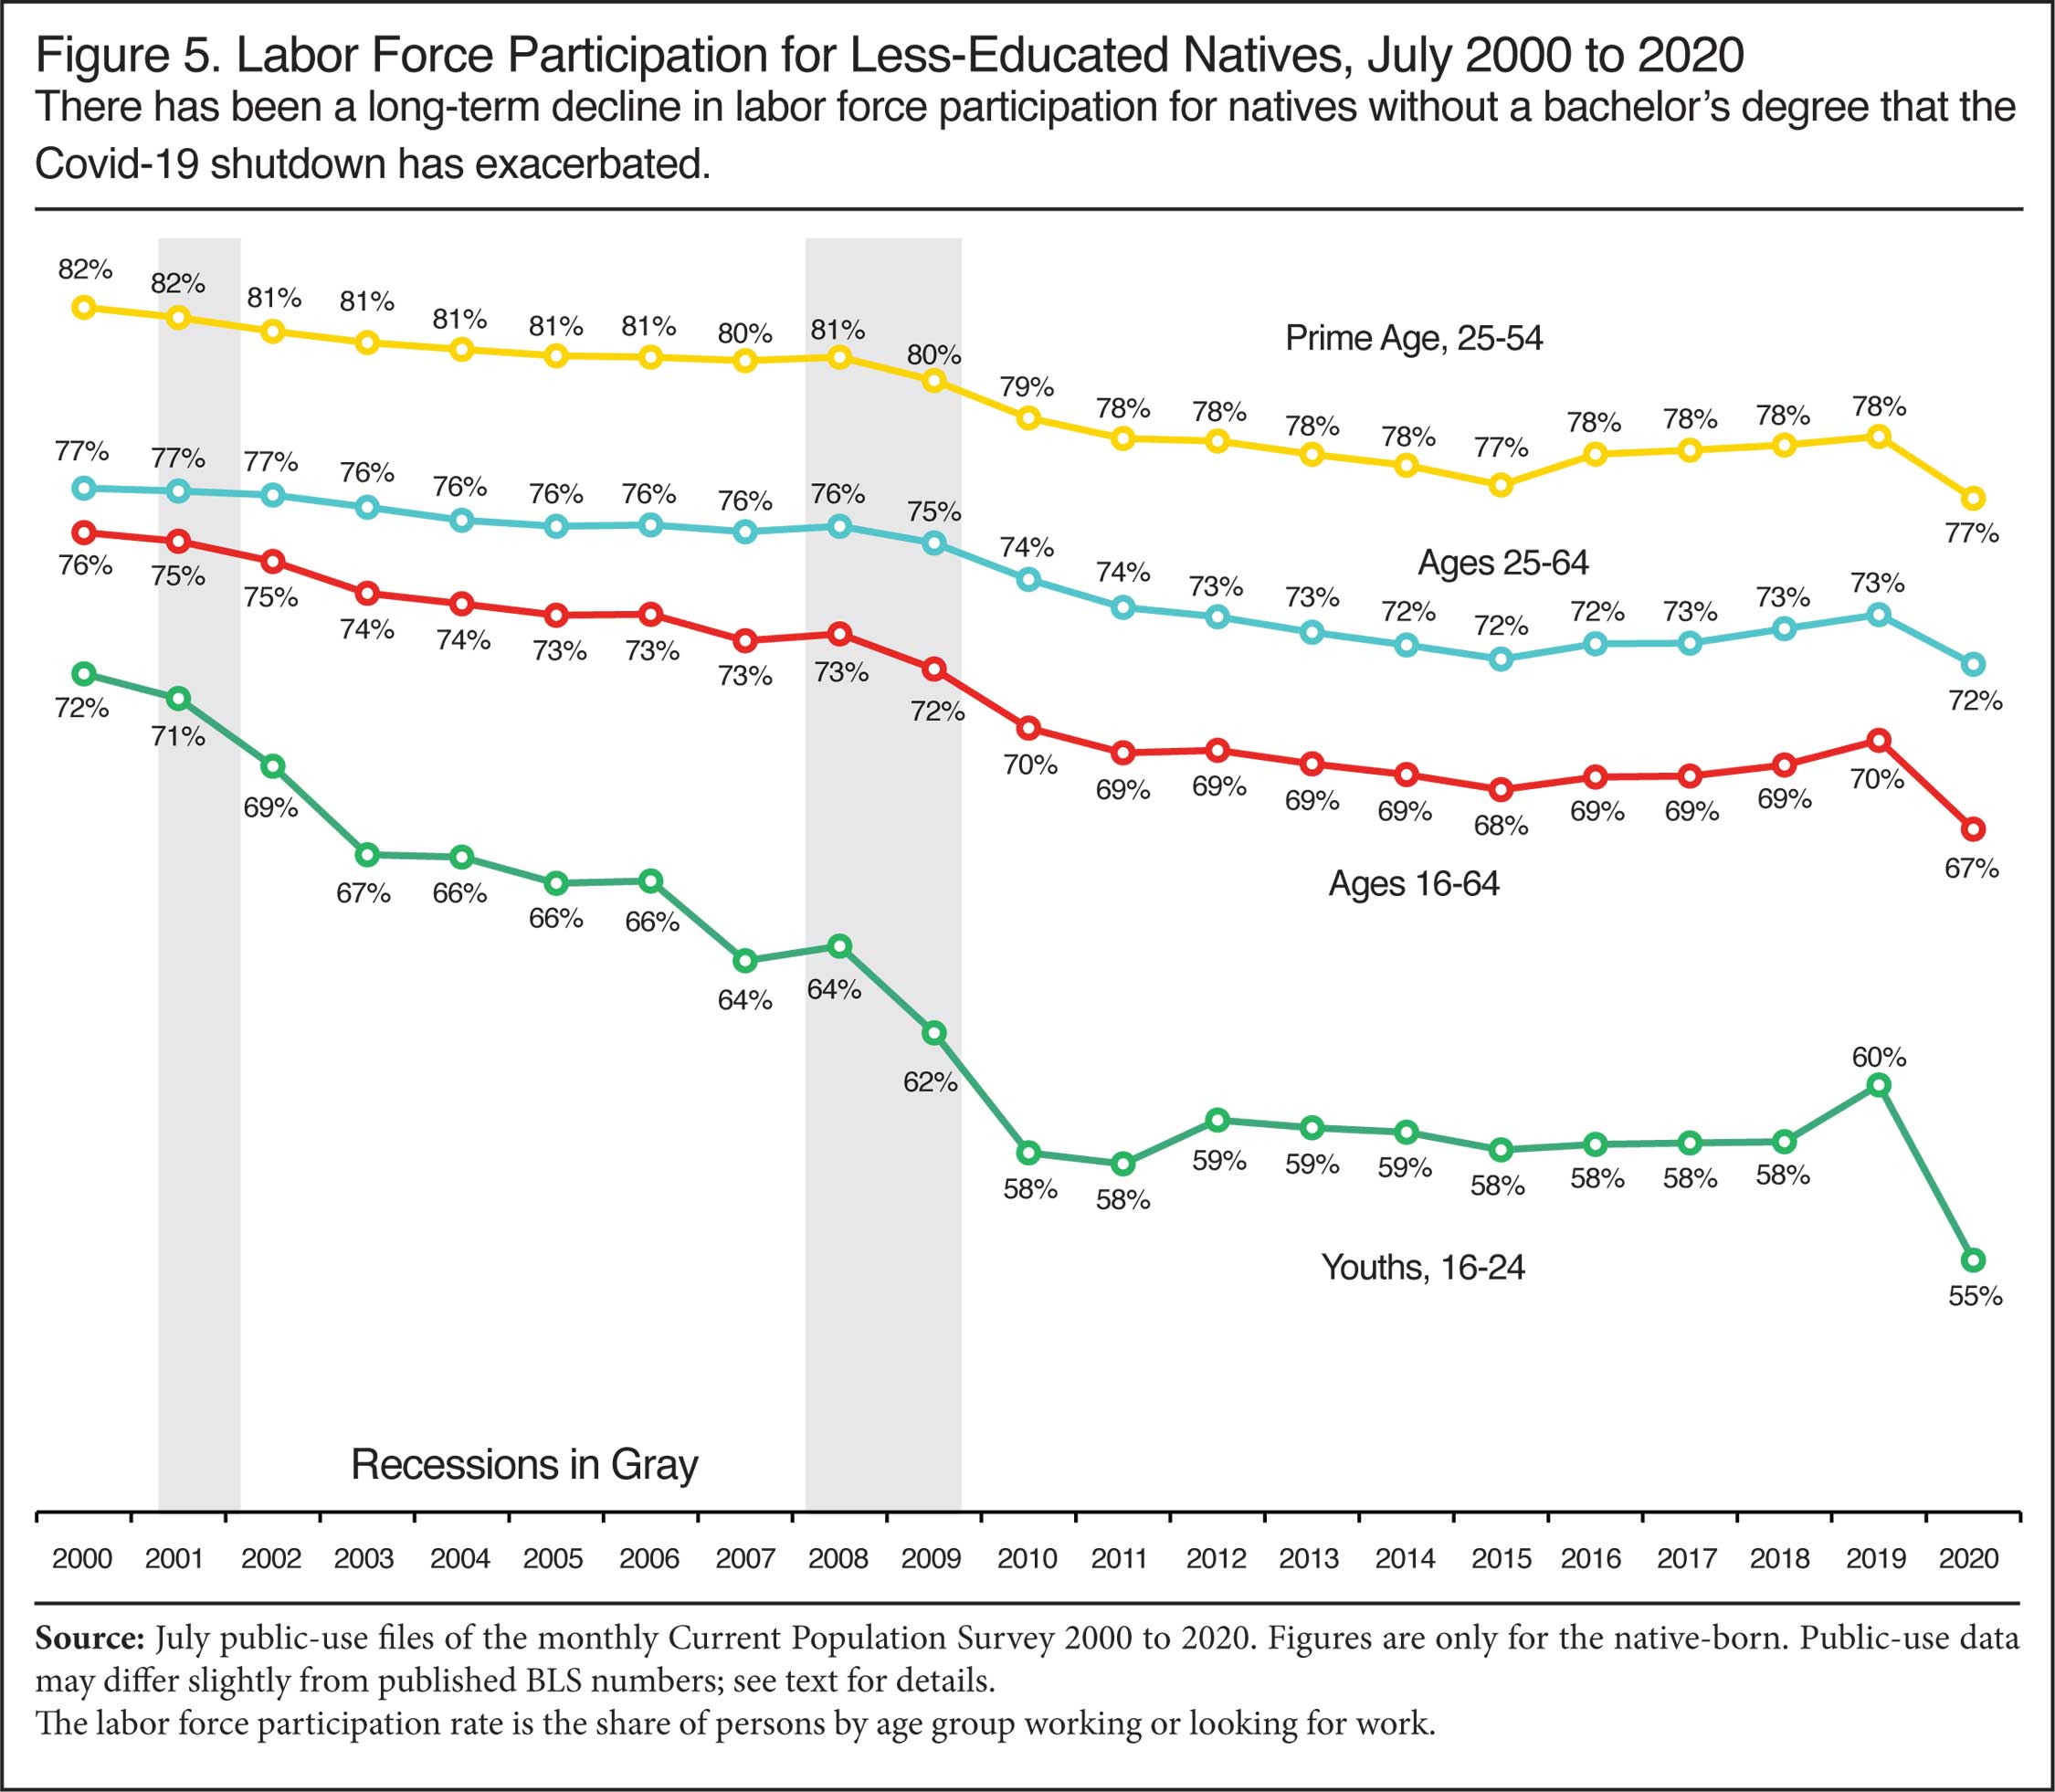
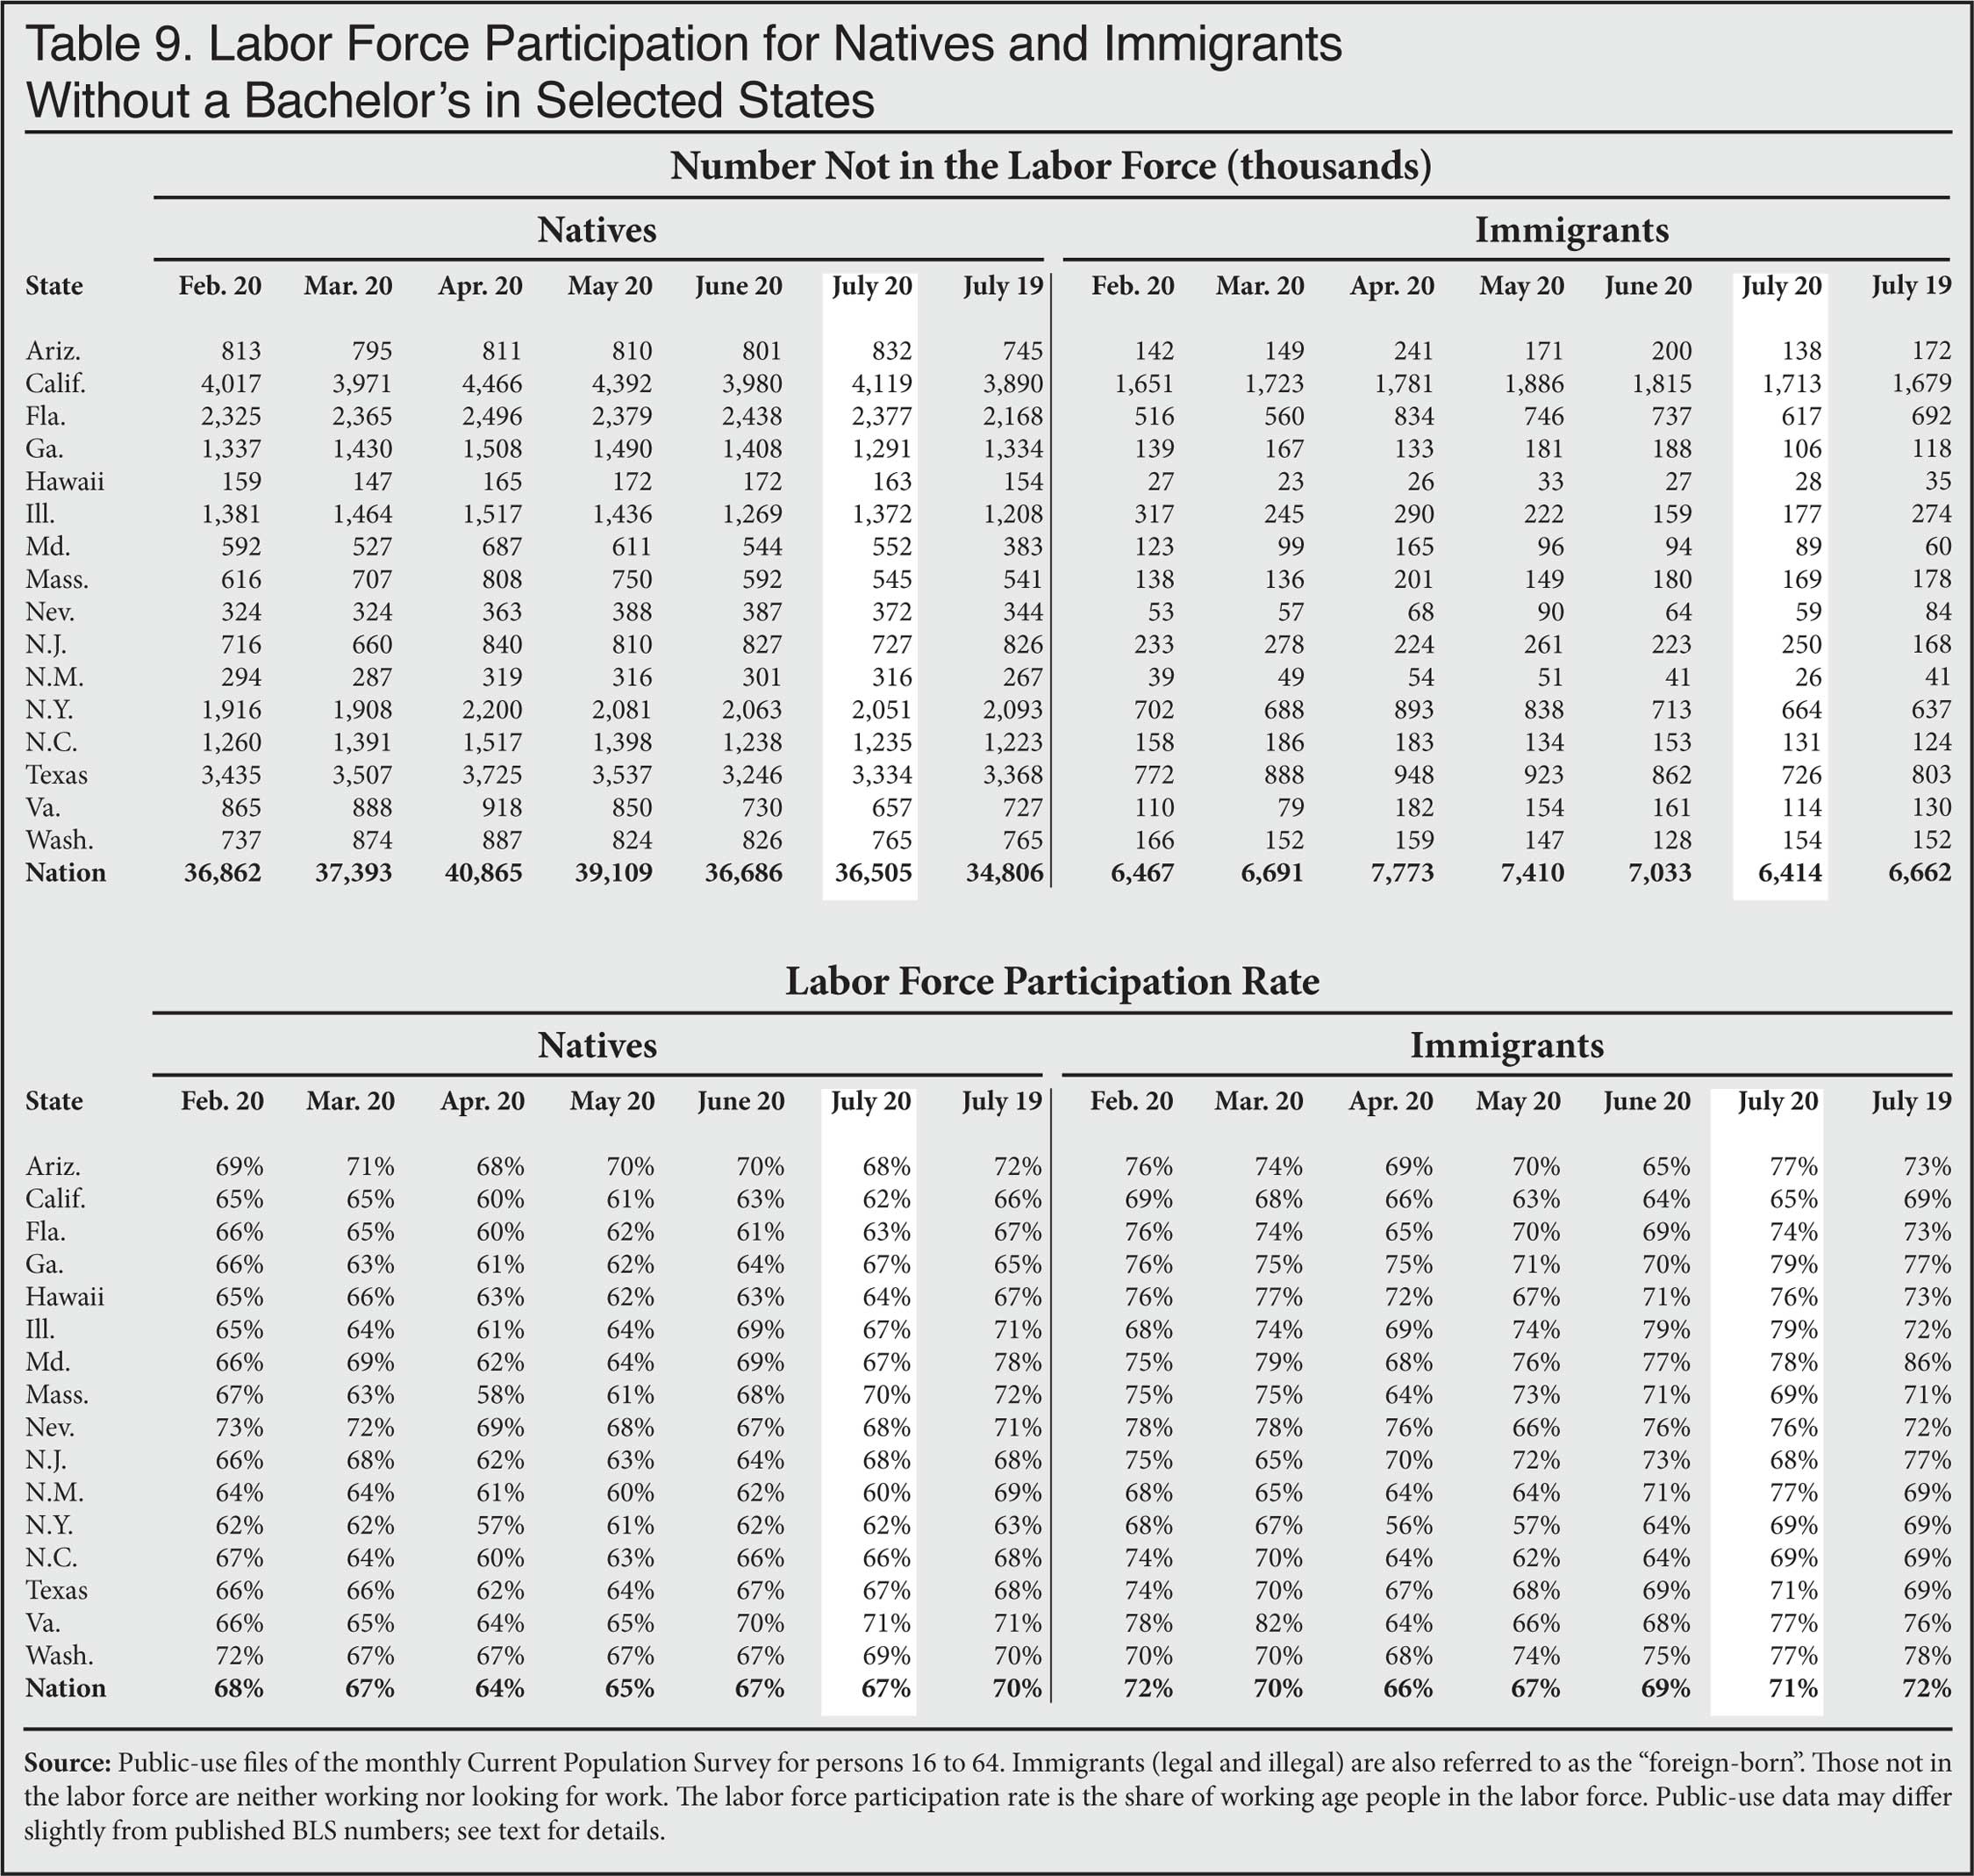
- The Covid-19 shutdown has exacerbated the long-term decline in the labor force participation rate (share working or looking for work) of the less-educated. In July 2020, only 67 percent of working-age (16-64) natives without a bachelor’s degree were in the labor force, down from 73 percent in July 2007 and 76 percent in July 2000. (Figure 5)
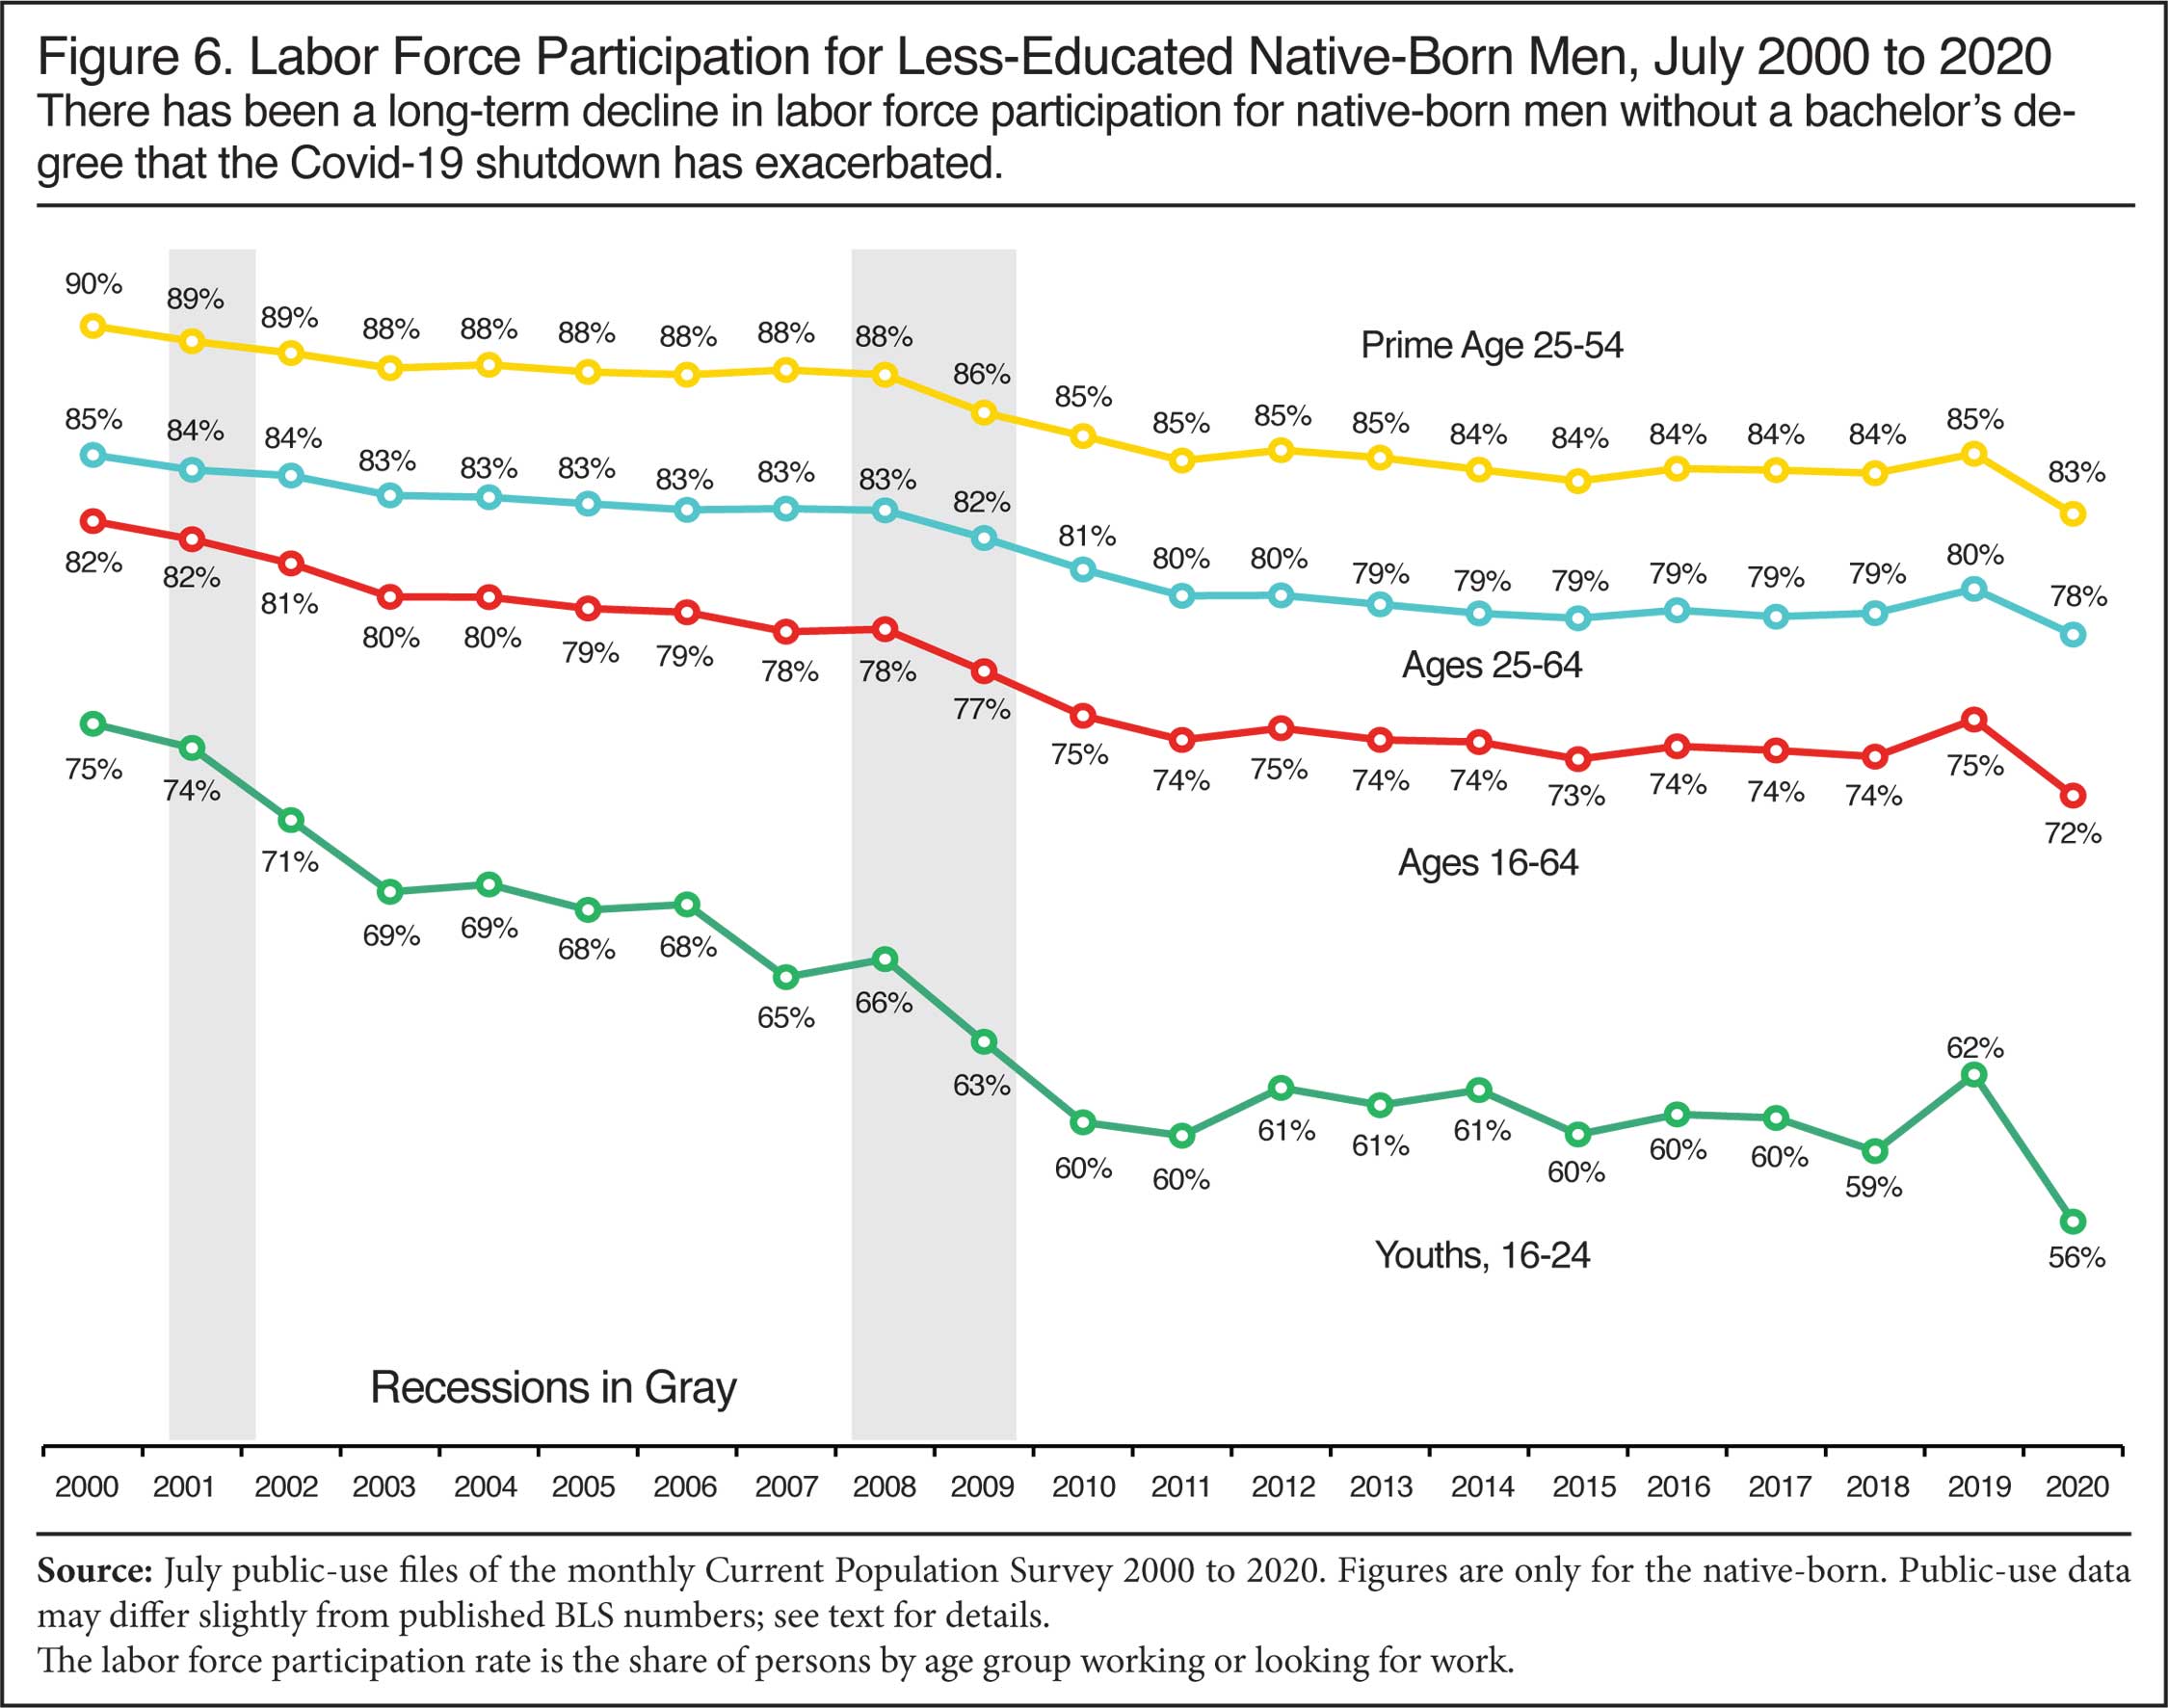
- Focusing only on men who are of prime working-age (25 to 54) still shows a long-term decline in labor force participation. The share of native-born men ages 25 to 54 without bachelor’s not in the labor force was 83 percent in July 2020, compared to 88 percent in July 2007 and 90 percent in July 2000. (Figure 6)
Data and Methods
This report uses the Current Population Survey (CPS) to examine the employment situation in the United States as of July 2020, with particular attention paid to differences between immigrants and natives. Based on a monthly survey of 60,000 households, the CPS is the nation's primary source for the unemployment rate and other labor force statistics. The sample is weighted to reflect the actual size and demographic makeup of the civilian non-institutionalized population. The raw data used in this analysis comes directly from the Census Bureau, which collects the data for the Bureau of Labor Statistics.1
Key Concepts and Terms. The labor force includes all workers, plus non-workers who have actively looked for work in the four weeks prior to the survey. The standard unemployment rate, referred to by the BLS as the U-3 rate, is calculated by dividing the number actively looking for work by the number in the labor force. The labor force participation rate is simply the share of people in the labor force.
Definition of Immigrant. The foreign-born in the CPS are all persons who were not U.S. citizens at birth. They include naturalized citizens, permanent residents (green card holders), temporary visitors, guestworkers, and illegal aliens. We use the term "immigrant" to encompass all of these foreign-born individuals. In Tables 1A, 1B, 2A, and 2B we report figures separately for non-citizens and naturalized citizens. Tables 4A, 4B, 5A, and 5B report figures for legal immigrants and illegal immigrants separately.
Identifying Illegal Immigrants. Prior research indicates that most illegal immigrants are included in Census data. To determine which respondents are most likely to be illegal aliens, CIS first excludes immigrant respondents who are almost certainly not illegal aliens — for example, spouses of native-born citizens; veterans; people who have government jobs; Cubans (because of special rules for that country); immigrants who arrived before 1980 (because the 1986 amnesty should have already covered them); people in certain occupations requiring licensing, screening, or a government background check (e.g., doctors, pharmacists, and law enforcement); and people likely to be on student visas.
The remaining candidates are weighted to replicate known characteristics of the illegal population (population size, age, gender, region or country of origin, state of residence, and length of residence in the United States). CIS has previously used the Department of Homeland Security (DHS) as the source of those known characteristics; however, DHS data were last published in 2015. For more recent data, we turn to 2018 estimates from the Center for Migration Studies (CMS), including their estimates of educational attainment.2 The resulting illegal population, which consists of a weighted set of CPS respondents, is designed to match CMS on the characteristics listed above. However, we do not adjust the number of illegal immigrants for undercount in the CPS.3 Estimates for legal immigrants are calculated simply by subtracting estimated counts of illegal immigrants from the total immigrant population.
All of our findings that separate immigrants by legal status should be considered rough approximations only. Because we do not have information about the illegal immigrant population in 2020, we are forced to take the known characteristics of illegal aliens from 2018 and apply them to the new labor market data in 2020. The primary weakness of this approach is that it assumes the illegal immigrant population still has the same demographic profile (population size, age, gender, etc.) as it did in 2018.
Matching Published BLS Tables. In this report, all statistics covering the entire population, such as the headline unemployment rate, match those published by the BLS. However, the counts and percentages for sub-populations will in some cases be slightly different. The reason is that the Census Bureau adds "perturbations" to the public-use microdata to protect respondent confidentiality. Fortunately, the Census Bureau states that any differences between published figures and those calculated from the public-use data will be so small that they "fall well within the sampling variability associated with CPS estimates".4 In other words, there should be no meaningful difference between statistics calculated from the pubic-use data and those published by the BLS.
Finally, the figures in this report are not seasonally adjusted. Unadjusted figures are conceptually simpler and easier for other researchers to replicate.5 Also, the limited number of statistics on the foreign-born published in the BLS monthly "Employment Situation" reports are also not seasonally adjusted.
Potential Problems with the Data. The BLS reports a potential problem with the CPS for March through July 2020.6 First, the response rates in all these months were significantly lower than prior to Covid 19, though rates did improve some in July compared to March through June. These lower rates increased the sampling error of the surveys for March through July. However, the Bureau stated in July that, "Although the response rate was adversely affected by pandemic-related issues, BLS was able to obtain estimates that met our standards for accuracy and reliability." Second, interviewers who administered the survey miscoded some respondents as employed when they were on furlough or temporary layoff or similar situations. They should have been considered temporarily laid off and coded as unemployed. The number unemployed and the unemployment rate would be higher in March through July if these individuals were counted as unemployed. However, BLS believes this number is smaller in July than in prior months. Neither the Census Bureau, which collects the data, nor the BLS has altered the data in response to these issues. Our analysis takes the raw CPS data as provided and our results match published non-seasonally adjusted figures, with the caveats about perturbations in public use data discussed above.
End Notes
1 "Basic Monthly CPS", U.S. Census Bureau, undated.
2 "State-Level Unauthorized Population and Eligible-to-Naturalize Estimates", Center for Migration Studies, undated.
3 In 2018, CMS estimated a total illegal immigrant population of 10.6 million, which includes an undercount adjustment for those missed in Census Bureau data. Our analysis of the CPS totals to 9.8 million illegal immigrants, reflecting a 7.5 percent undercount.
4 "Monthly Current Population Survey Public Use Microdata Files", U.S. Census Bureau, undated.
5 "Table A-7. Employment status of the civilian population by nativity and sex, not seasonally adjusted", U.S. Bureau of Labor Statistics, July 2, 2020.
6 For a brief discussion of the problems with the CPS beginning in March, see the section entitled, "Coronavirus (COVID-19) Impact on June 2020 Establishment and Household Survey Data" at the bottom of the June Employment Situation press release. For a more detailed look at the issues see the statement issued by BLS on the matter for July.