Download a PDF of this Backgrounder.
Steven A. Camarota is the director of research at the Center for Immigration Studies.
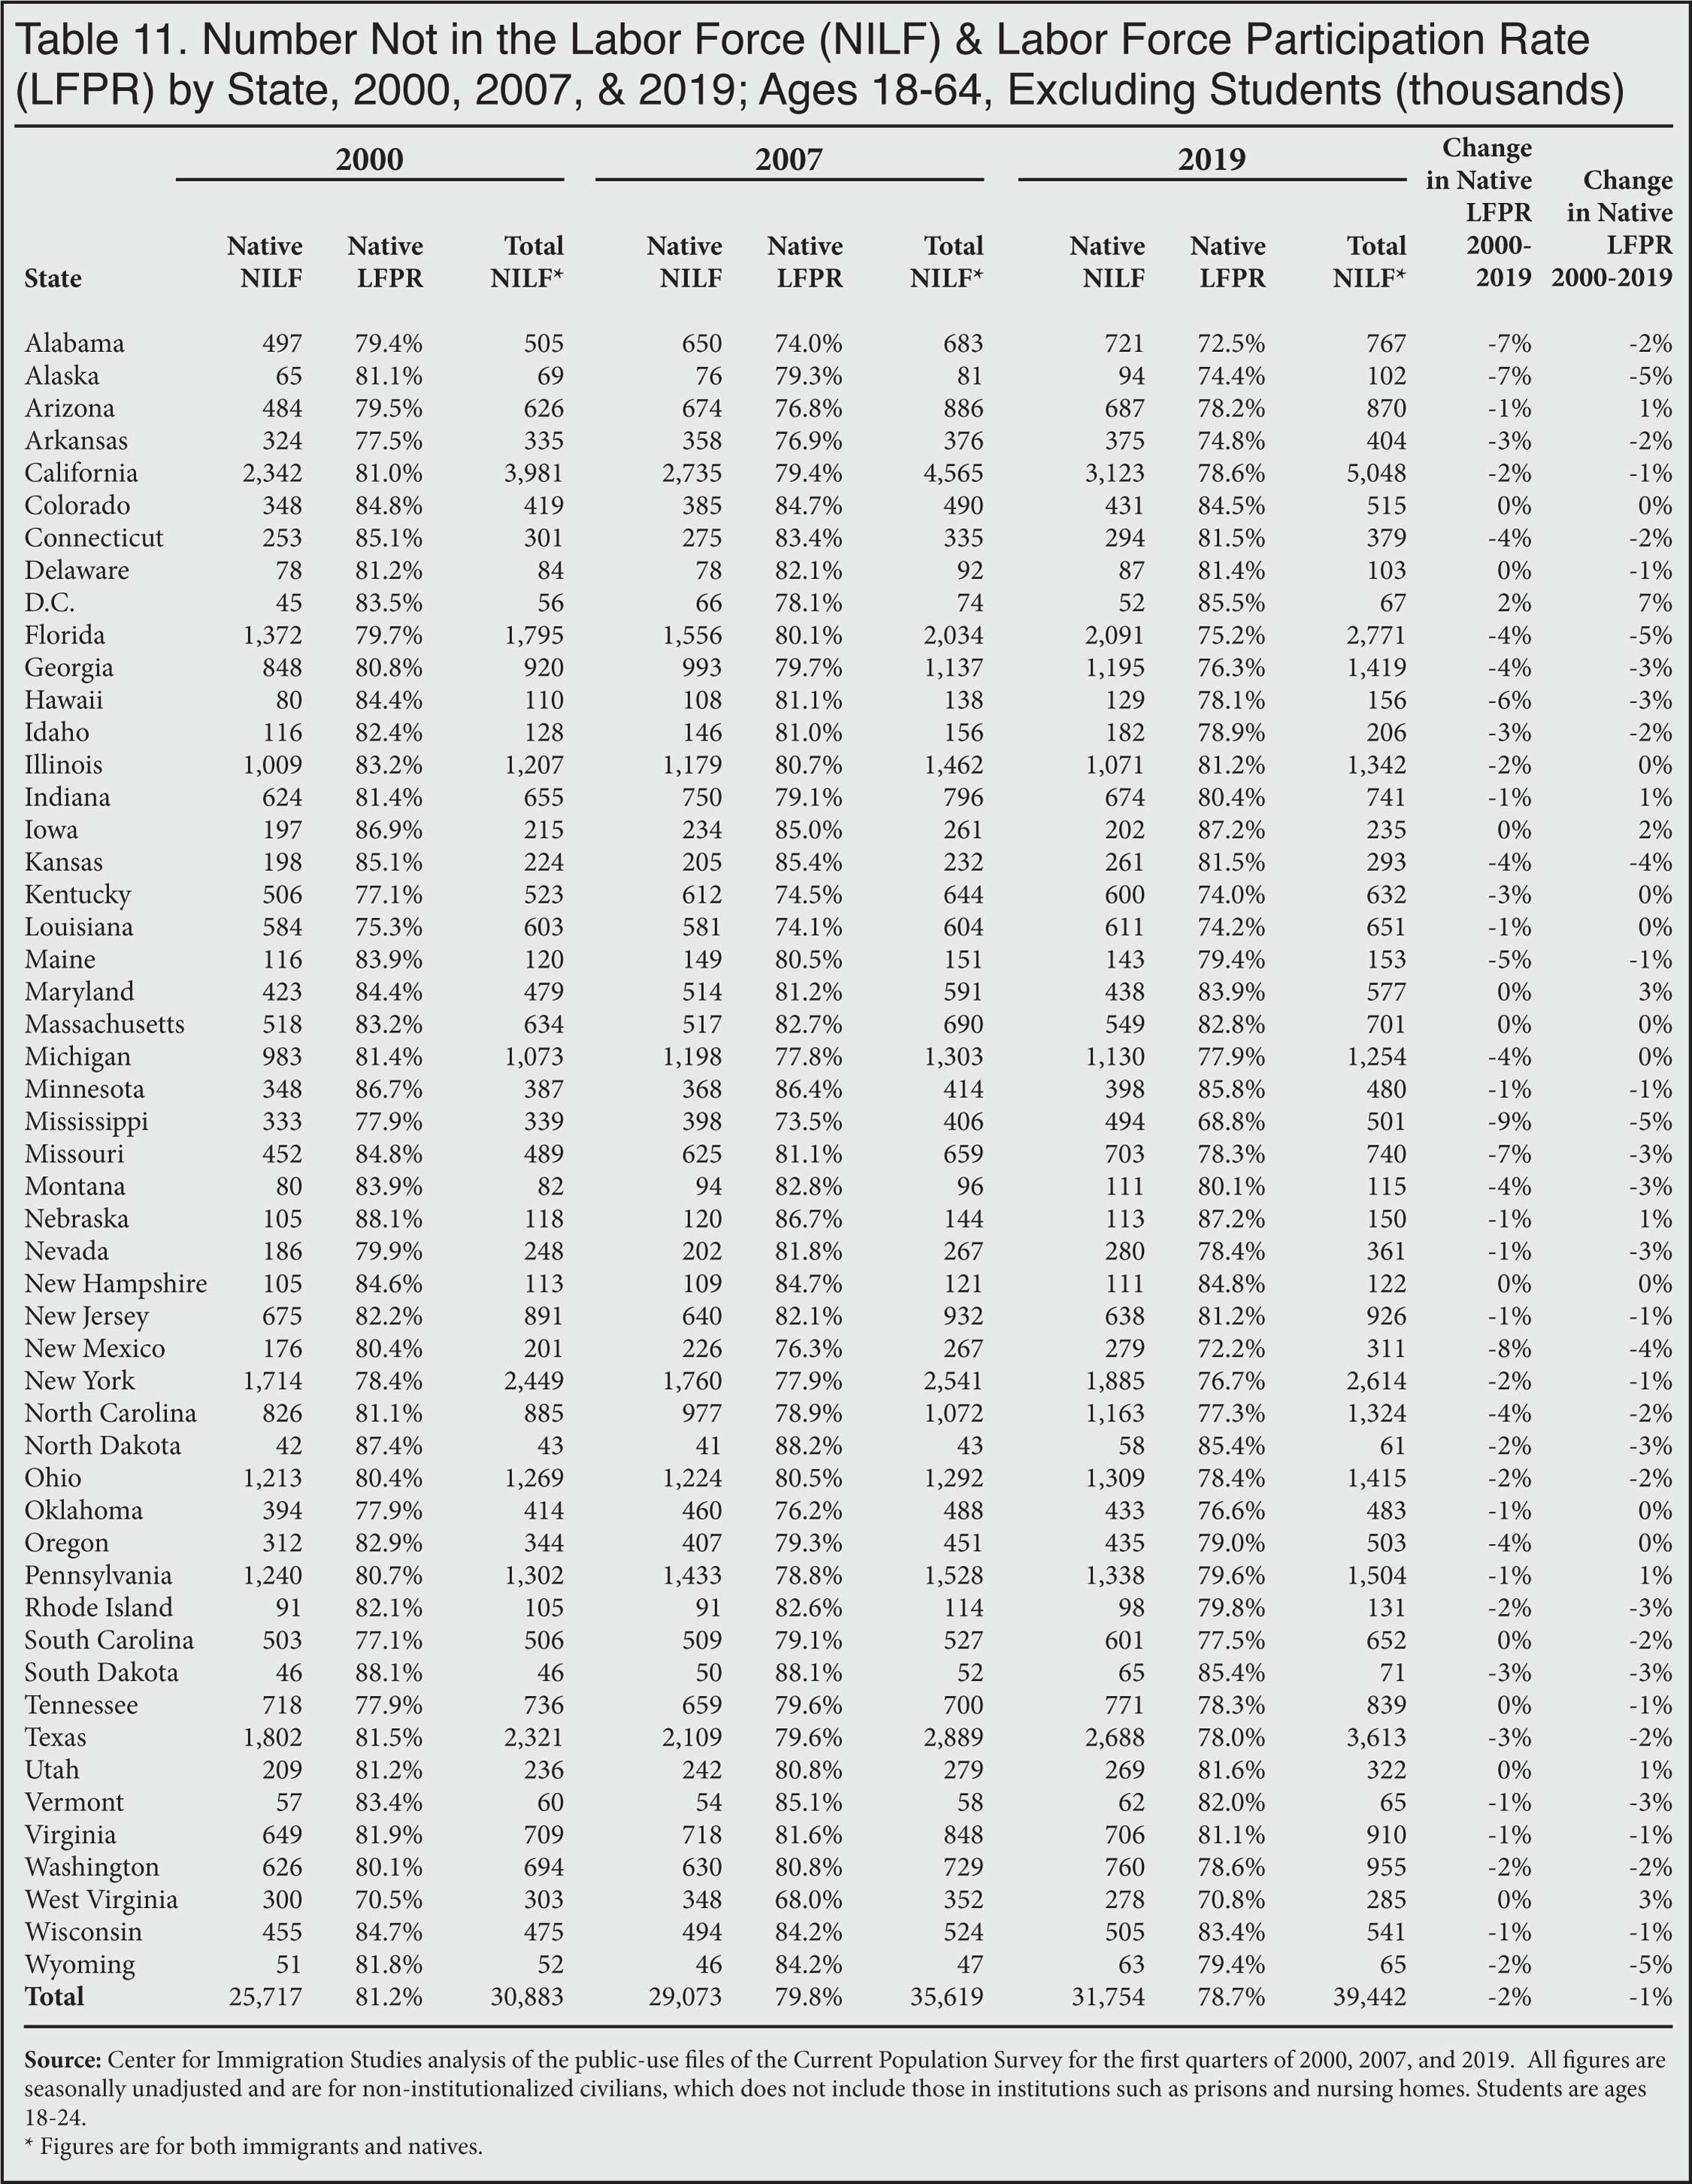
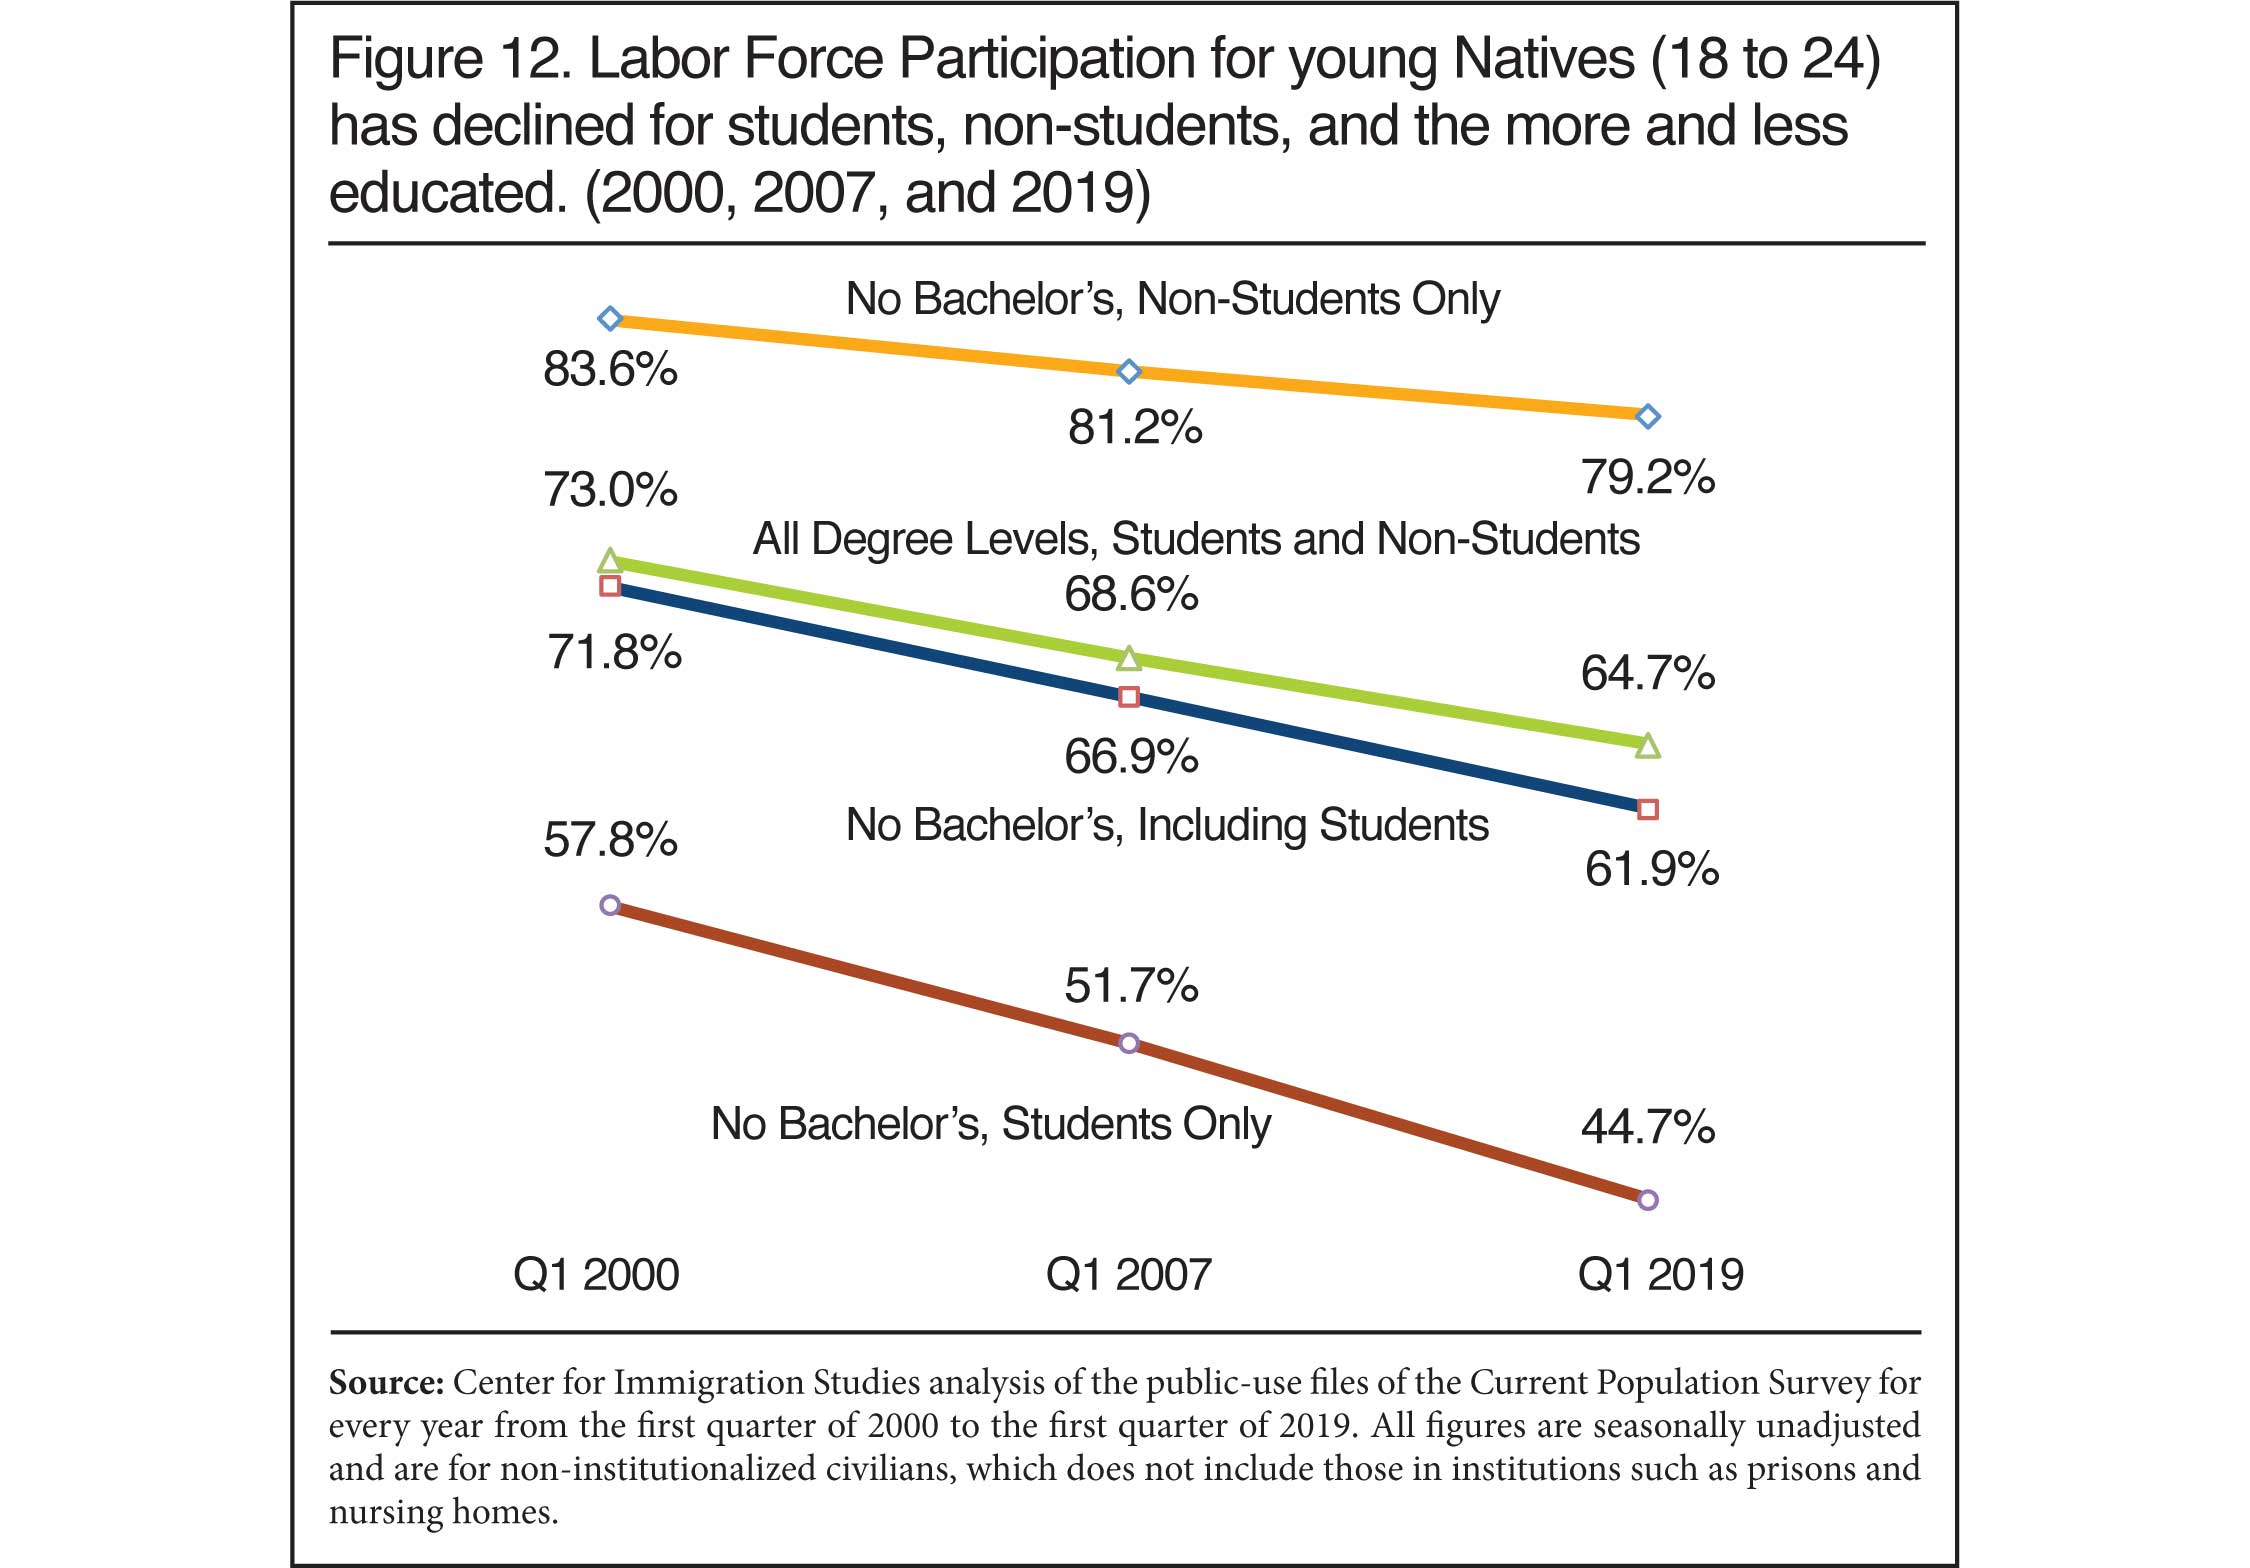
Analysis of Bureau of Labor Statistics data from the first quarter of 2019 shows that the labor force participation rate — those working or looking for work — of native-born Americans has not returned to pre-2007 recession levels. Things are particularly bad for natives without a bachelor's degree. In nearly every state, the labor force participation rate (share working or looking for work) of non-college educated natives (ages 18 to 64) has not returned to 2007 levels. Moreover, compared to 2000, in every state the labor force participation for non-college-educated natives was lower in 2019. It is true that the unemployment rate has improved in recent years, but the unemployment rate only includes those who have looked for a job in the four weeks prior to the survey.
Among Native-Born Americans:
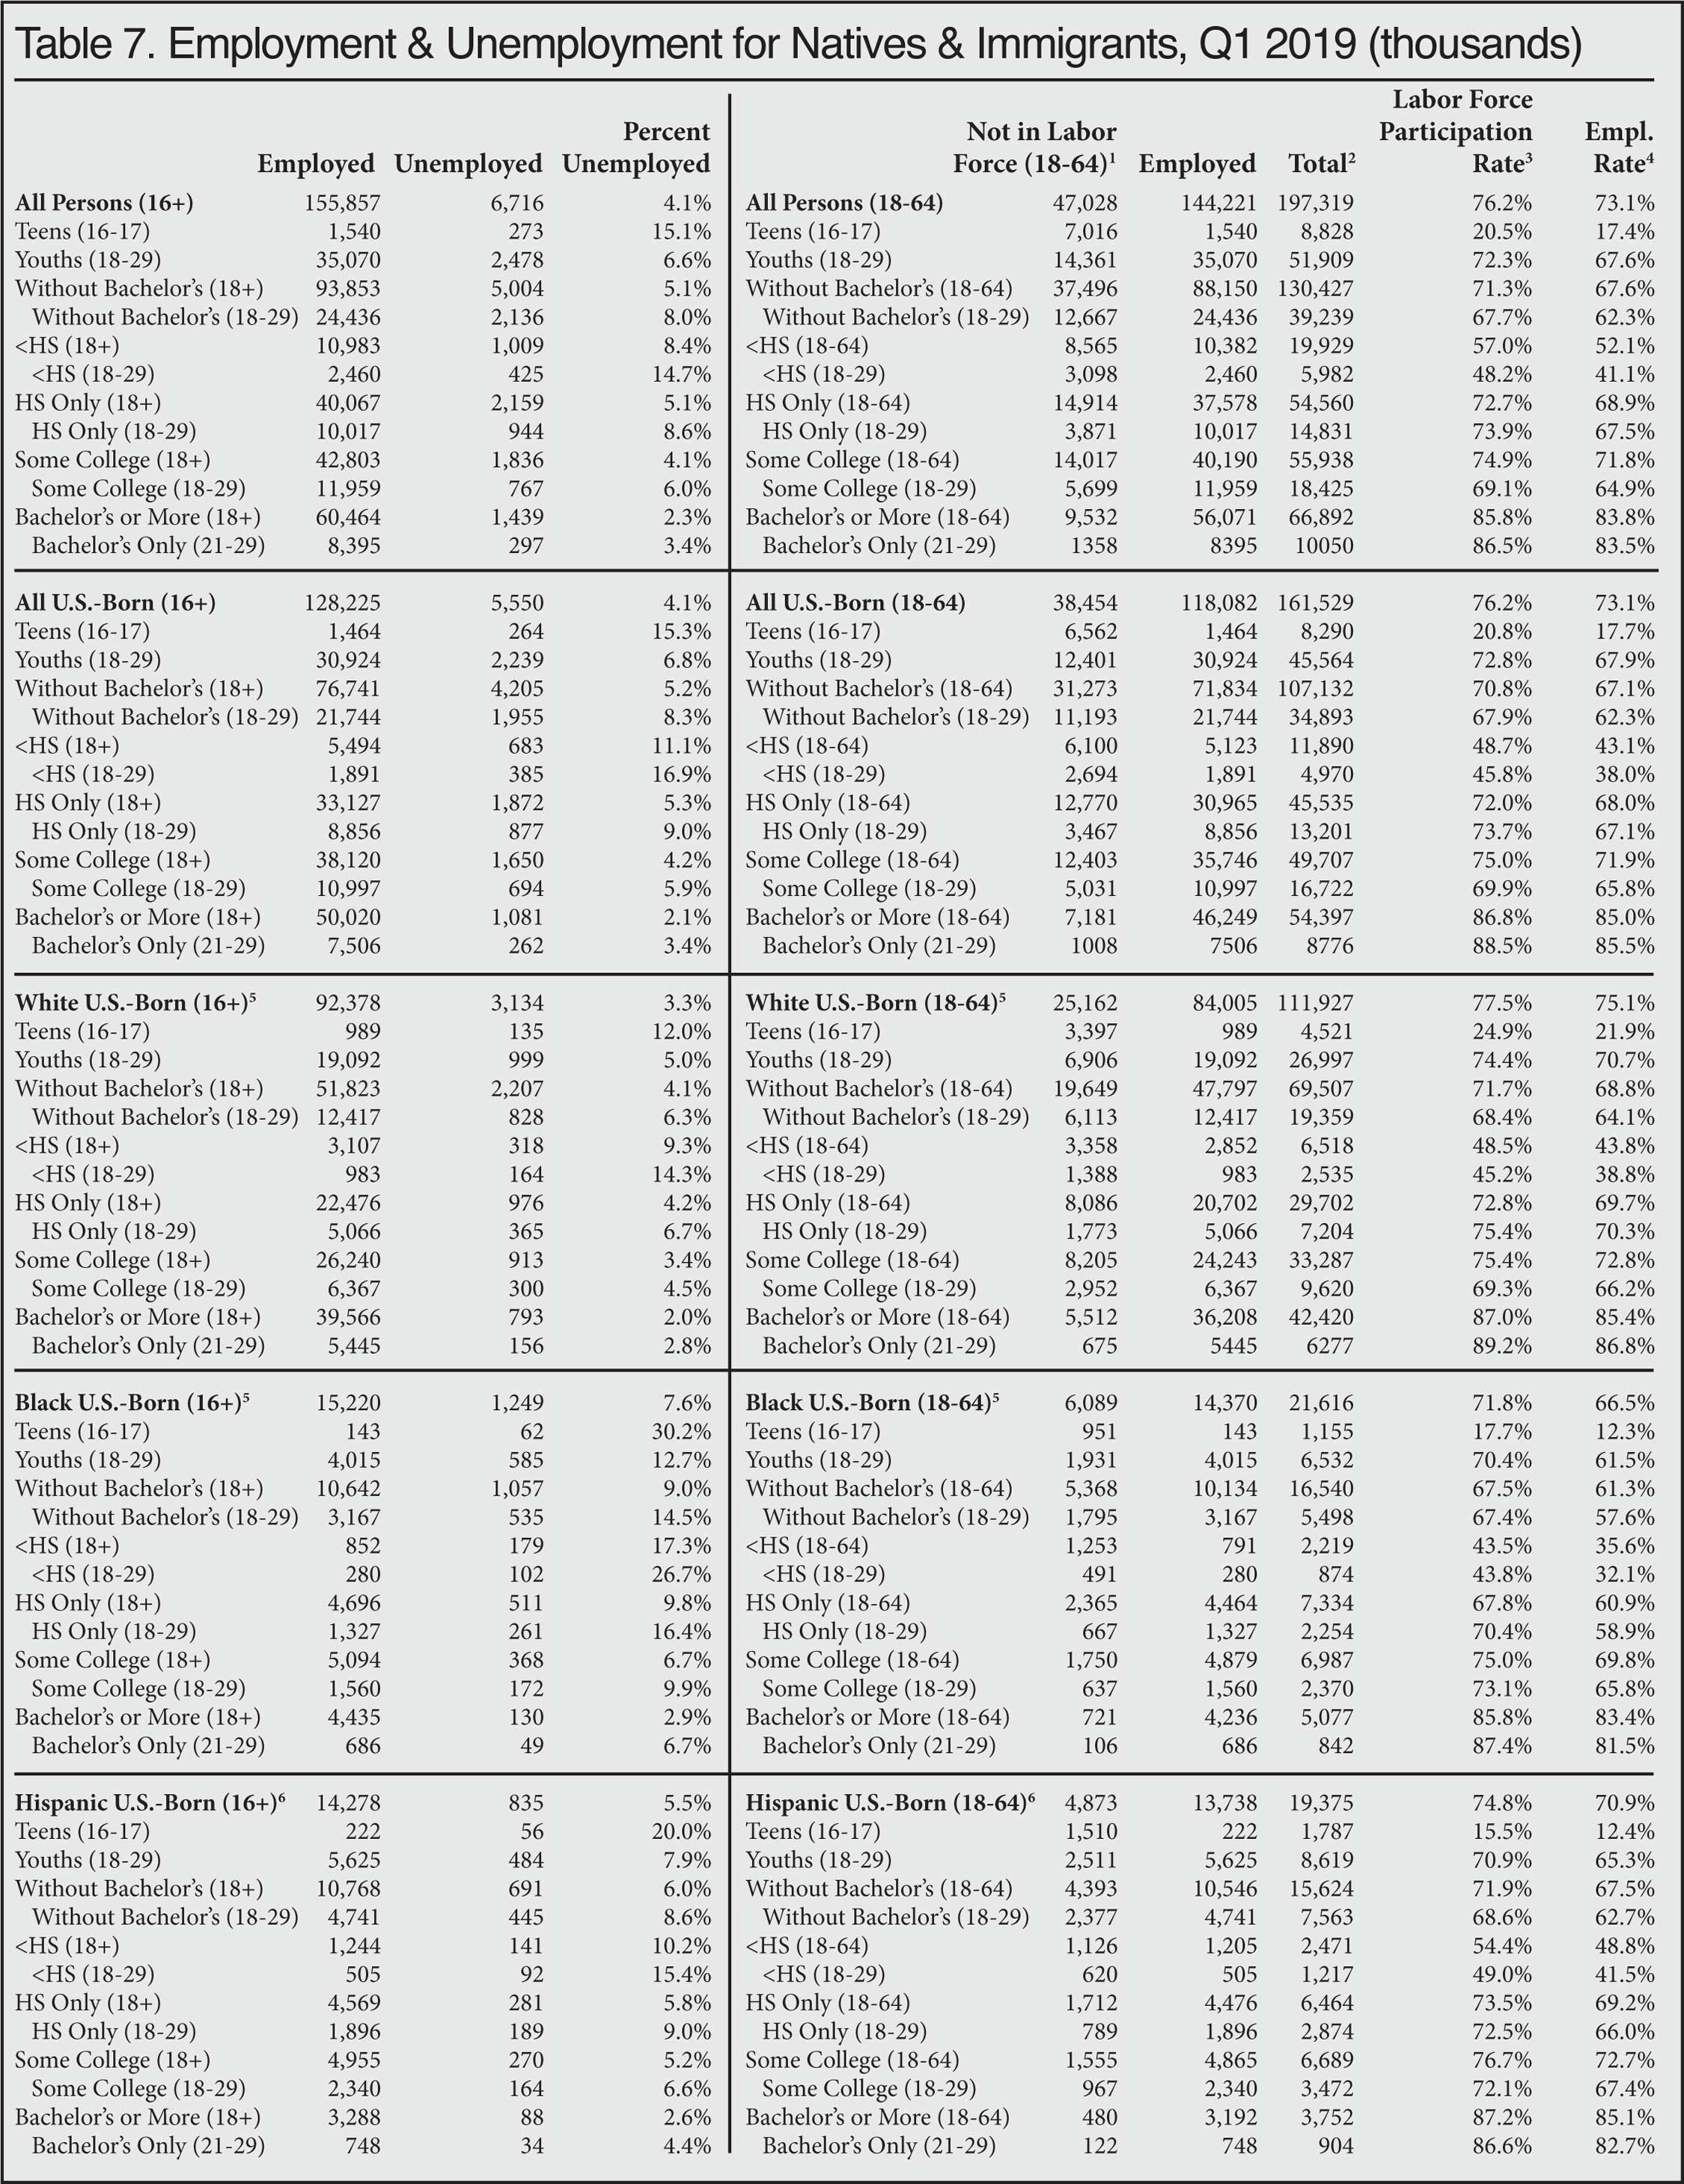
- The overall unemployment rate for natives in the first quarter of 2019 was 4.1 percent, much lower than at the peak of the Great Recession. However, the overall unemployment rate obscures the low labor force participation rate, especially among those without a bachelor's degree.
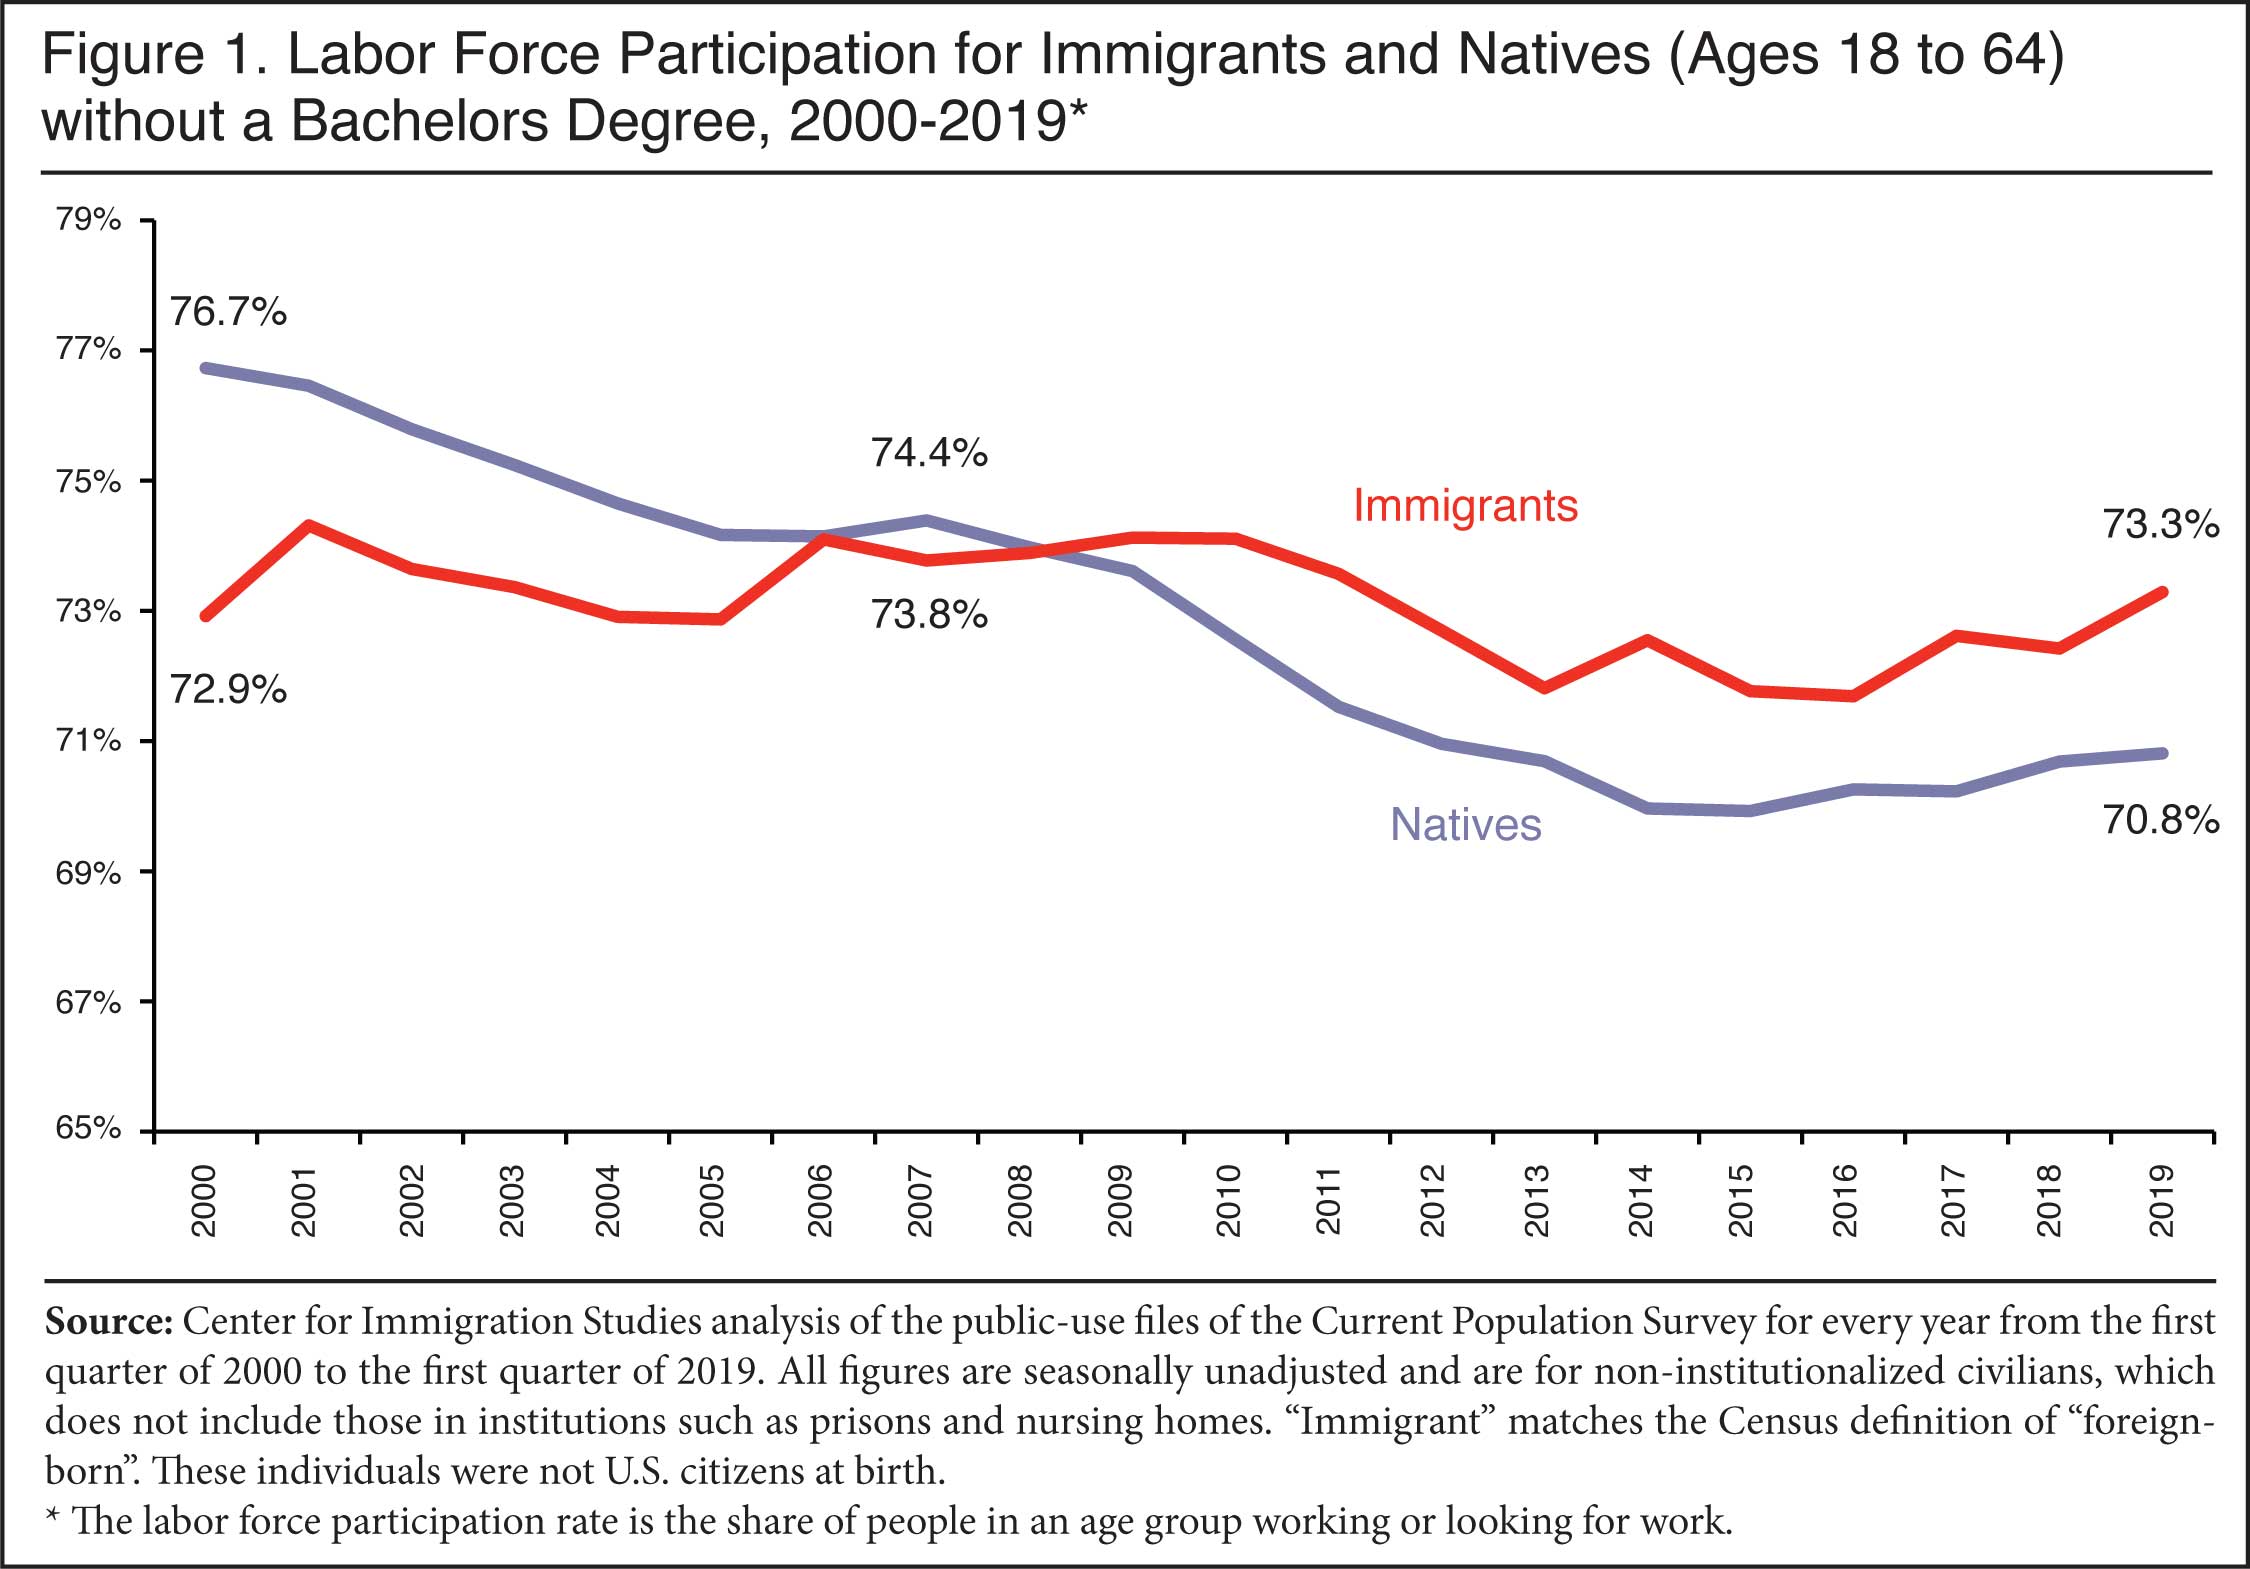
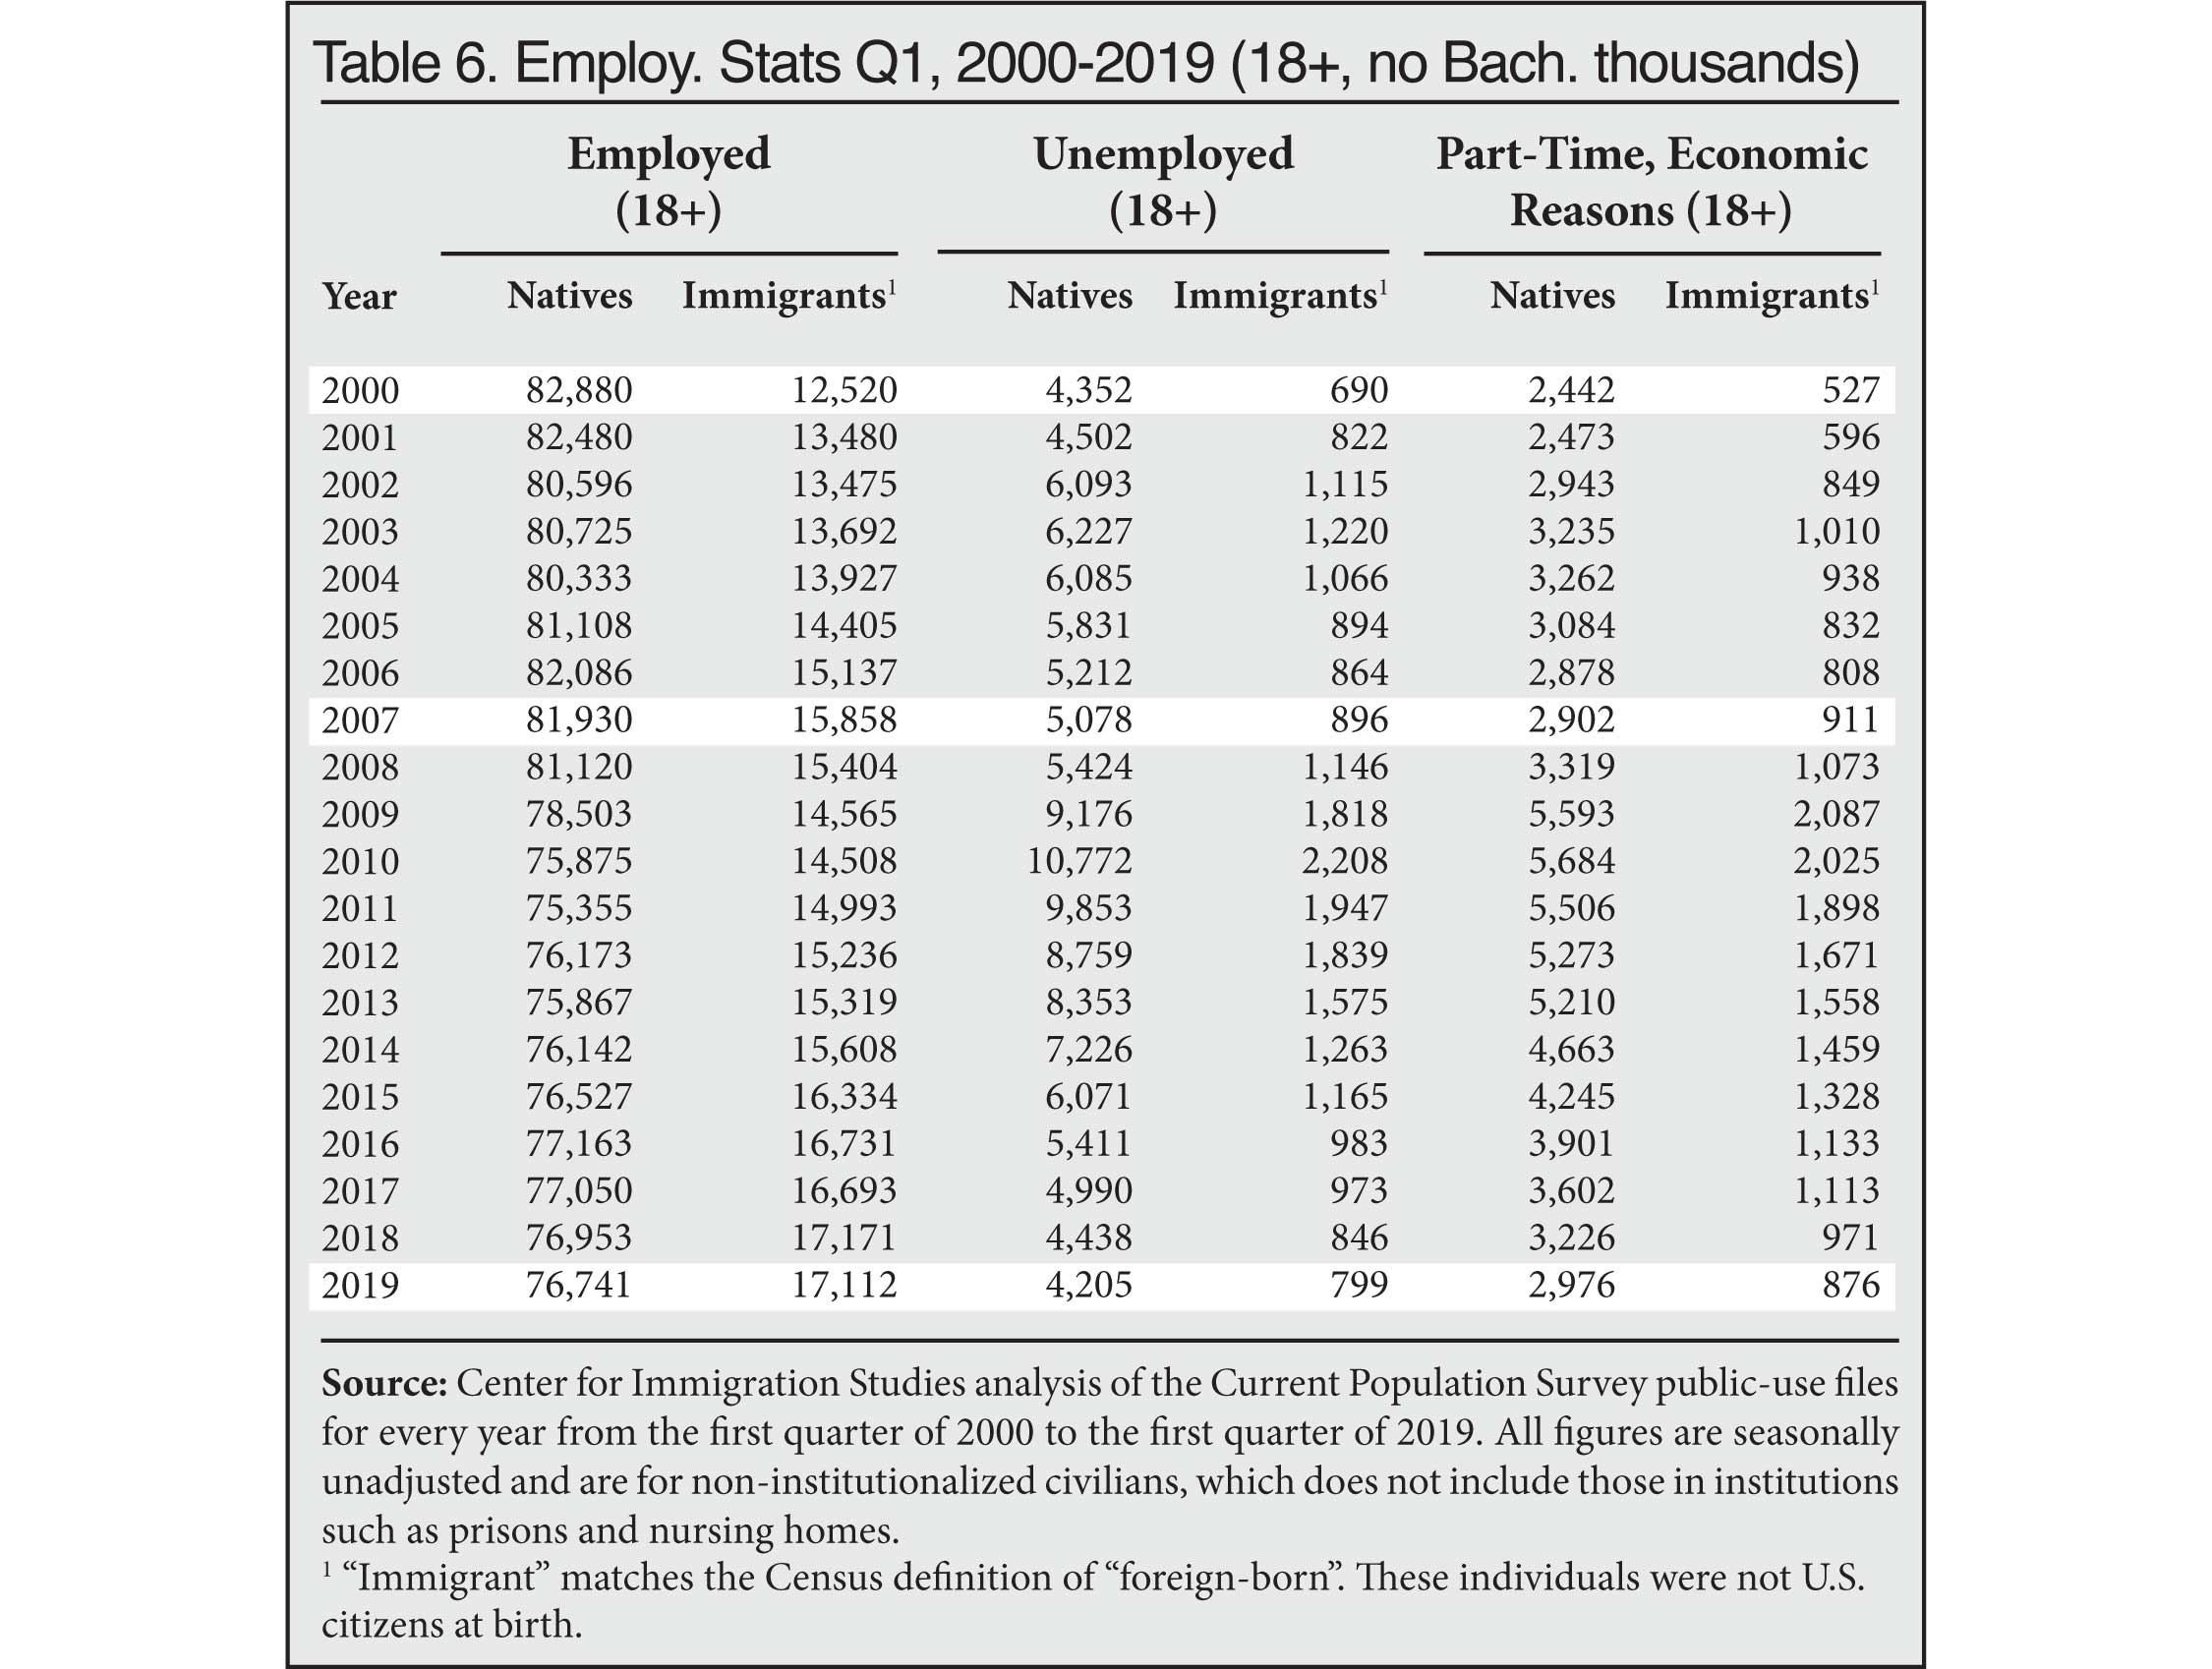
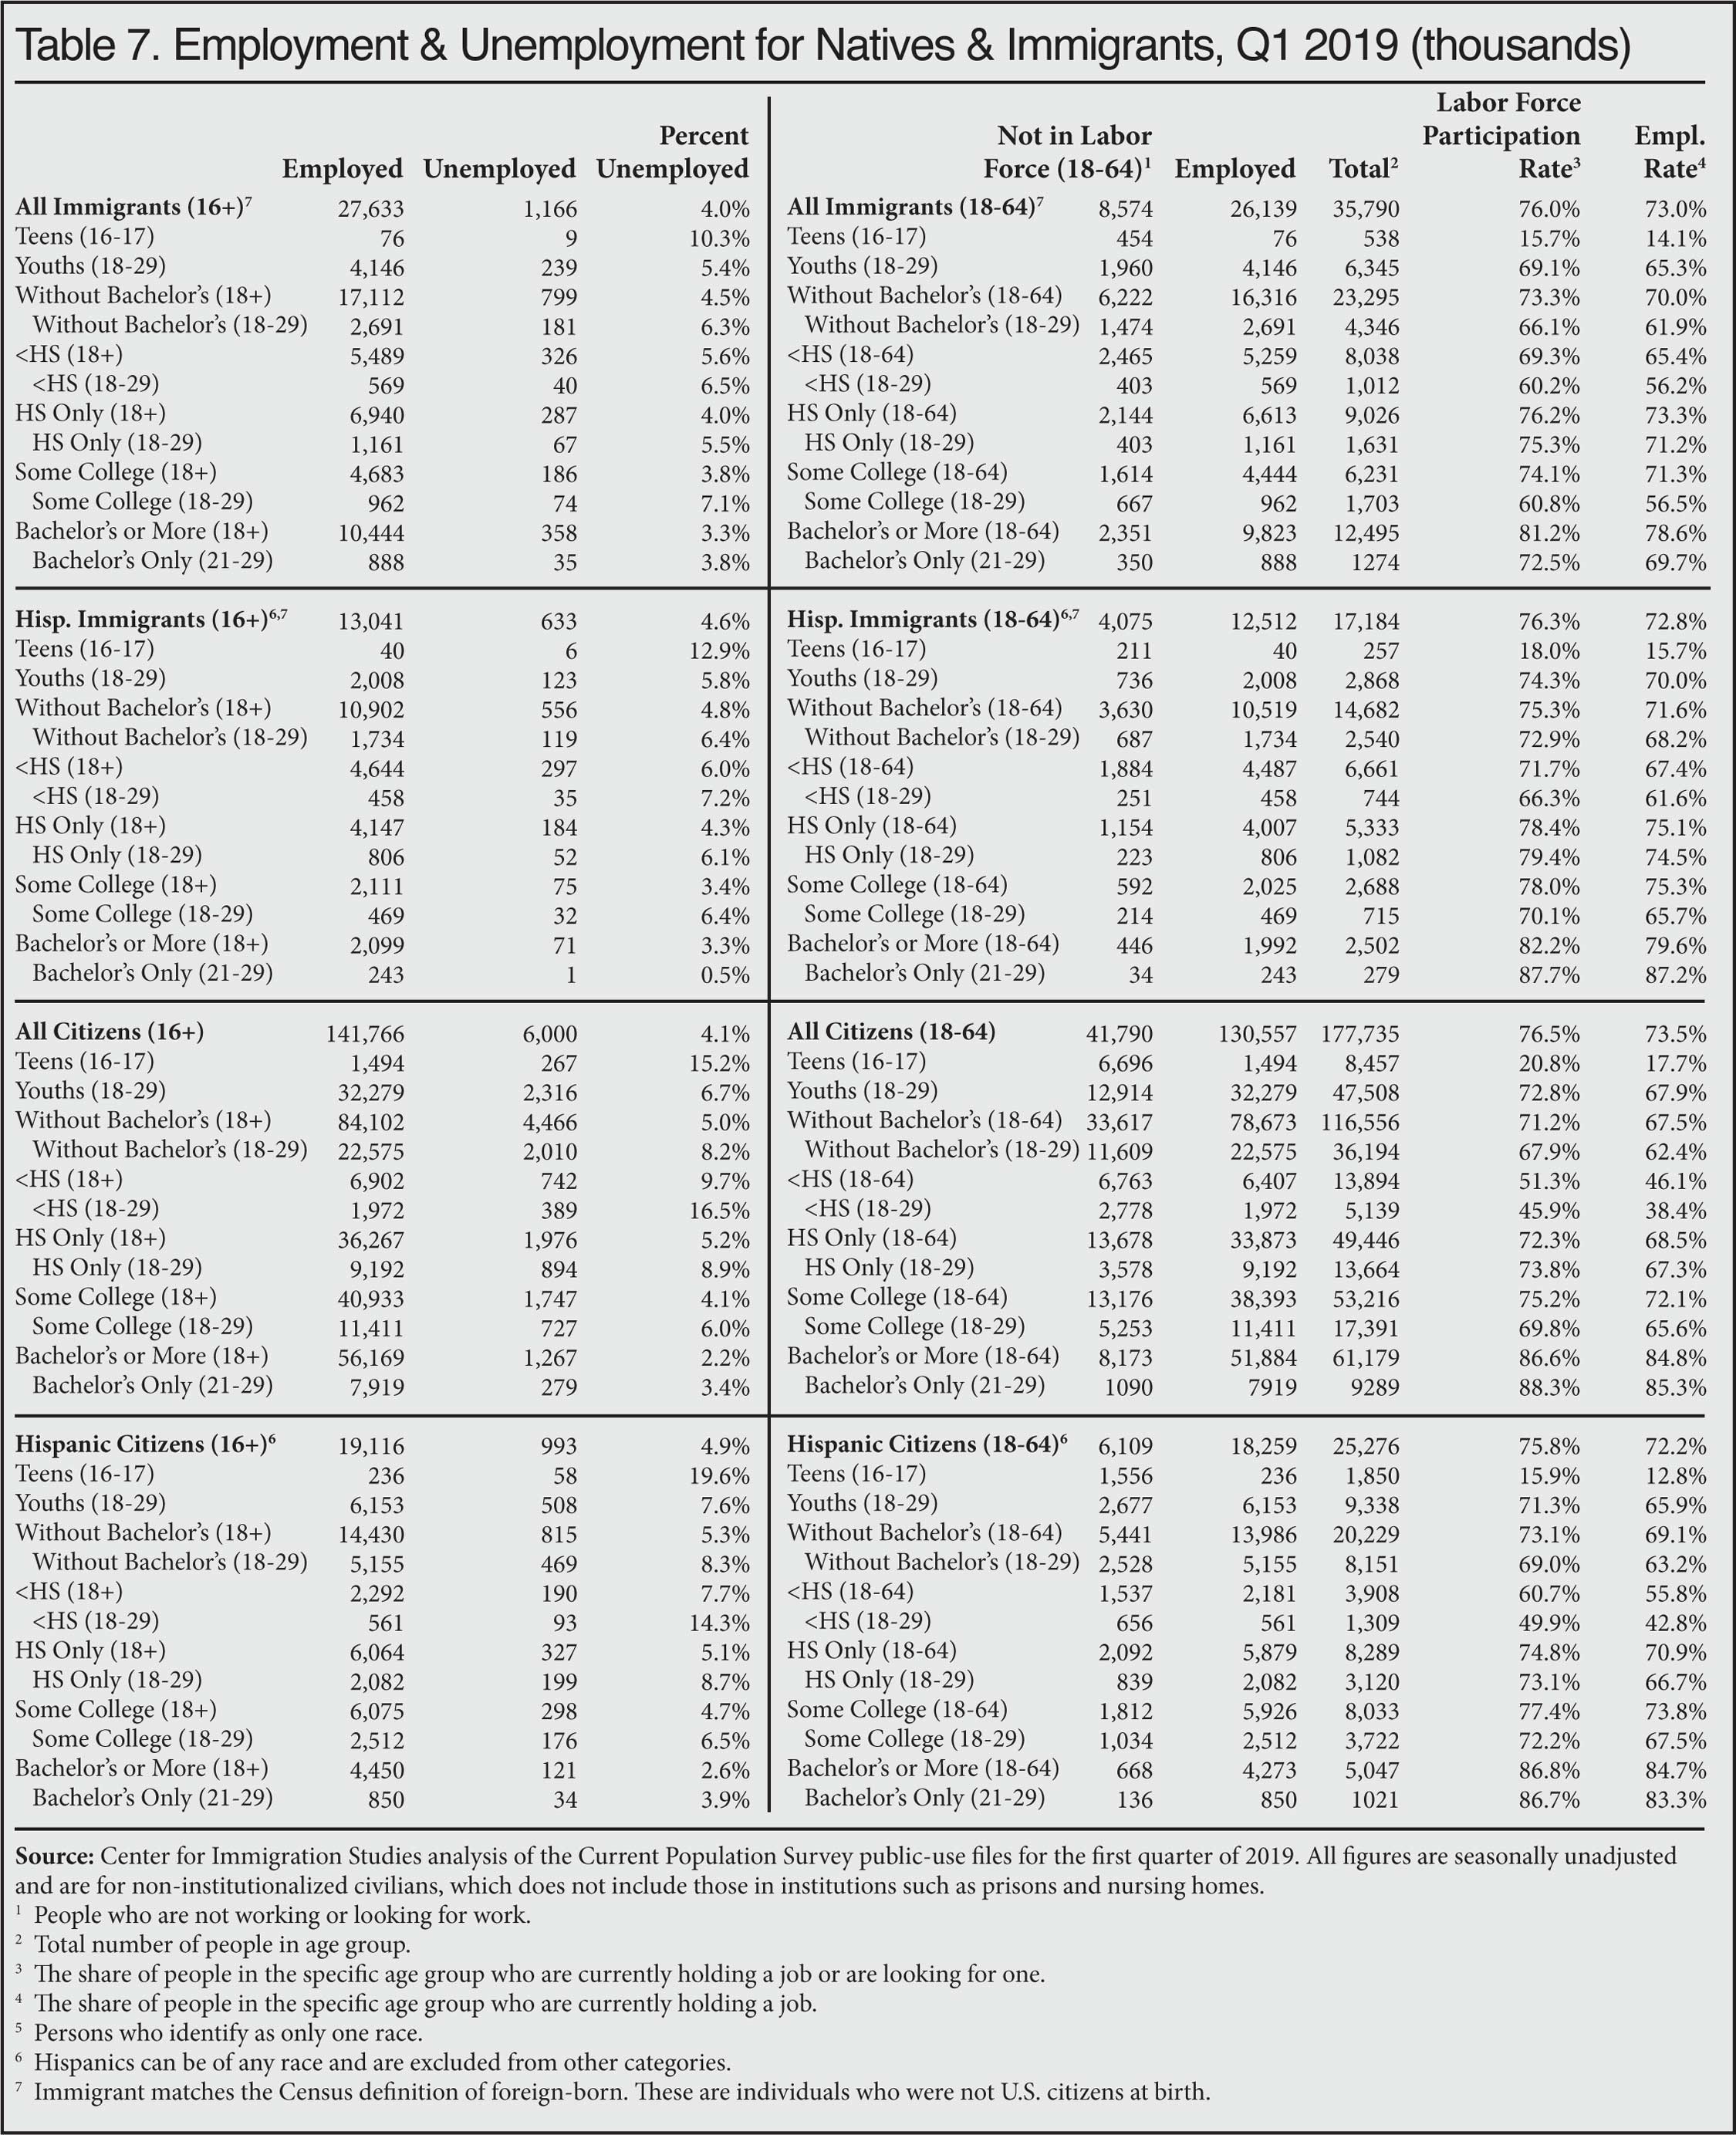
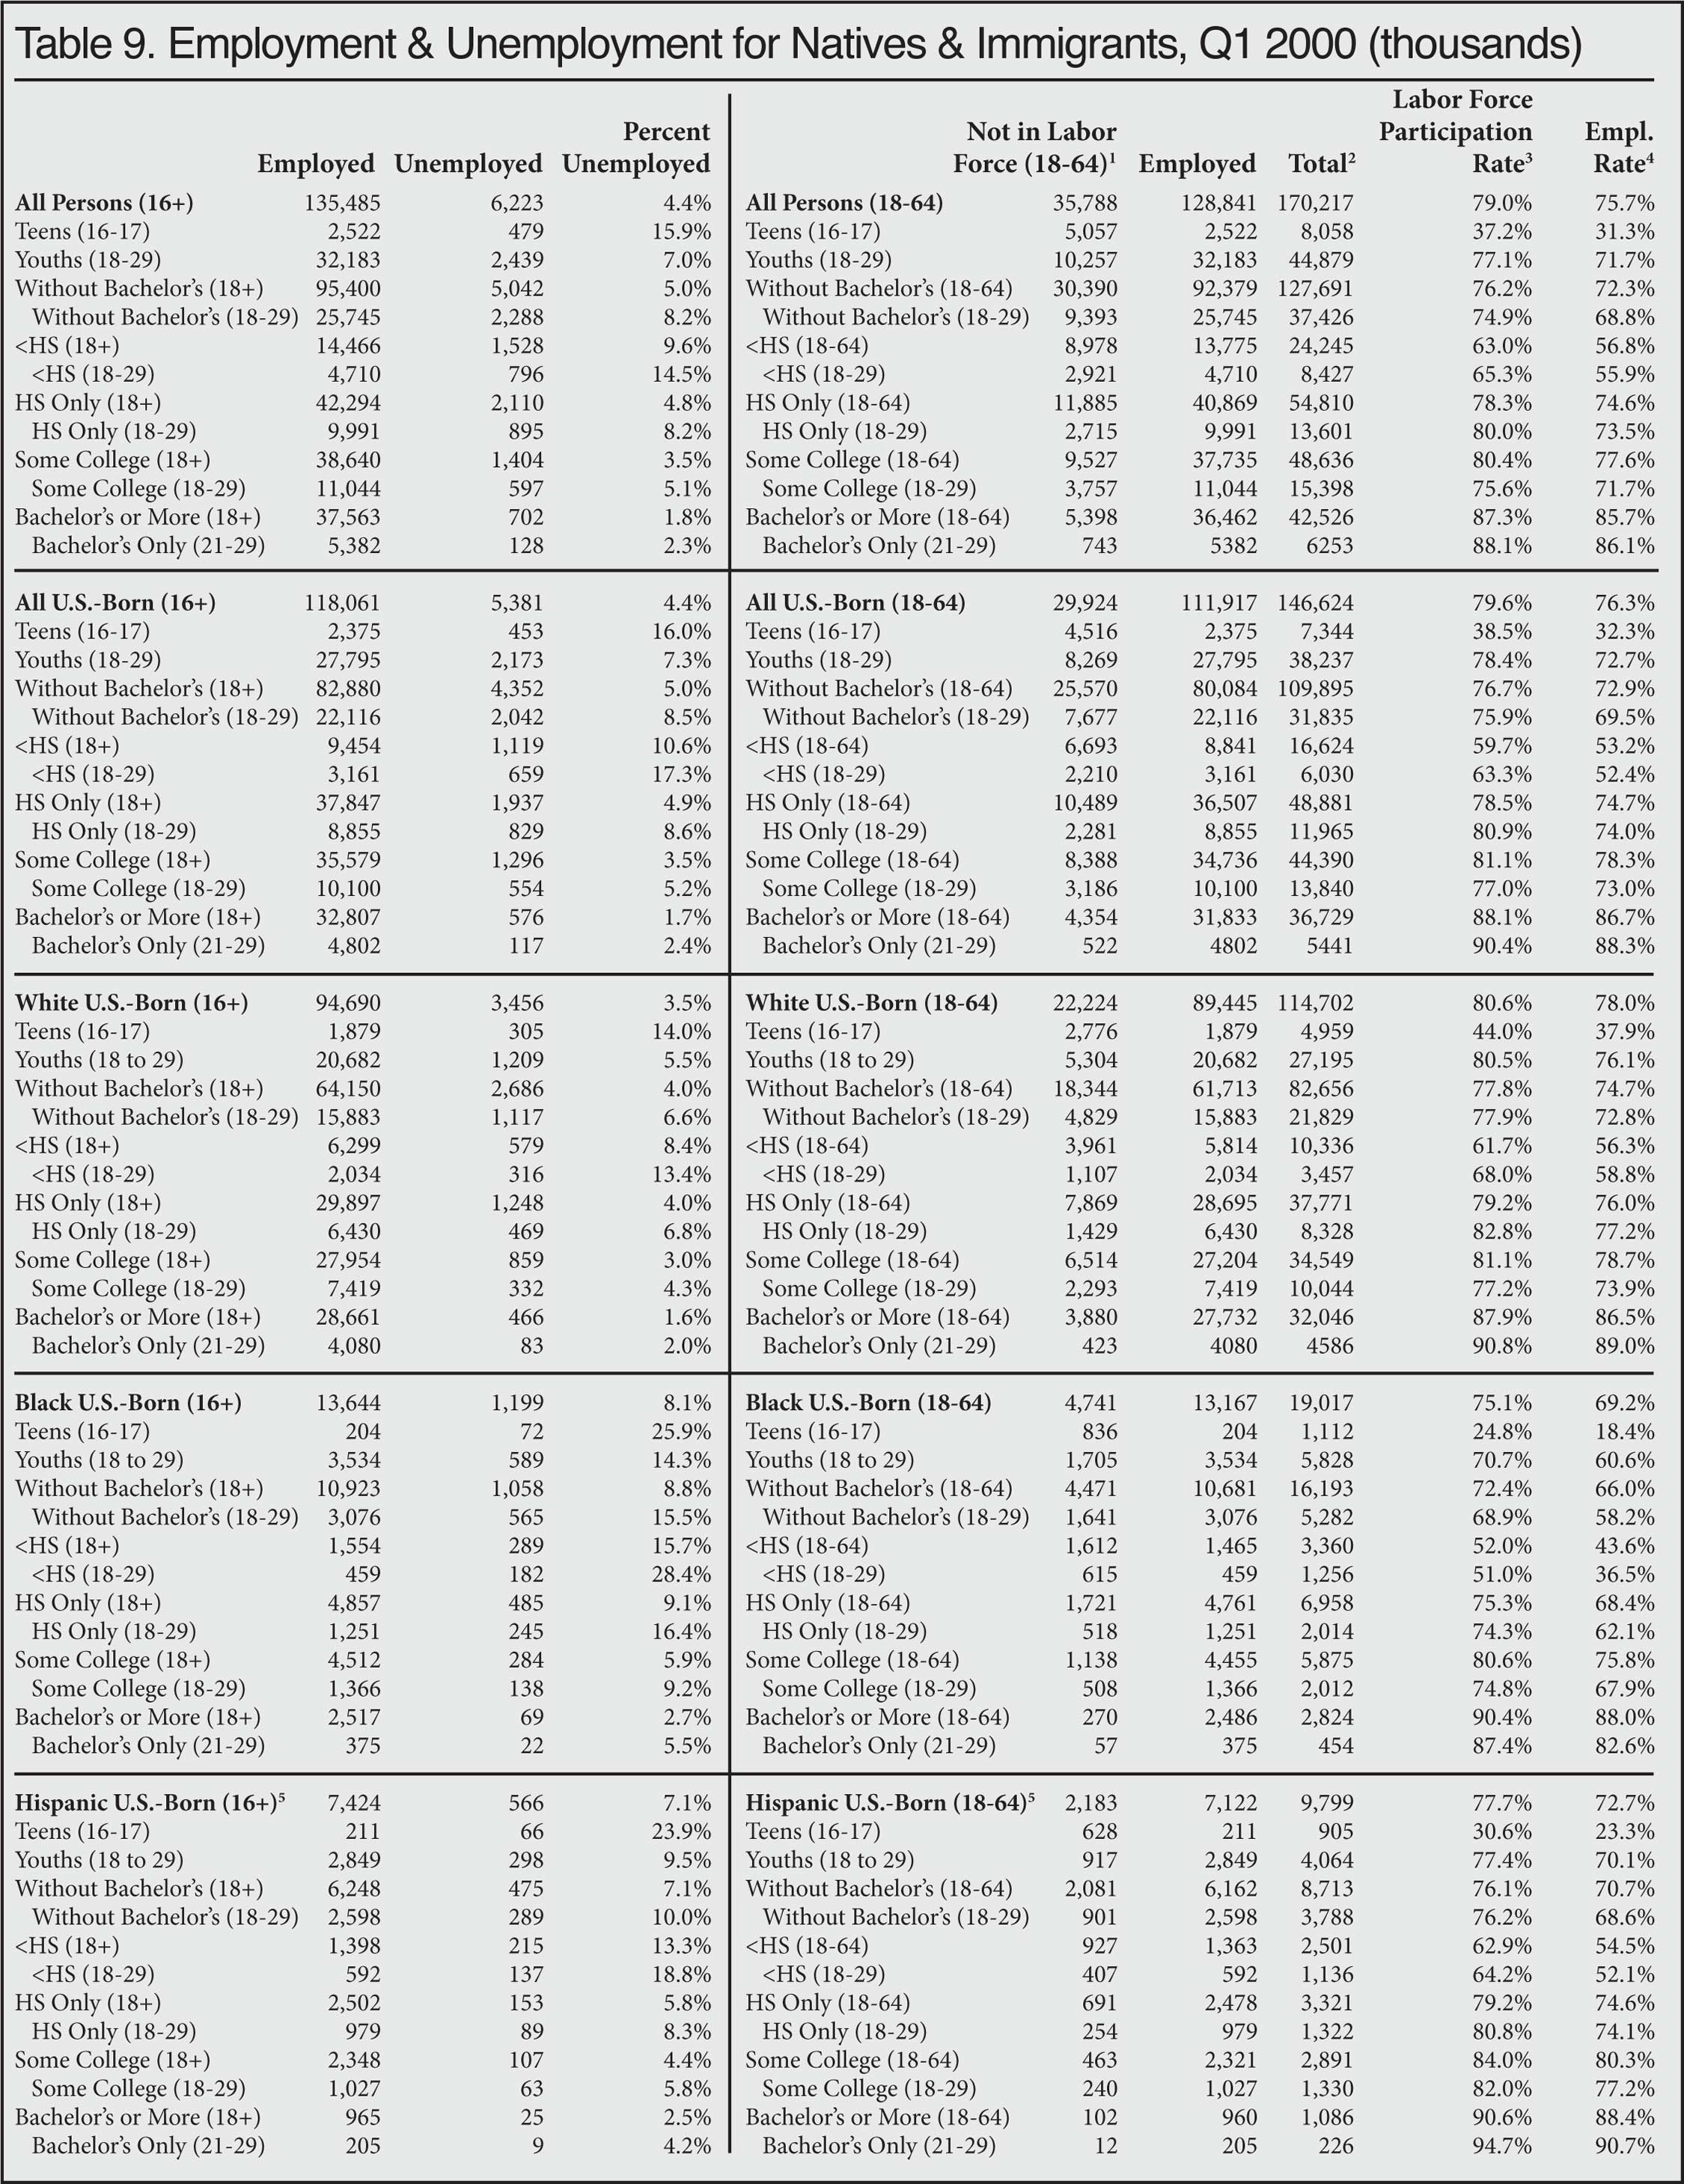
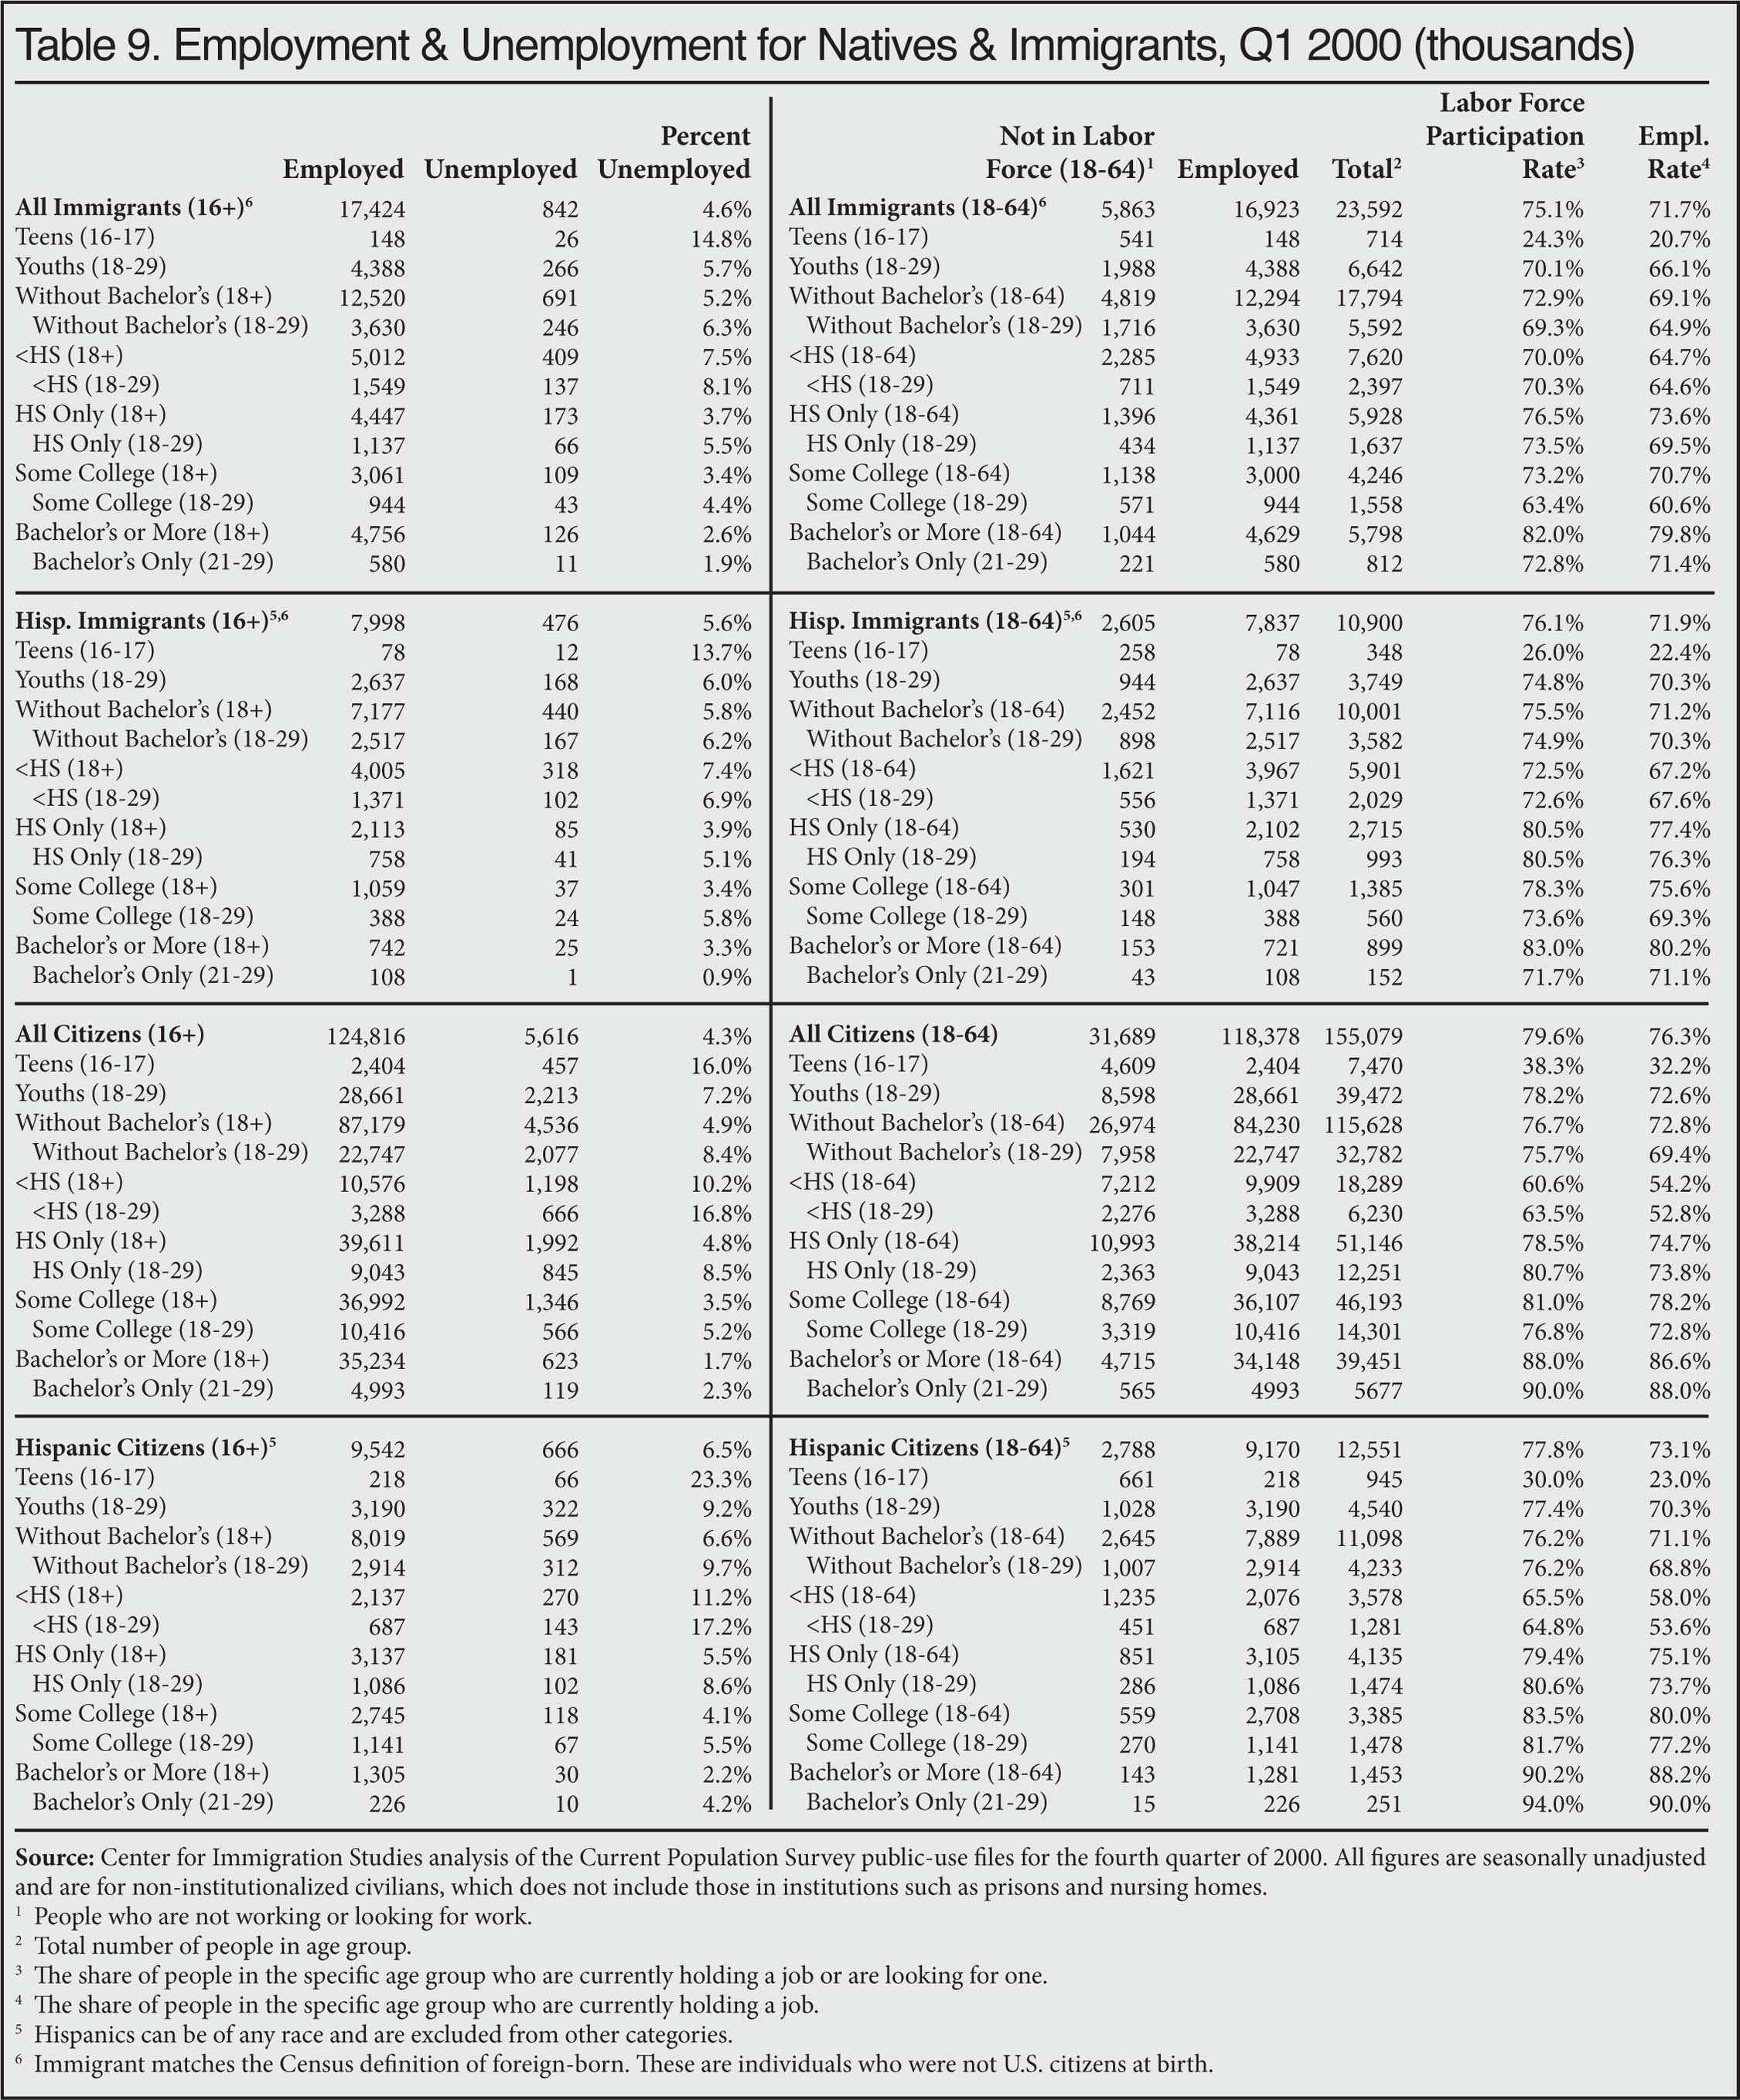
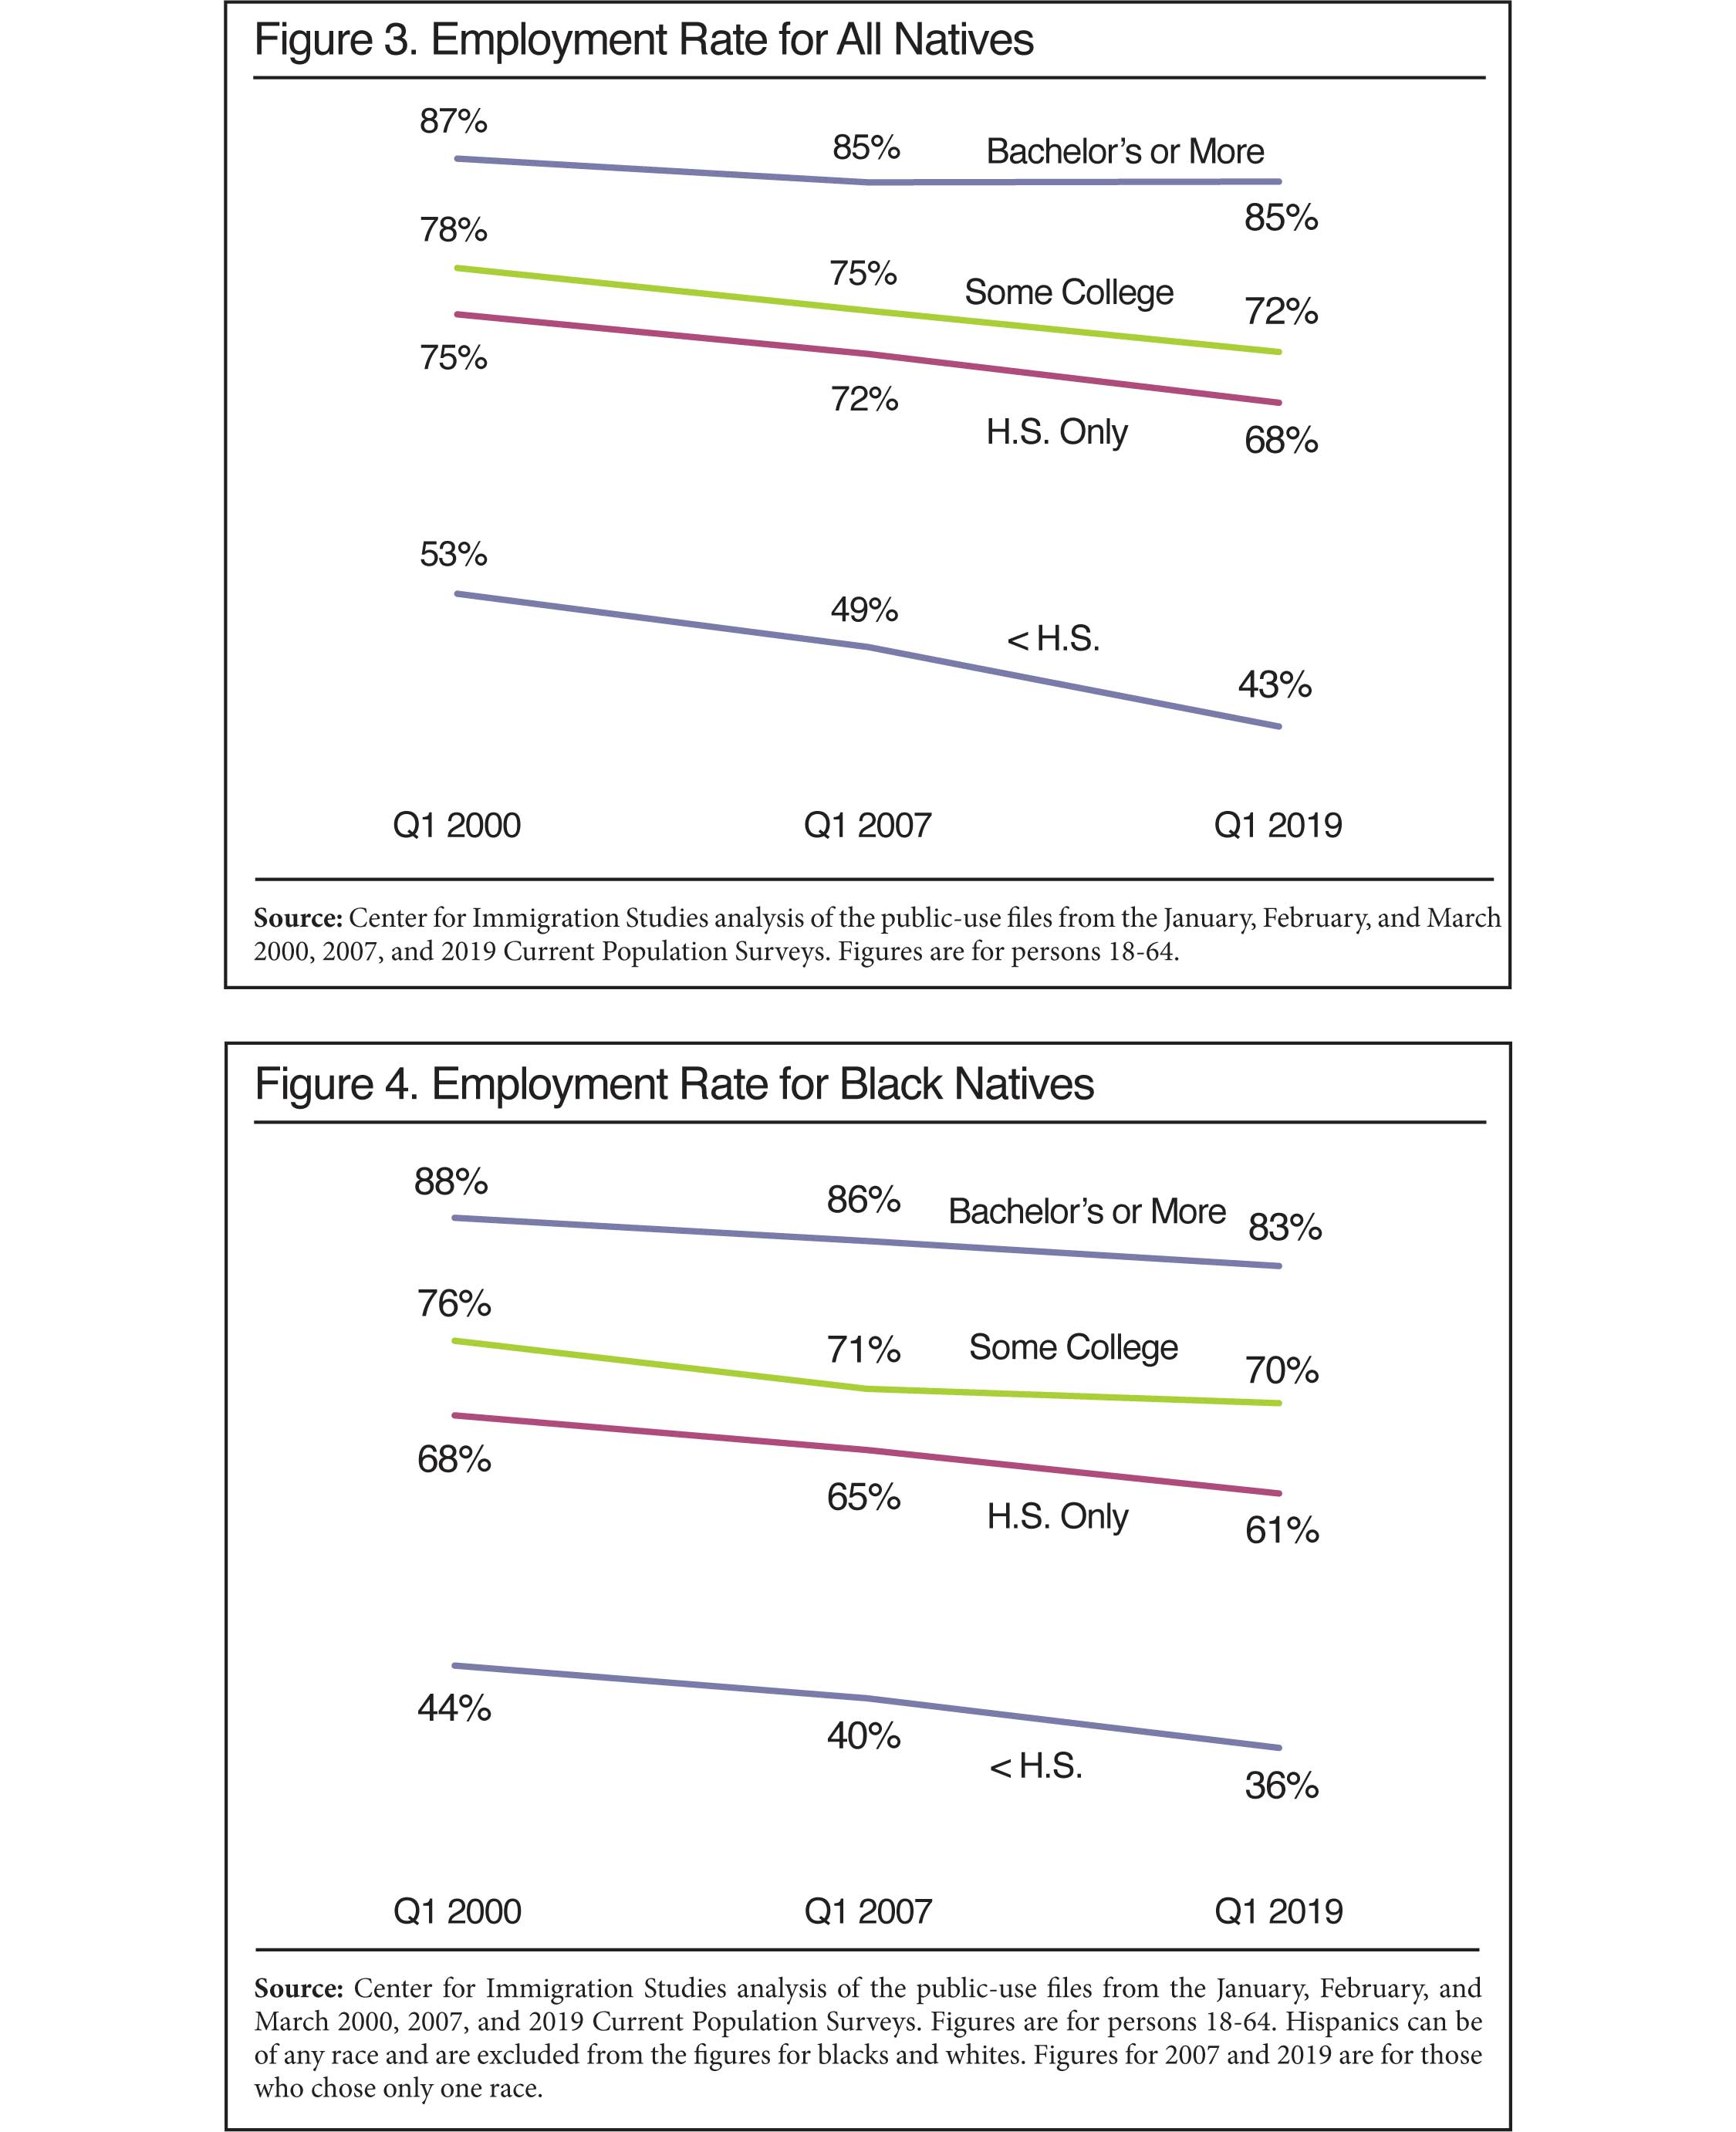
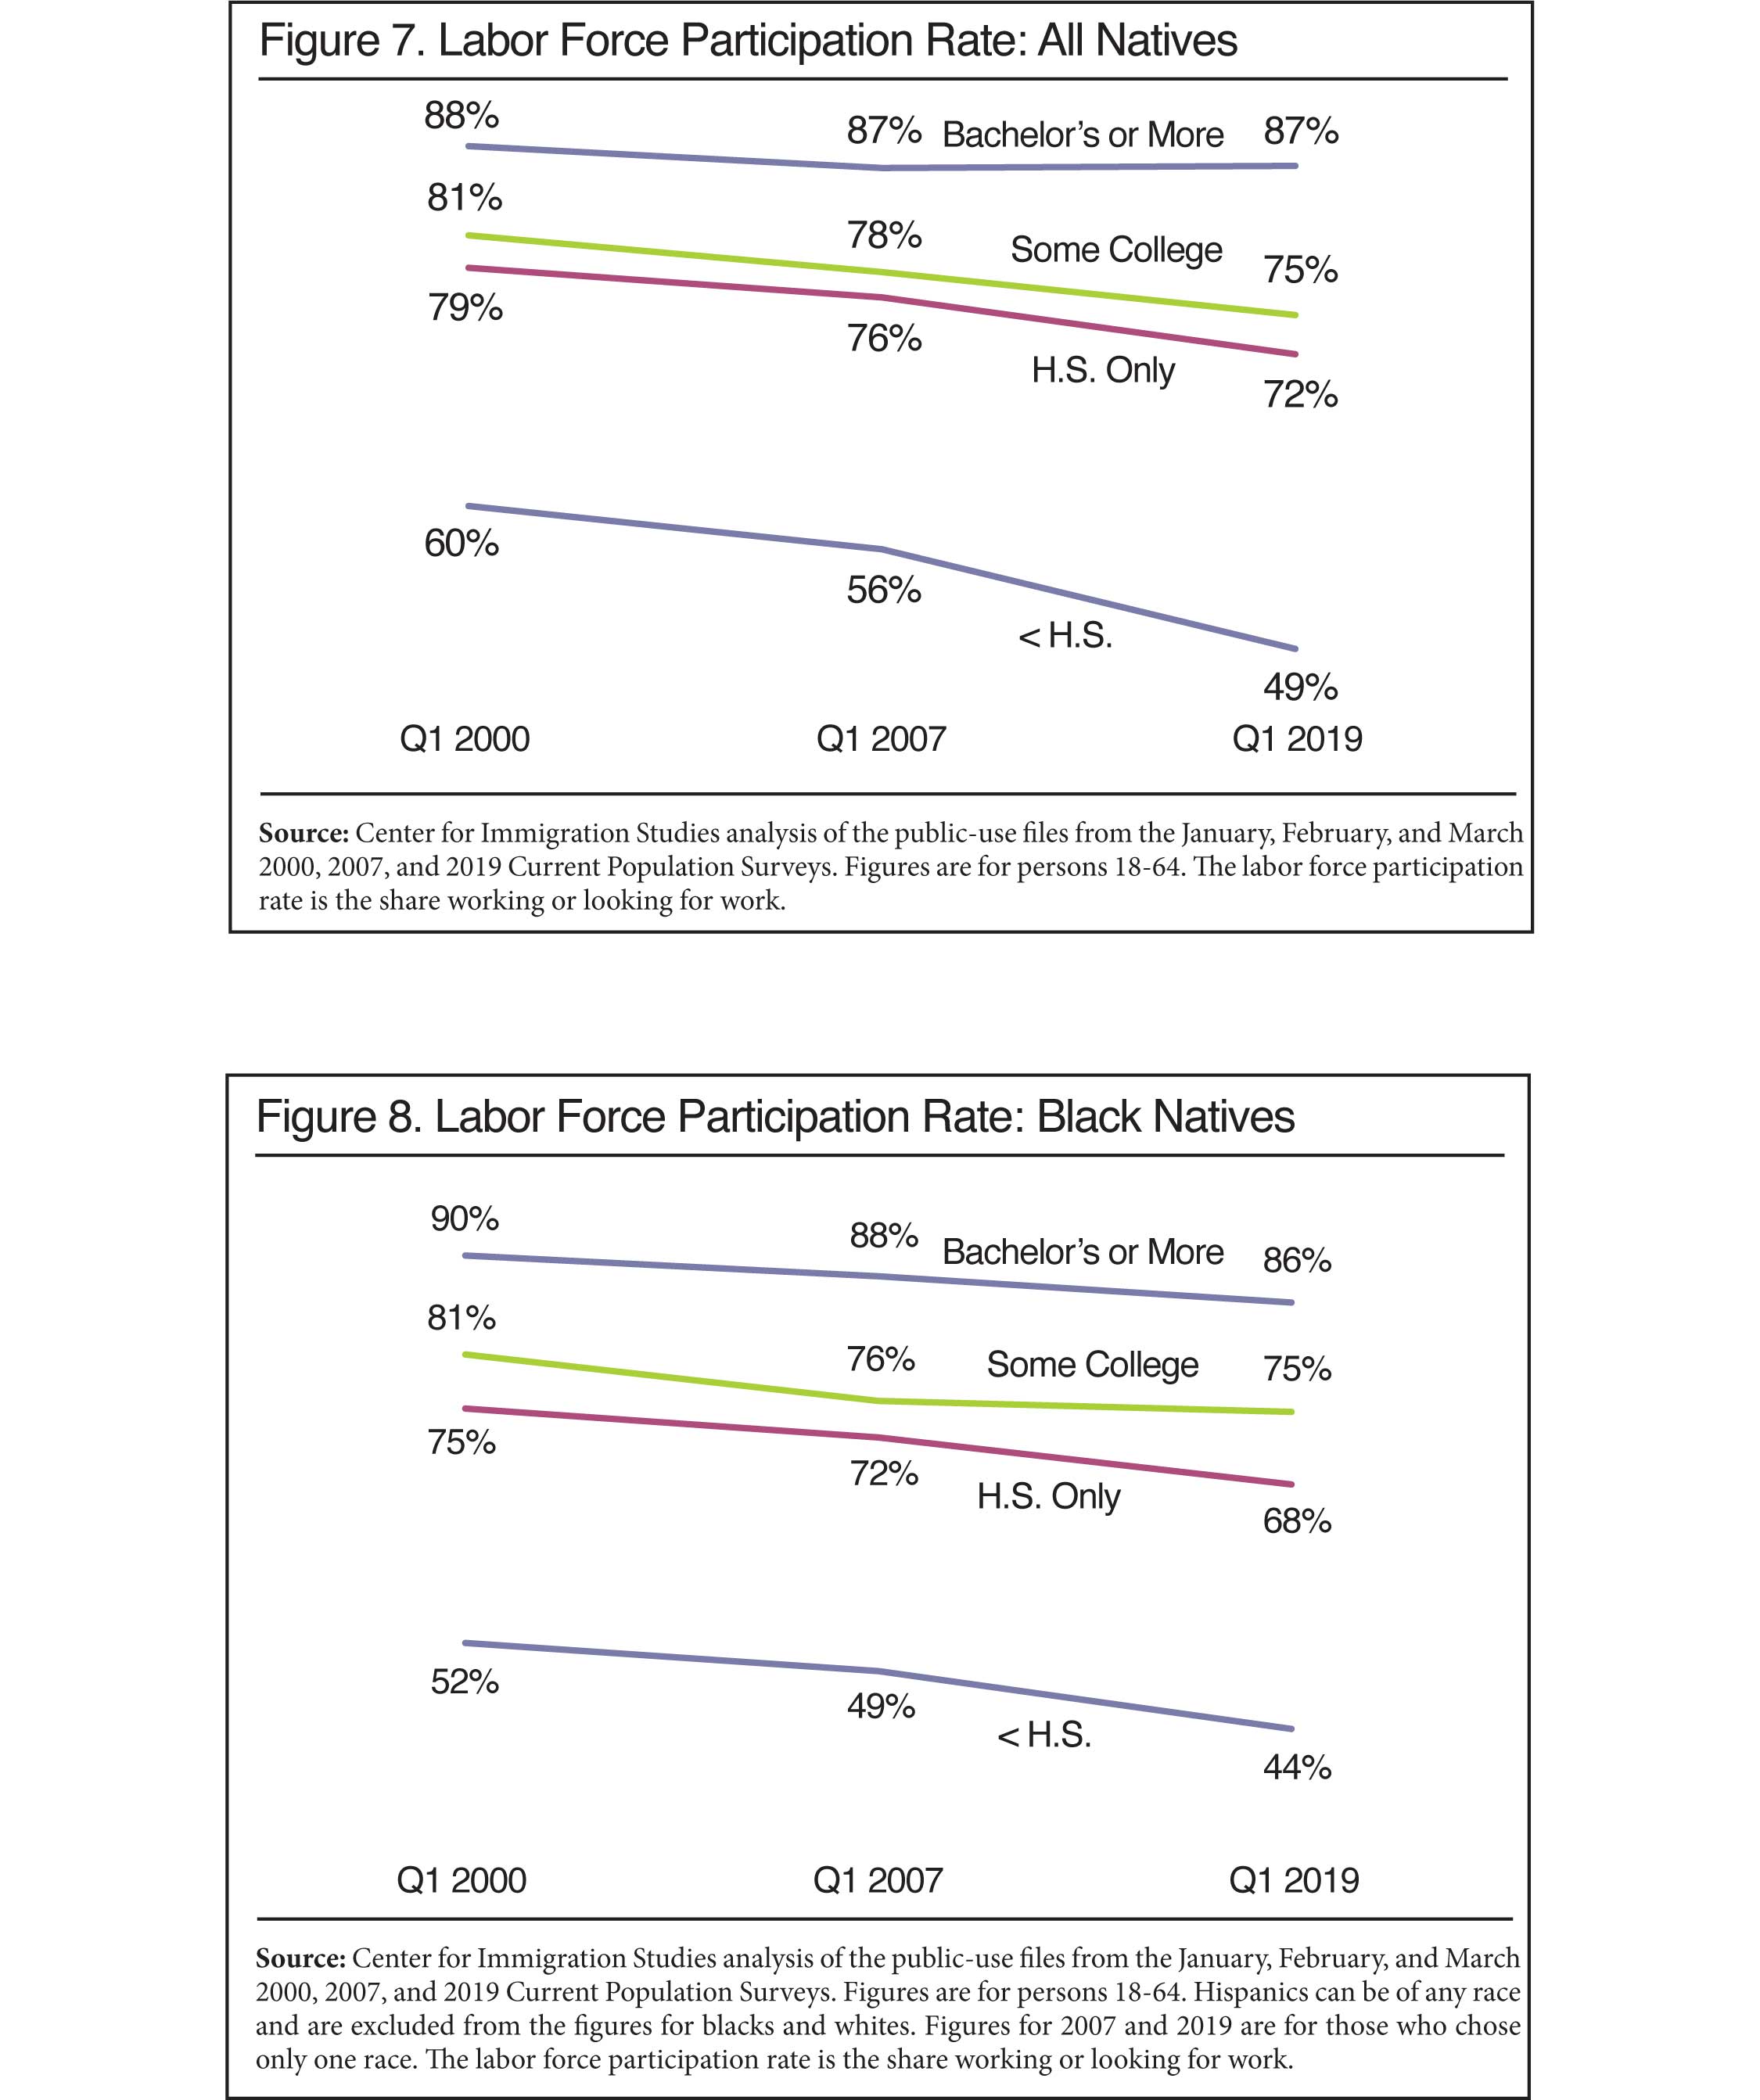
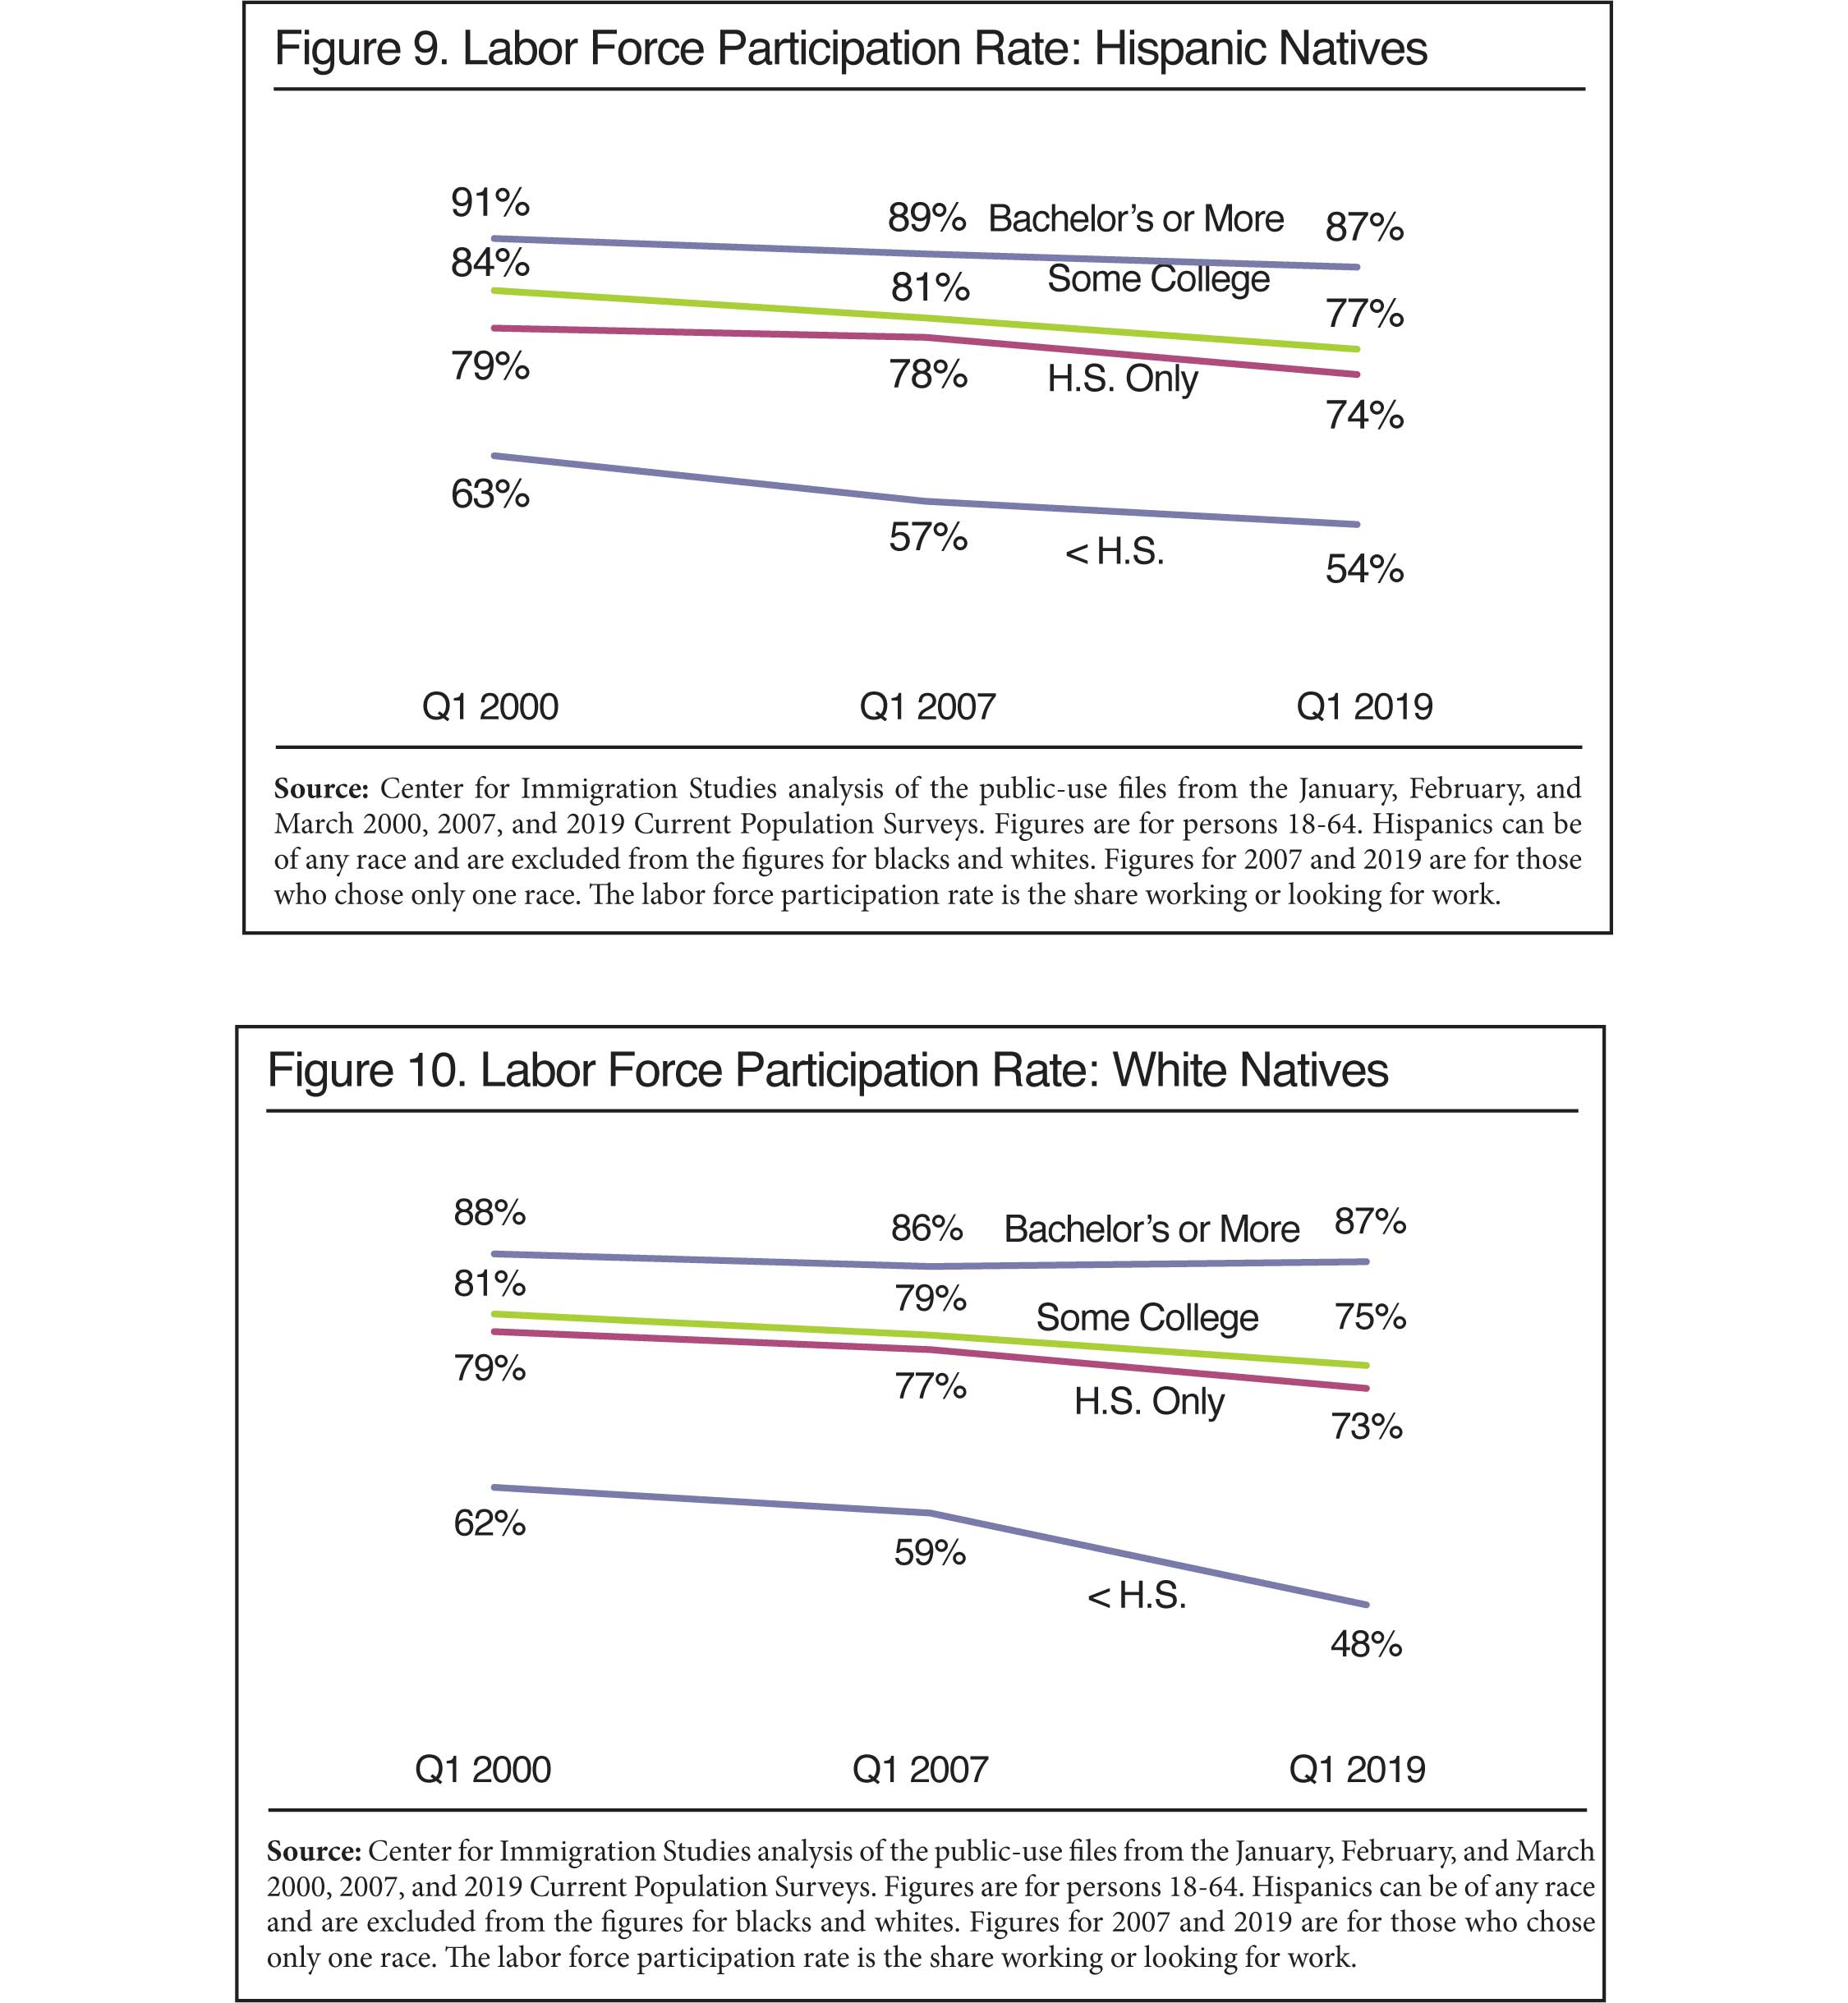
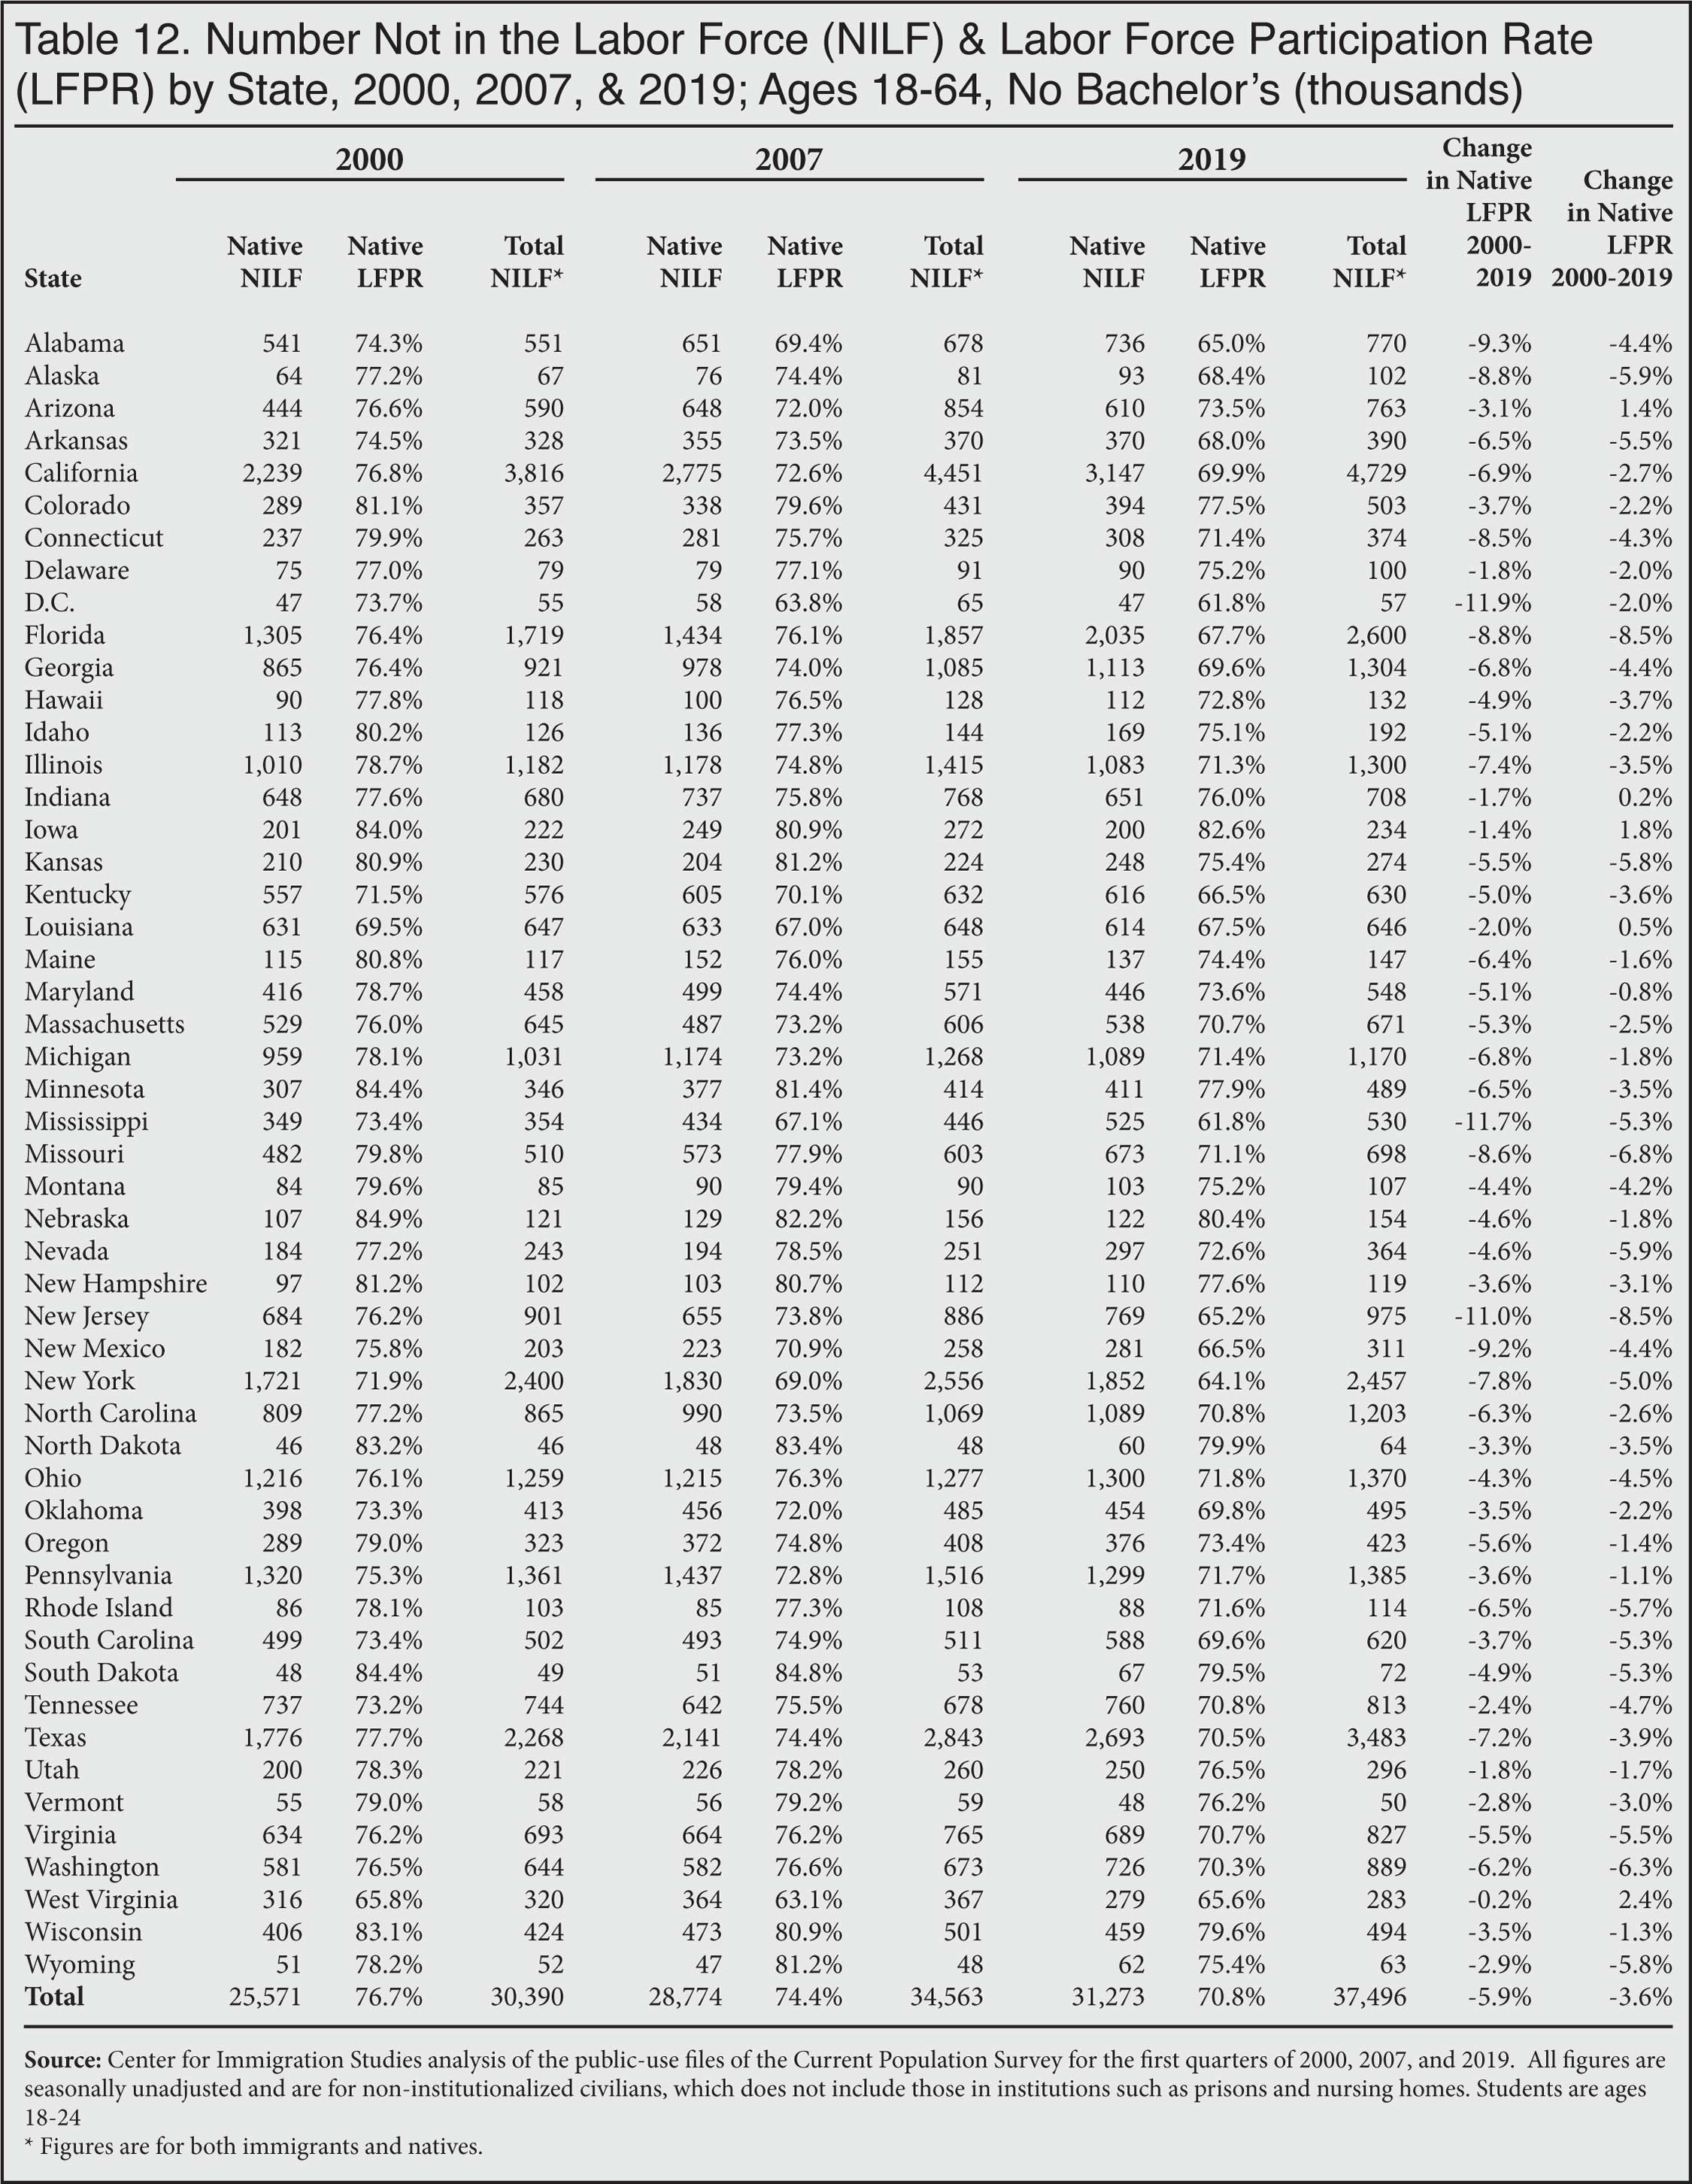
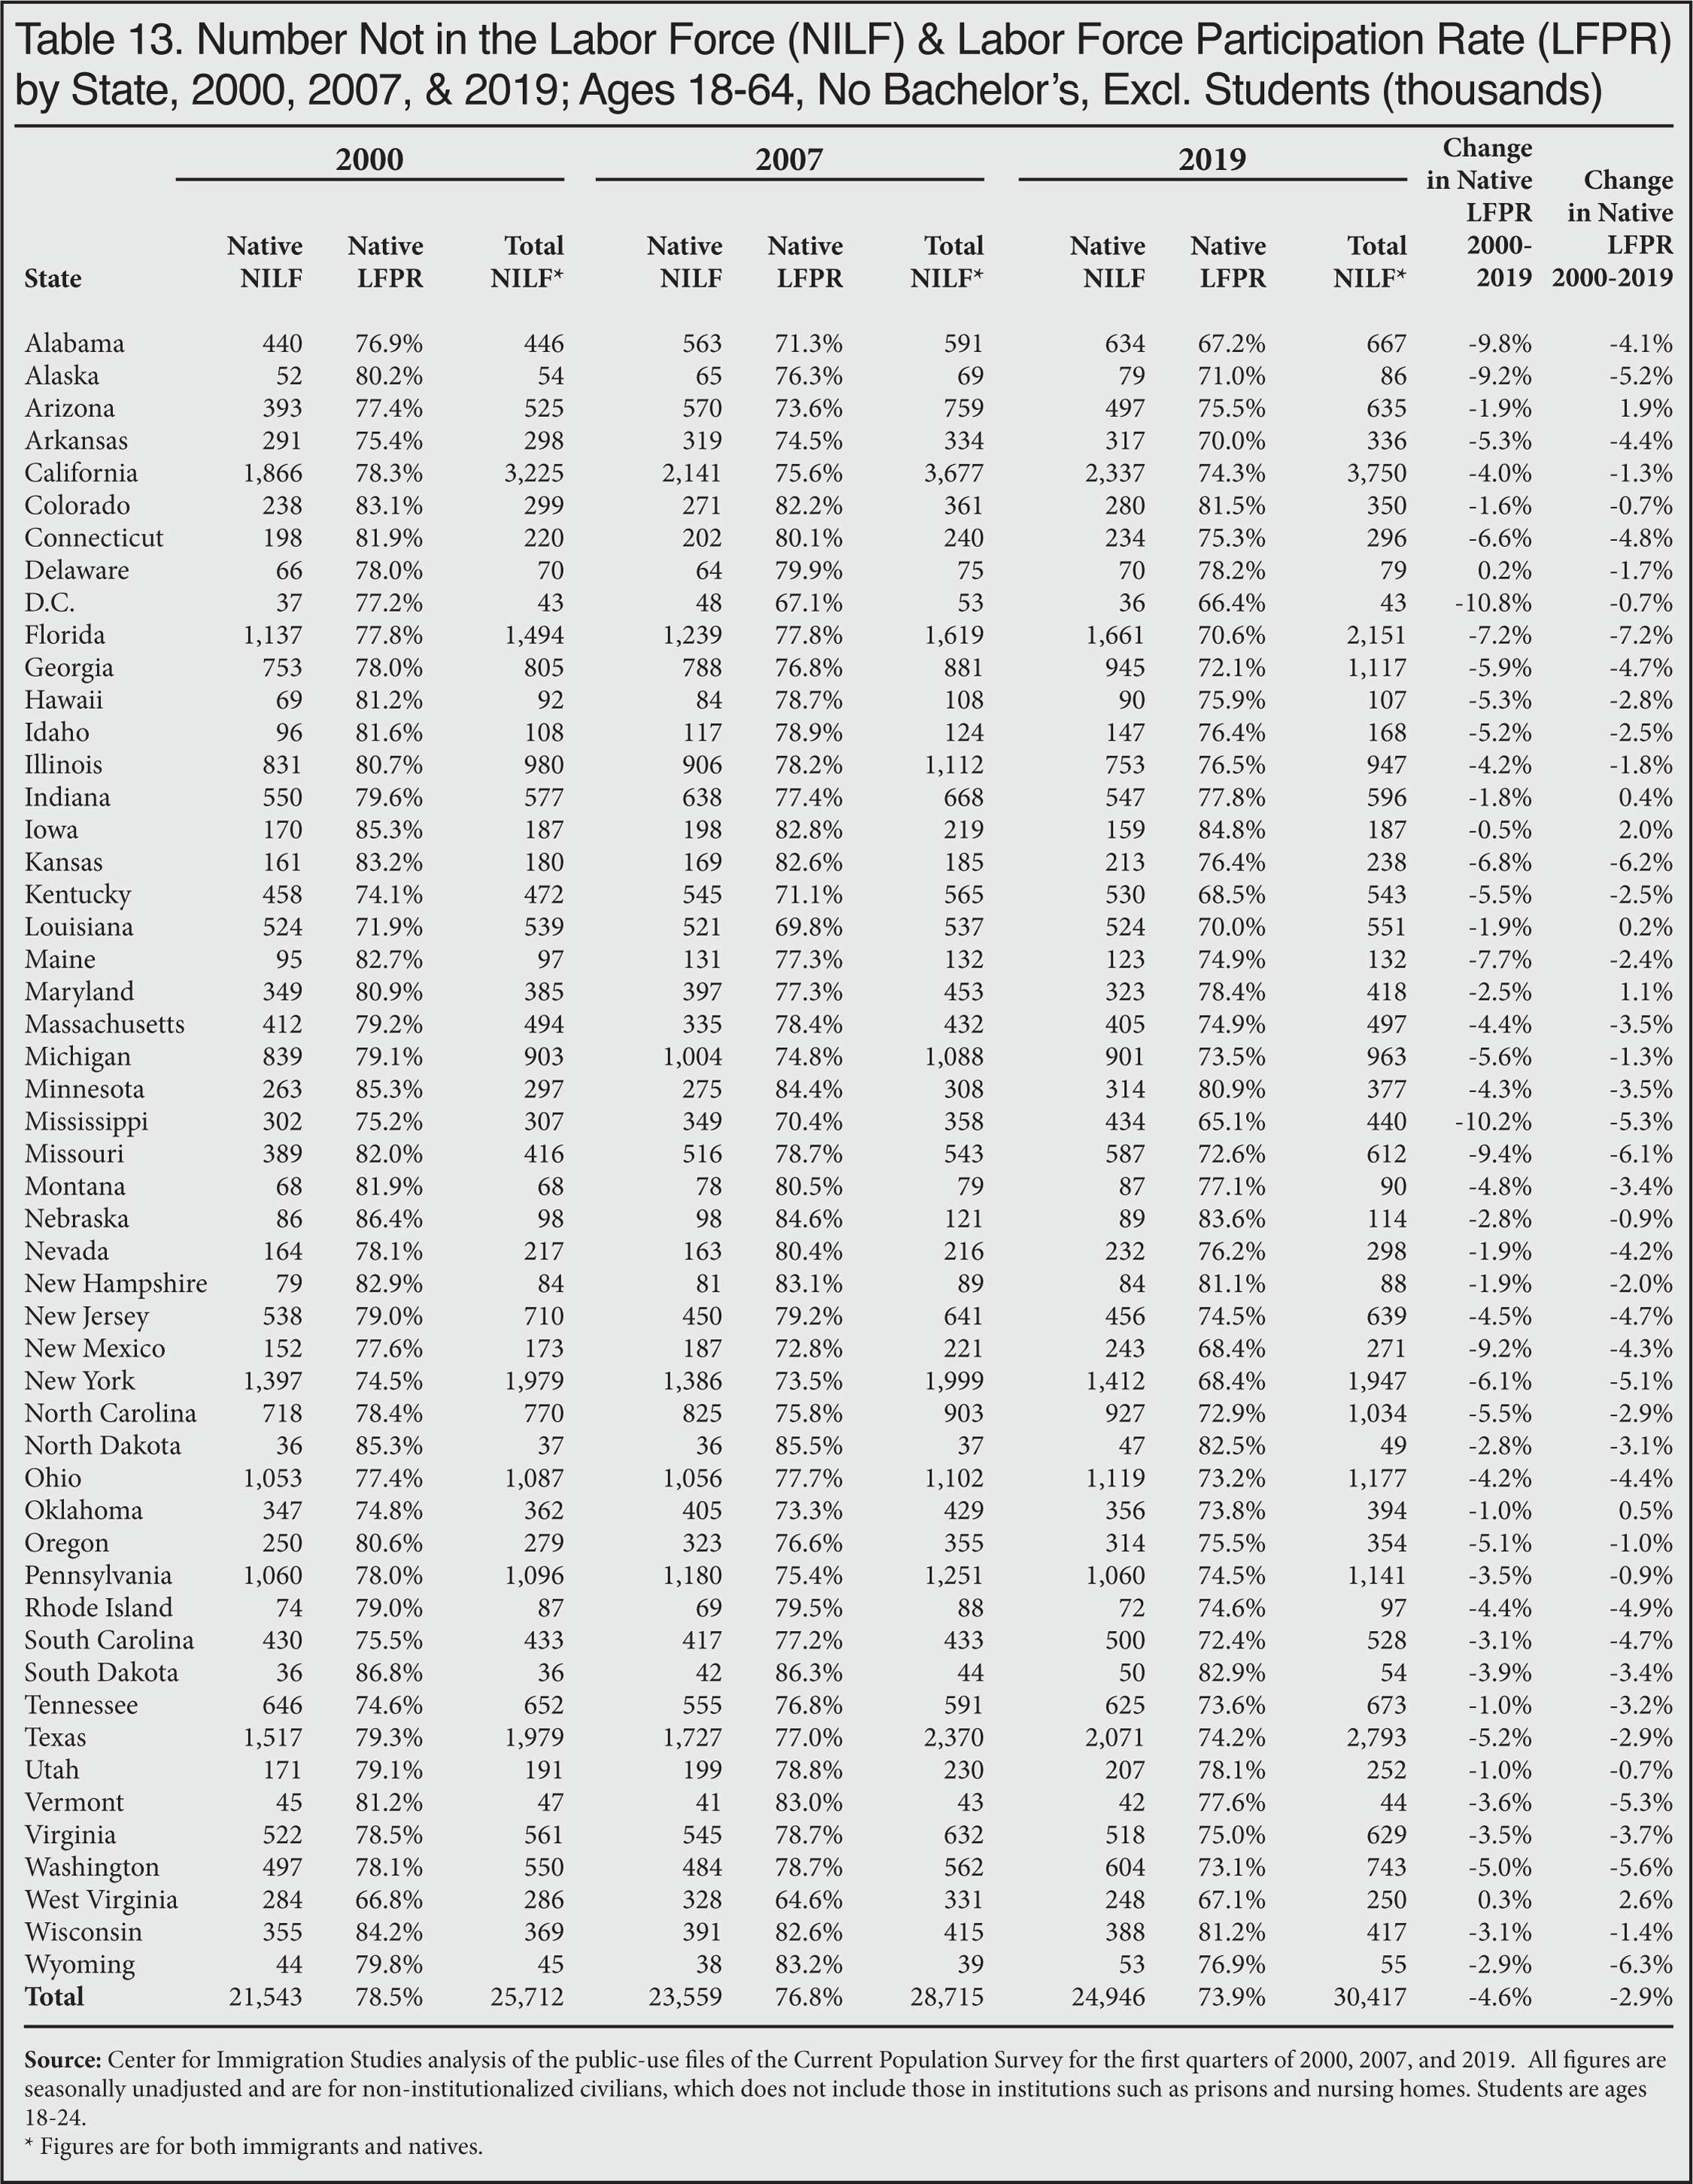
- There has been a long-term decline in the labor force participation rate of working-age (18 to 64) natives without a bachelor's degree. Only 70.8 percent of natives in this group were in the labor force in the first quarter of 2019; in 2007, before the recession, it was 74.4 percent, and in the first quarter of 2000 it was 76.7 percent.
- The labor force participation rate of natives without a college degree has shown no meaningful improvement in recent years. For example, in the first quarter of 2012 it was actually slightly better than it was in the first quarter of 2019.
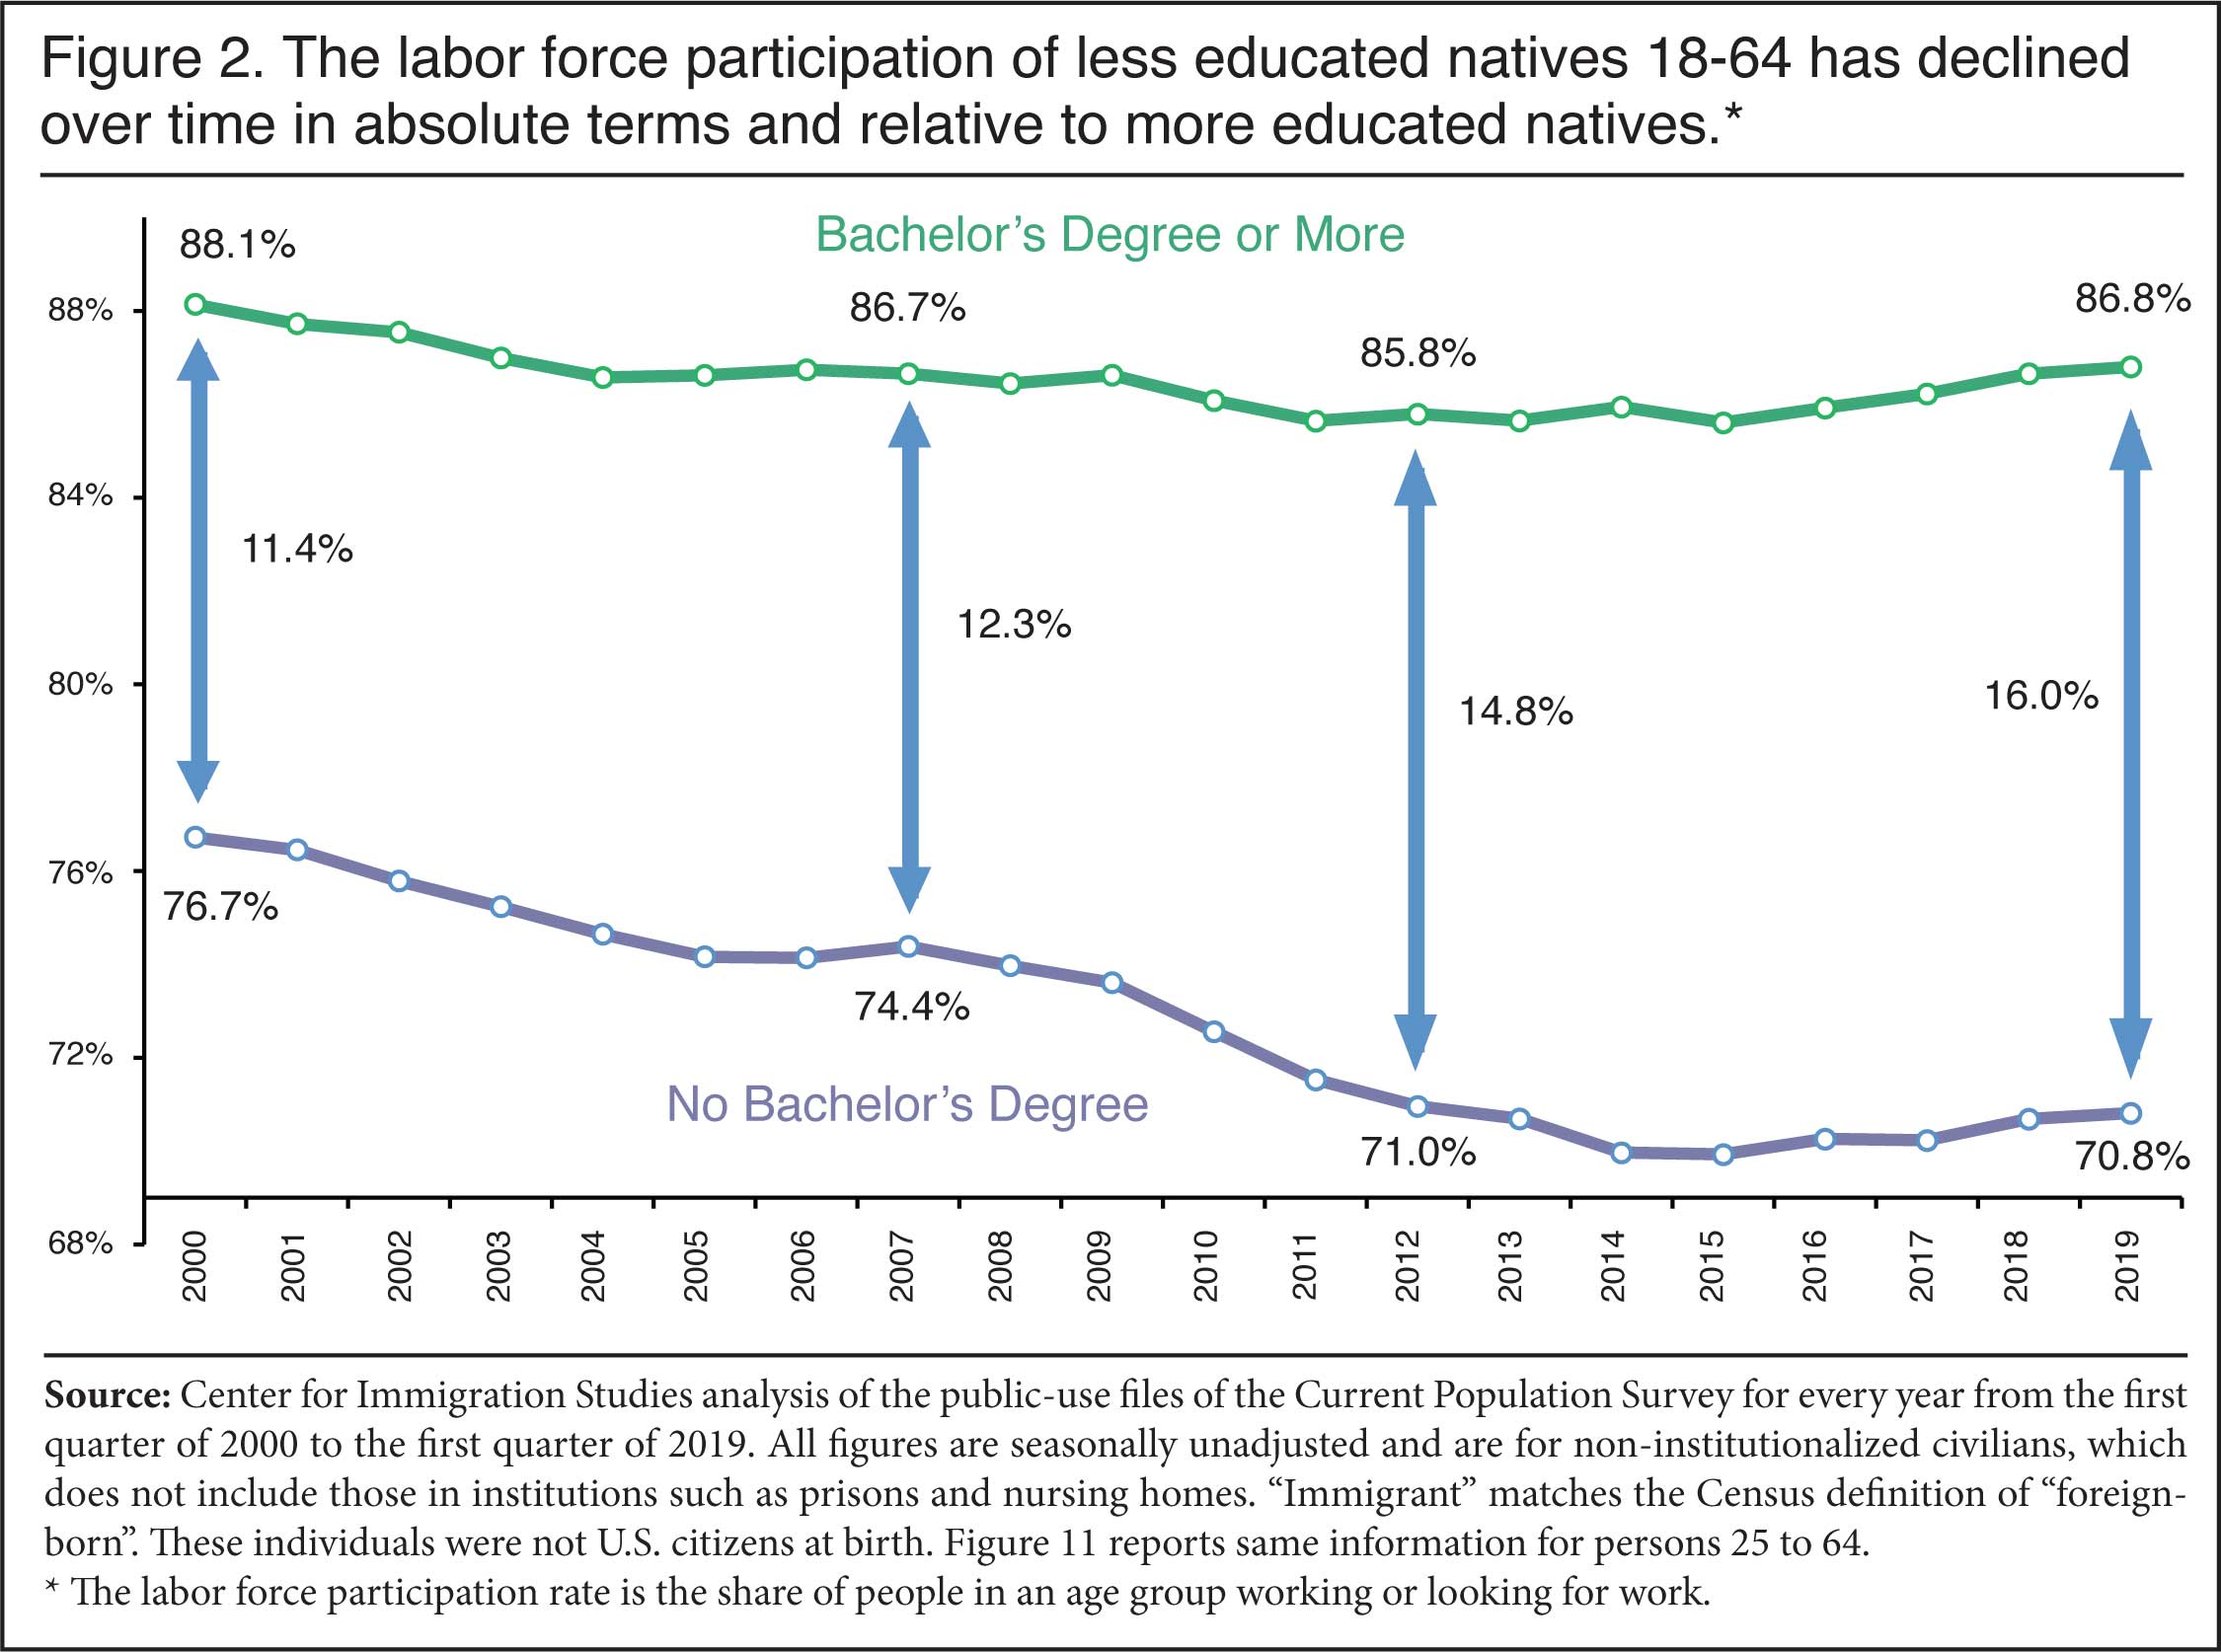
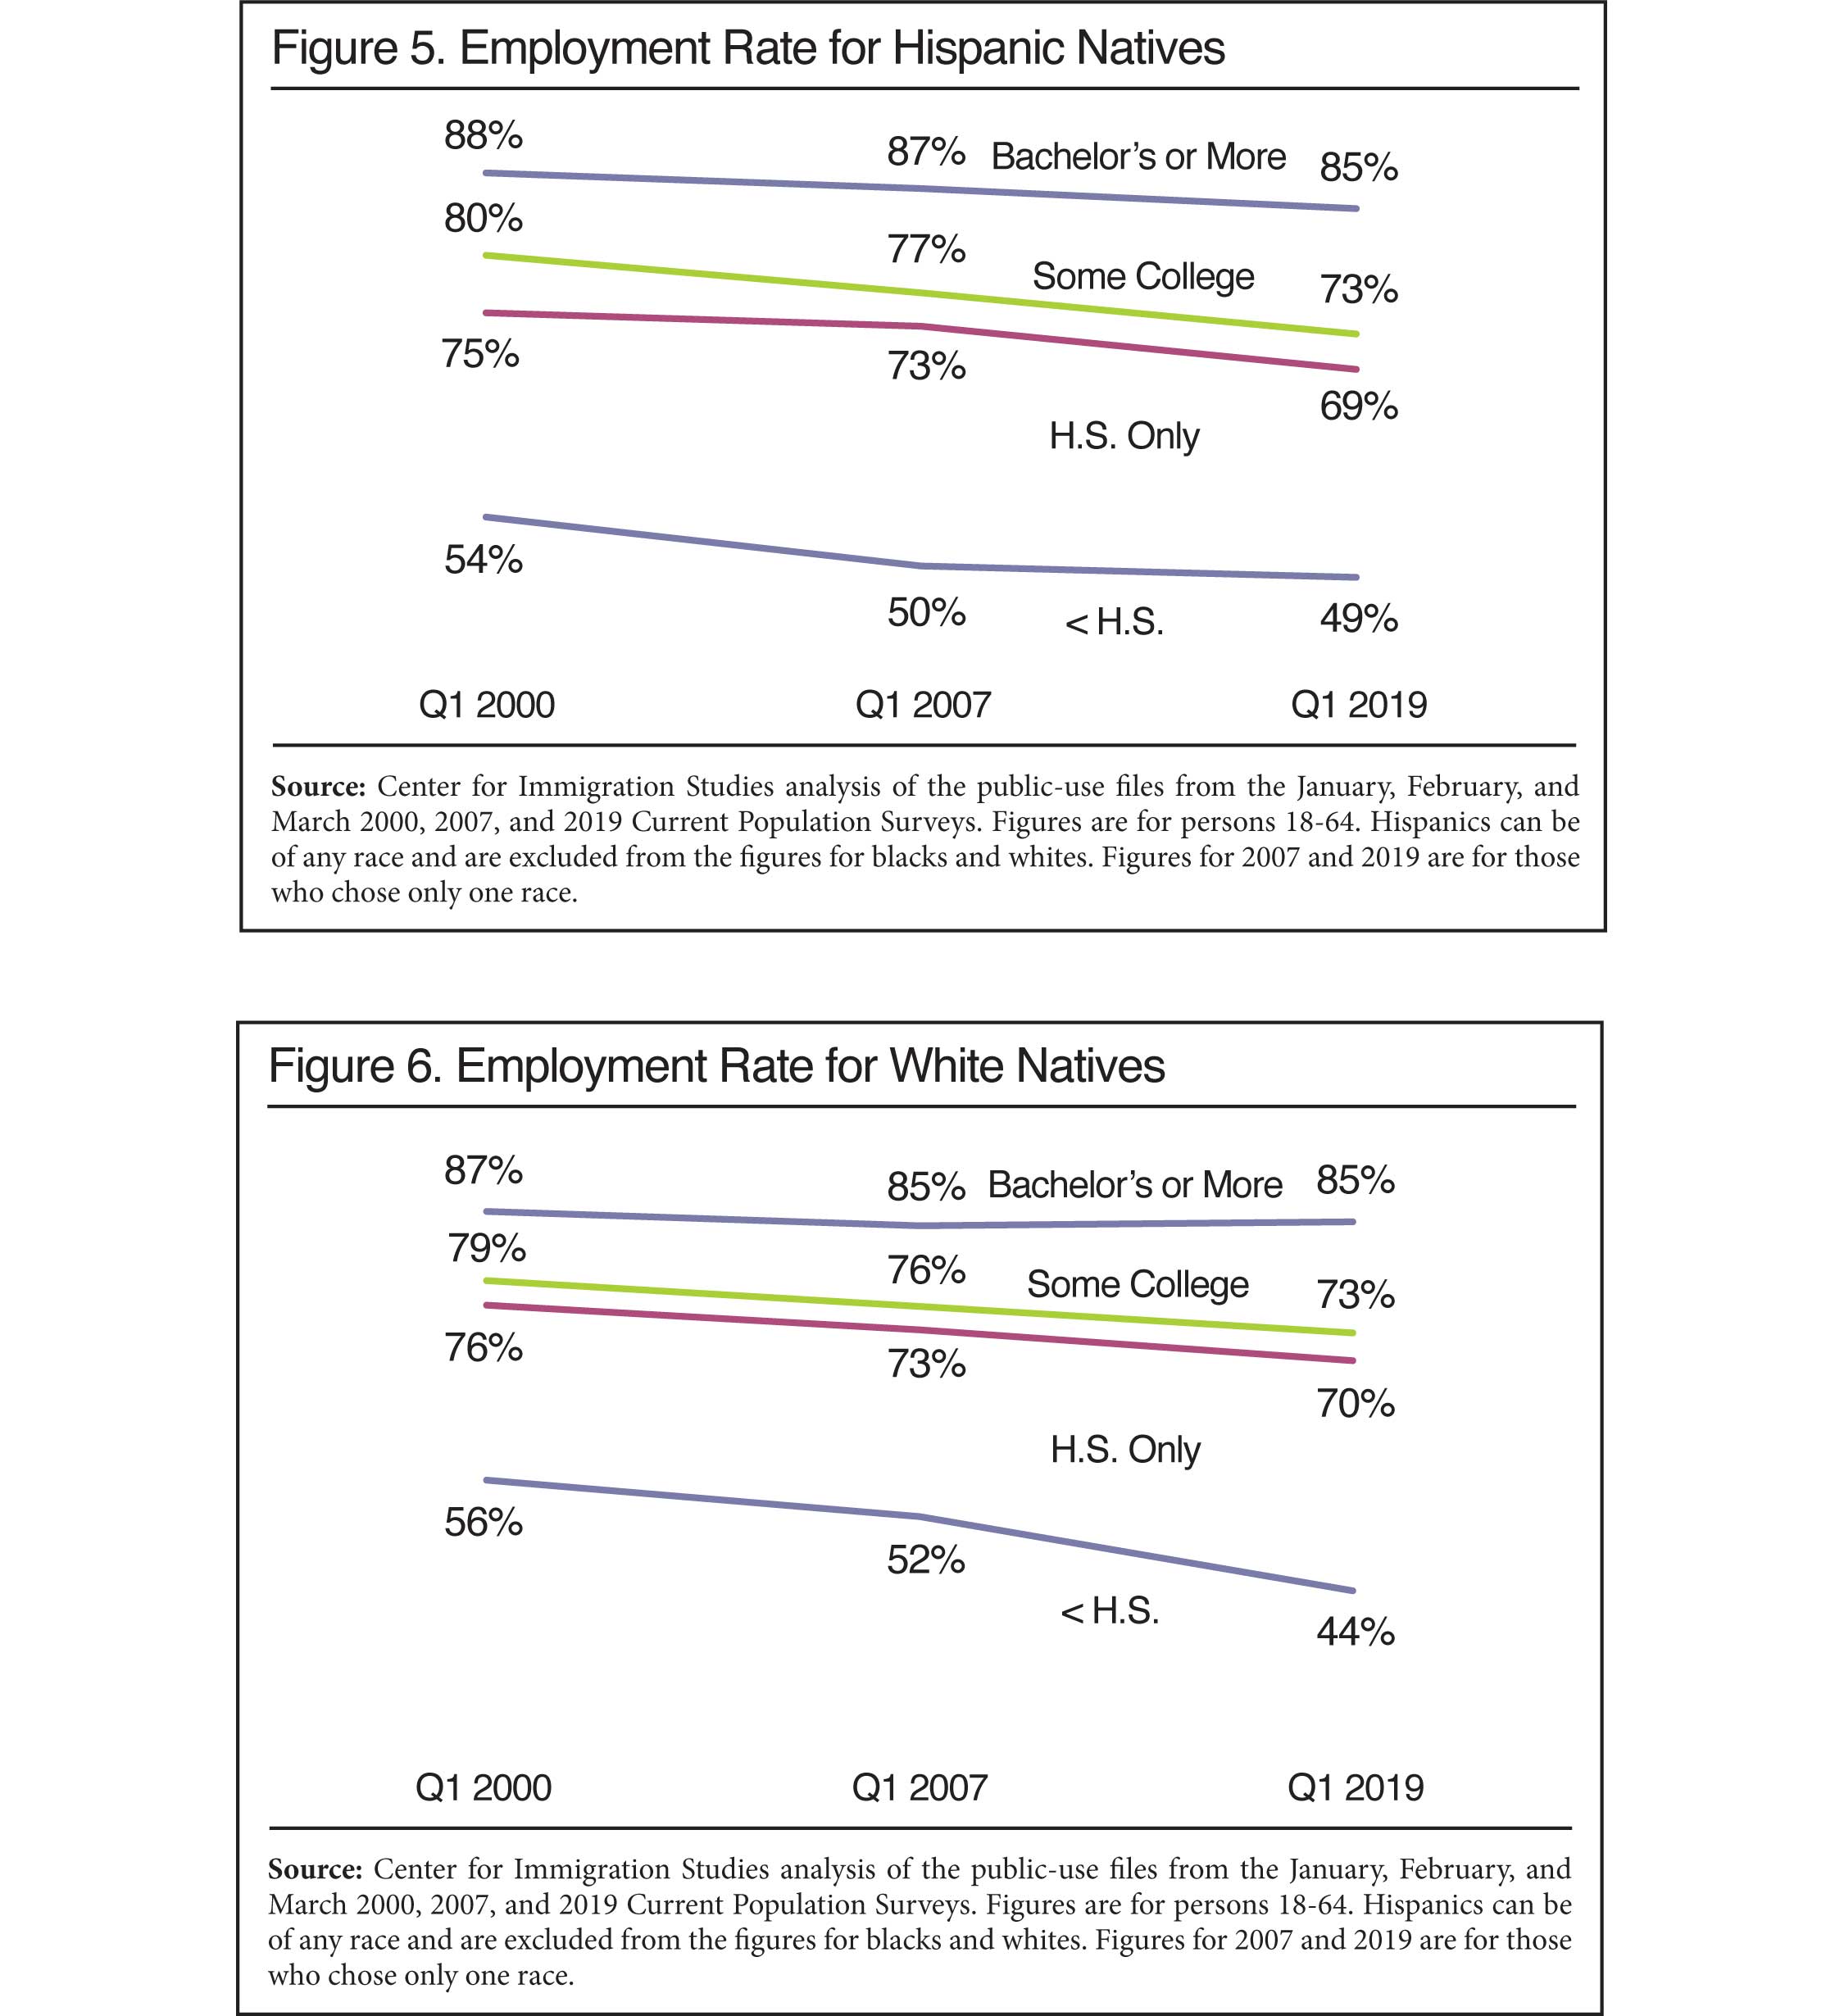
- The decline in labor force participation among those without a bachelor's degree is even more profound when it is measured relative to those who are more educated.
- In the first quarter of 2019, 70.8 percent of natives without a bachelor's degree were in the labor force, compared to 86.8 percent of those with a bachelor's degree — a 16 percentage-point difference. In the first quarter of 2007, the gap was 12.3 percentage points; and in the first quarter of 2000 the gap was 11.4 percentage points.
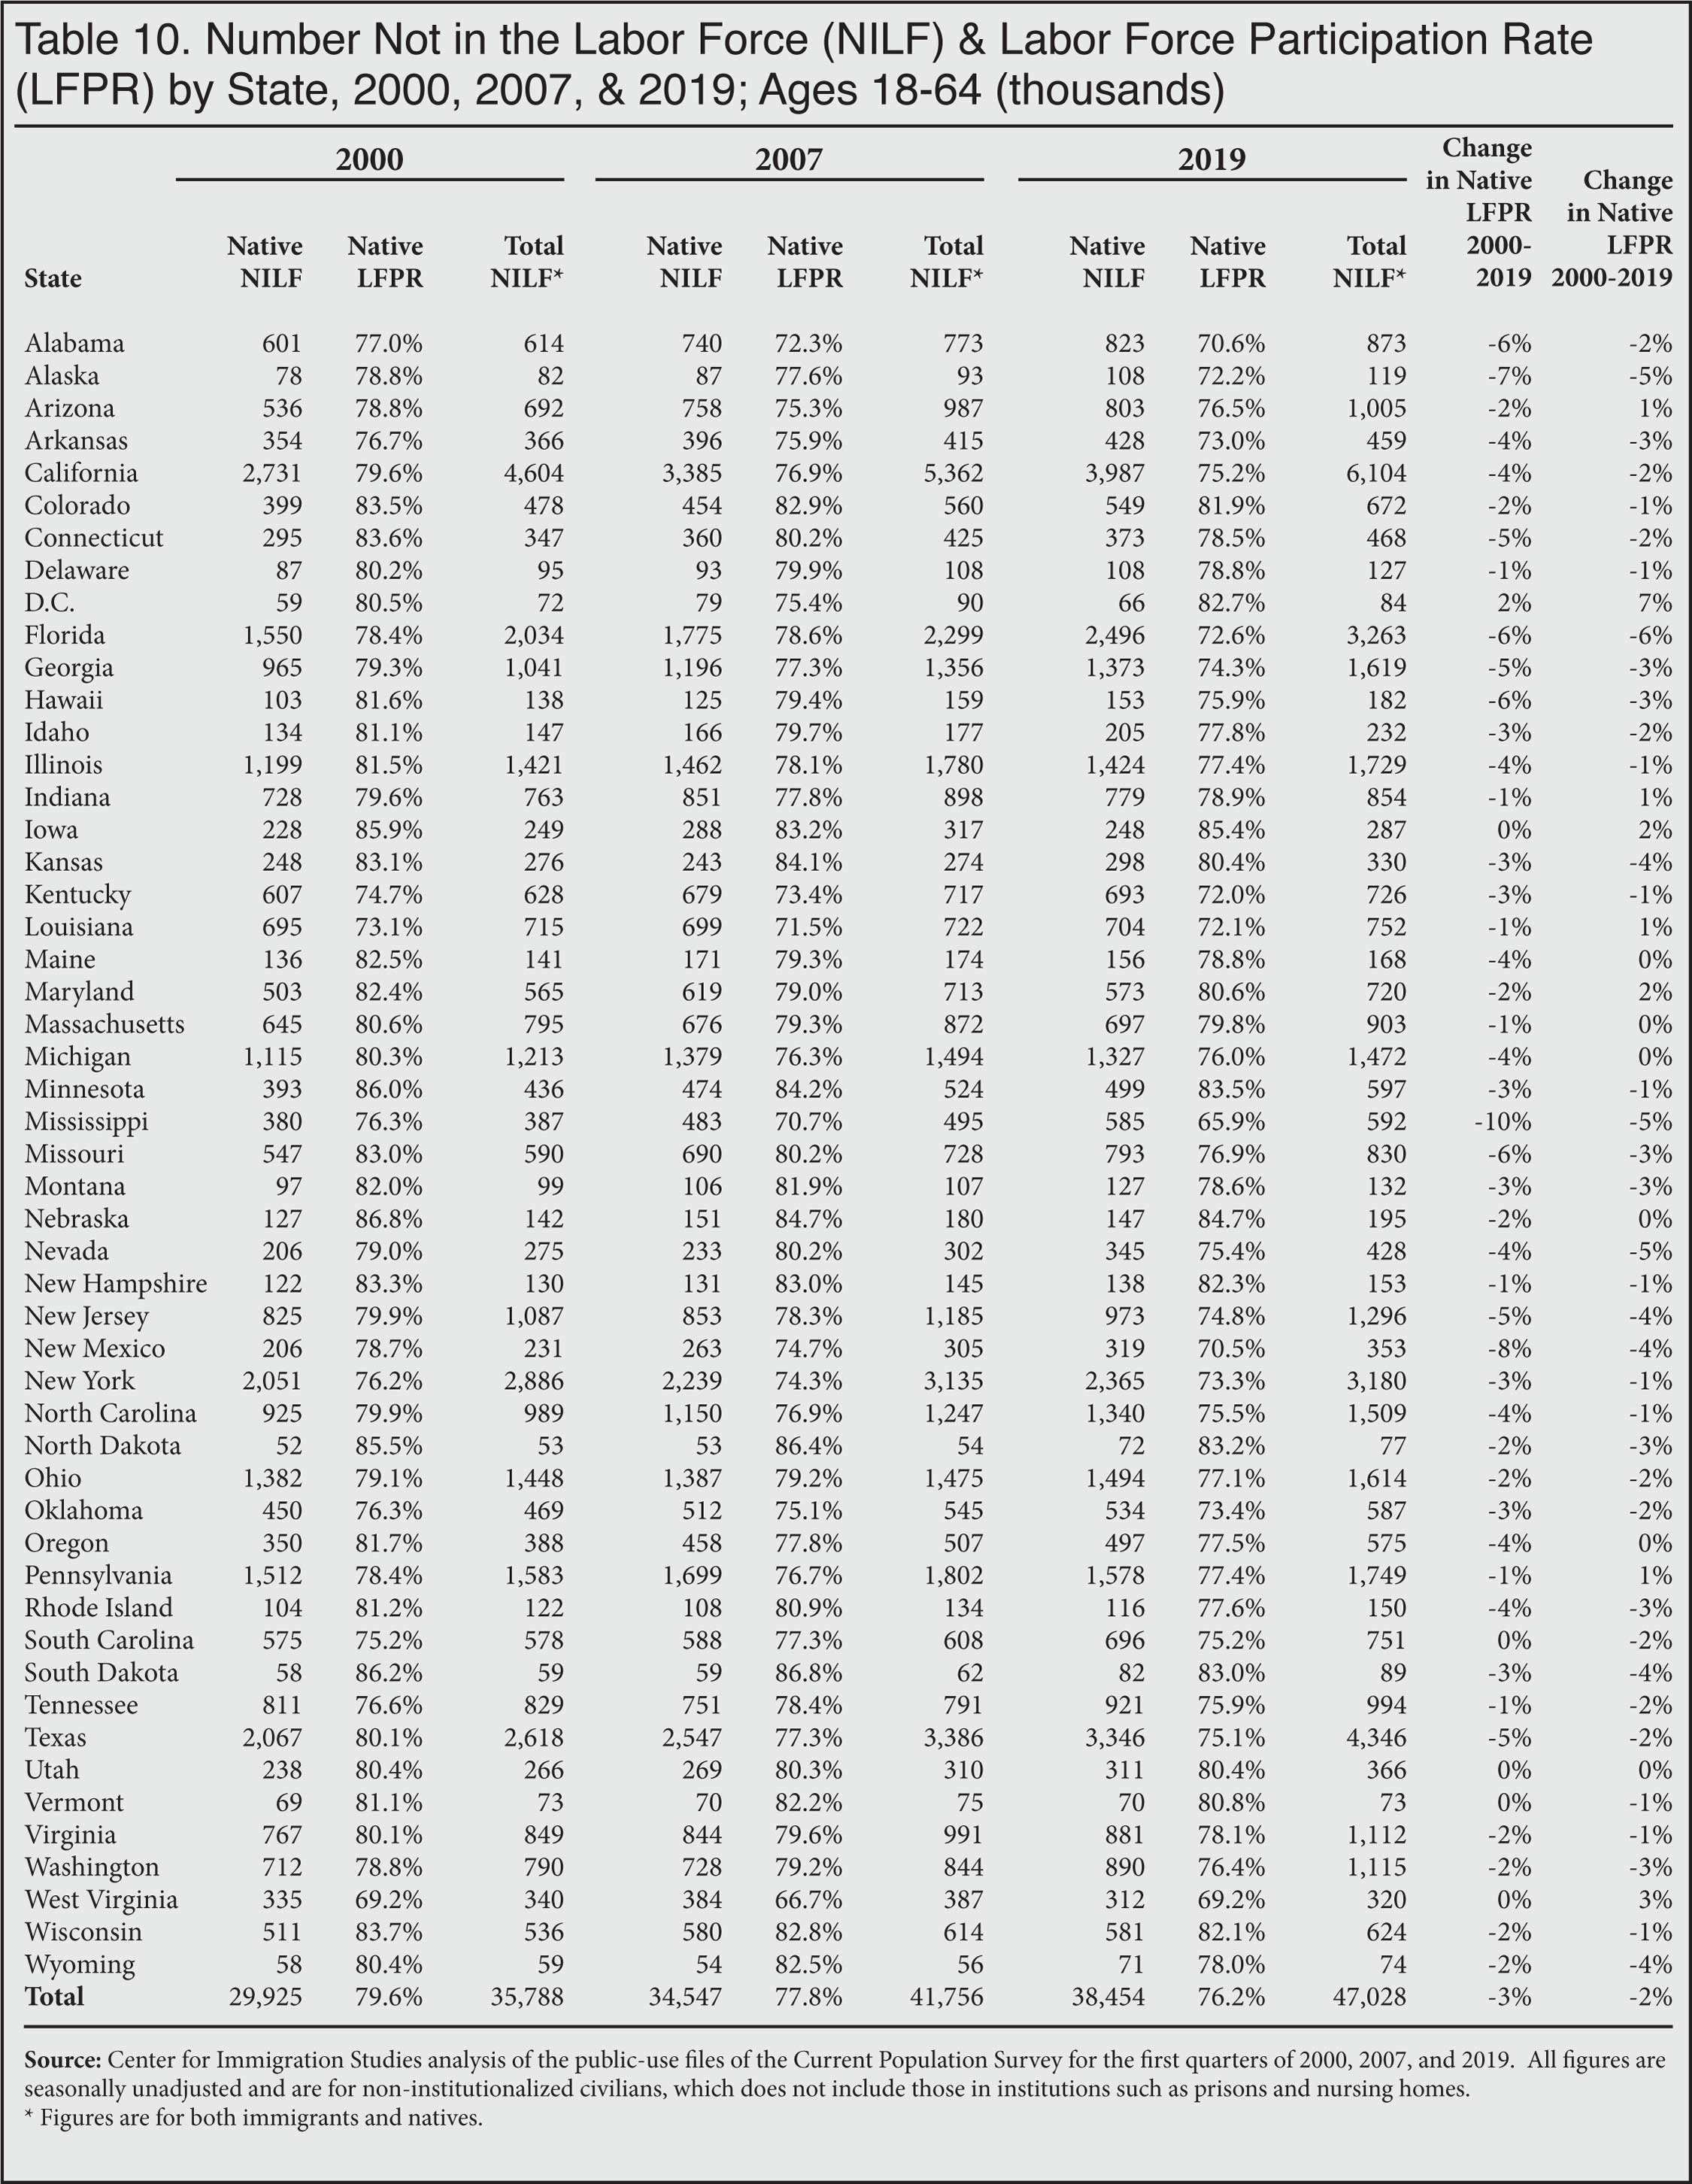
- In 45 states plus the District of Columbia, labor force participation of natives without a college degree was lower in the first quarter of 2019 than the same quarter in 2007.
- Comparing 2000 to 2019, all 50 states plus the District of Columbia have a lower labor force participation rate for natives without a college degree in 2019.
Among Immigrants:
- Working-age immigrants without a college education also have not fared well since the recession. Unlike the labor force participation of natives, immigrants without a college education did improve their situation between 2000 and 2007. But it has not returned to 2007 levels.
- In the first quarter of 2019, the labor force participation rate of immigrants (18 to 64) without a bachelor's degree was 73.3 percent, somewhat better than that of natives, but still below their rate of 73.8 percent in the first quarter of 2007.
Immigrants and Natives Not in the Labor Force:
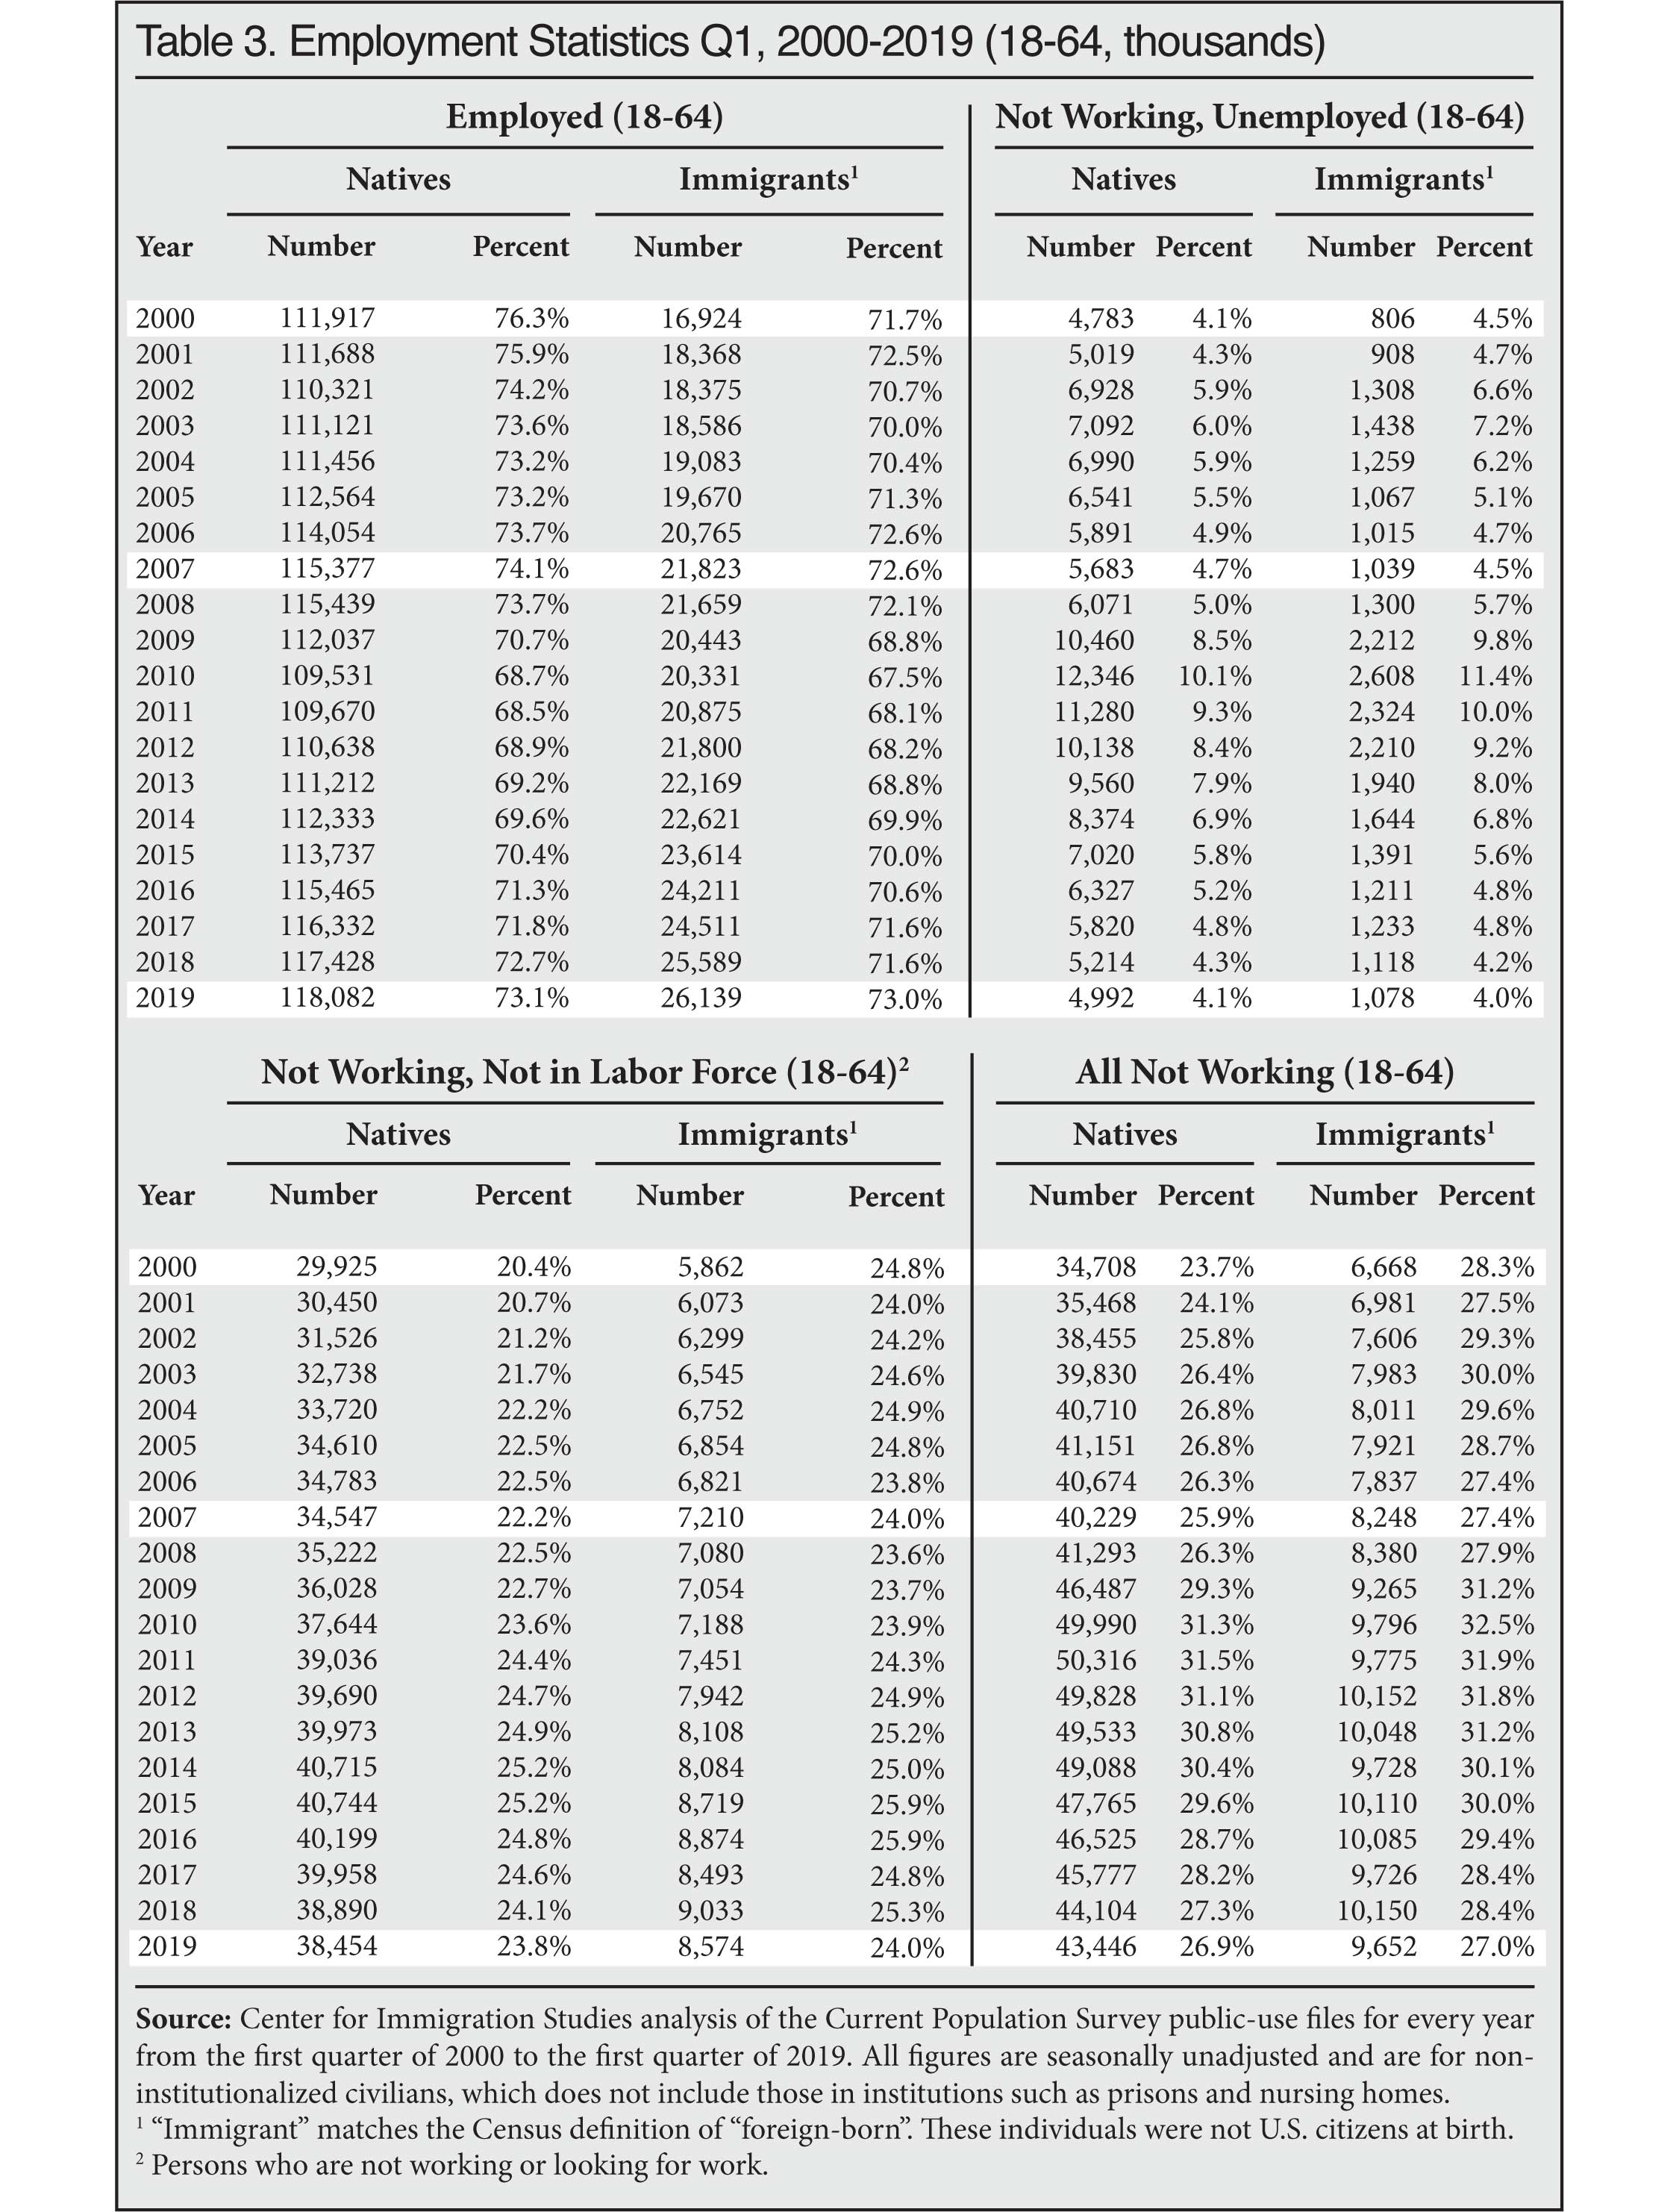
- In the first quarter of 2019, there were a total of 47 million immigrants and natives ages 18 to 64 not in the labor force, up from 41.8 million in 2007 and 35.8 million in 2000.
- Of the 47 million immigrants and natives currently not in the labor force, 37.5 million (80 percent) do not have a bachelor's degree.
- The above figures do not include the unemployed, who are considered to be part of the labor force because, although they are not working, they are looking for work. There were almost 6.7 million unemployed immigrants and natives in the first quarter of this year; more than three-fourths of the unemployed do not have a bachelor's degree.
Data and Methods
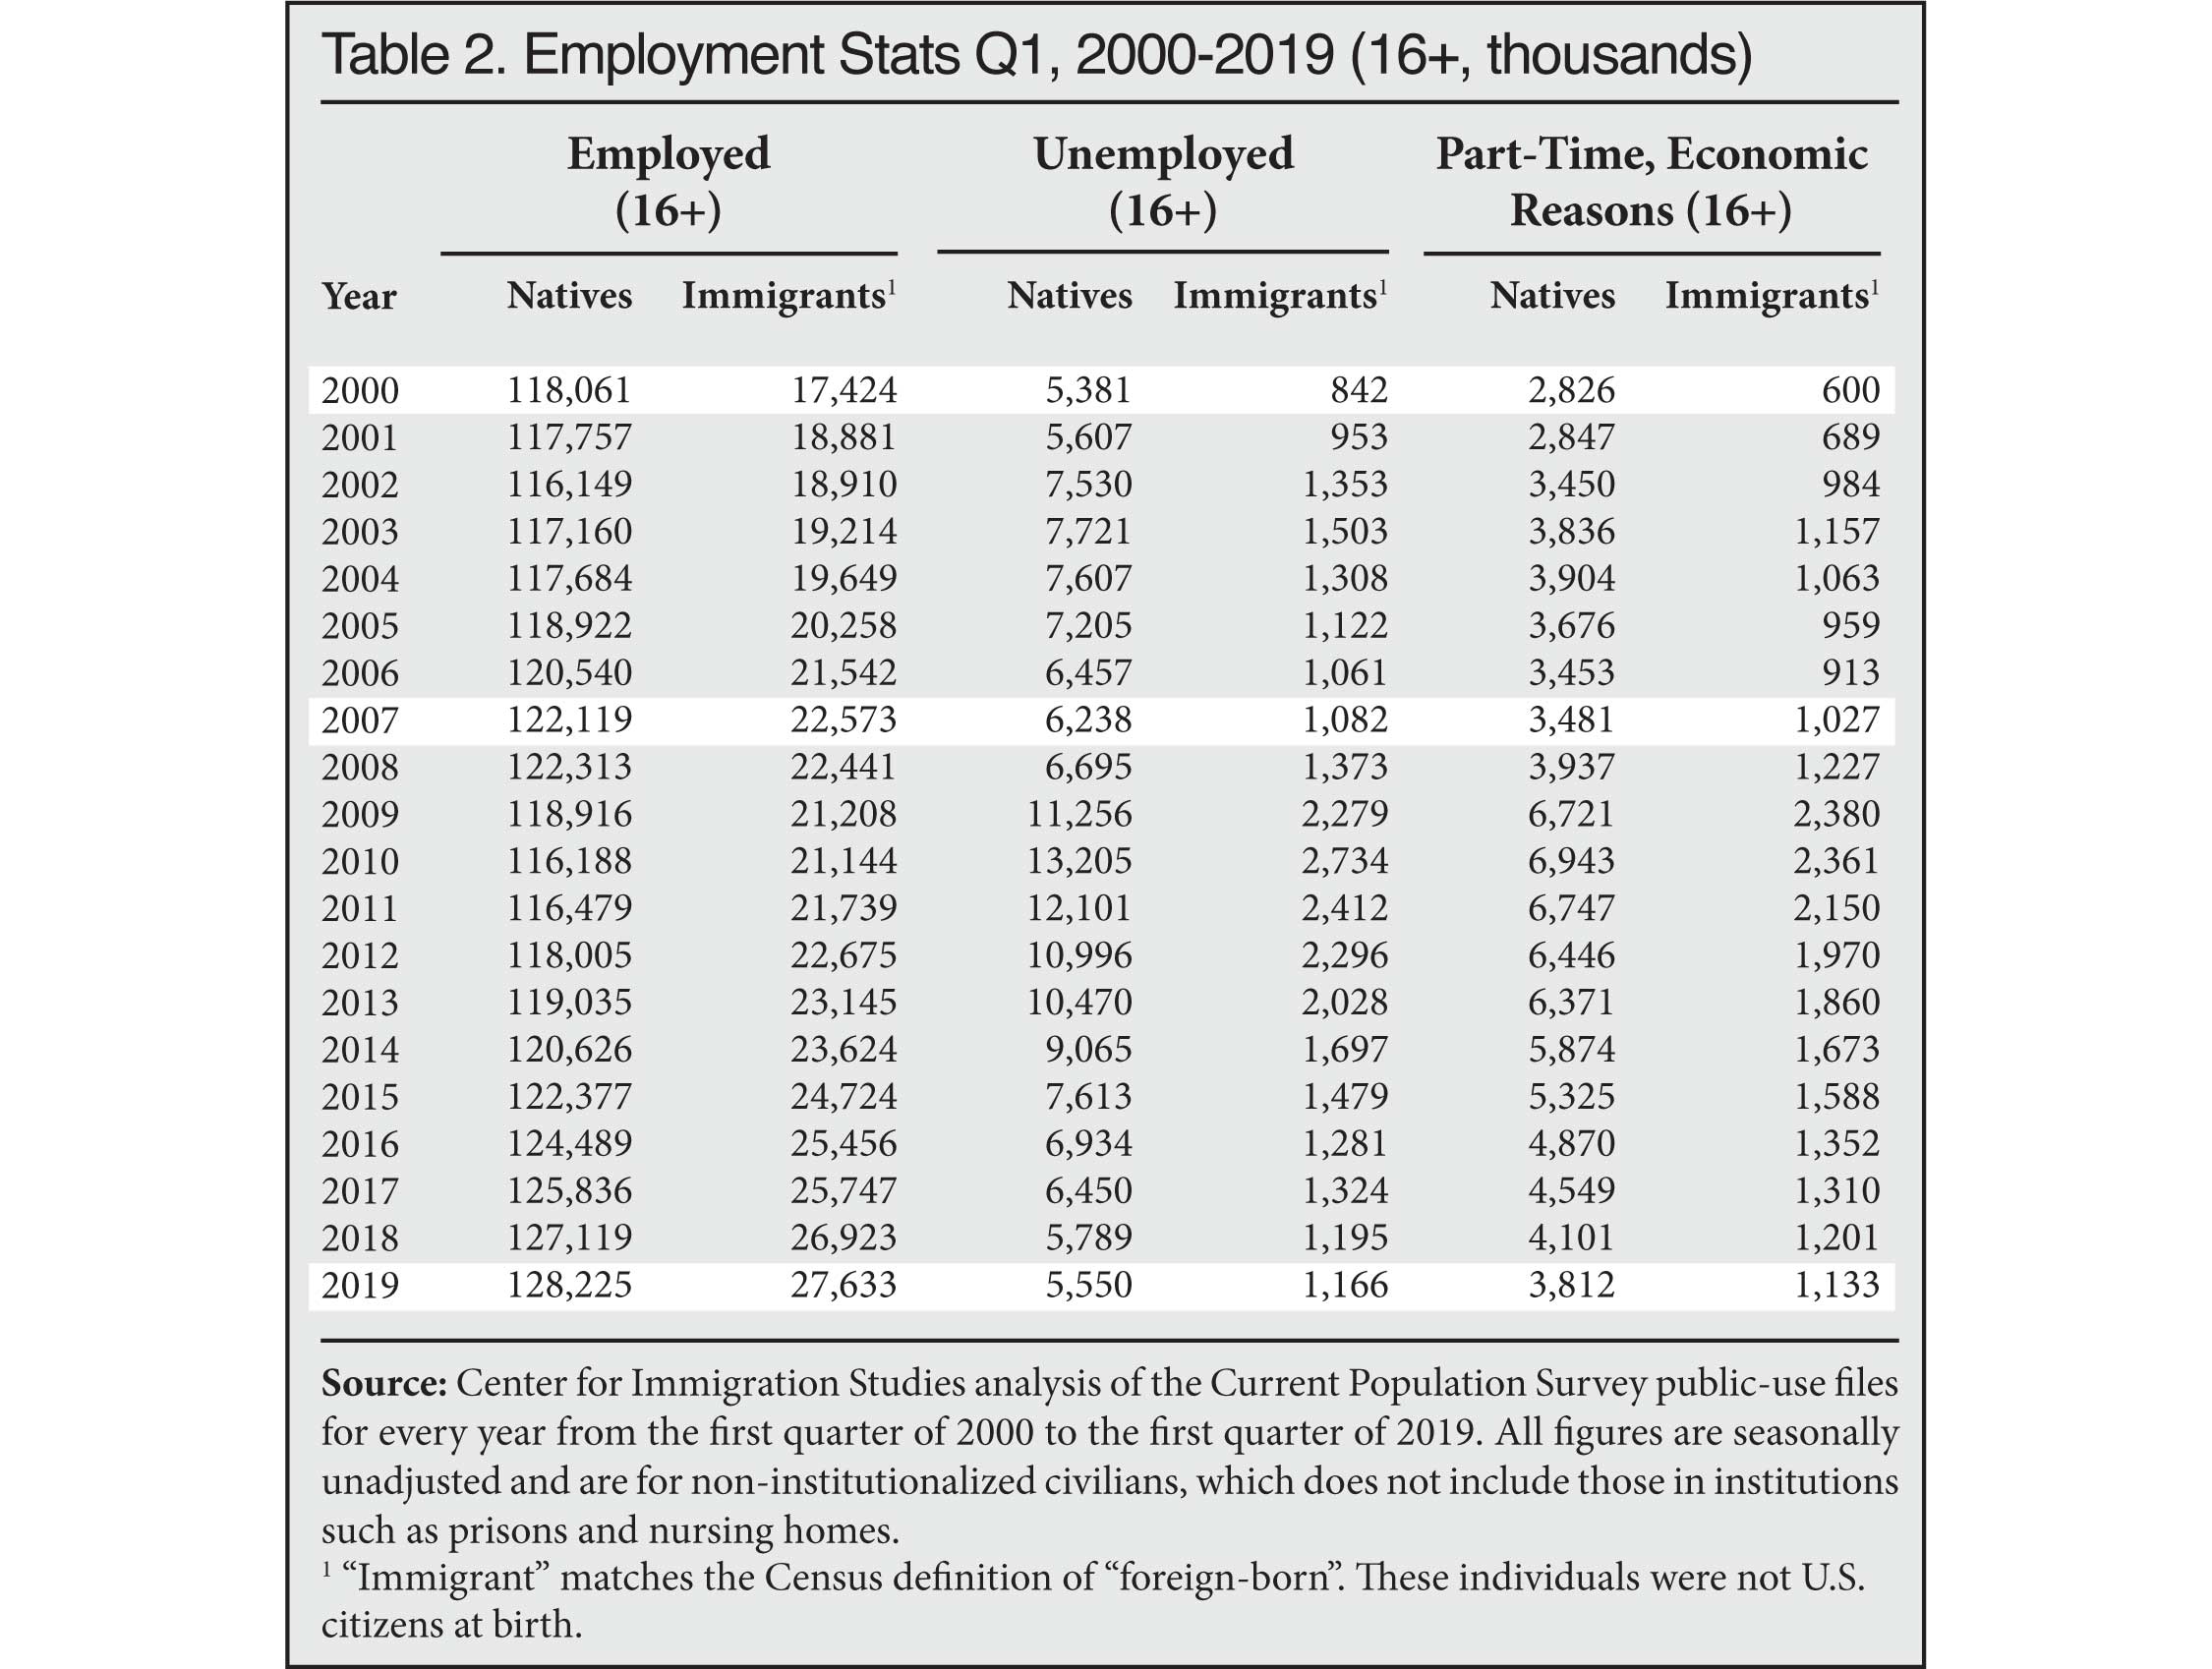
The two primary employment surveys collected by the U. S. government are referred to as the "household survey" (also called the Current Population Survey or CPS) and the "establishment survey" (also called the Current Employment Statistics Survey or CES). The establishment survey asks employers about the number of workers they have. In contrast, the CPS asks people at their place of residence if they are working. Both surveys are collected by the Census Bureau for the Bureau of Labor Statistics (BLS). While the two surveys show the same general trends, the figures from the two surveys differ to some extent.
Because it asks workers about their employment situation, only the CPS provides information about who is working, who is looking for work, and who is neither working nor looking for work. Moreover, only the CPS asks respondents about socio-demographic characteristics such as education, age, and country of birth. Thus, only the CPS can be used to compare employment among immigrants and the native-born. The establishment survey is not released to the public, so no independent analysis of it is possible. For these reasons, this analysis uses the public-use files of the CPS to examine employment in the United States by quarter. For each quarter, the three CPS surveys combined include roughly 350,000 natives and 43,000 immigrants. Like all government surveys, the data is weighted to reflect the actual size and demographic makeup of the U.S. population.
The data for the tables in this report comes from the public-use files of the January, February, and March CPS for 2000 to 2019. Quarterly data is more statistically robust than monthly data, especially for smaller populations like immigrants and minorities, due to the inclusion of three months of data. All figures are for the civilian population only and do not include those in institutions like prisons or nursing homes, which are not included in the CPS. Although we report figures for other years, we focus on 2000 and 2007 because they represent the peak of prior economic expansions and 2019 as it is the newest quarterly data available. The CPS is the nation's primary source for unemployment and other labor force statistics.
The government publishes employment statistics that are both seasonally adjusted and unadjusted from the survey. The figures in this analysis are all seasonally unadjusted. Unadjusted figures are computationally simpler and easier for other researchers to replicate. In general, the BLS does not provide separate estimates for the foreign-born (immigrants) and the U.S.-born broken down by characteristics such as education, race, and age. However, all CPS respondents are asked these questions. The Census Bureau defines the foreign-born as persons who were not U.S. citizens at birth, which includes naturalized citizens, legal immigrants who are not citizens (green card holders), temporary visitors and workers, and illegal immigrants. We use the term "immigrant" to define all of these individuals in this report, which means that our analysis, like publications from the BLS, includes both legal and illegal immigrants. All figures for the total U.S. population in this report match seasonally unadjusted figures from the BLS.
Defining Labor Force Attachment
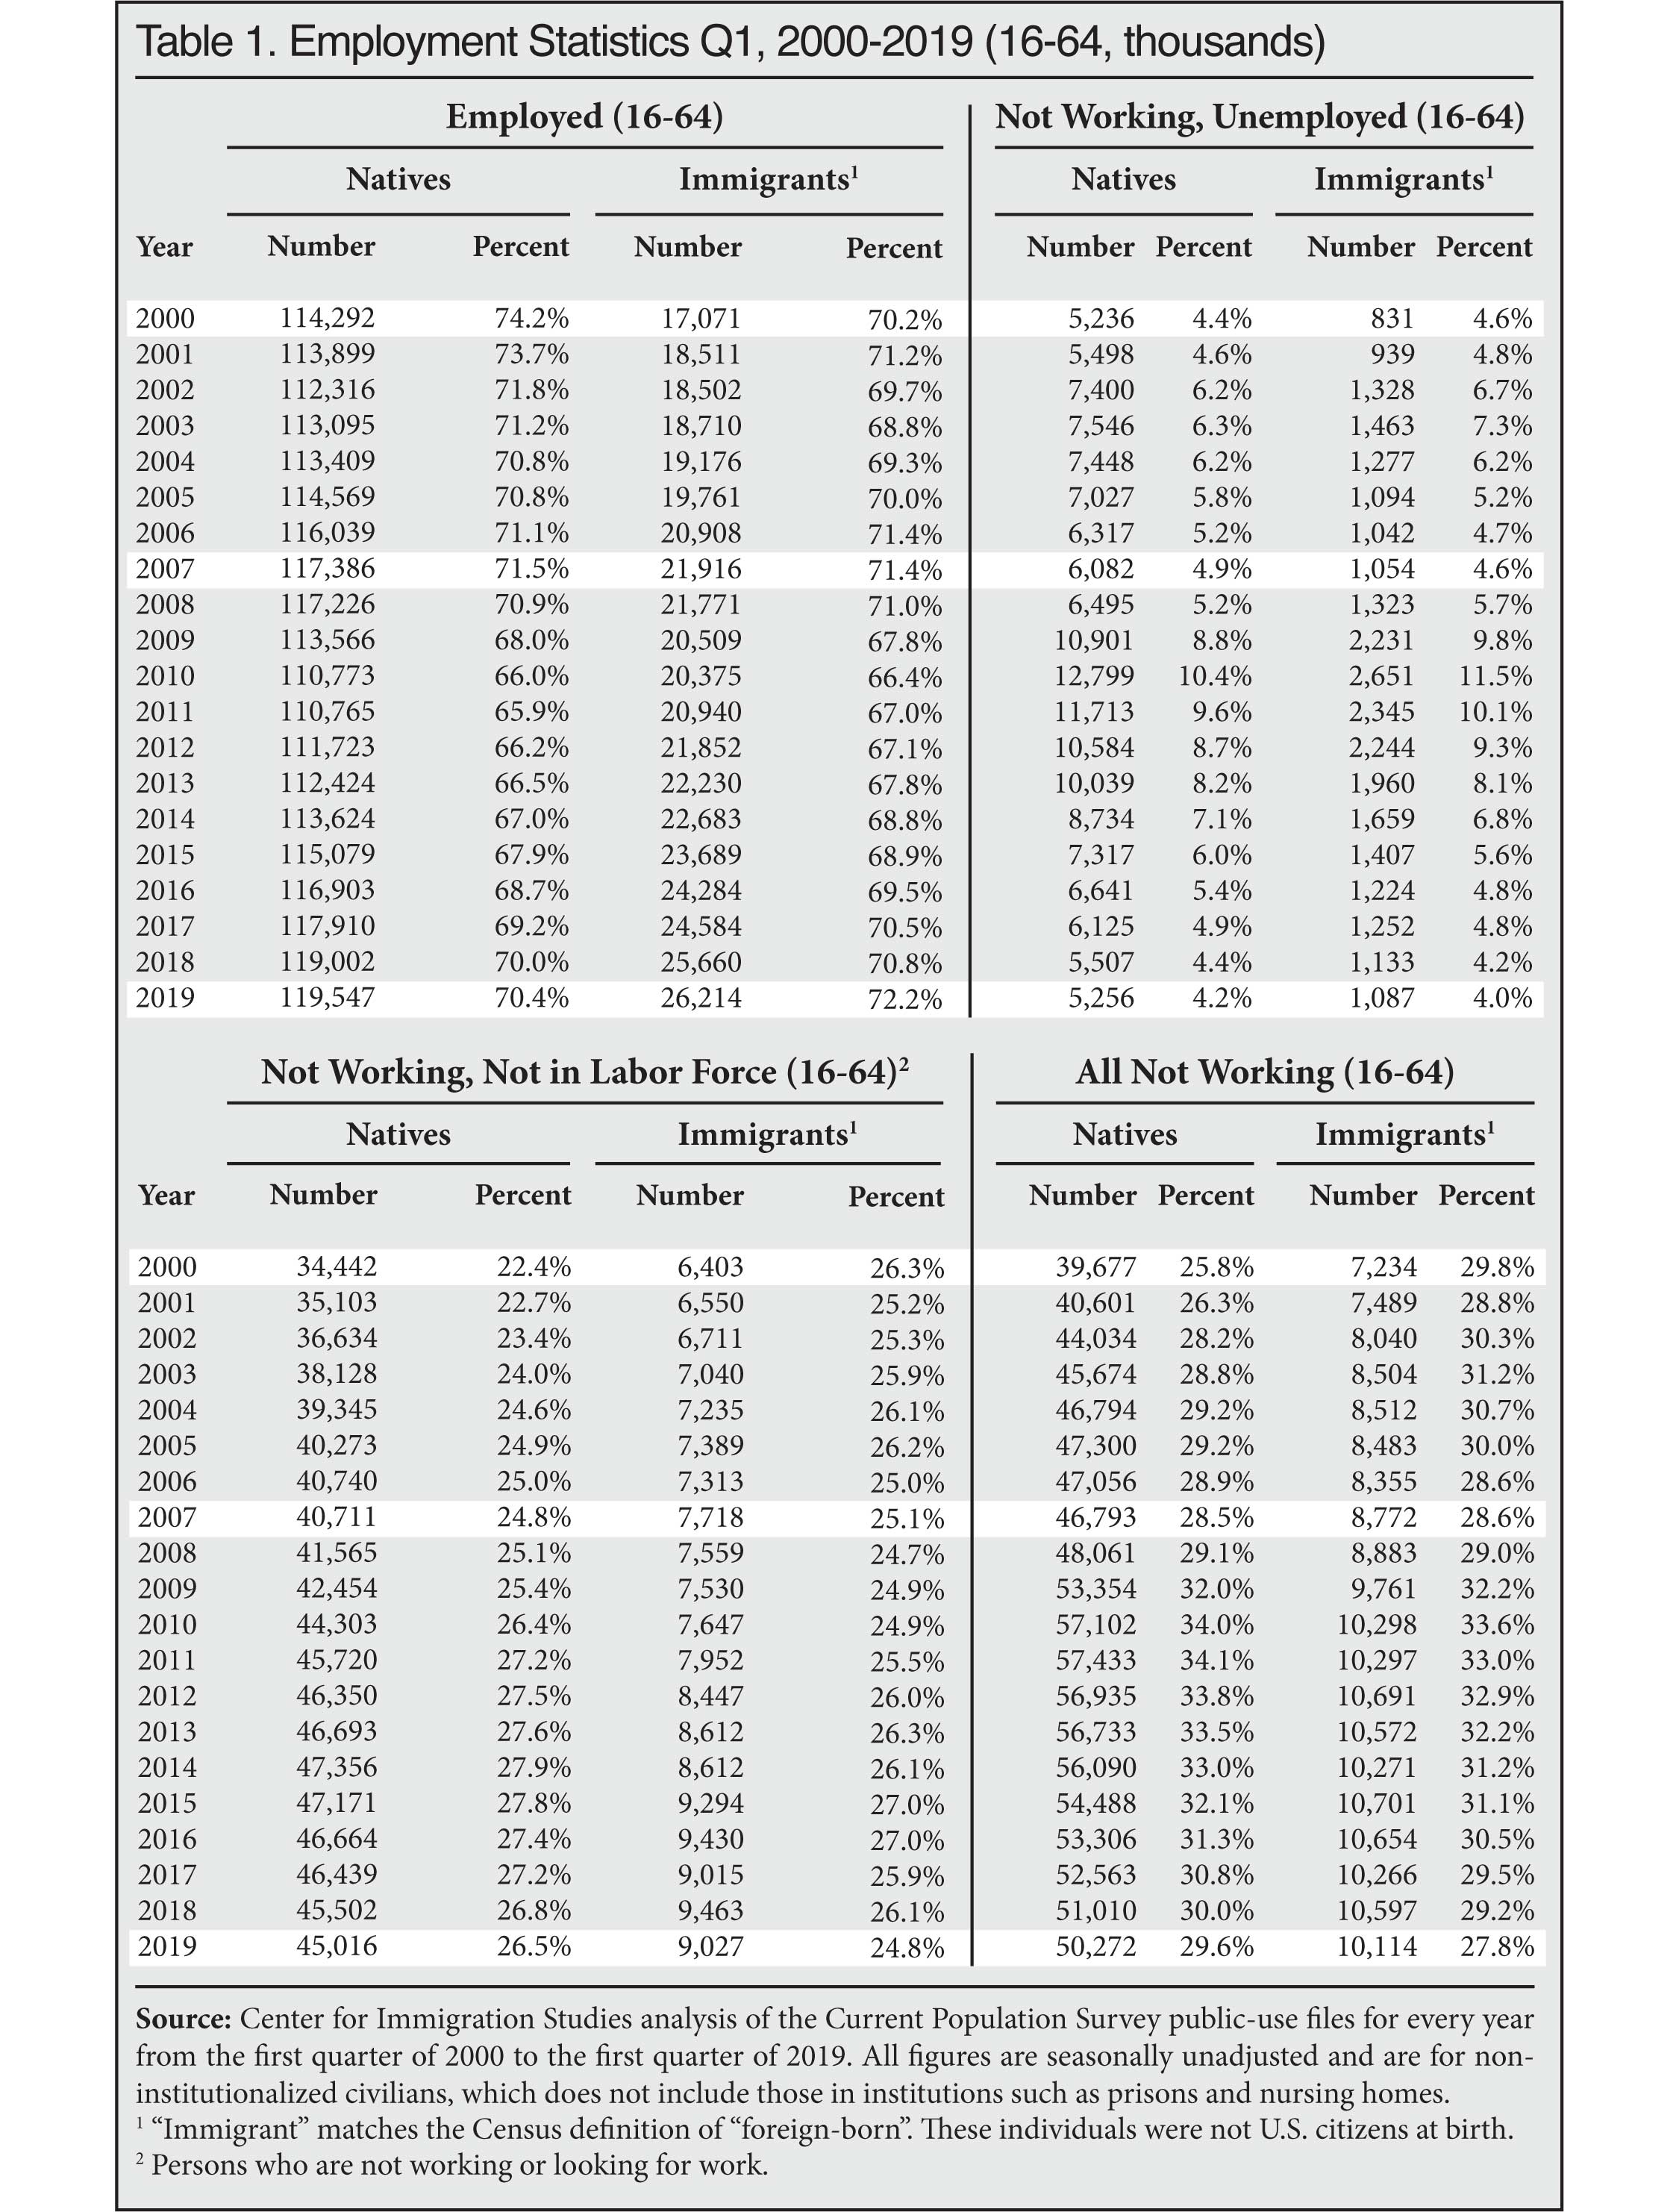
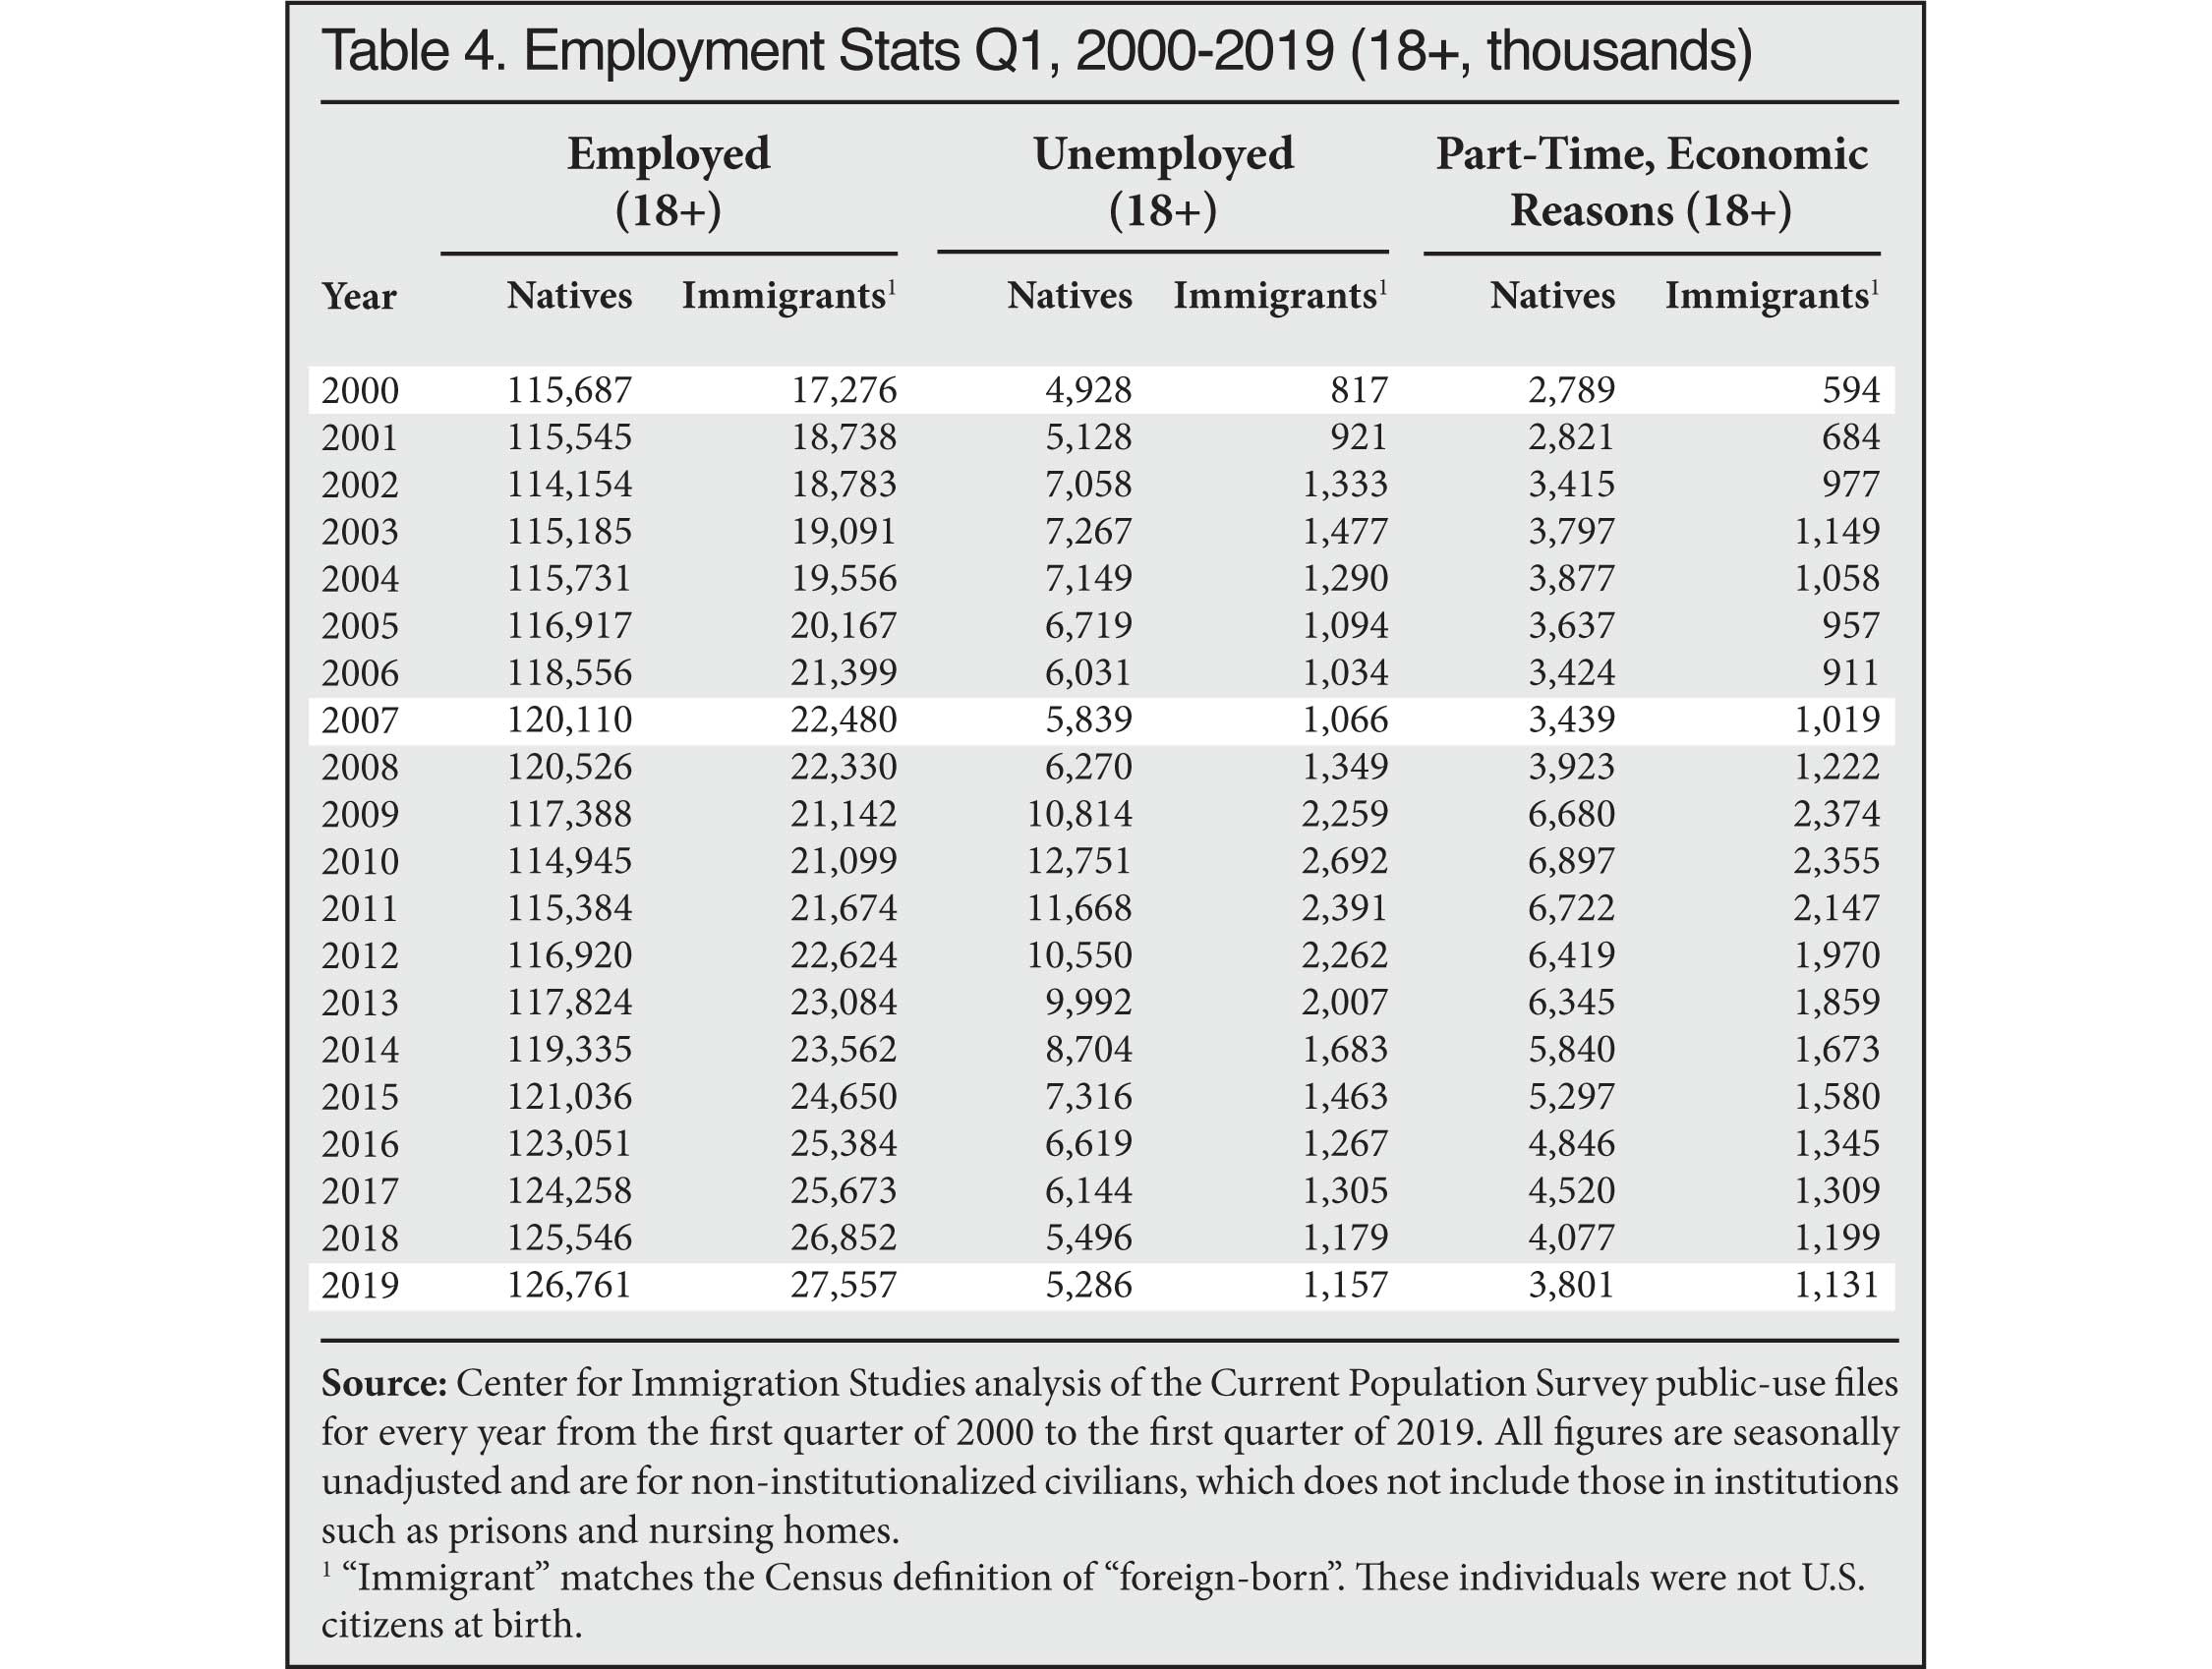
The Unemployed. The standard measure of unemployment, referred to as U-3, takes the number of people who report that they are not working and have looked for a job in the last four weeks and divides it by the number actually working plus those looking for work. The top halves of Tables 1, 3, and 5 report the number employed and the number unemployed for the first quarter of each year, 2000 to 2019. The left sides of Tables 7, 8, and 9 also report the U-3 unemployment rate in detail for different segments of the population in 2000, 2007, and 2019. We focus on 2007 and 2000 because they represent the peak years of the last two economic expansions.
The Labor Force. The labor force includes all those working or who have looked for work in the four weeks prior to the CPS. The bottom left of Tables 1, 3, and 5 show the number and share of those not in the labor force. When looking at the number and share not in the labor force, it is very common to report statistics only for those under age 65 because the overwhelming majority of those 65 and older do not work for reasons not related to economic conditions. The right sides of Tables 7, 8, and 9 report the number working in detail for different segments of the population in the first quarters of 2000, 2007, and 2019. The tables also report the share of people in the labor force, which is the inverse of those not in the labor force, as shown in Tables 1, 3, and 5. The right sides of Tables 7, 8, and 9 also report the employment rate. The employment rate is simply the share of people in each segment of the population who are working. Tables 10 through 13 report labor force participation statistics at the state level for the first quarters of 2000, 2007, and 2019.