Download a PDF of this Backgrounder.
Steven A. Camarota is the director of research and Karen Zeigler is a demographer at the Center.
This analysis confirms other recent research showing a dramatic increase in the education level of newly arrived immigrants over the last decade.1 However, our findings show that this increase has not resulted in a significant improvement in labor force attachment, income, poverty, or welfare use for new arrivals. This is true in both absolute terms and relative to the native-born, whose education has not increased as dramatically. In short, new immigrants are starting out as far behind in 2017 as they did in 2007 despite a dramatic increase in their education. Though more research is needed, we explore several possible explanations for this finding.
All figures are for persons 25 to 65; "new immigrants" have been in the United States five years or less.
- The share of newly arrived immigrants with at least a college degree increased from 34 percent in 2007 to 49 percent in 2017; and the share without a high school diploma fell from 34 percent to 16 percent. The education of natives also increased, but not nearly as much.
- Despite the dramatic increase in new immigrants' education levels, the share of new immigrants in the labor force (working or looking for work) was 73 percent in 2007 and 67 percent 2017. Native labor force participation also fell, from 78 to 76 percent, but because it did not fall as much, the gap with immigrants actually widened.
- The median income of new arrivals was $18,402 in 2017, slightly lower than in 2007. Native income also fell slightly, so the gap between new immigrants and natives stayed about the same, with natives' income still about twice that of new immigrants.
- The share of new immigrants in poverty was slightly higher in 2017 than in 2007, and the gap with natives widened slightly. Overall, new immigrants remained twice as likely to live in poverty as natives despite immigrants' much greater increase in education.
- In 2007, 6 percent of new immigrants were on Medicaid; by 2017 it was 17 percent — an 11 percentage-point increase. The share of natives on Medicaid increased from 7 percent to 13 percent — a six percentage-point increase. New immigrants are now more likely to use the program than natives.
- The share of new immigrants living in households receiving food stamps roughly tripled from 4 percent to 13 percent from 2007 to 2017. Among natives, food stamp use also increased, but not as much, from about 6 percent to 10 percent. New immigrants are now more likely to live in a household on food stamps.
Possible Explanations for Findings
- Most socioeconomic measures were no better in 2017 than in 2007 for both new immigrants and natives across all education levels. This is an indication that both were impacted by the Great Recession. But it does not explain why the dramatic increase in immigrant education relative to natives did not result in a substantial narrowing of the gap between the two the groups.
- The lower share of new immigrants who are in the labor force (working or looking for work) may be an indication that the economy does not absorb new entrants as easily as it did a decade ago. Since the newly arrived are all new entrants to the job market, it may explain why their higher education levels have not translated into a dramatic improvement in measures of success.
- The decline in the socioeconomic success among college-educated new immigrants is a particularly striking finding. This may be an indication that the actual marketable skills of new college-educated immigrants are not as high as they were in the past.
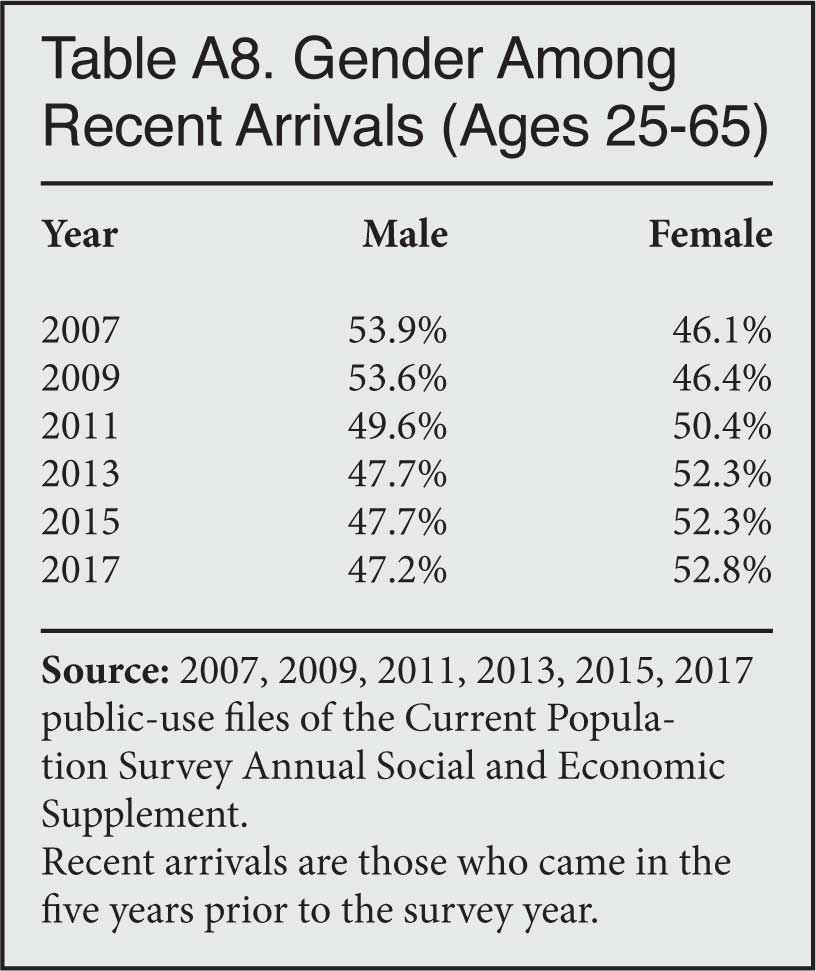
- The share of new arrivals who are women increased from 46 percent in 2007 to 53 percent in 2017, but this does not seem to explain the failure of new immigrants to converge with natives in terms of labor force participation or welfare use. However, it does help to explain the lack of convergence with regard to income. Immigrant men's income did rise significantly relative to native men, while immigrant women's income did not increase.
- One cause for the surprising lack of improvement among newly arrived immigrants that should be ruled out is a large increase in illegal immigrants. All the evidence indicates that illegal immigrants have become a smaller share of new arrivals.
- An increase in refugee resettlement is also an unlikely cause for our findings. When we remove the primary refugee-sending countries from the data, it makes almost no difference to the findings. Also, refugees are only 3 percent to 6 percent of all new arrivals.
- The government estimates that the number of long-term temporary visa holders in the country over age 25 was no higher in 2015 than in 2008, so it seems unlikely that the inclusion of temporary visitors in the data accounts for our findings. Moreover, long-term visitors should make some measures of well-being look better, not worse. For example, temporary visitors are barred from welfare. In addition, guestworkers, diplomats, and most exchange visitors over the age of 25 should have high rates of labor force participation and relatively high incomes. Finally, foreign students may have low rates of work or low incomes; however, our focus on new arrivals ages 25 to 65 excludes most students.
Introduction
The gap in socioeconomic measures of well-being between newly arrived immigrants and natives is not by itself all that surprising. Immigrants are new to America and it takes time to adjust to life in their new home. What is surprising is that while Census Bureau data shows that newly arrived immigrants were much more educated in 2017 than in 2007, they do not seem to be much better off. In this report, new arrivals are defined as having lived in country for no more than five years.2 Analysis of this kind is straightforward because the Census Bureau in its surveys asks immigrants when they came to the United States. Immigrants (also called the foreign-born) are persons living in the United States who were not American citizens at birth.3 In this report we use the terms "recent" and "new" interchangeably to describe immigrants who have lived in the United States for five or fewer years.
The dramatic increase in immigrant education relative to natives reverses a long-standing trend that dates back to at least 1970. There is a significant body of research showing that from 1970 to at least 2000 each new wave of immigrants was less educated relative to natives, though for both groups education levels did increase in absolute terms. The decline caused a significant deterioration in the relative economic standing of immigrants.4
Educational attainment has been and remains one of the best predictors of success in modern America for immigrants and natives alike. Higher levels of education are very much associated with higher average incomes, higher rates of labor force attachment, and lower rates of poverty and welfare use.5 However, the findings of this analysis show that despite a dramatic increase in the educational attainment of new arrivals, measures of socioeconomic success show little to no improvement.
To be sure, the Great Recession profoundly impacted every measure of socioeconomic success. But our findings show that even when compared to the native-born, who were also adversely impacted by the recession, the dramatic rise in education among new arrivals has not reduced the gap with natives. New immigrants are starting out as far behind as they did in the past, even though their education levels have increased much more than those of natives.
While additional analysis is clearly needed to explain this finding, we explore some possible reasons for this development. One surprising finding is that new immigrants are doing somewhat worse relative to their native-born counterparts with the same level of education than was the case a decade ago. Part of the reason for this may be that the U.S. economy does not absorb new arrivals as it once did. It is also possible that the actual skills of more educated new immigrants are not as marketable as those of their counterparts a decade ago. If this is correct, then it would mean immigrants are more educated, but their actual skills are not as high as they seem "on paper". However, more research is needed to confirm this finding.
In terms of public policy, the failure of increased immigrant education to translate into increased immigrant prosperity means that if we want immigrants who are likely to find jobs, have high incomes, pay a lot in taxes, and do not use means-tested programs, then selecting them based solely on their education may be insufficient to ensure this outcome. We may have to look at other marketable skills like technical training and knowledge of English if we want a flow of immigrants who will do well. Of course, there are many possible goals of immigration policy and a flow of immigrants who are able to earn high incomes or have low welfare use is not the only thing to consider when formulating policy.
Data Source
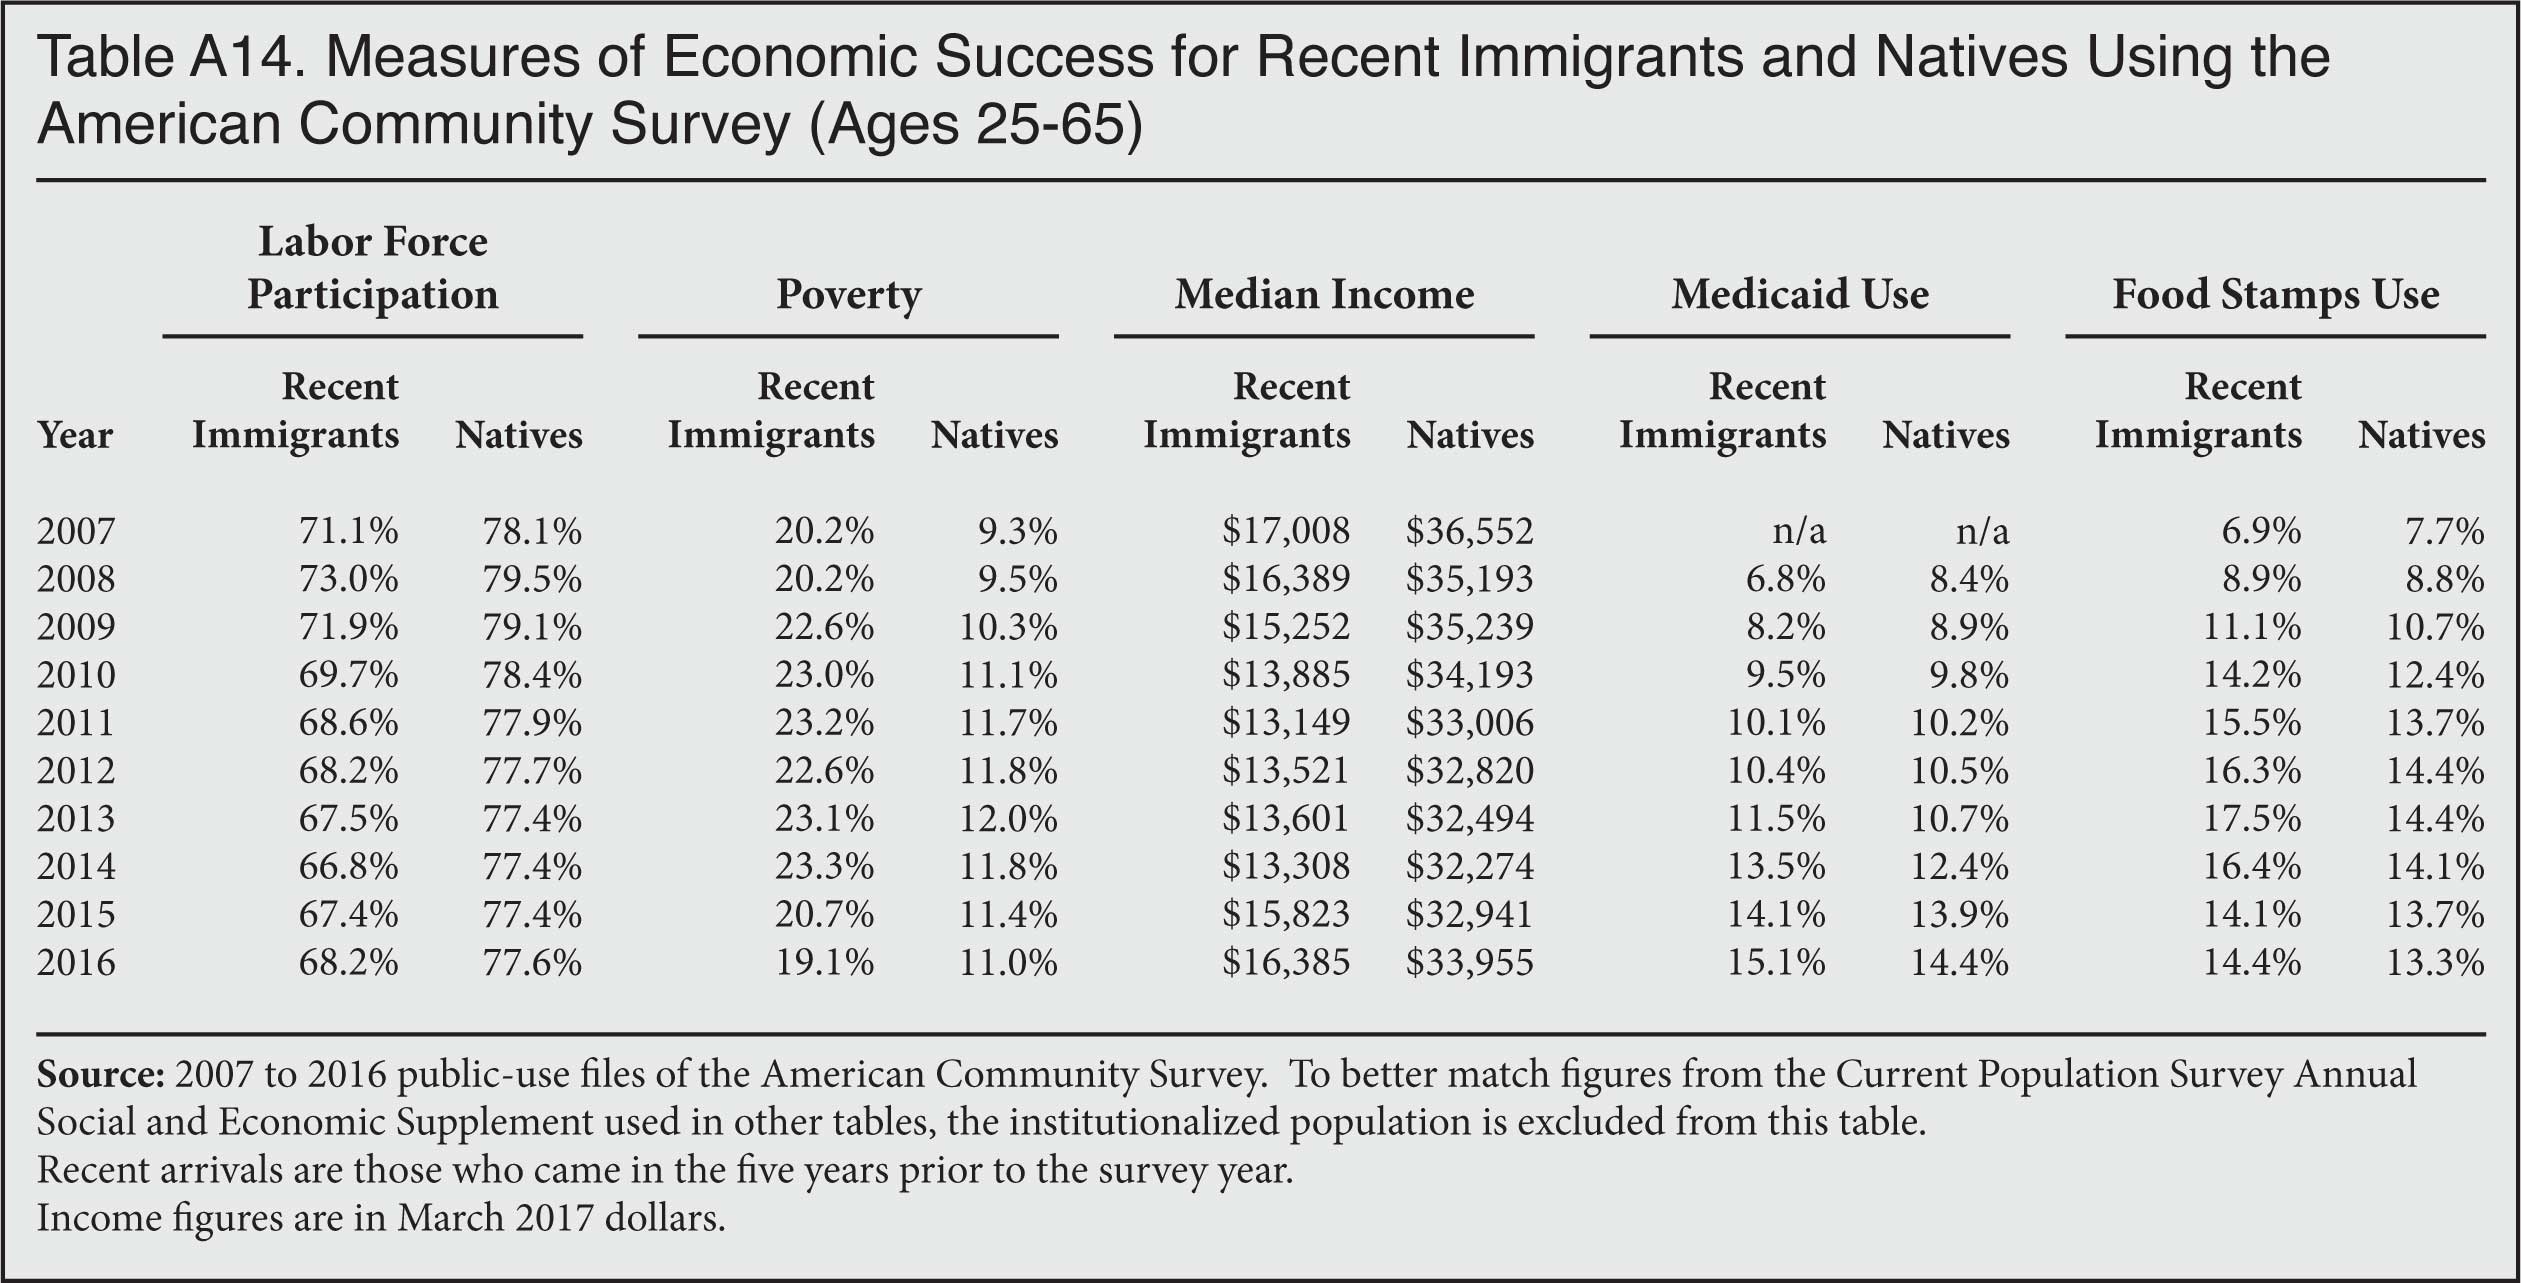
The data for this Backgrounder comes primarily from the public-use files of the March Current Population Survey (CPS), also referred to as the Annual Social and Economic Supplement or CPS ASEC. (We refer to the CPS ASEC as just the CPS later in this report) We also report some additional analysis with the bureau's American Community Survey (ACS) at the end of this report. In general, the results from the ACS and CPS are very similar, though the most recent data from the ACS is through 2016 while the CPS has data for 2017.6 The CPS ASEC includes an extra-large sample of minorities and has long been used to study immigrants. While smaller than the ACS, the CPS ASEC does include about 200,000 individuals, more than 26,000 of whom are foreign-born.7 The CPS ASEC contains more questions than the ACS and allows for a more detailed analysis in some areas.8 Both data sources include those in the country illegally.
In order to preserve anonymity, the Census Bureau groups responses to the year-of-arrival question into multi-year cohorts in the public-use CPS. Every other year the Census Bureau changes these groupings. In the odd numbered years it is possible to examine those who have lived in the country for no more than five years. For this reason, we examine new arrivals from 2007 through 2017 in the odd years, with 2017 as the most recent data available. The year 2007 is a good starting point because the CPS ASEC is collected in March and the Great Recession did not begin until the end of that year. For the purposes of this analysis, new arrivals in 2017 are those who indicated they came to America in 2012 to 2017, in 2015 it means they arrived in 2010 to 2015, in 2013 it is those who arrived 2008 to 2013, and so on.9 Put a different way, new arrivals are those who have lived in the country for about five years or less. We focus on new arrivals ages 25 to 65, as most people have completed their education by age 25 and persons in this age group are typically employed and earning income. While we focus on those ages 25 to 65, we report statistics for other age groups in the appendix.10
Key Findings
A Significant Increase in Education. Figure 1 reports the share of immigrants ages 25 to 65 who have lived in the country for no more than five years and have not graduated high school. It also reports the share of natives with this education level in this same age group. The figure shows the dramatic decline in the share of new immigrants who have not graduated high school. This is true in absolute terms and relative to natives, whose high school completion rate did not increase as much.
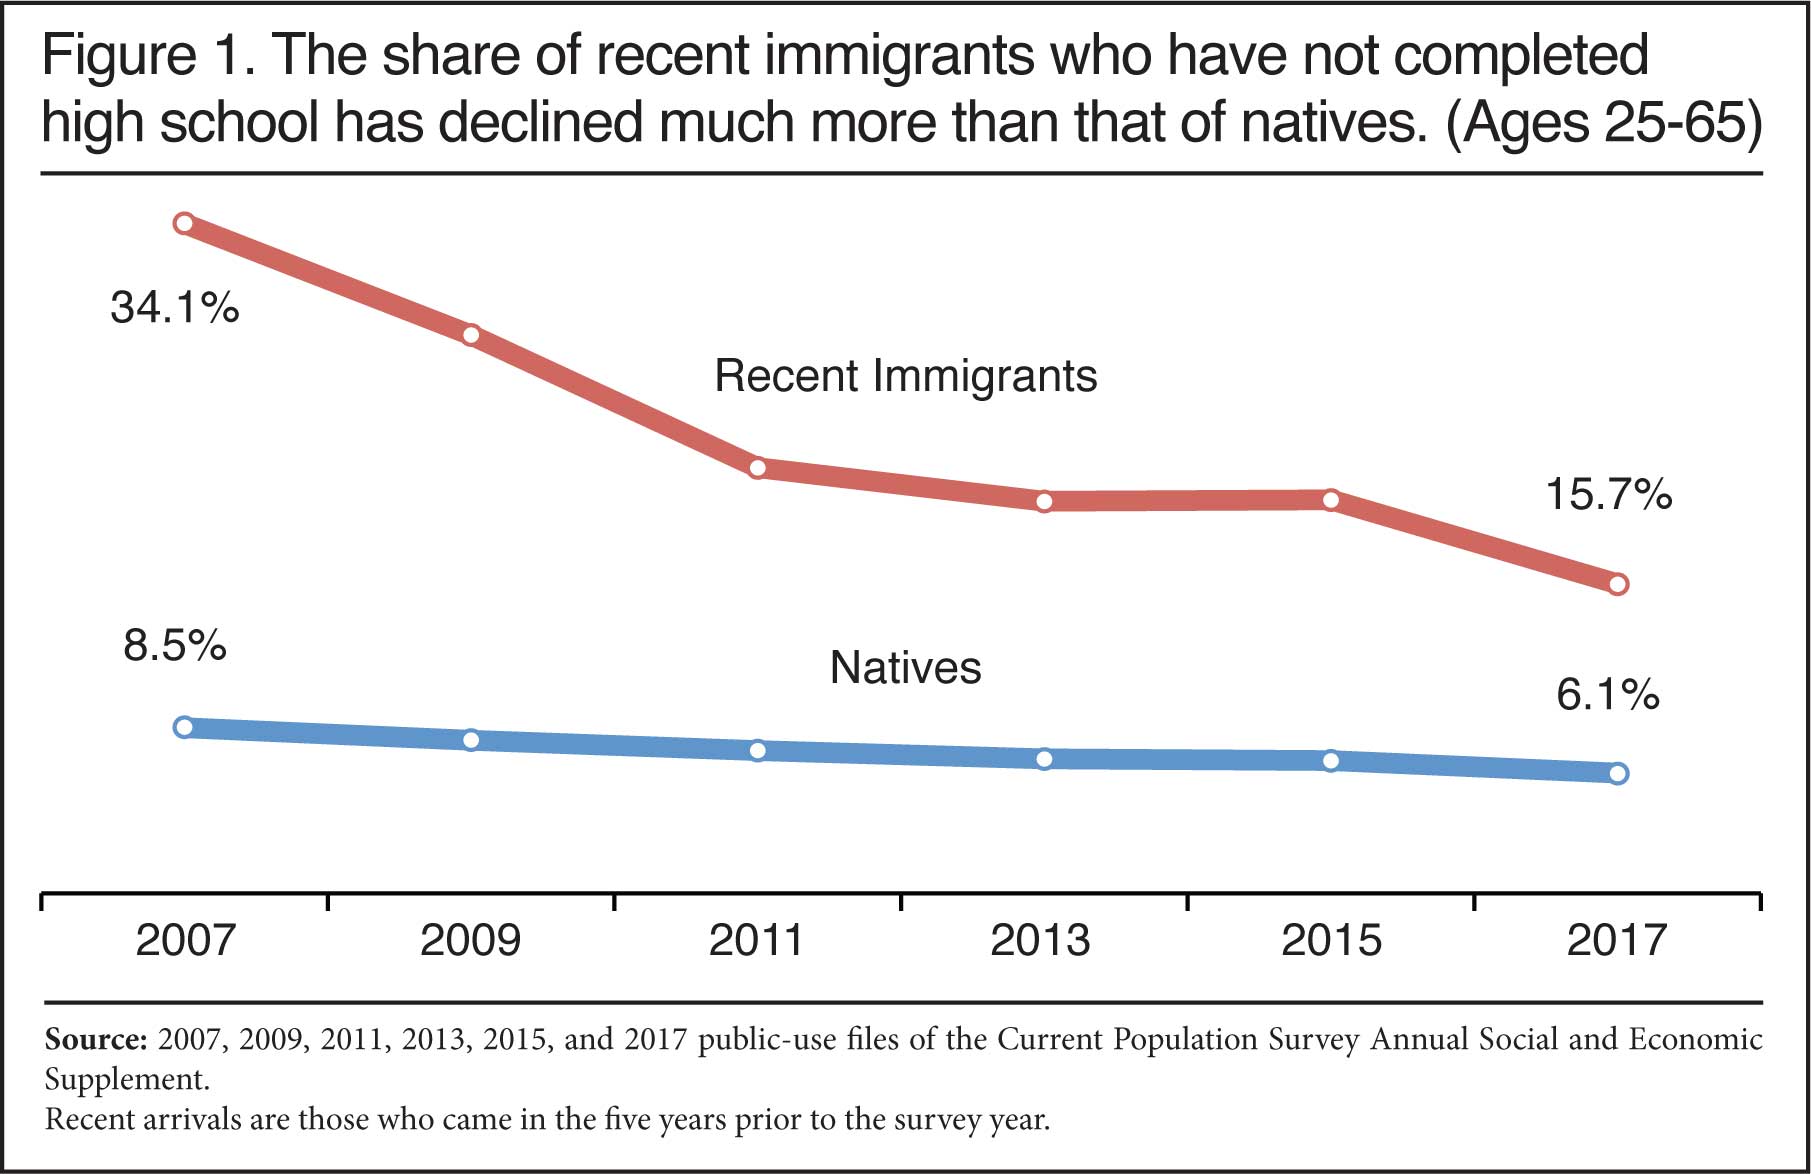
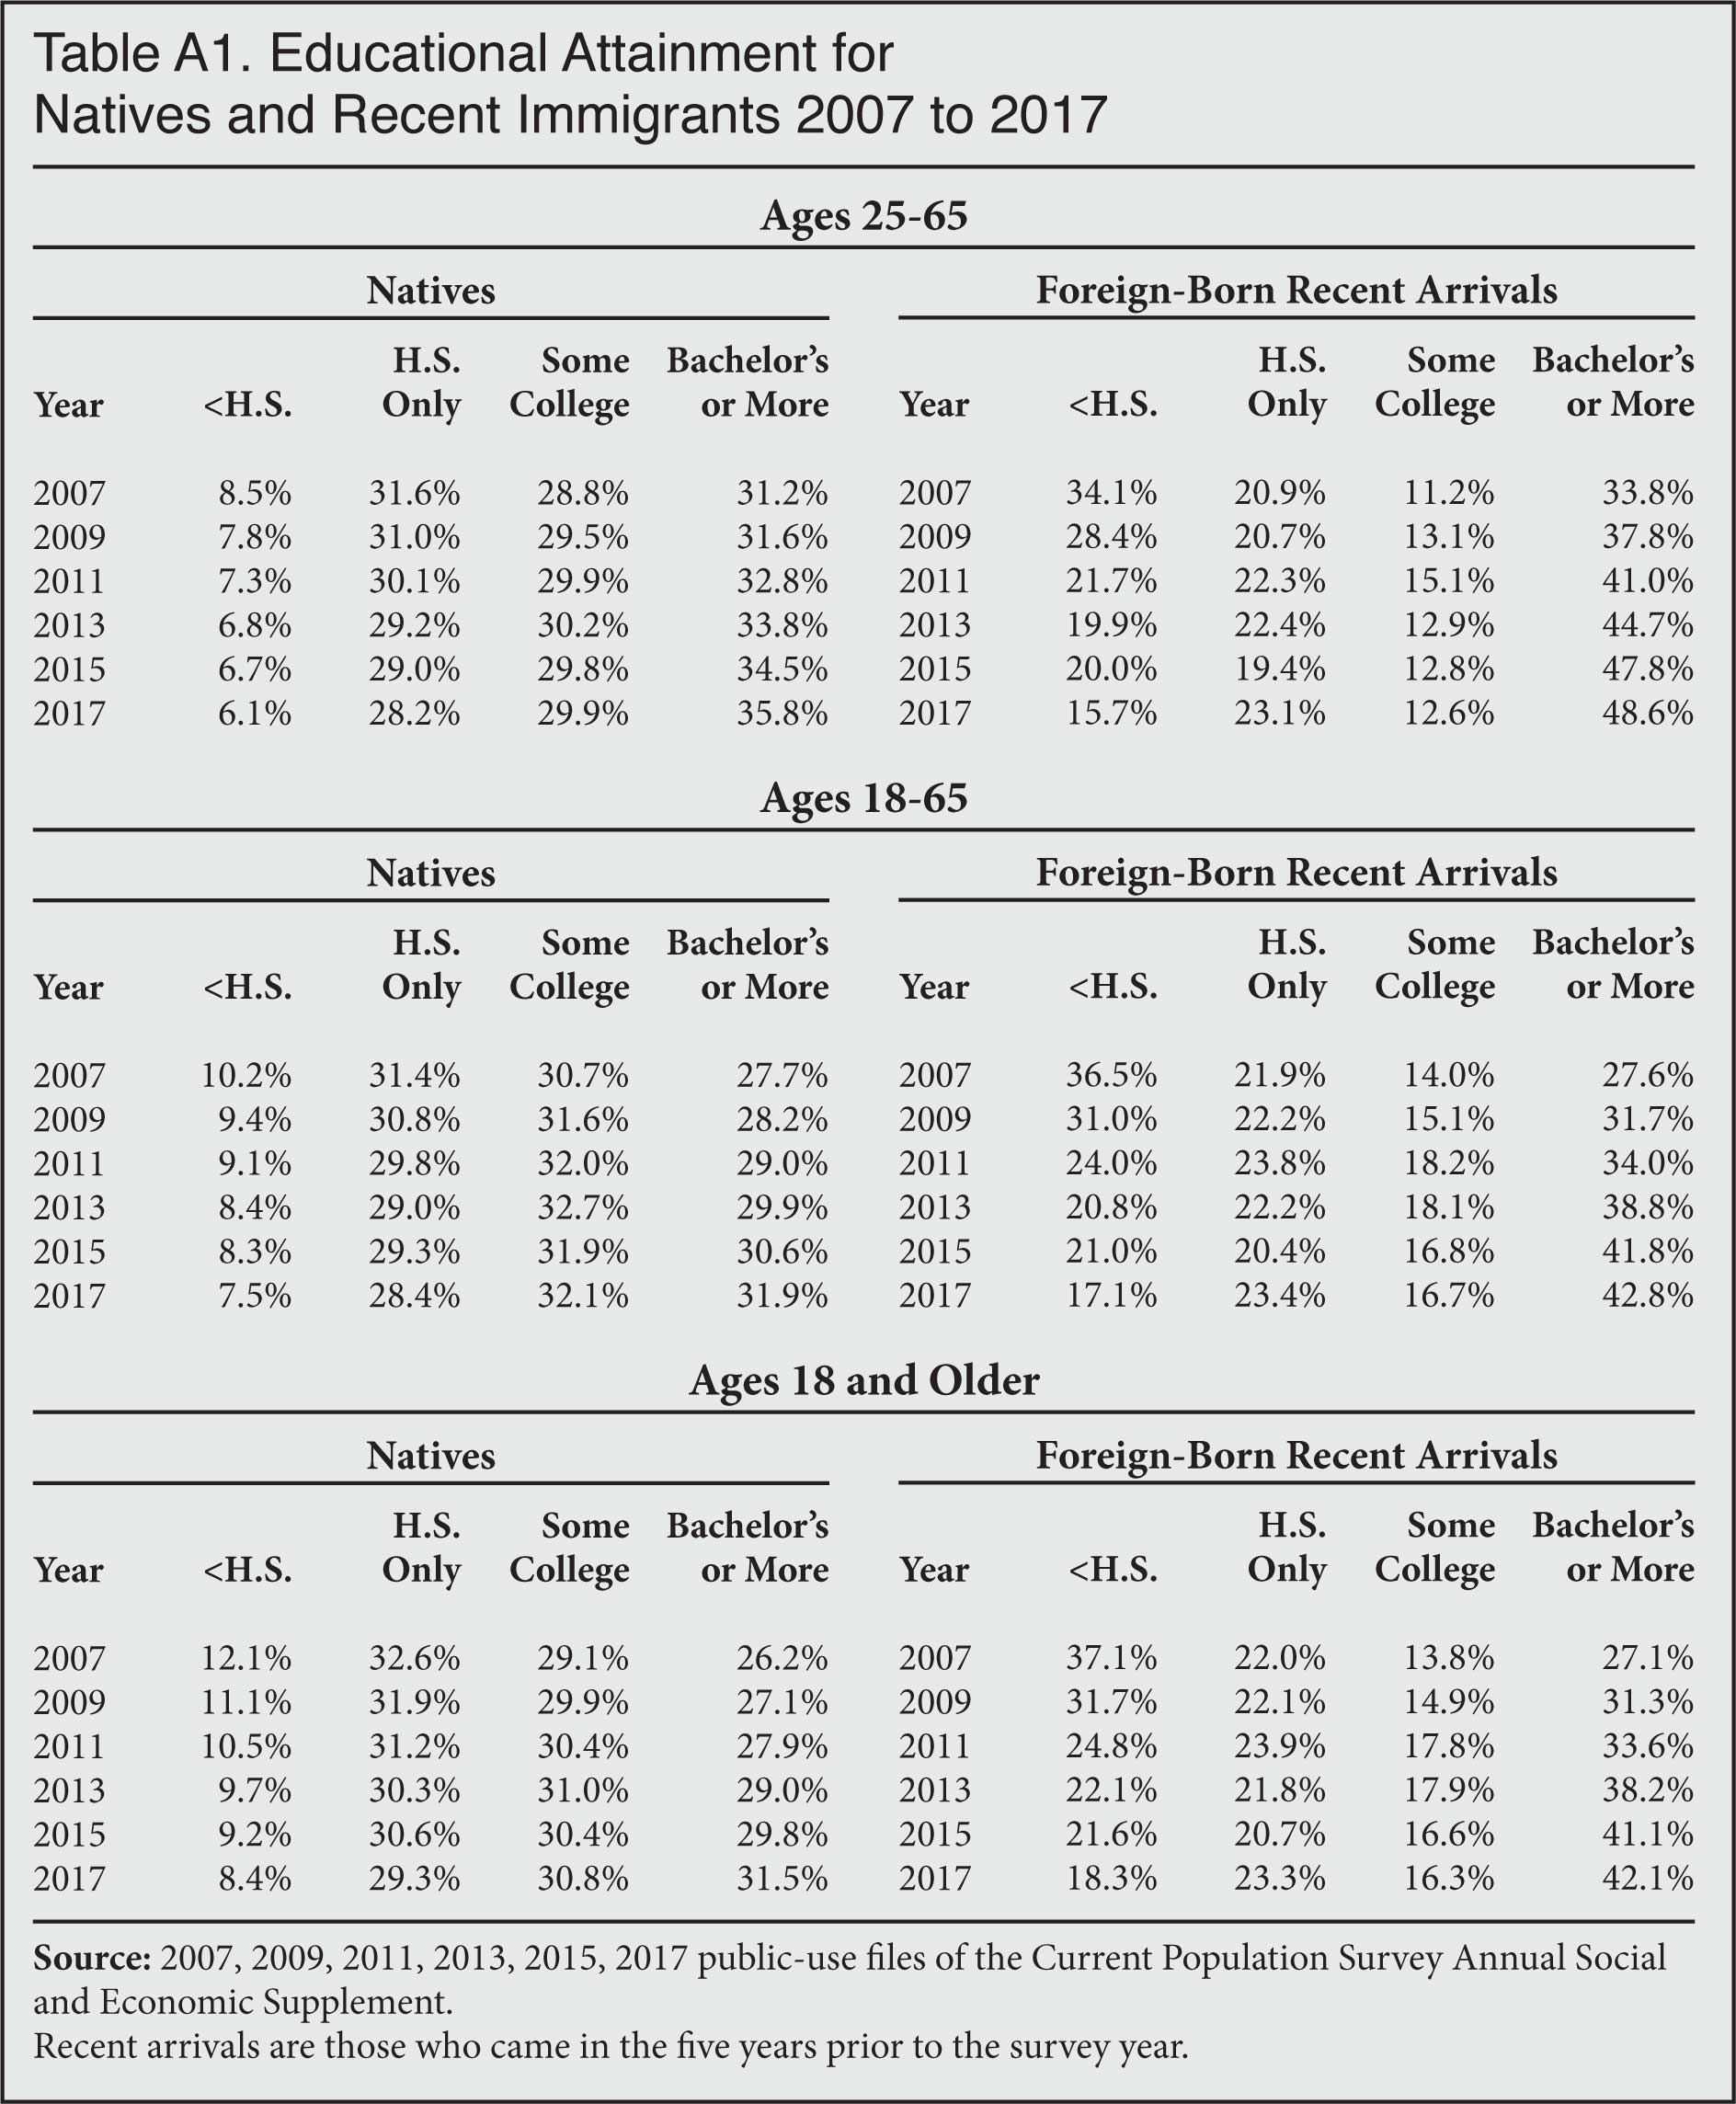
Figure 2 shows the share of new immigrants and natives who have at least a bachelor's degree. Table A1 in the Appendix reports more detailed educational information for natives and newly arrived immigrants, including other education levels, those ages 18 to 65, and those 18 and older. Other age groups in Table A1 show the same trends as those in Figures 1 and 2.
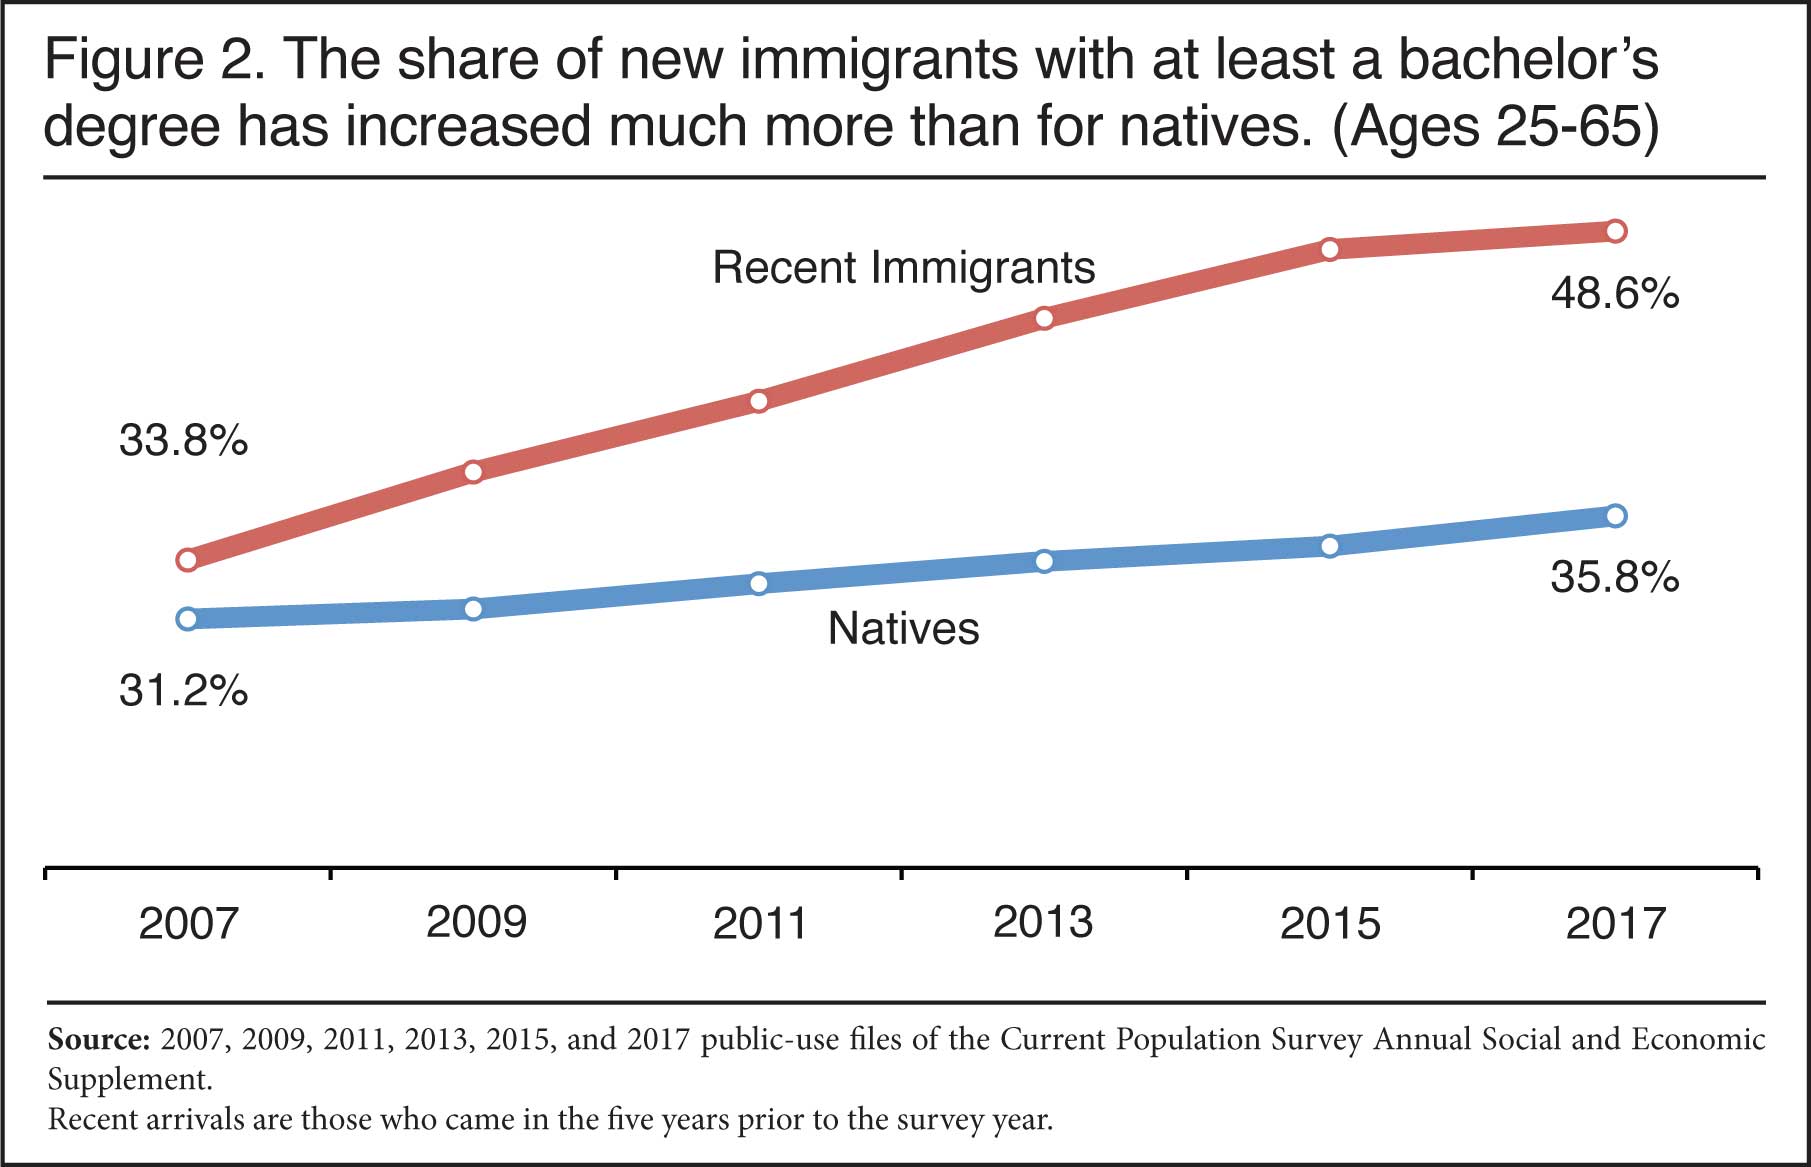
Figures 1 and 2 and Table A1 show that while both immigrants and natives have become more educated, the educational attainment of new immigrants has increased much more dramatically than among natives since 2007. As a result, new immigrants are now much more likely to have completed college than natives. The share of immigrants without a high school diploma is still a good bit higher than among natives, but the gap has narrowed significantly over the last decade. There is simply no question: Today’s new immigrants are much more educated than were the newly arrived a decade age.
It is important to remember that the significant increase in the education level of new immigrants has only a small immediate impact on the overall education level of the existing stock of immigrants, who are much more numerous relative to those who just came to America.11 Nonetheless, if the higher education level of new arrivals persists over time, the overall immigrant population will increasingly reflect this fact.
A significant increase in education should have resulted in a significant improvement in their socioeconomic well-being. However, as the next section shows, it would be hard to describe the socioeconomic well-being of new immigrants as substantially improved relative to natives or in absolute terms over the last decade.
Figures 3 through 8 report some of the most common measures of economic success among new immigrants as well as natives. Again, the immigrant figures are for those who had lived in the United States for five years or less at the time of the survey and were ages 25 to 65. For the immigrants, it means they all arrived in the United States as adults. The figures show that despite their dramatic increase in education, the labor force attachment, poverty rate, income, and welfare use of new immigrants were not, for the most part, meaningfully better in 2017 than in 2007. This is especially true relative to the native-born.
Labor Force Attachment. Labor force participation for new immigrants and natives in Figure 3 shows some variation with the economy, but overall new immigrants are less attached to the labor market in 2017 than were their counterparts in 2007. (Labor force participation is the share of working-age people holding a job or looking for one.) Native-born Americans ages 25 to 65 are also less likely to be in the labor force in 2017 than in 2007, but the decline was not nearly as large. Immigrant labor force participation was 5.8 percentage points lower in 2017 than in 2007, while for natives it was only 1.8 percentage points lower. As a result, the gap in labor force participation between new immigrants and natives was 5.5 percentage points in 2007; in 2017 it was 9.5 percentage points. While more educated people in general are still more likely to be in the labor force, Figure 3 shows that the dramatic increase in new immigrant education levels did not have a corresponding impact on the share working or looking for work.
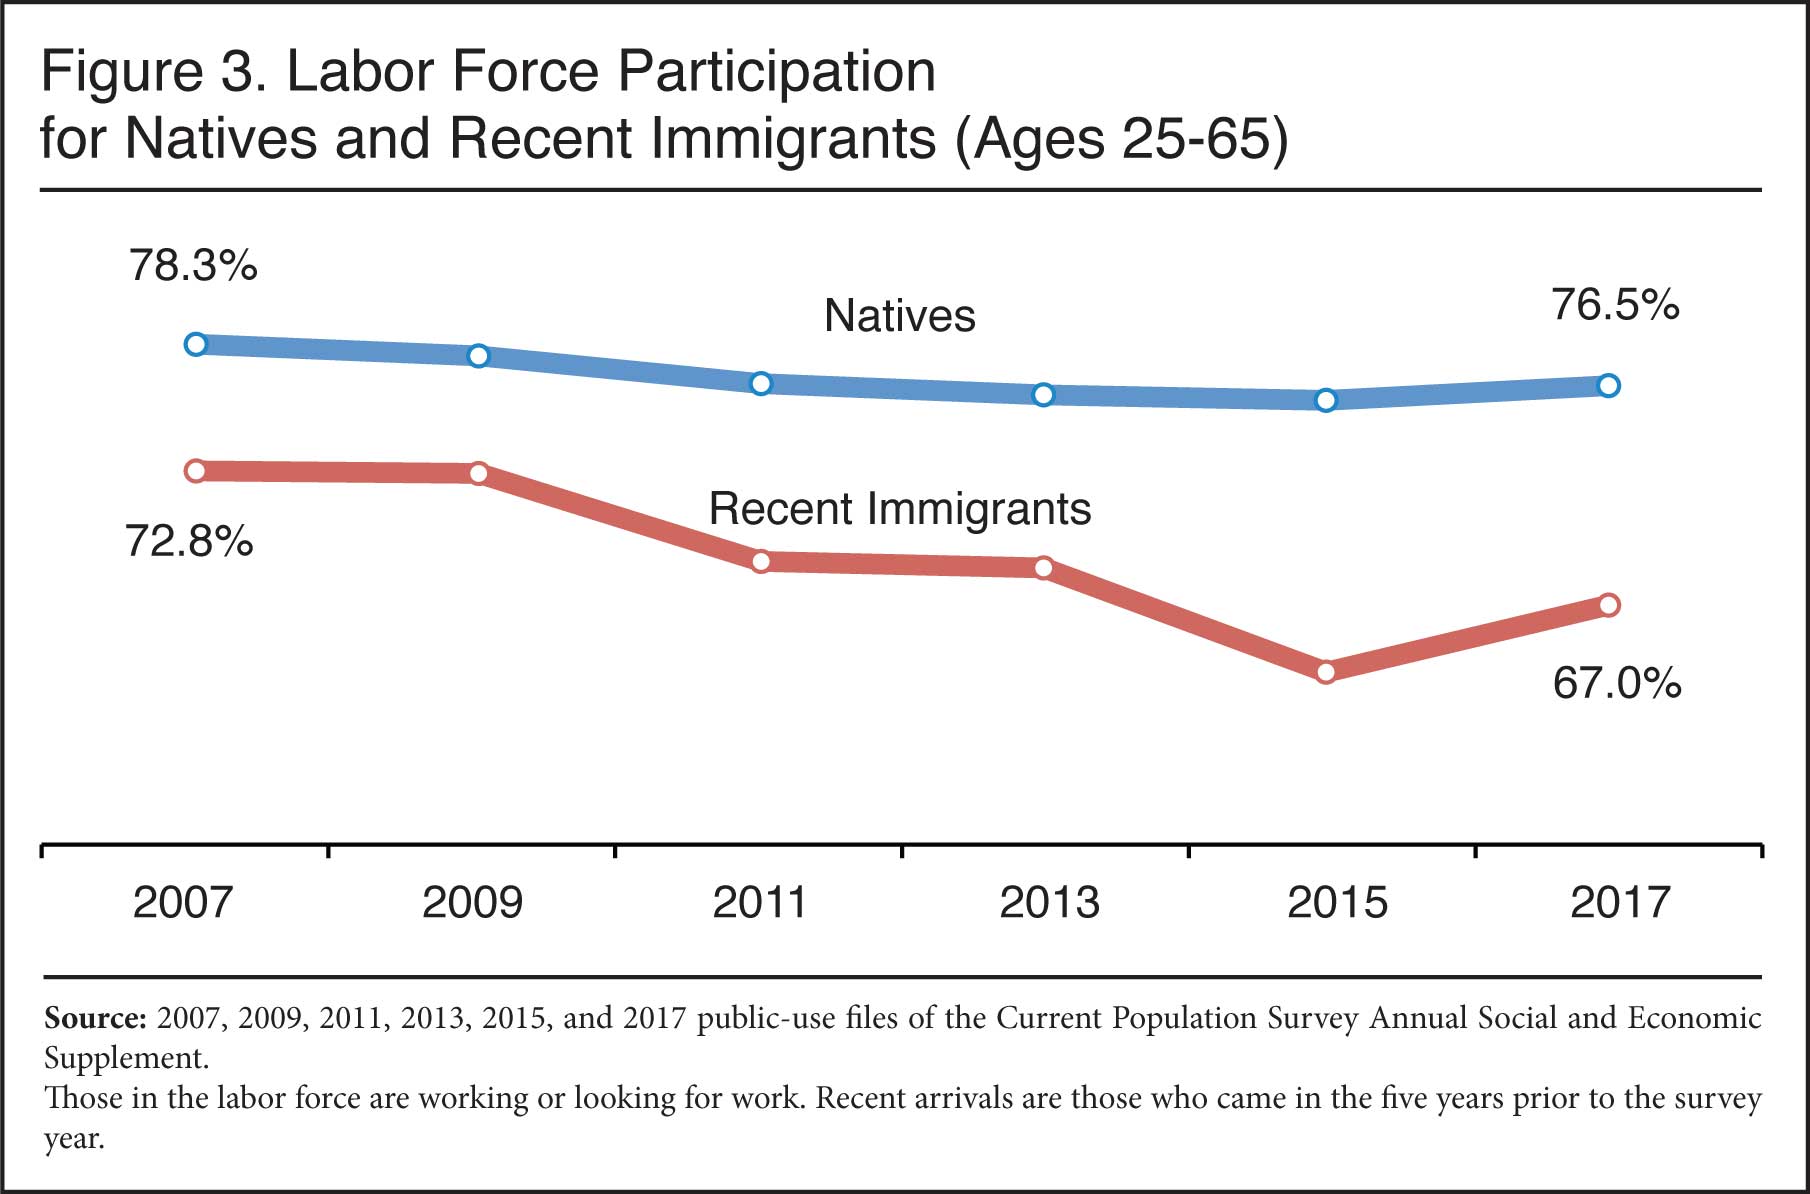
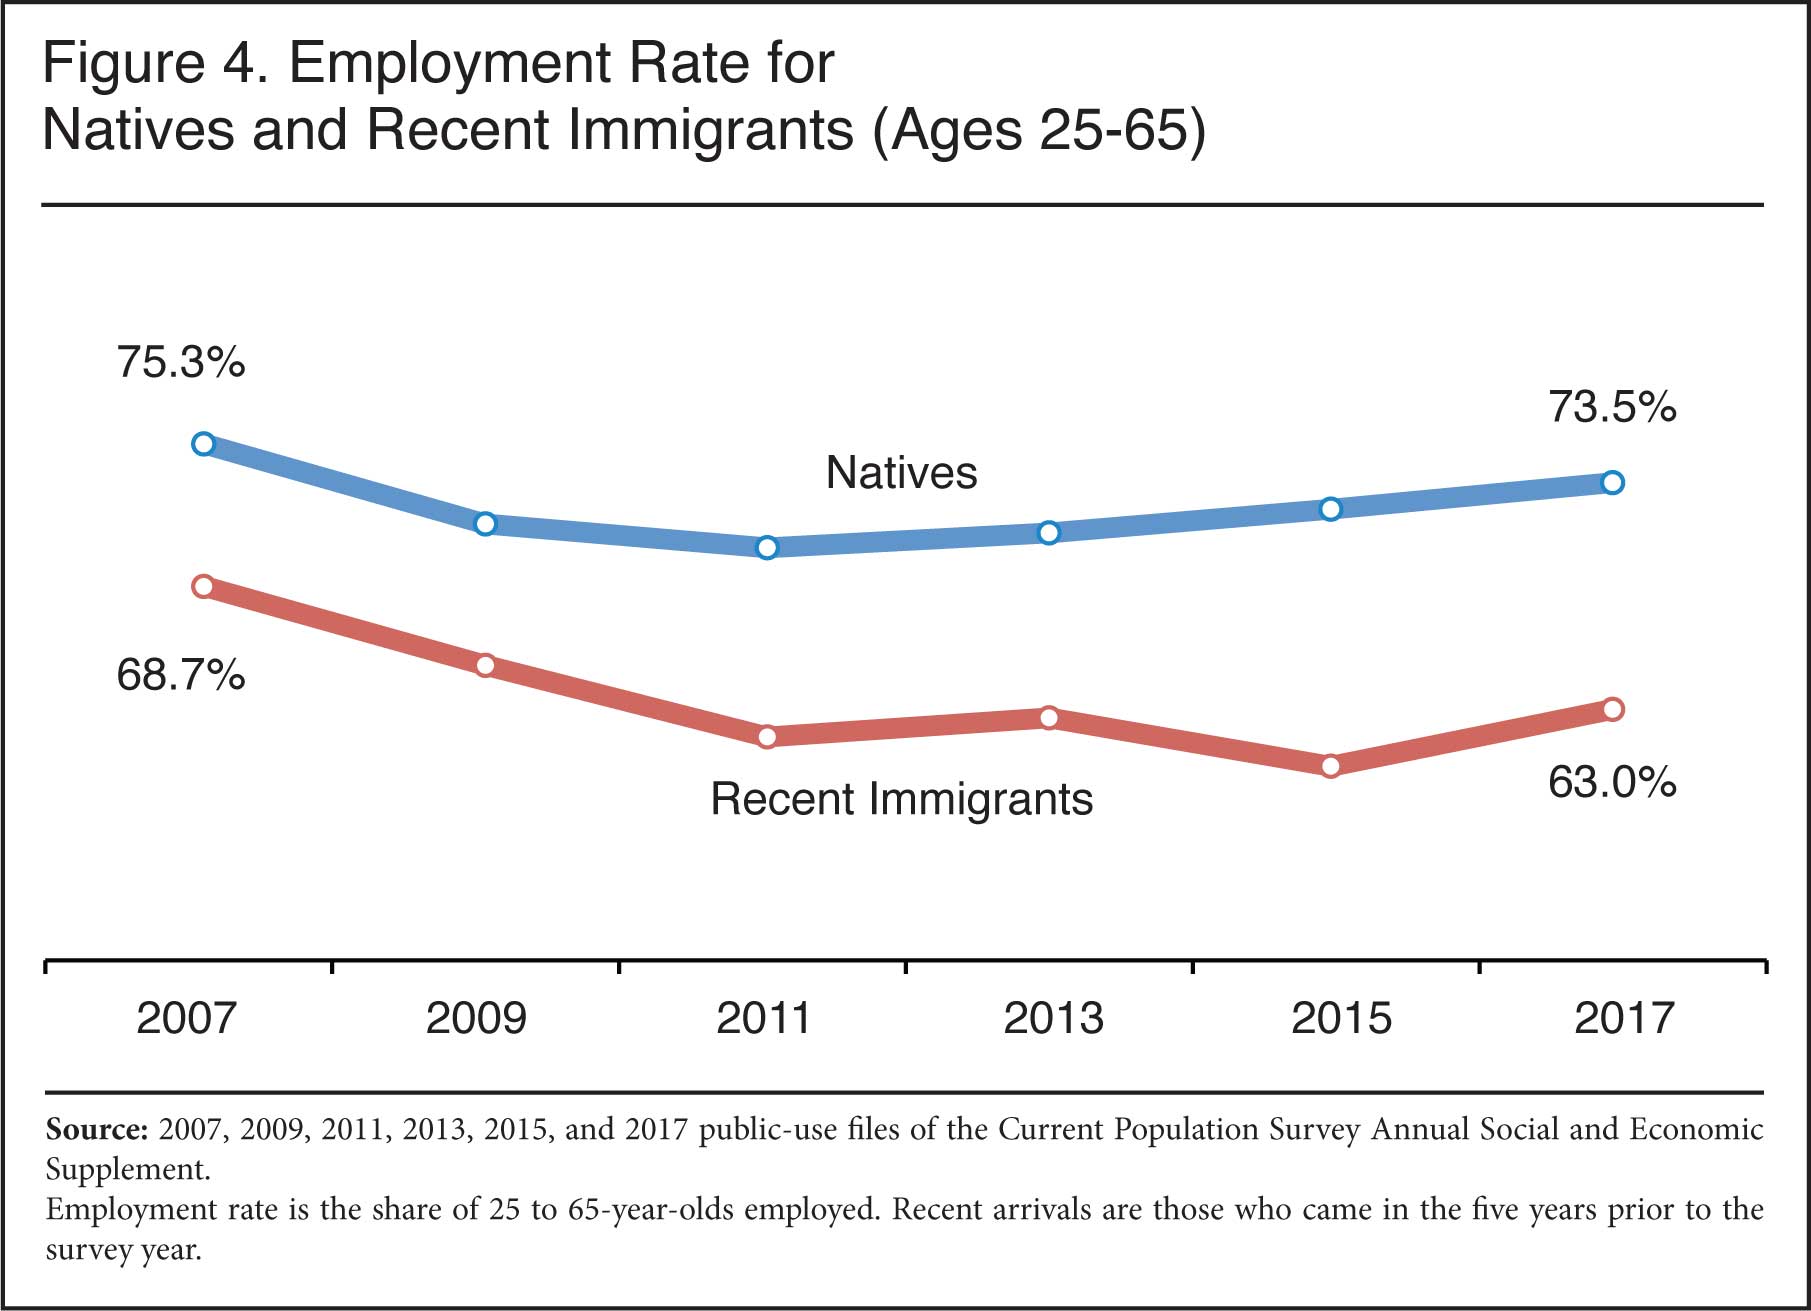
Figure 4 reports the employment rate of new immigrants and natives. (The employment rate is the share of working-age people holding a job.) Figure 4 exhibits the same trends as labor force participation. The gap between employment rates between natives and new immigrants was 6.6 percentage points in 2007 and 10.5 percentage points in 2017. To be sure, labor force participation and employment rates are cyclical, so the Great Recession had an impact on the share of both natives and new immigrants working or in the labor force. But the gap with natives is still larger than it was in 2007, eight years into the economic recovery.
Poverty and Income. The share of new immigrants and natives in poverty shown in Figure 5 indicates that, like employment, poverty fluctuates with the economy.12 Overall, new immigrants have fared about the same as natives. The share of new immigrants in poverty in 2017 was about two percentage points higher than in 2007, while the share of natives in poverty was about one percentage point higher. The poverty gap between natives and newly arrived immigrants, which was already very large, widened slightly during the recession and has since narrowed some. But overall the share of new immigrants in poverty remained about twice that of natives.
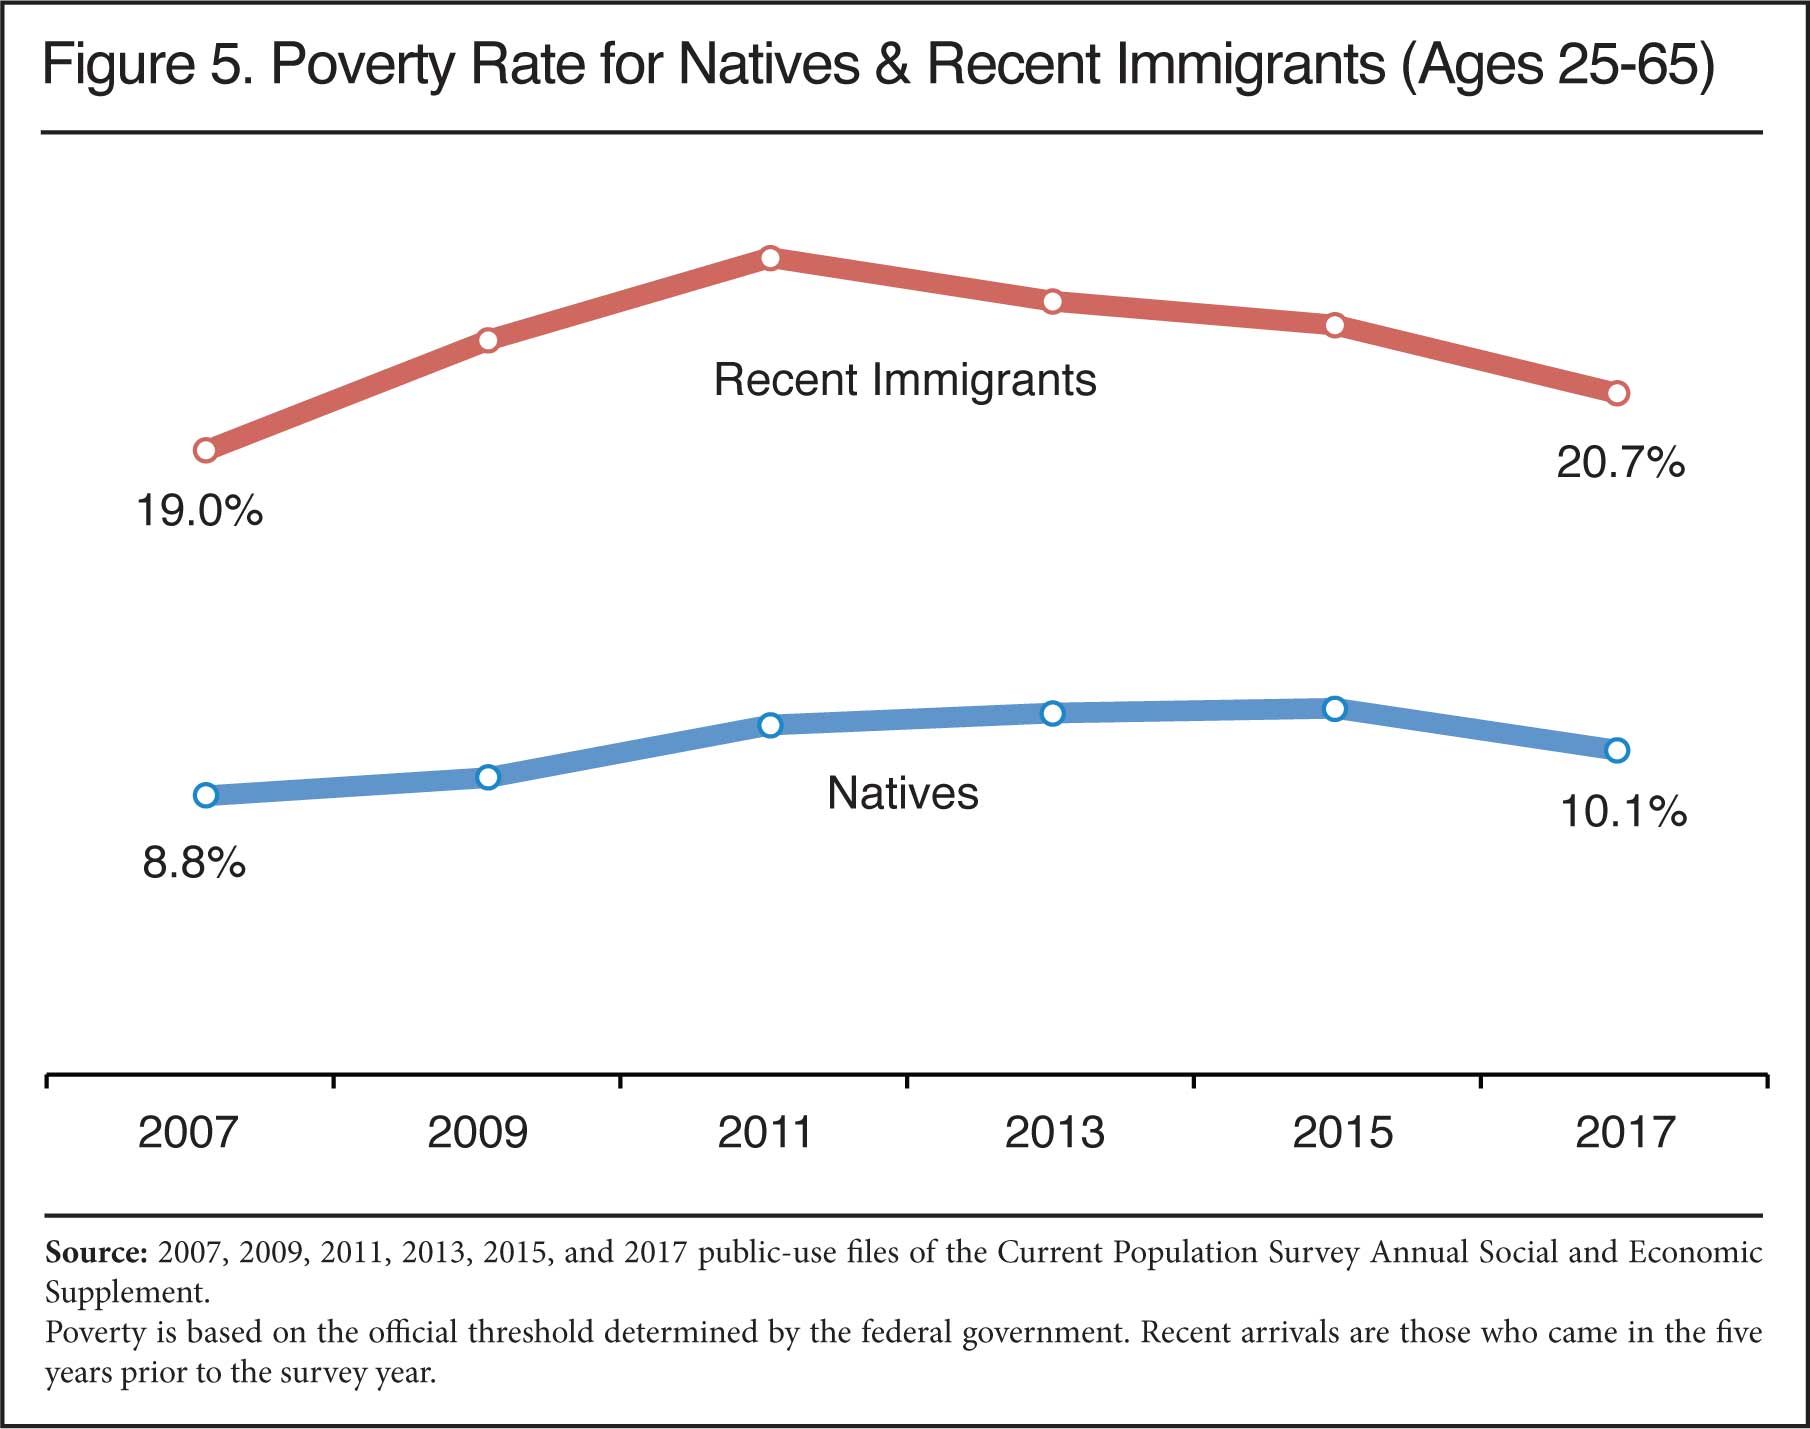
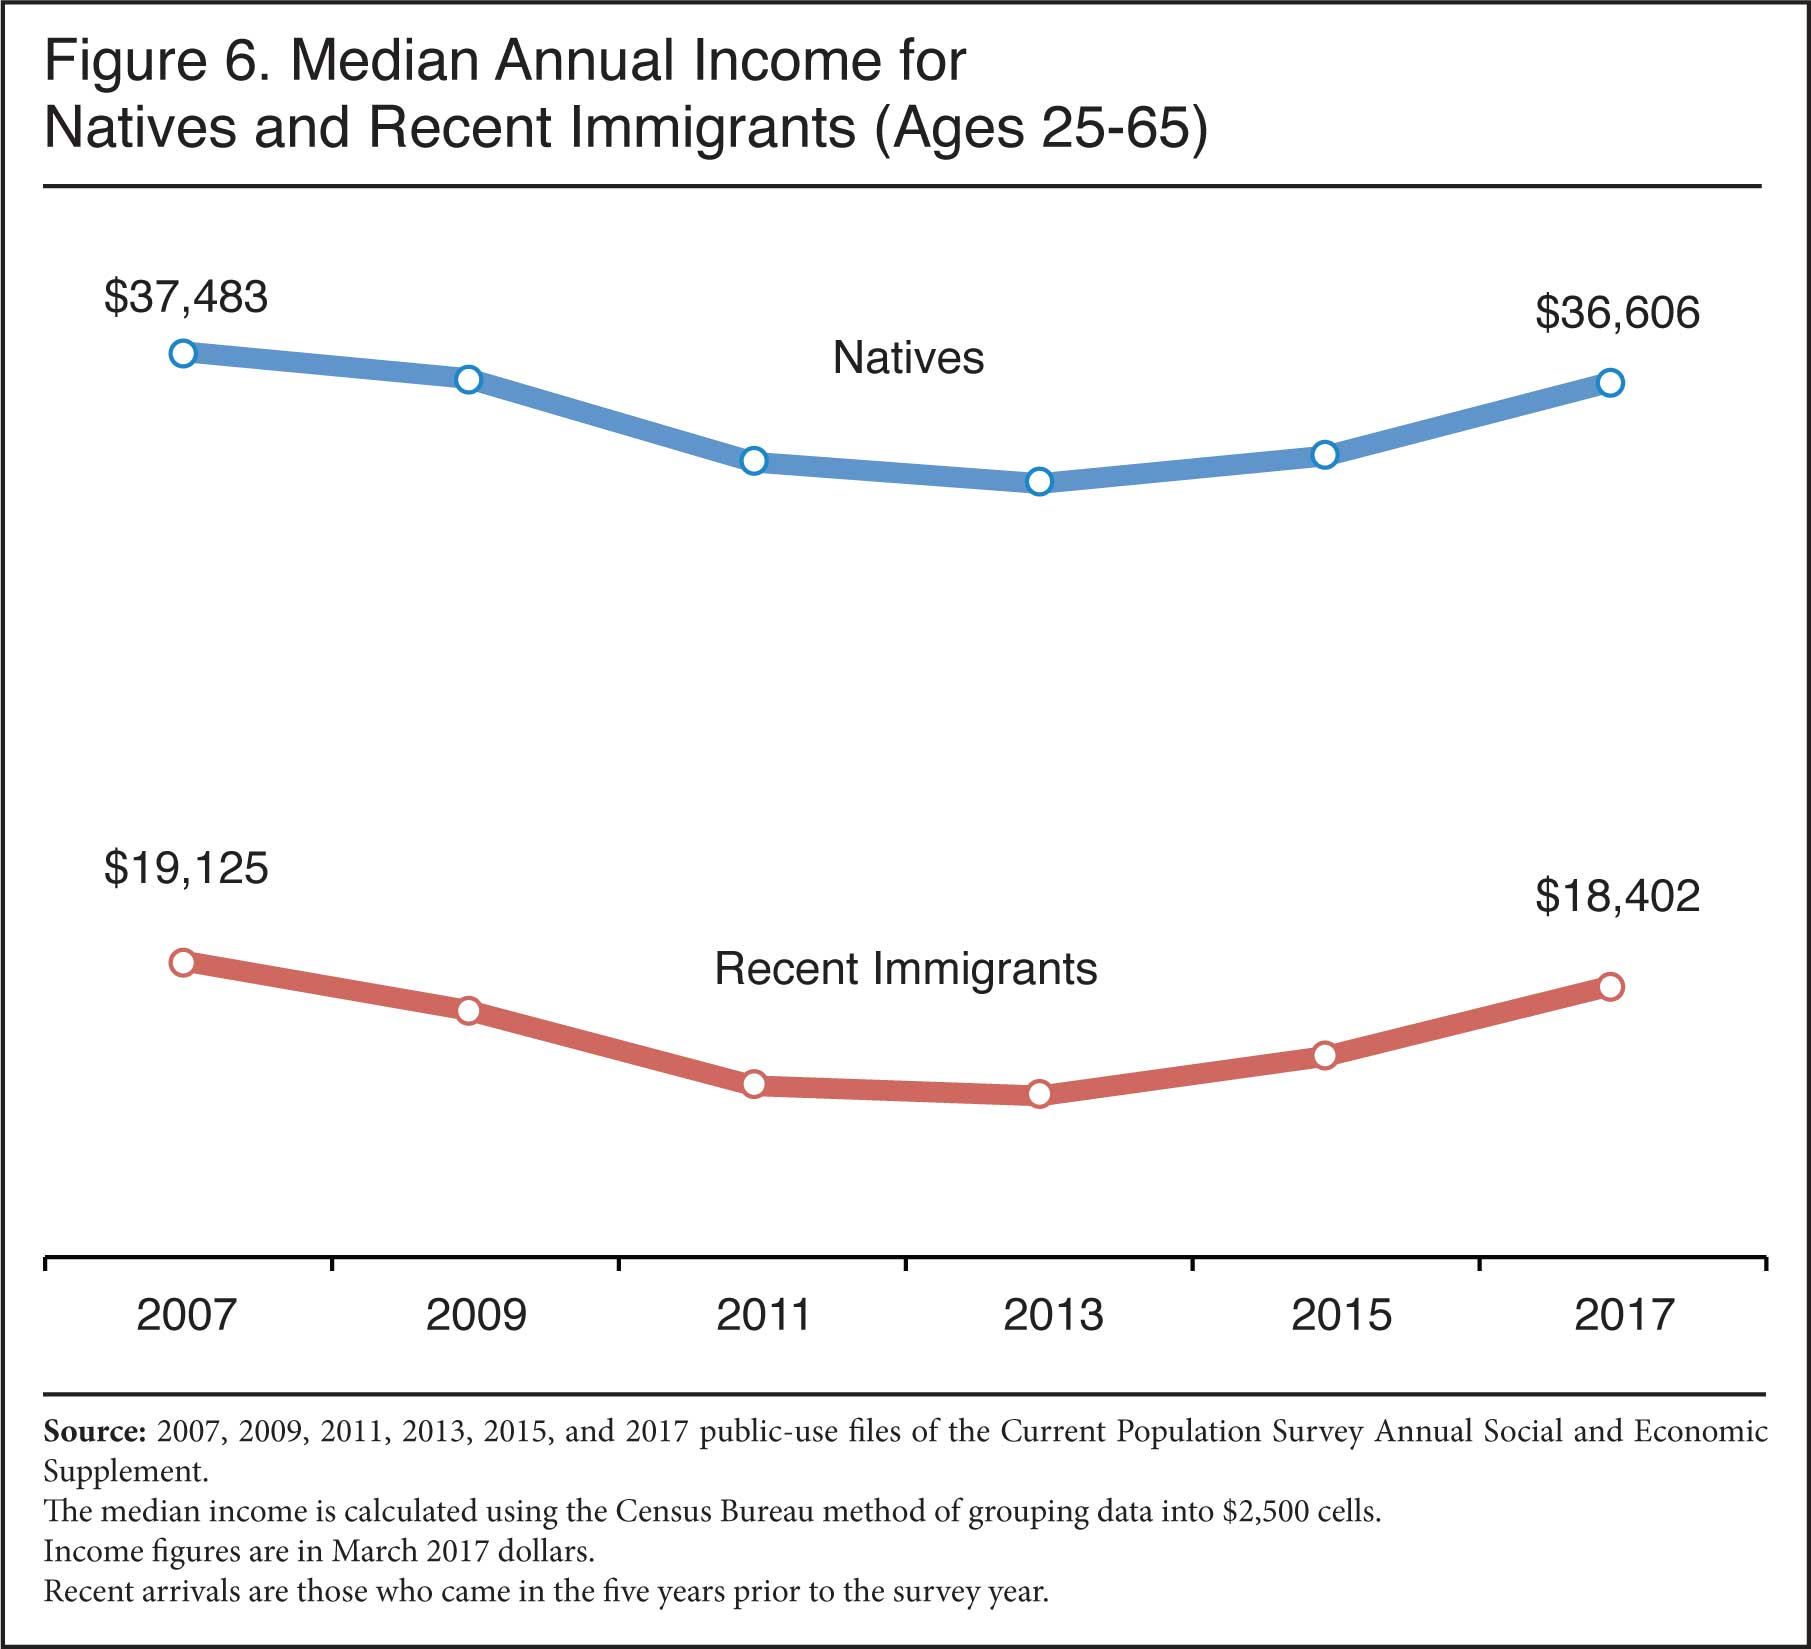
Figure 6 compares the median income of newly arrived immigrants and natives. Median income fell after the Great Recession for both groups, and has since recovered some for both groups. In 2007, new immigrants earned 51 percent as much as natives, and in 2017 it was 50 percent as much, so the relative incomes of both groups remain virtually unchanged. Taken together, Figures 5 and 6 show that if measuring poverty or median income, immigrants are starting out about as far behind, relative to natives, as they did a decade ago. This might not be such a surprising finding except for the fact that it occurred during a time when immigrant education levels increased dramatically relative to natives.
Welfare Use. Figure 7 shows the share of immigrants ages 25 to 65 using Medicaid, the health insurance program funded by states and the federal government for those with low incomes. The figure shows that there has been a significant increase in use for both immigrants and natives. The Affordable Care Act and the Great Recession likely explain the general increase in Medicaid enrollment. While the high rate of Medicaid use among new immigrants may seem surprising as most new green card holders and almost all illegal adults and temporary visa holders (e.g. guestworkers and foreign students) are technically barred from accessing this program, several factors mitigate this situation.13 Figure 7 shows that natives were slightly more likely to use the program than new immigr¬¬ants in 2007. But in the last few years use by new immigrants actually exceeded that of the native-born.
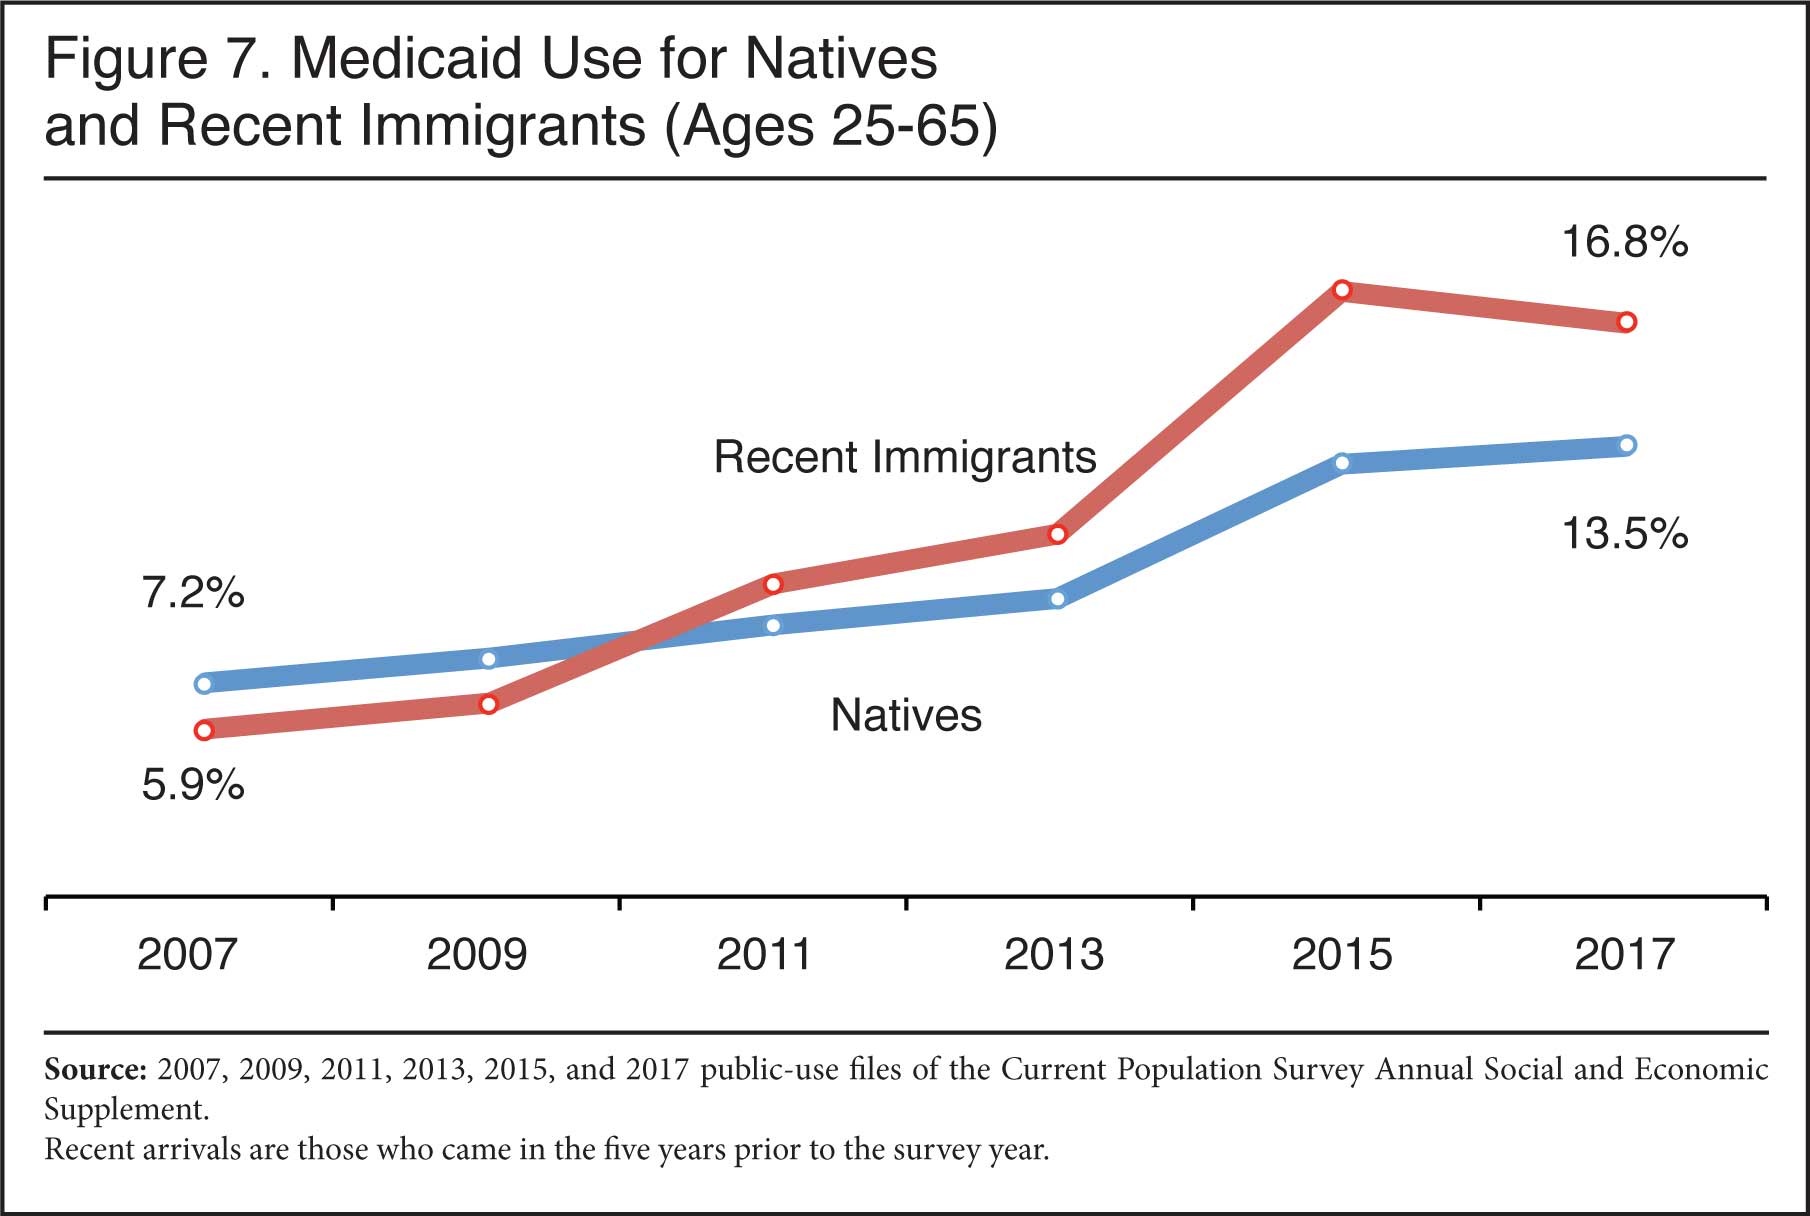
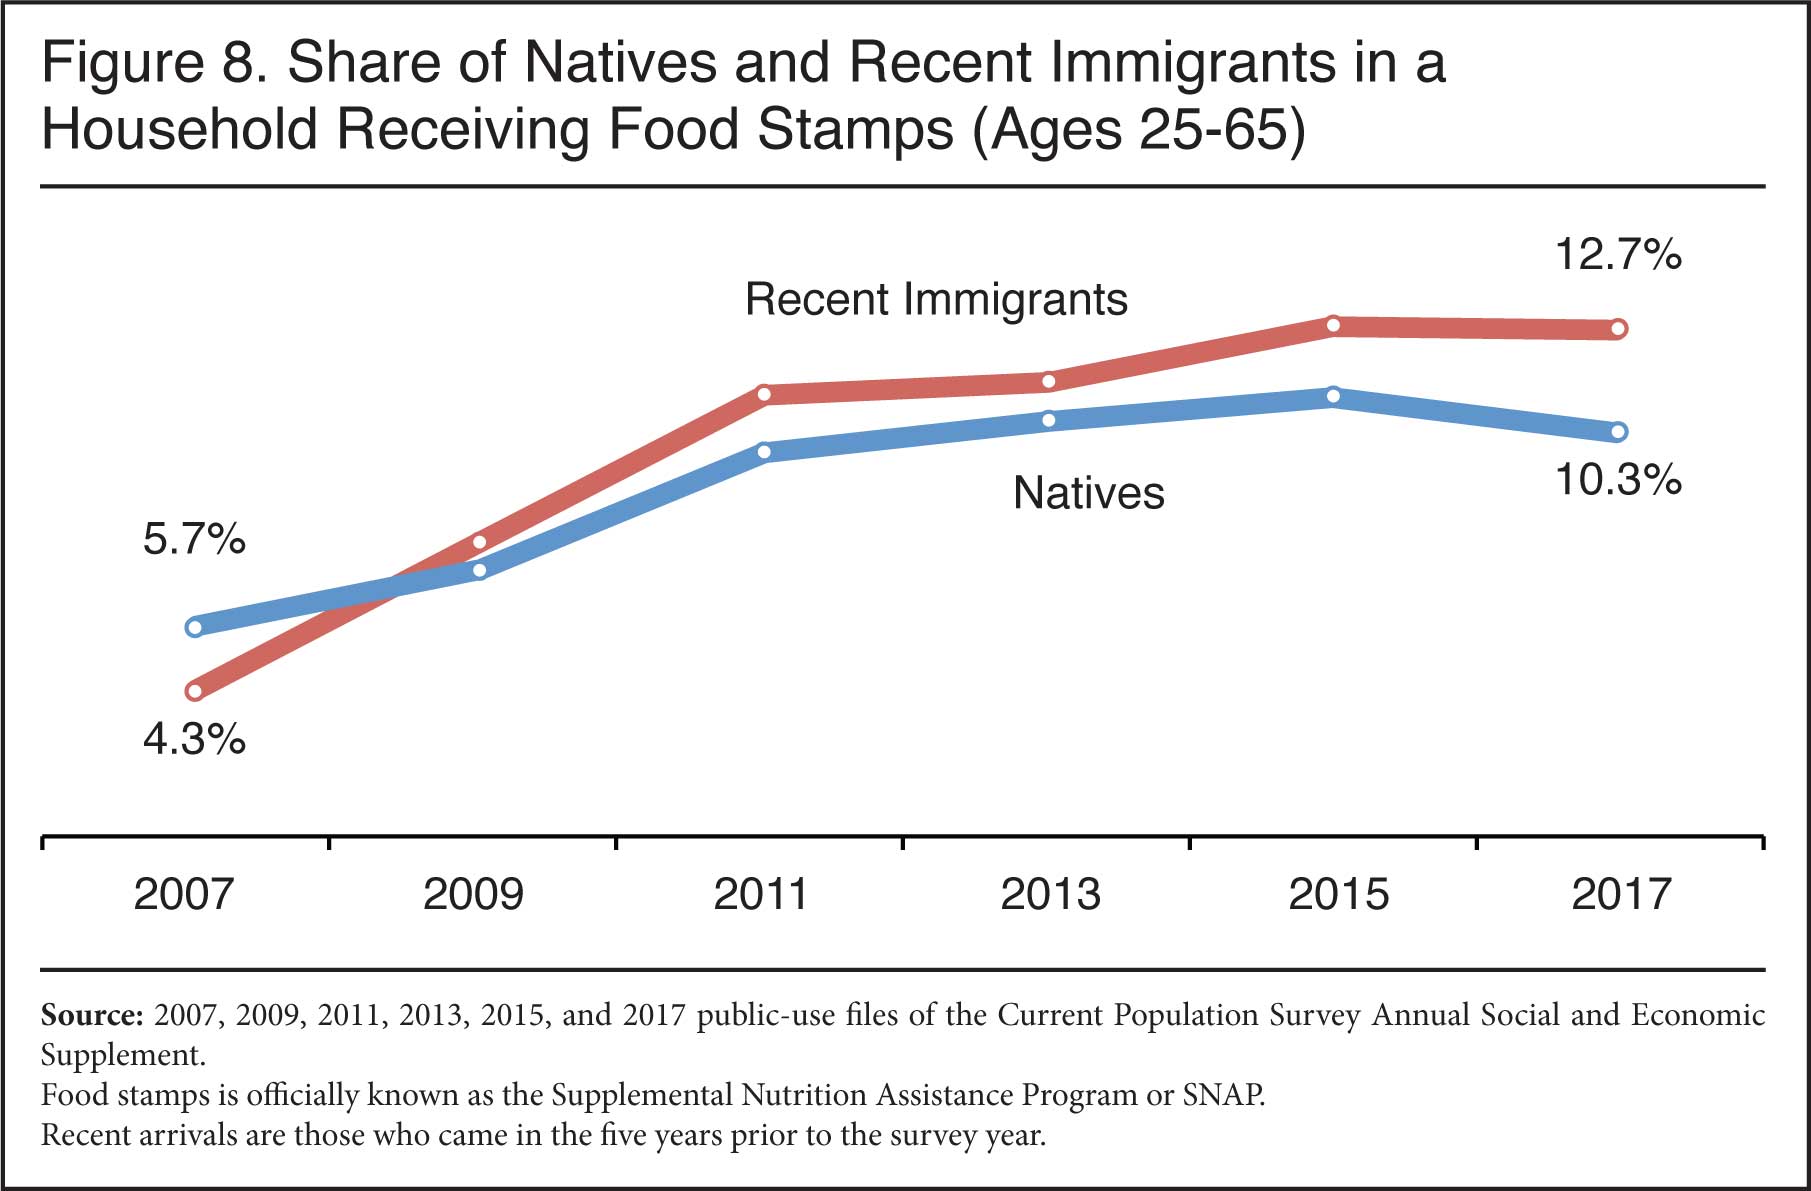
Figure 8 reports the share of new immigrants and natives living in households receiving food stamps, officially known as the Supplemental Nutrition Assistance Program (SNAP). Like Medicaid, the share of people (both new immigrants and natives) using this program has increased significantly. Even as the economy has recovered, use of SNAP has remained high for both groups, with the share of new immigrants living in households receiving the program now exceeding that of natives.14 Use of food stamps and Medicaid by new immigrants and natives reflects, in part, the general increase in non-cash welfare in the last decade. But like the other measures of economic success already examined, Medicaid and food stamp figures indicate that even though new immigrants in some ways can be seen as more educated than natives by 2017, their use of the two largest non-cash welfare programs now slightly exceeds that of natives.
Why Didn't Higher Education Levels Narrow the Gap with Natives?
In the discussion that follows, we explore some the possible reasons for the rise in immigrant education not resulting in a significant narrowing of the gap in measures of socioeconomic success with natives. We find that at each education level new immigrants have generally done worse in recent years than their counterparts a decade ago. This fact has offset the general rise in new arrivals' education. While natives have not done particularly well either, the situation is somewhat more pronounced among immigrants.
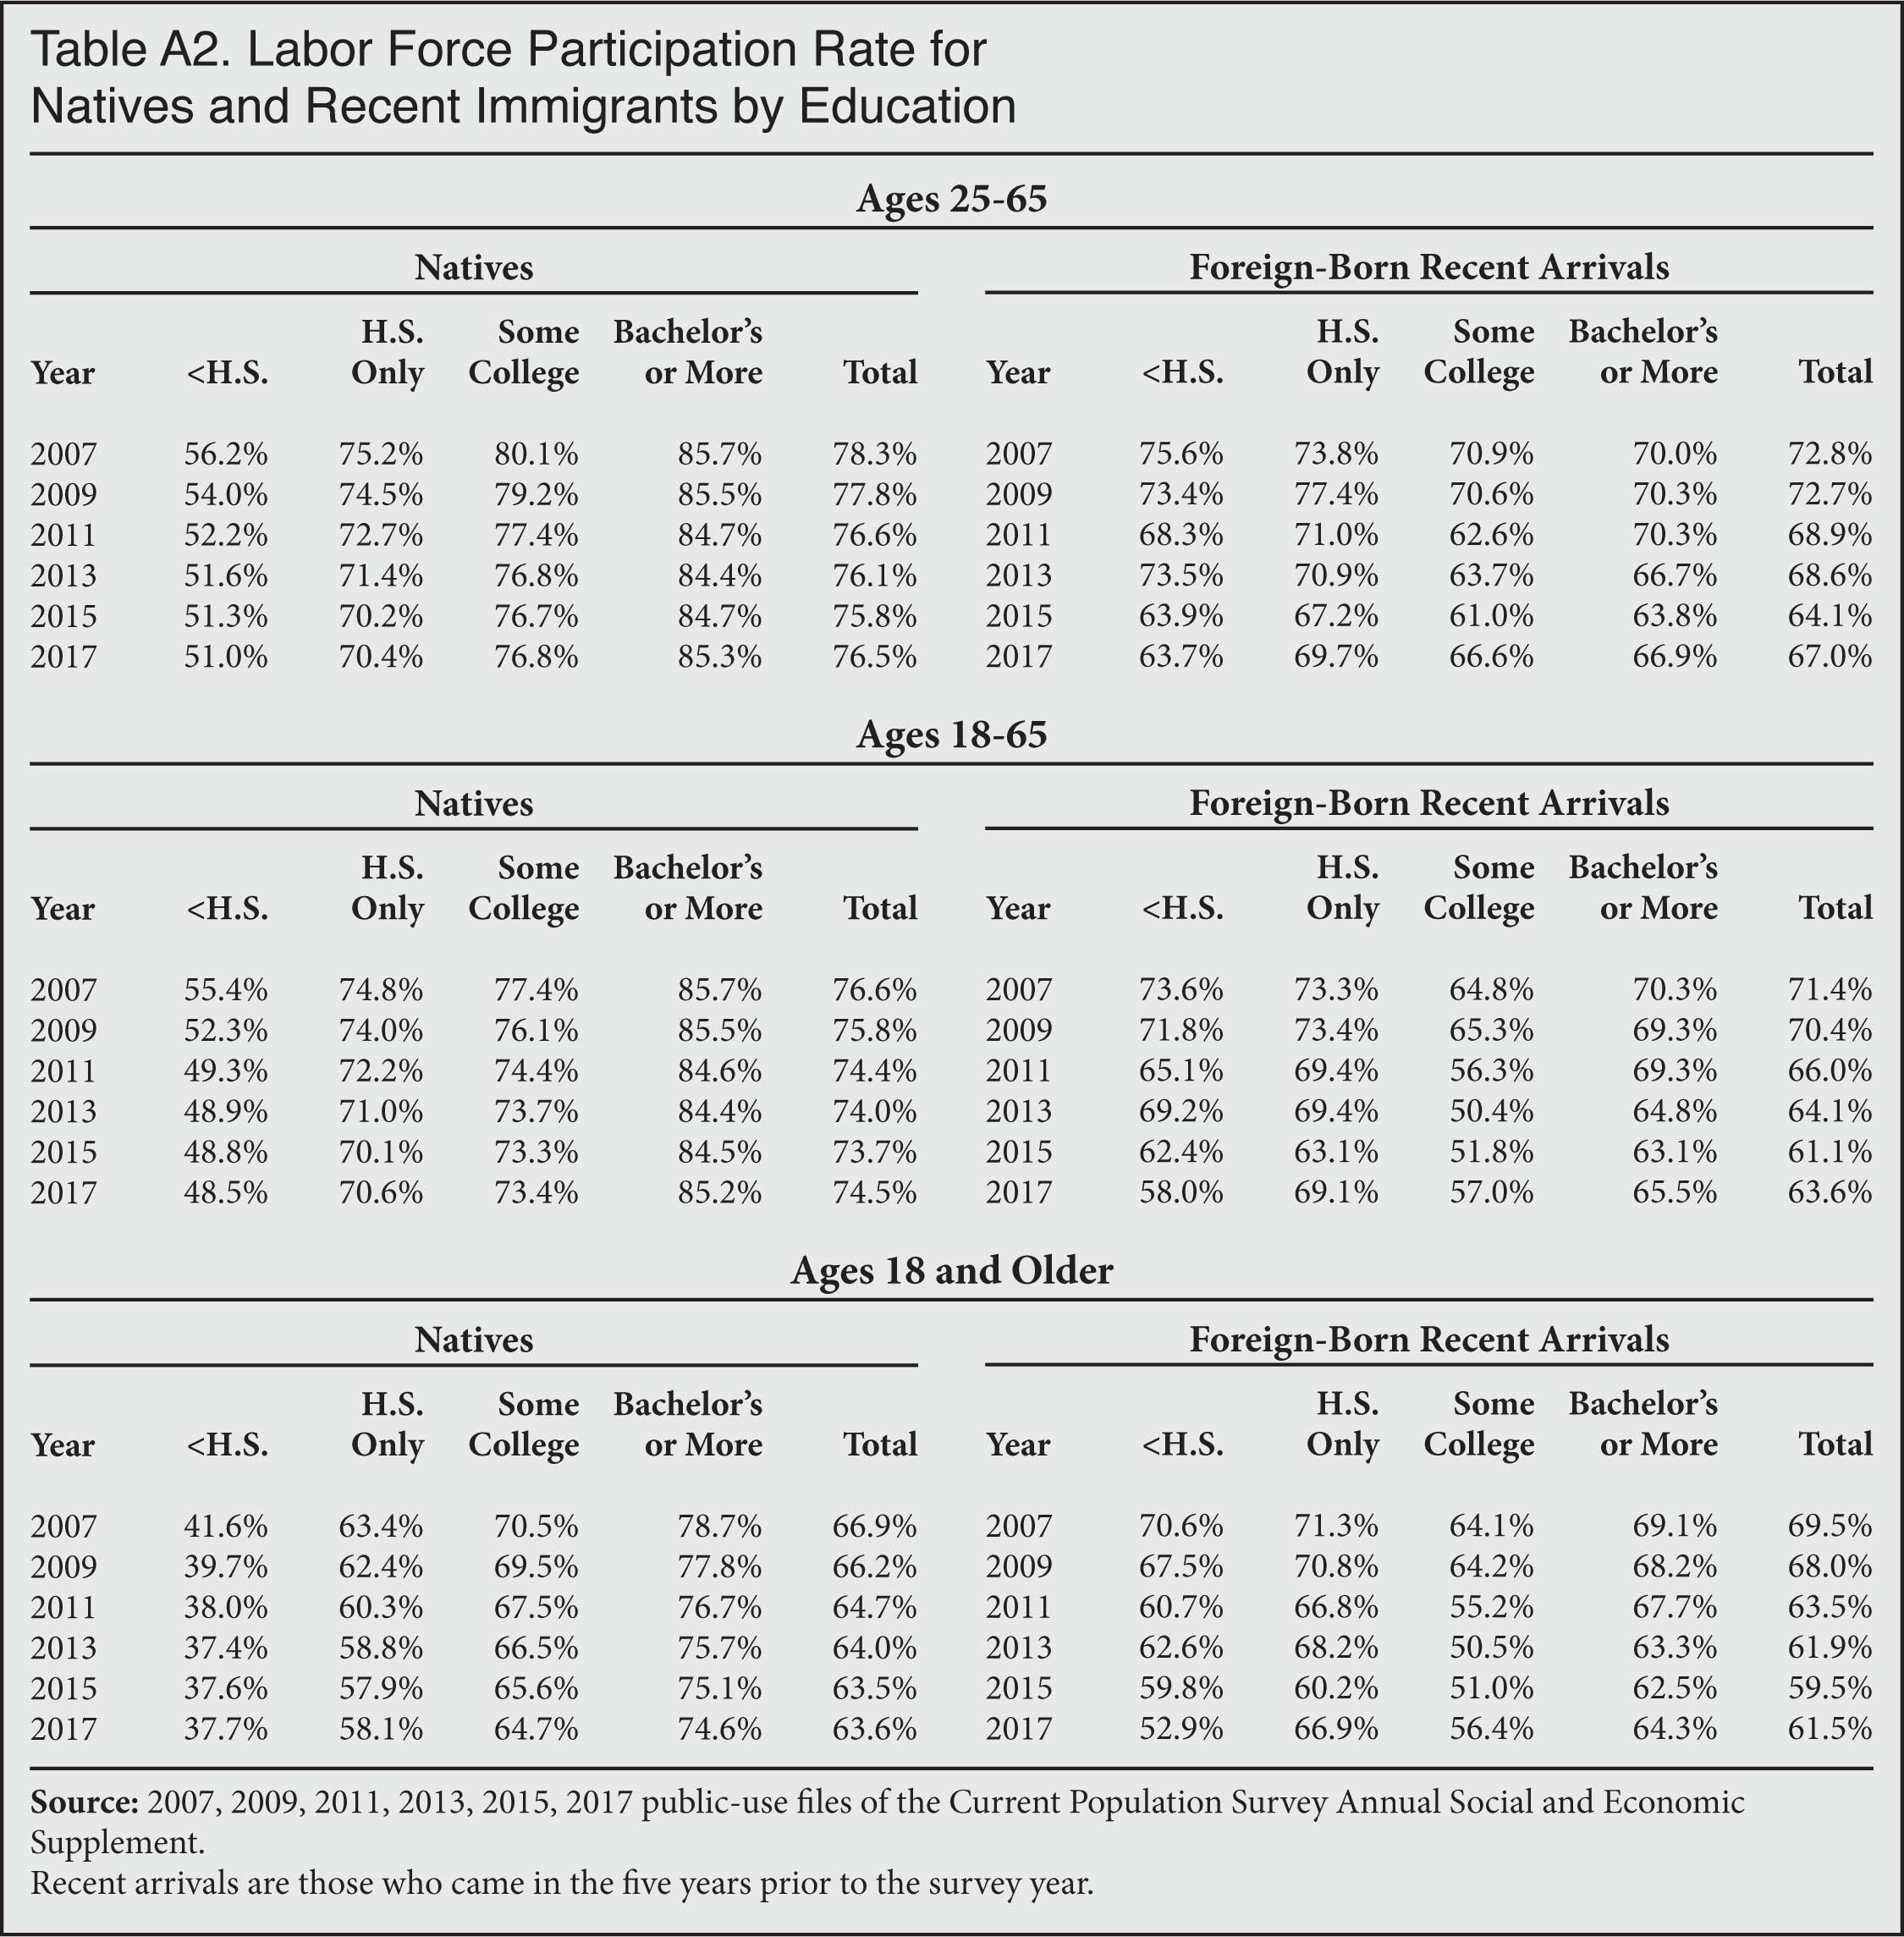
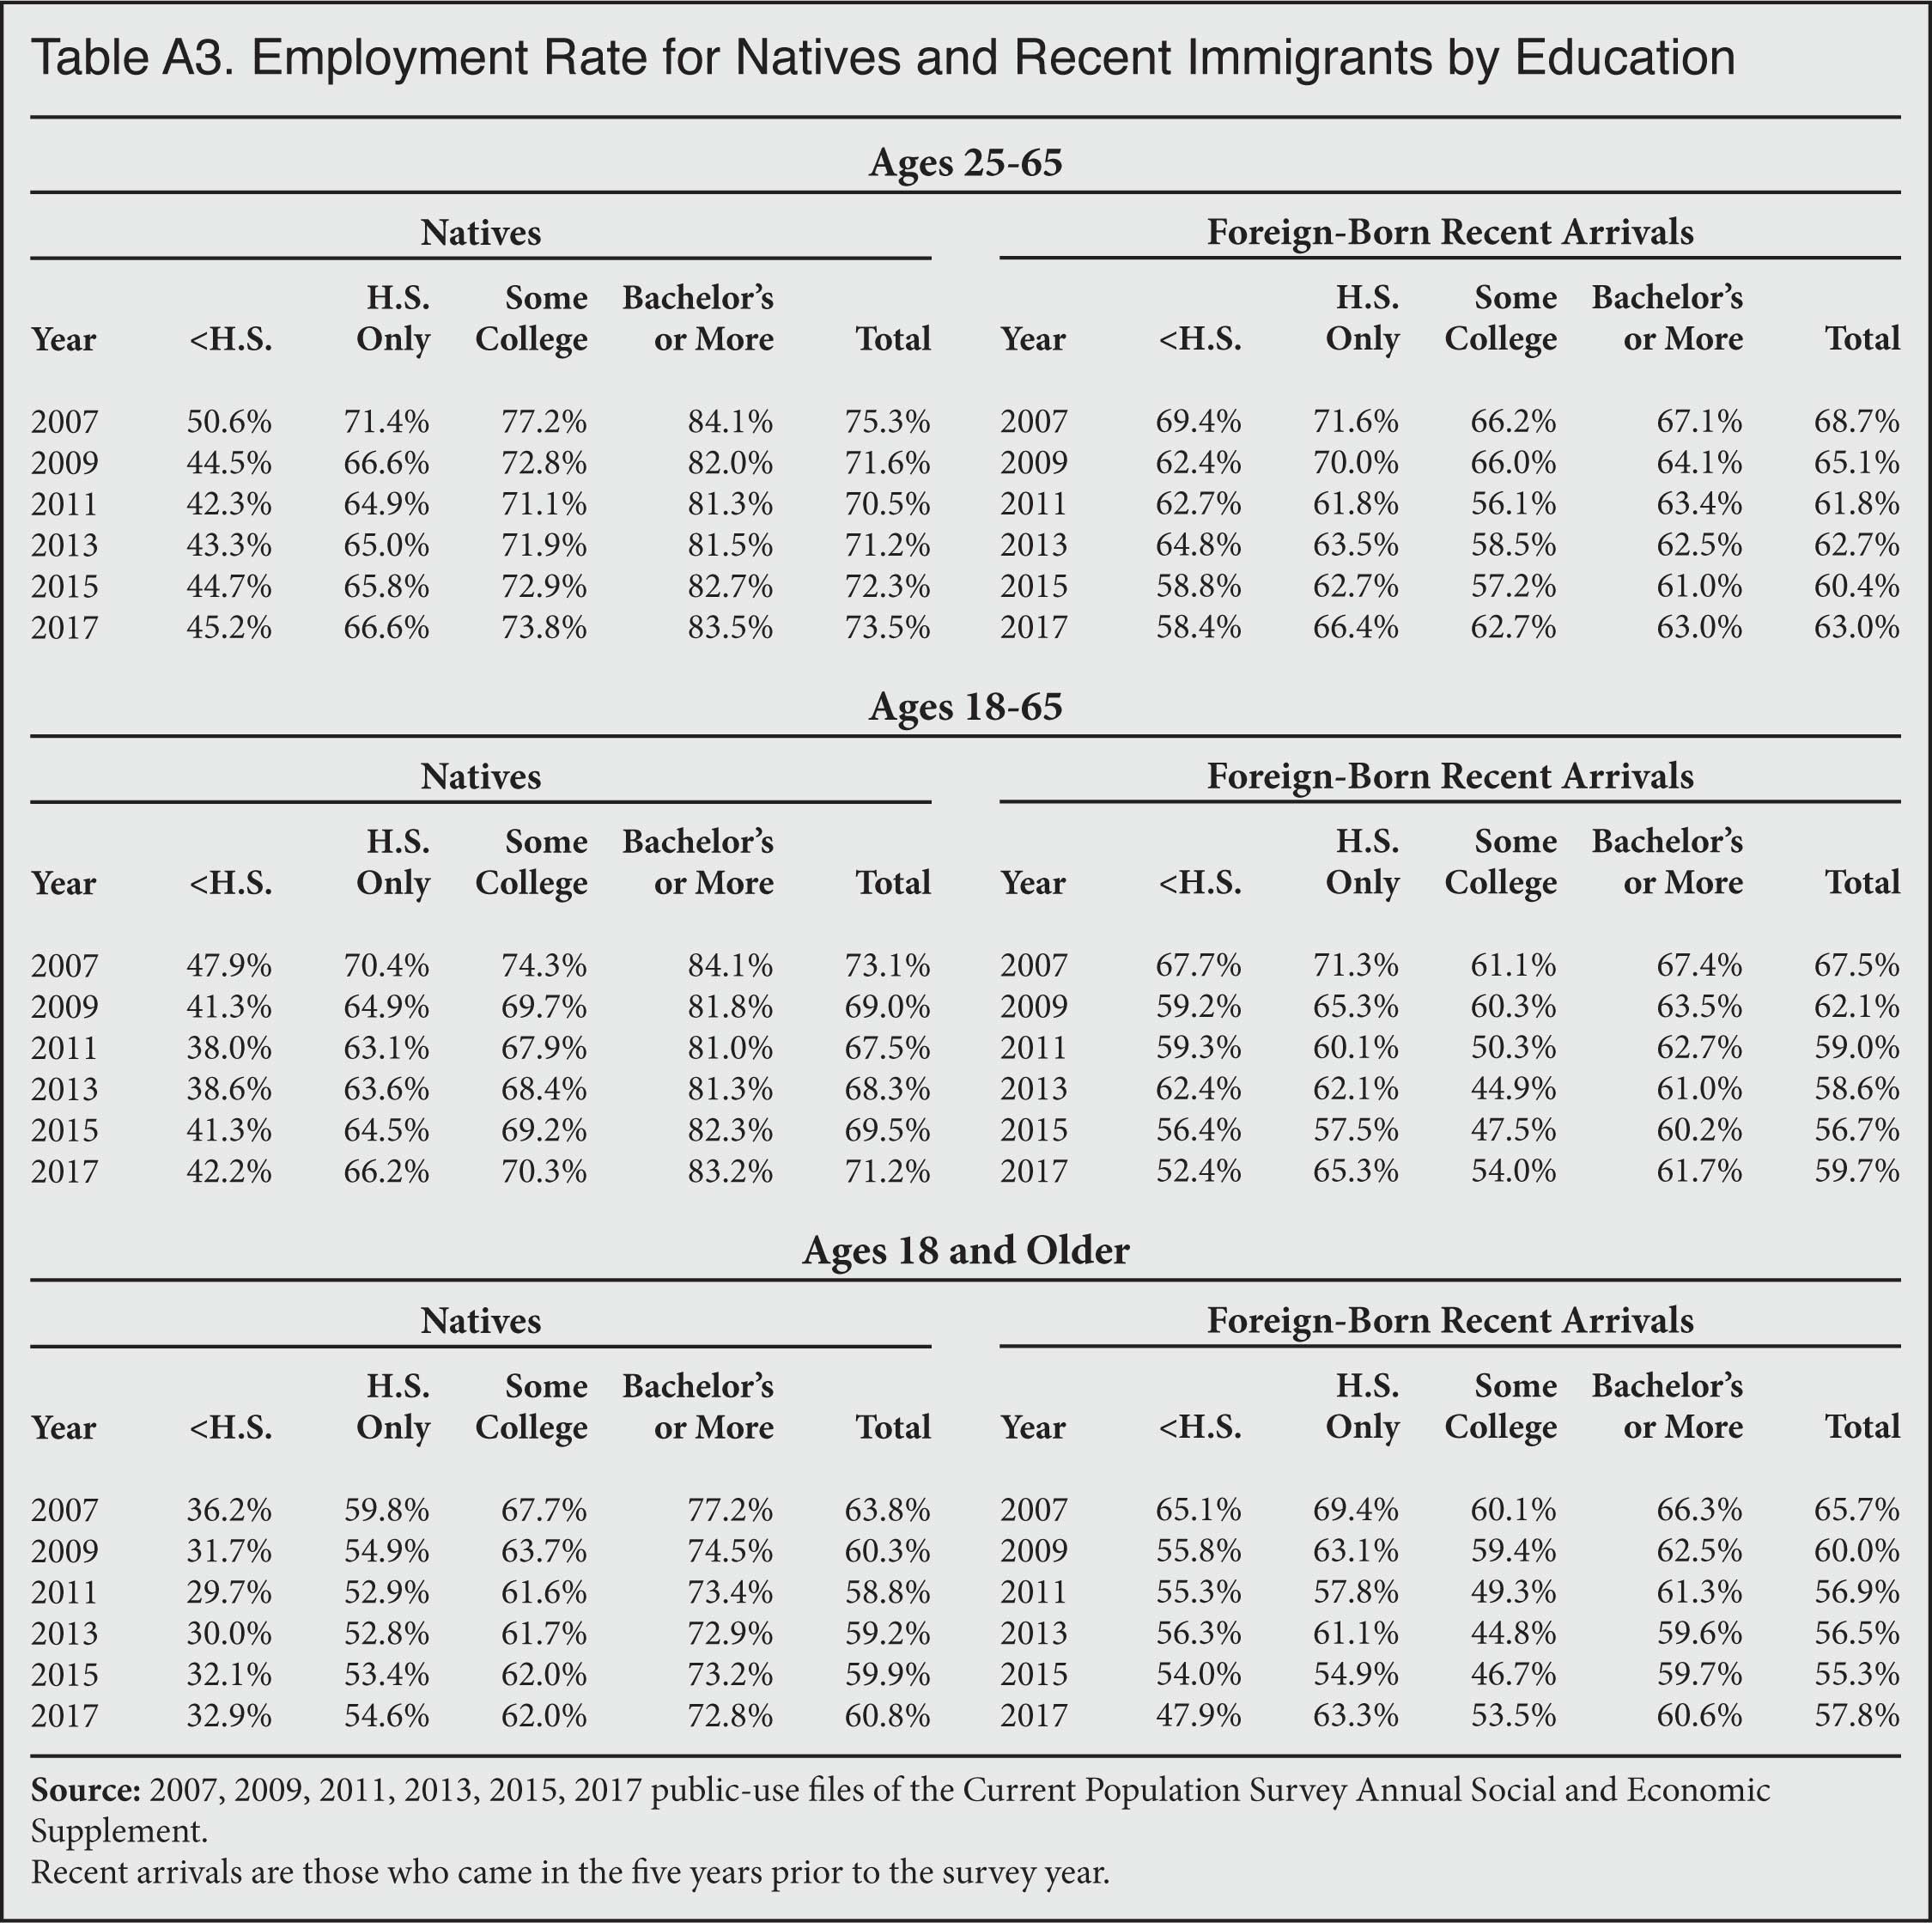
Labor Force Attachment by Education. Turning first to measures of labor force attachment by education (Tables A2 and A3 in the Appendix), we see that there has been a general decline in labor force participation and employment rates across education levels for both new immigrants and natives. However, for natives the decline is more pronounced for the less-educated, while for newly arrived immigrants the decline is, for the most part, spread across all education levels. For example, Table A2 shows that the labor force participation rate of natives with a college degree (ages 25 to 65) was 0.4 percentage points lower in 2017 than in 2007, but among new immigrants with this level of education the decline was 3.1 percentage points. For those with some college, new immigrants also did worse than natives. However, among the less educated, labor force participation was much lower in 2017 than in 2007 for both immigrants and natives. In terms of employment rates (Table A3) we see a similar pattern, with both less-educated immigrants and less-educated natives experiencing a significant decline in work, while the decline for college-educated natives was much less pronounced than for college-educated immigrants.
It is still the case that new immigrants, or natives for that matter, with a college education are more likely to work than less-educated immigrants, but these well-educated new immigrants do not work at the same rates as they did in the past. Overall, the broad decline in labor force attachment across all education categories more than offsets the increase in the share of the population who are well educated. This situation is more pronounced for immigrants than natives. As a result, labor force attachment declined more for new immigrants than for natives.
The steeper decline among more educated recent immigrants is an interesting finding that may mean that the marketable skills of new immigrant college graduates are not as valued as they once were.15 If this is the case, it would mean that while new immigrants are much more educated "on paper", their actual skills may not be significantly higher.
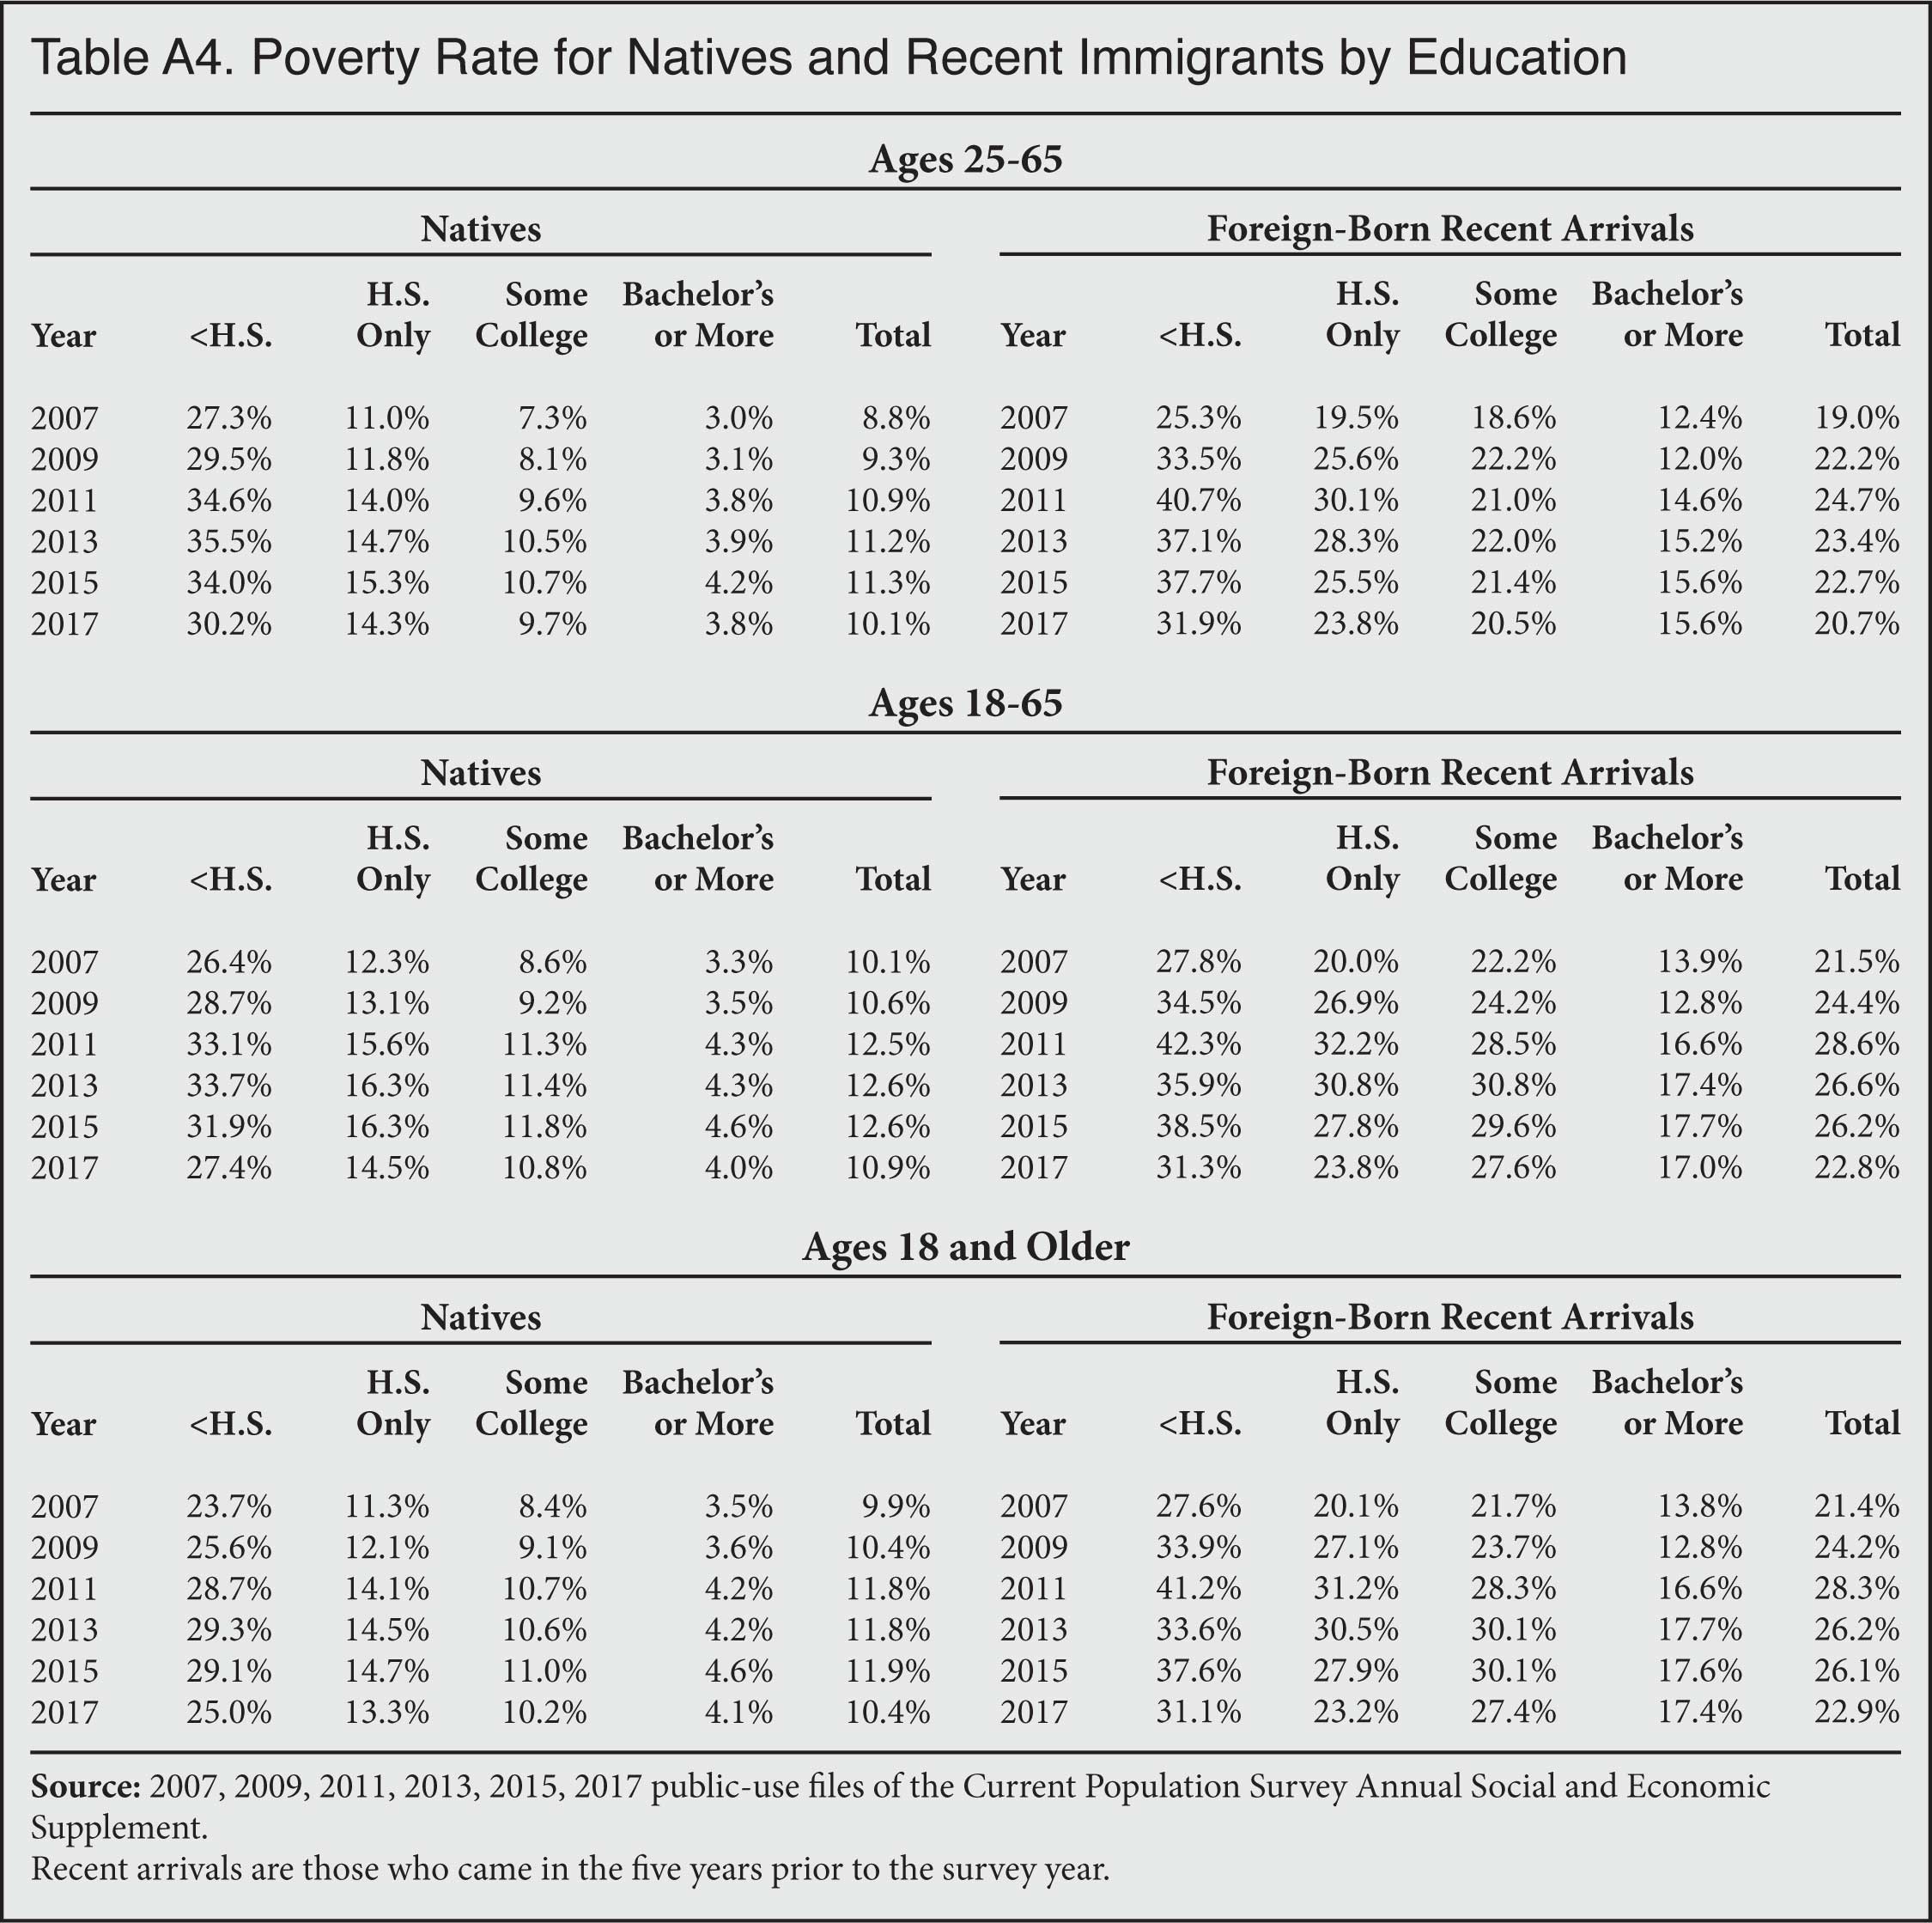
Poverty and Income by Education. Table A4 shows poverty by education for new immigrants and natives. In general, poverty was higher in 2017 than in 2007 for both natives and new immigrants. And this is the case across all education levels, though the share of college-educated natives in poverty was only very slightly higher. As we saw in Figure 5, poverty declined a little more steeply in the last few years among new immigrants than for natives. It was still higher in 2017 than in 2007 for both groups, but as is the case with the other measures of economic success examined, the difference in poverty in 2007 vs. 2017 was larger for new college-educated immigrants than for college-educated natives — 0.8 percentage points vs. 3.2 percentage points, respectively. The only reason that poverty overall was not a good deal higher for both immigrants and natives, even though poverty was higher in each educational category, was because new immigrants and natives were more educated and the most educated people still have lower poverty rates.
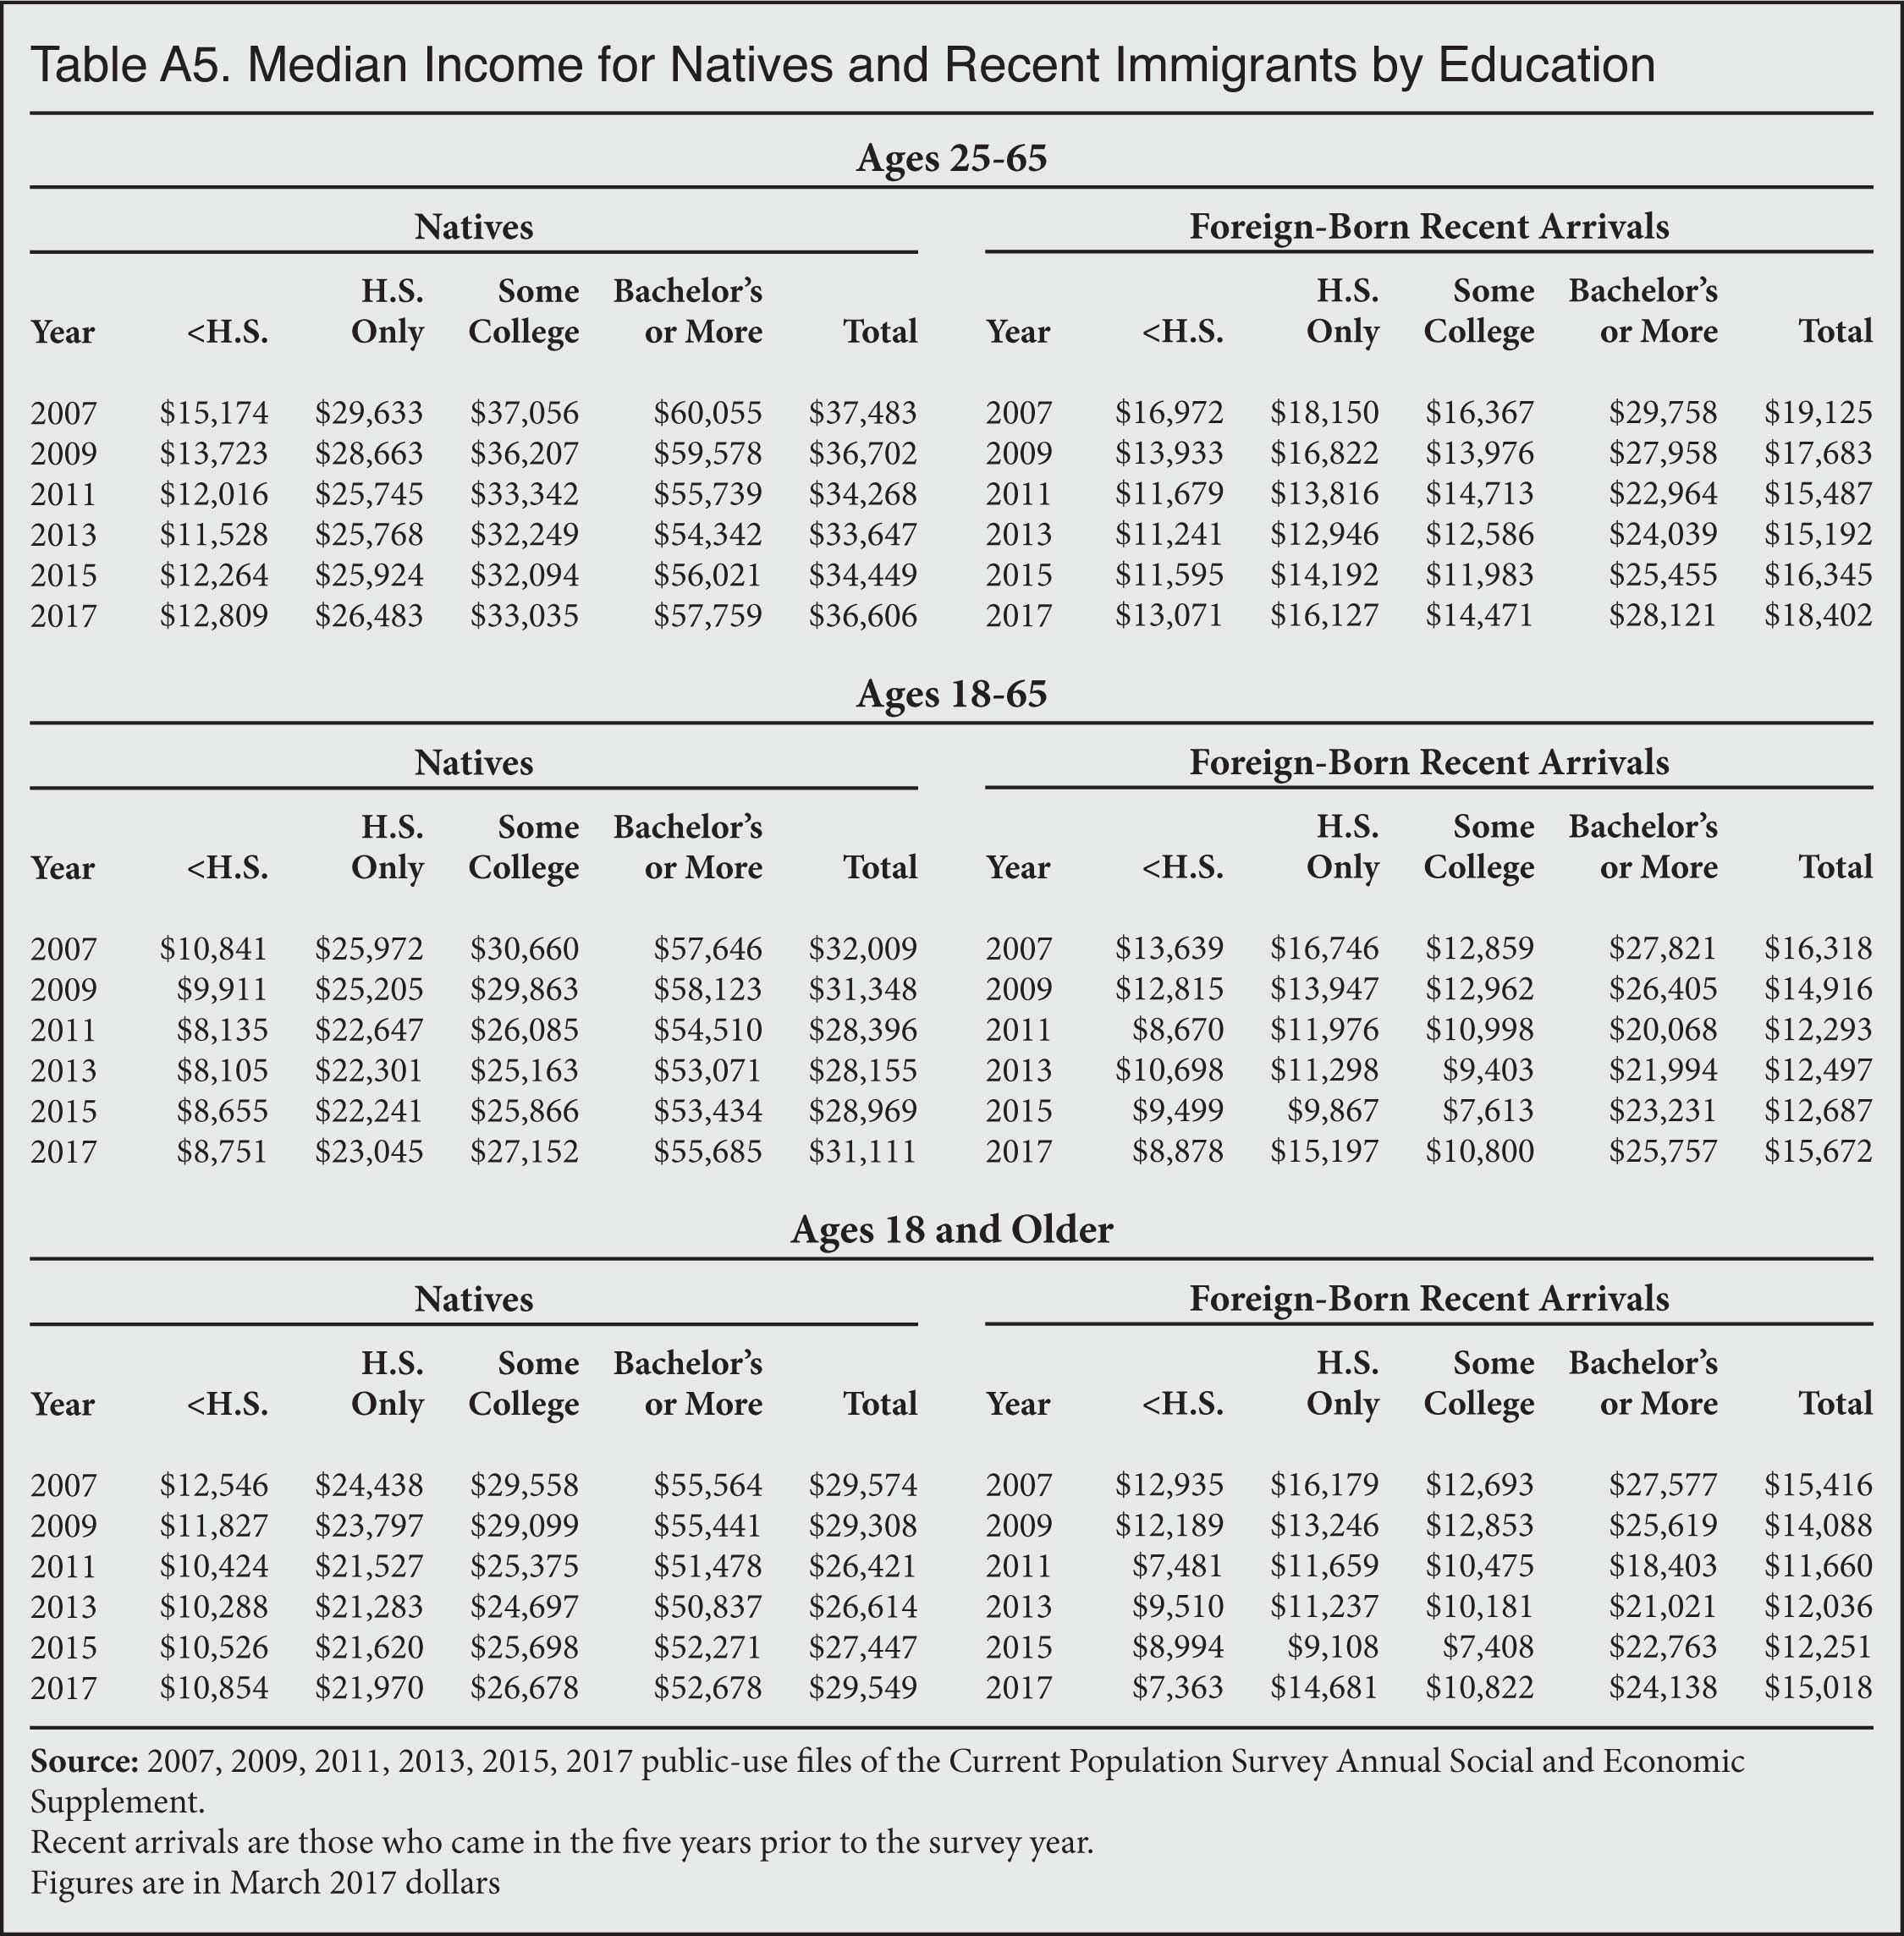
The same pattern of across-the-board deterioration that we see in poverty by education can also be seen in median income in Table A5. Of course, income, like poverty, fluctuates with the economy, but median income was lower in 2017 than it was in 2007, despite the economic recovery, for both new immigrants and natives in every educational category. Because income declined for both groups within every educational category, the increase in overall education for both new immigrants and natives did not result in an increase in median income overall. The income of new immigrants and natives without a high school diploma was much lower in 2017 than it was in 2007, with the decline for new immigrants being particularly large. The most educated natives fared very slightly better than the most educated immigrants, with income declining 4 percent for college-educated natives and 6 percent for college-educated new immigrants. The economy impacted all educational categories and neither immigrants nor natives have fully recovered from the Great Recession in terms of income. As a result, the income of new immigrants relative to natives was about the same in 2007 as in 2017.
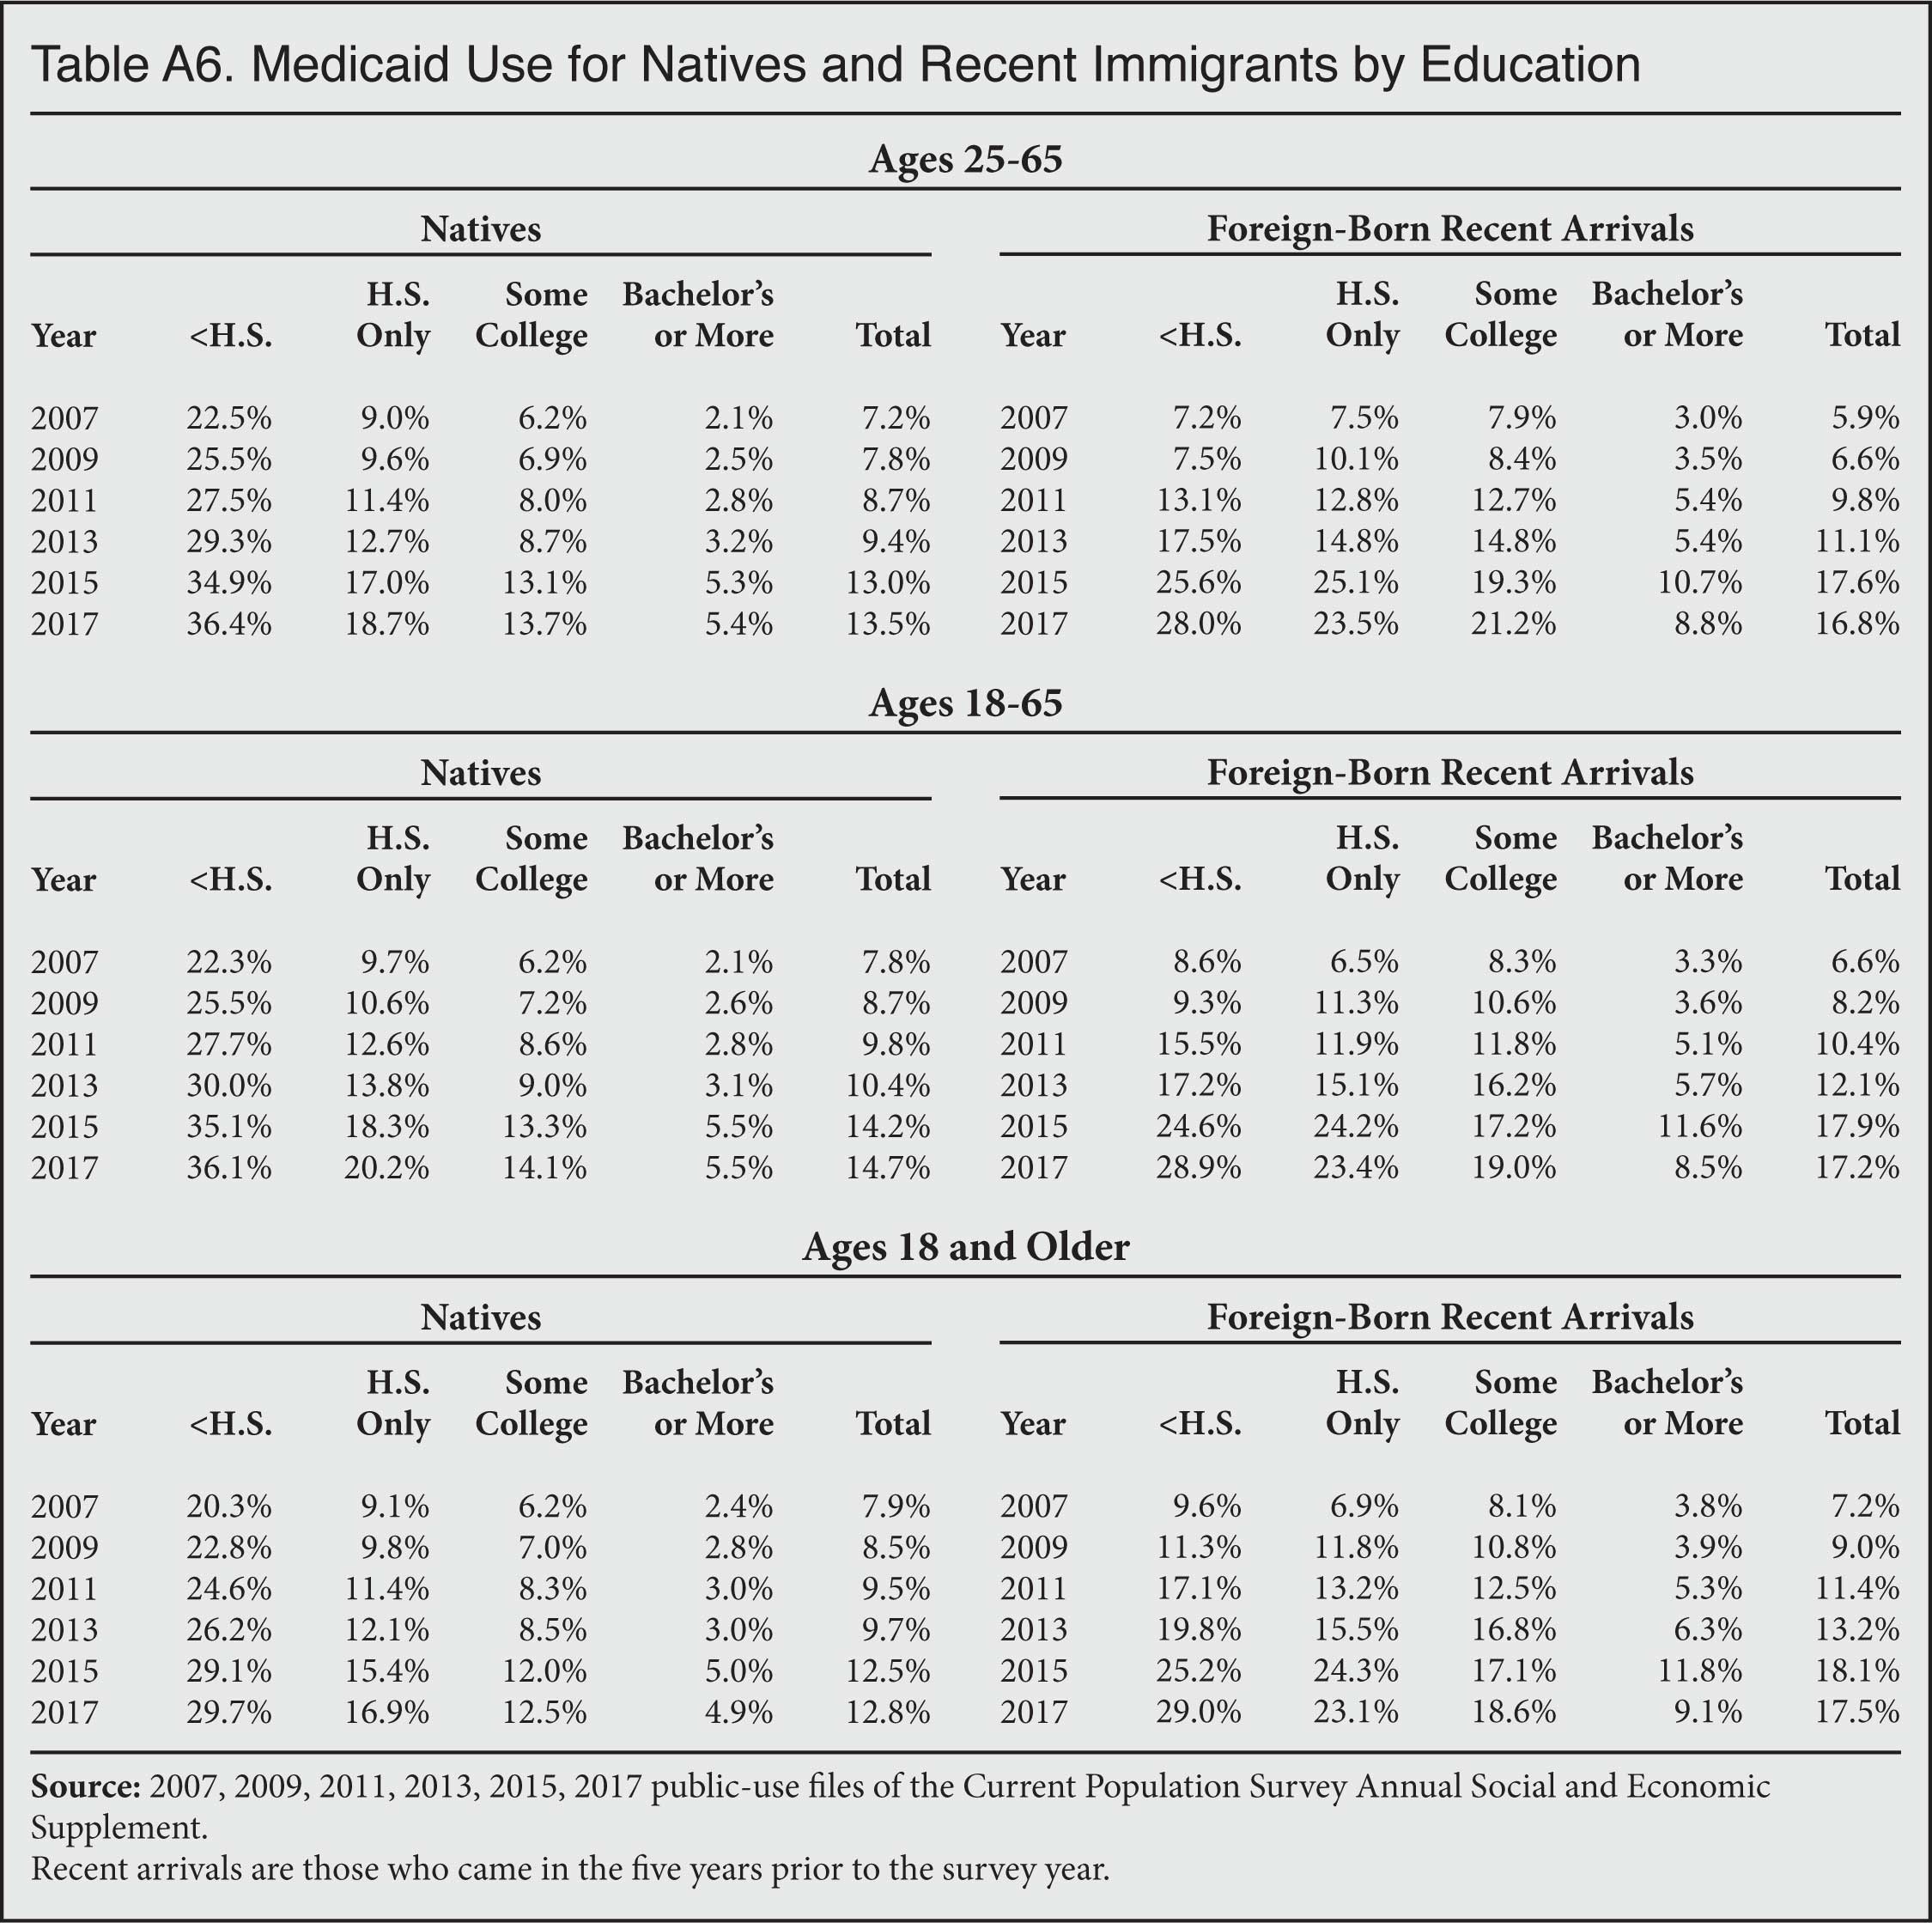
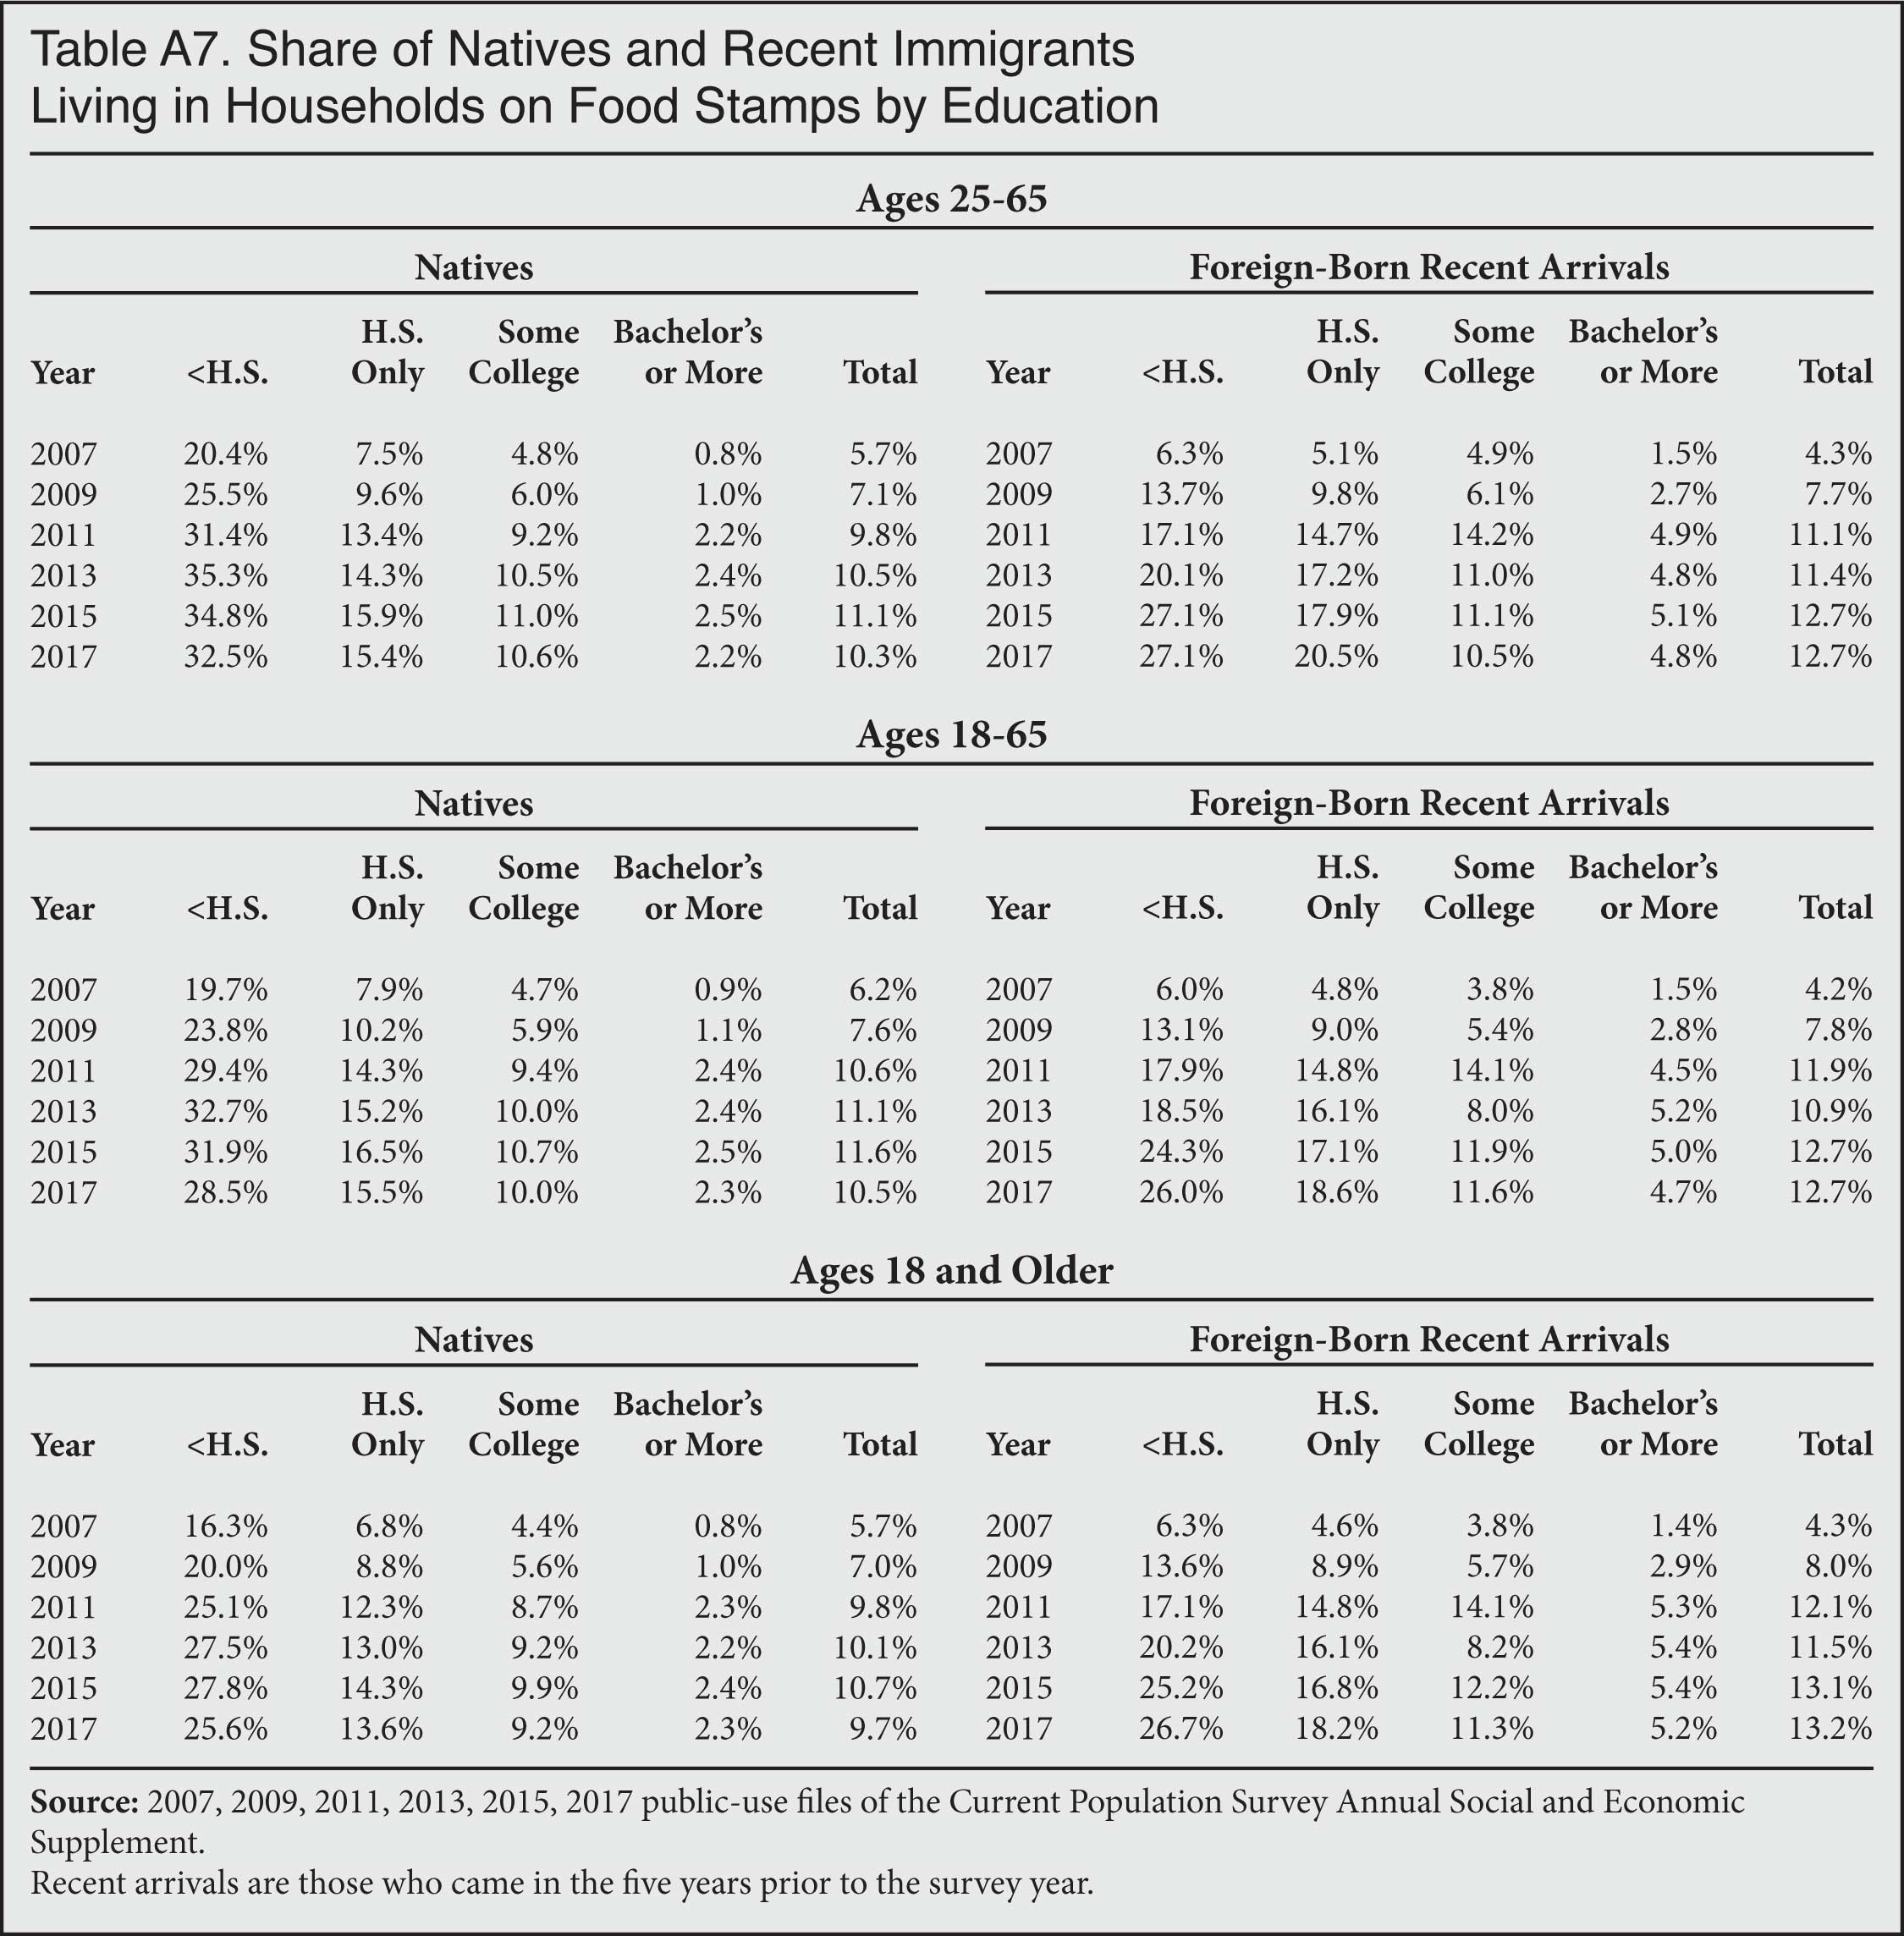
Medicaid and Food Stamps by Education. Tables A6 and A7 report the share of immigrants using two major welfare programs. Turning first to Medicaid, Table A6 shows that the share of immigrants and natives using this program has increased dramatically since 2007 for every education level. As already discussed, the Affordable Care Act and the Great Recession likely explain much of this increase. What is harder to explain is that new immigrants at every education level have seen a somewhat more pronounced rise in their use of Medicaid than natives with the same education. For example, the share of natives without a high school education on Medicaid was 14 percentage points higher in 2017 than in 2007, while the increase for new immigrants with this level of education was 21 percentage points. And among those with only a high school degree, the increase was 10 percentage points for natives and 16 percentage points for immigrants. The somewhat larger increase in Medicaid use for immigrants at every education level has meant that the overall increase in educational attainment among new arrivals and natives has been entirely offset, and then some, by the increase in use by each educational category.
The larger increases in Medicaid use among immigrants at every education level is all the more puzzling since new green card holders (permanent residents), illegal immigrants, and long-term temporary visitors are barred from using federally funded Medicaid in almost all cases. (Many states choose to cover otherwise ineligible immigrants with their own monies; see Note 13.) This still does not answer the question of why even the most educated new immigrants need this program. For one thing, it means that they are poor enough to qualify. This again could be evidence that the skills of new immigrants at each level are not as marketable as those of their counterparts in the past. If correct, it could explain why a larger share have incomes low enough to qualify for Medicaid or why a larger share than in the past work at jobs that do not provide health care.
Like Medicaid, use of food stamps (SNAP) has also increased somewhat more for new immigrants at every education level compared to natives with the same education. As a result, new immigrants in 2017 were more likely to live in households receiving SNAP than natives, whereas in 2007 they were less likely to live in SNAP households. SNAP is not an individual-level program, so it is not as clear a measure of individual well-being of newly arrived immigrants as Medicaid.16 However, the steeper increase in its use by immigrants relative to natives for every education level, shown in Table A7, follows the same pattern of Medicaid discussed above.
Possible Causes for Our Findings
The Economy. Almost all of the measures of economic well-being show a more pronounced deterioration among immigrants than natives with the same level of education. This is the main reason why the dramatic increase in the education level of new immigrants relative to natives did not result in narrowing in the socioeconomic gap with natives. This may simply reflect the economy and the fact that it does not absorb new entrants into the labor market, including new immigrants, as easily as it once did. Why this is the case is certainly an area in need of further inquiry. But the Great Recession and its lingering effects do not explain why immigrants, whose education increased much more than natives, did not fair better.
A Decline in Actual Skills. As we have seen, immigrants at every skill level have tended to do worse than their native-born counterparts with the same level of education. This may be an indication that the marketable skills of the newly arrived immigrants in each education level are not quite as high as they once were. Or at least not as high as they once were relative to natives with the same level of education. However, we offer this explanation as a tentative hypothesis in need of further investigation.
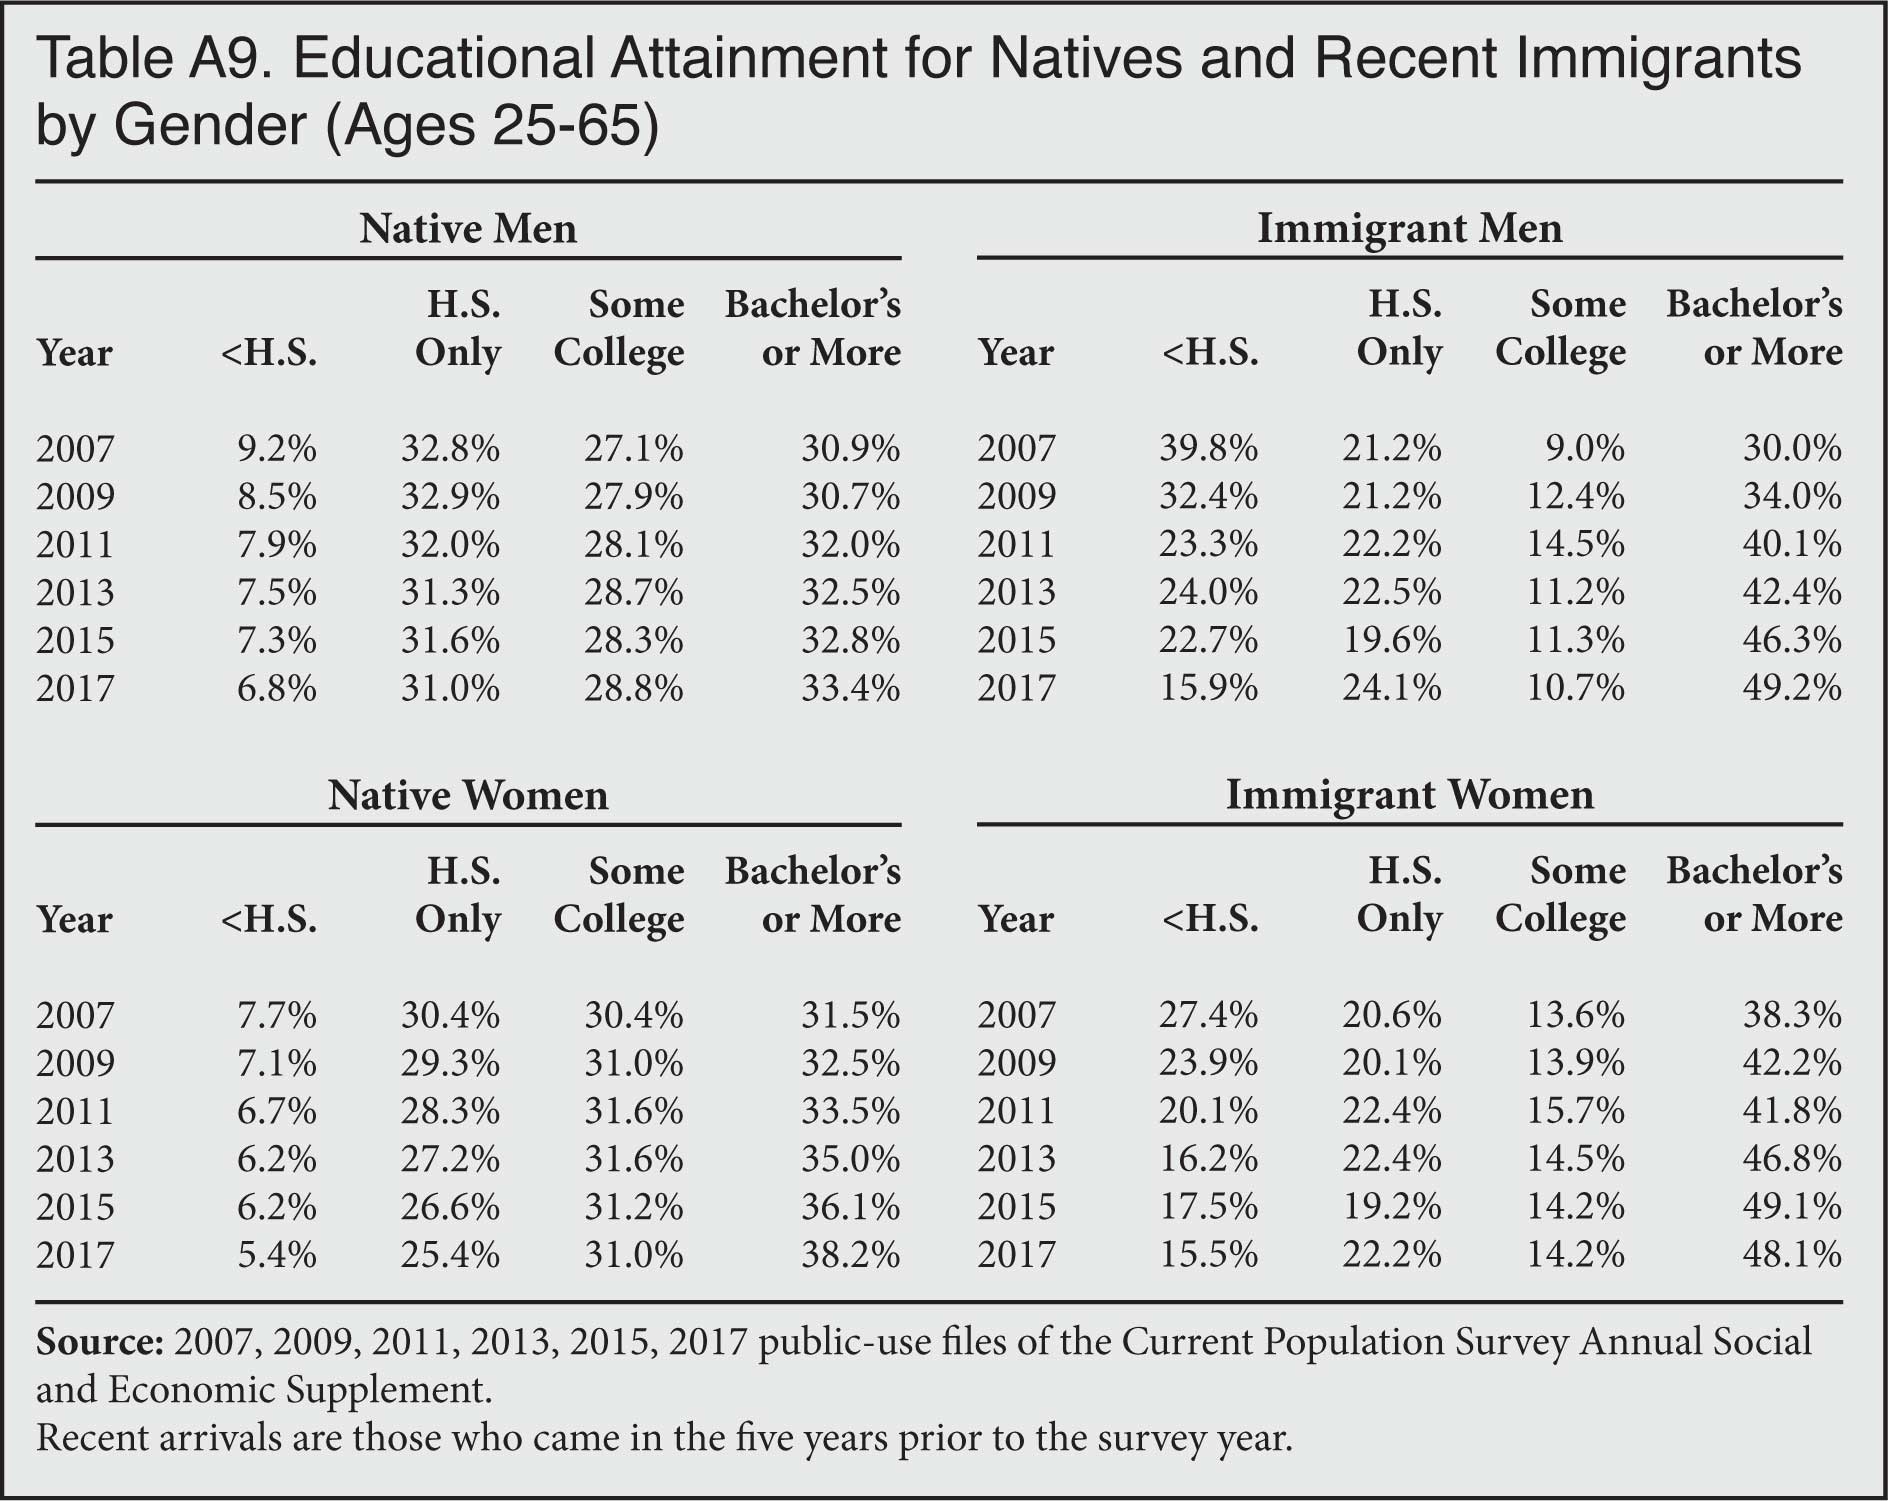
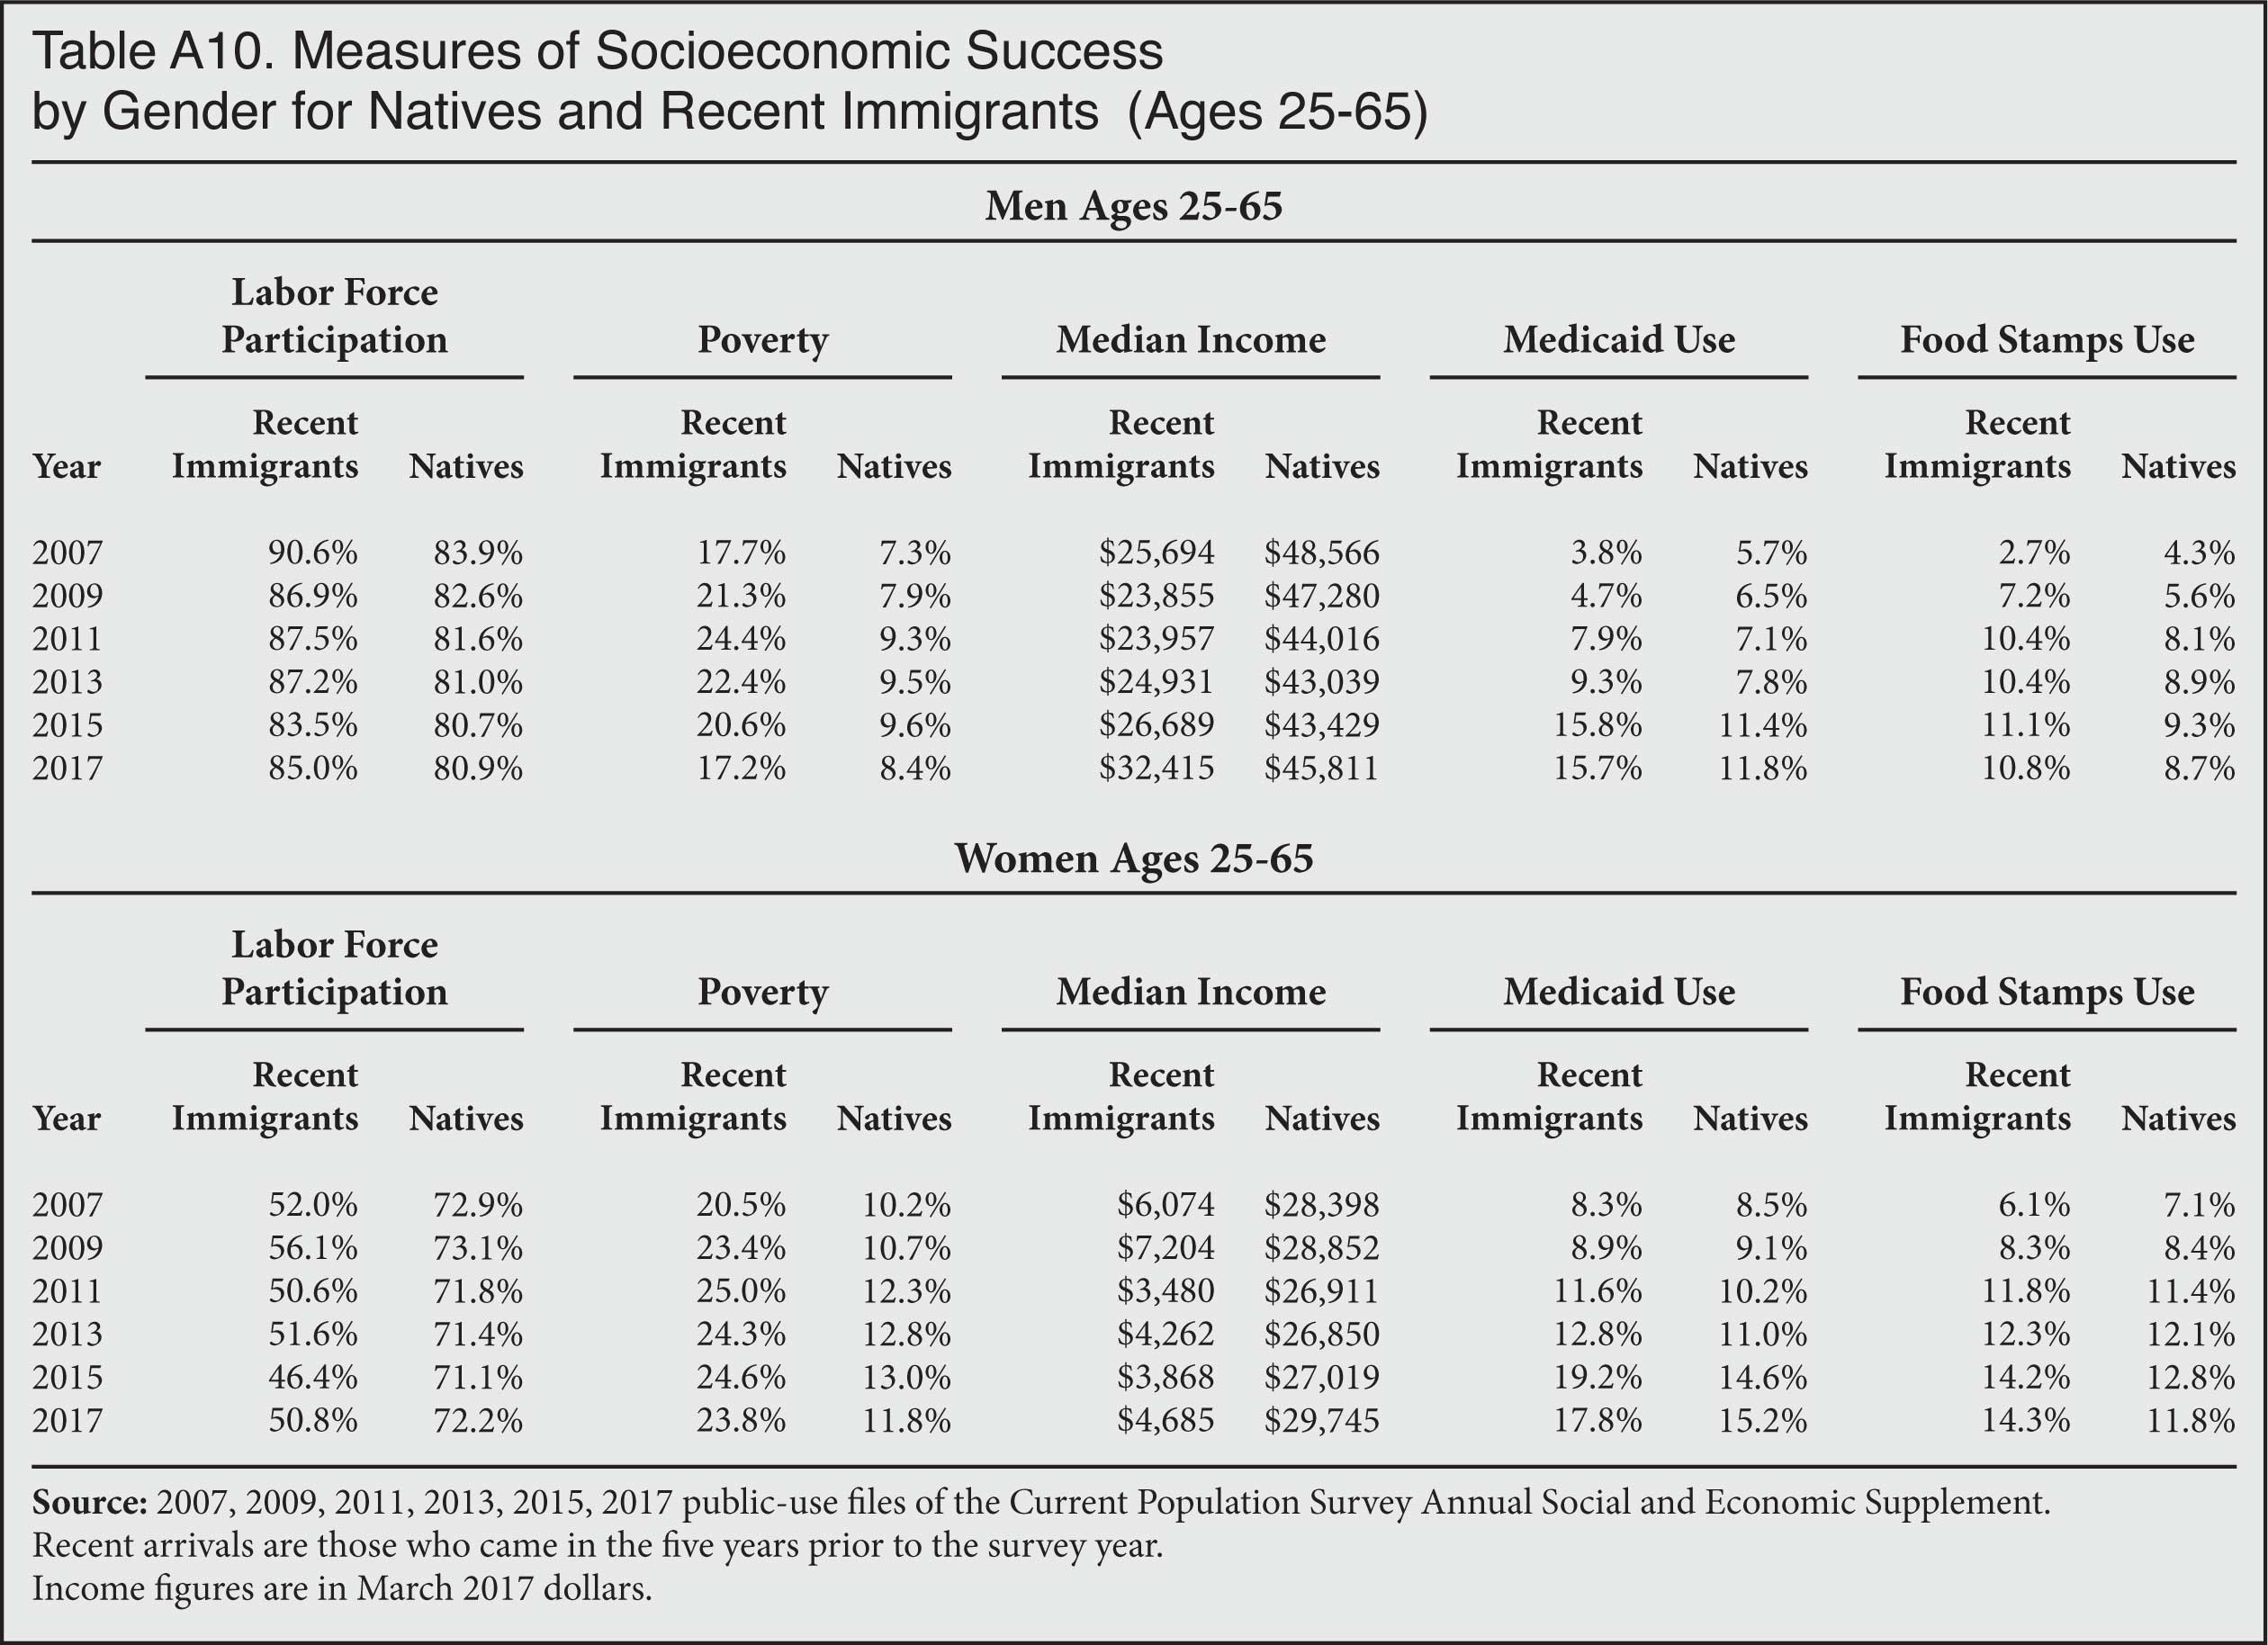
An Increase in Women. Table A8 reports the share of new arrivals who are men and women. It shows that the female share has increased from 46 percent in 2007 to 53 percent in 2017. Women historically work less and often earn less than men, and this has been true for immigrants and the native-born. Table A10 reports various measure of socioeconomic success by sex. When we look at just men, labor force participation and welfare show the same decline as when women are included, so the increase in the female share does not seem to explain why higher immigrant education has not caused a convergence with natives in these areas. The same is true of welfare use. Medicaid and food stamp use increased for both male and female new immigrants significantly more than for native men and women. Even if we look only at men, new immigrant use of these two programs increased about twice as much for immigrants as for native-born men. The increase in the share of new arrivals who are women is not the reason labor force participation and welfare use rates did not coverage with that of natives.
However, in terms of poverty, new male immigrants had a slightly lower rate in 2017 than in 2007, while the rate for female immigrants was higher. So the increase in the share of new arrivals who are women did impact overall poverty rates somewhat. But income is where we see the largest impact. The income of new immigrant men was 26 percent higher in 2017 than in 2007, while female income was lower. The increase in the female share of new arrivals does seem to help explain, at least in part, why immigrant income did not rise in the way we might have expected given the dramatic increase in immigrant education.
Less Likely Explanations for Our Findings
As we have seen, immigrants at each education level have generally not done as well as the native-born with the same education. In the prior section, we suggested three factors that may explain this situation. First, it may be that the economy does not absorb new immigrant workers as well as it once did. Natives at each education level may have done somewhat better than immigrants, though they, too, have experienced a decline in most cases, just not as pronounced as immigrants. Since both groups have struggled, it seems very likely this is due to economy-wide factors. Second, we also think it is possible that new immigrants are not as skilled at each education level as in the past relative to natives. This seems to be the case especially for immigrant women. Third, the increase in the share of new arrivals who are women seems to have had a significant impact on income, though not so much as in other areas like labor force attachment or welfare use. Below we explore other possible reasons for this situation that we think probably do not explain our findings.
Illegal Immigration. If illegal immigrants comprise a larger share of recent arrivals it might help to explain the results discussed above. Illegal immigrants may suffer disadvantages in the labor market, making them poorer on average, for example. However, several analyses have shown that the number of new illegal immigrants arriving in the country fell after 2007.17 While there is some evidence that the number of new illegal arrivals may have increased somewhat in 2015 and 2016, the level has not returned to 2007 levels.18 Moreover, it is well established that illegal immigrants are among the least-educated immigrants.19 In fact, the rise in the educational attainment of new immigrants is strong evidence that the illegal share has fallen over time. A sudden rise in new illegal immigration is almost certainly not the reason for the lack of a convergence in measures of socioeconomic success between new immigrants and natives, despite the significant increase in the relative education of new arrivals.
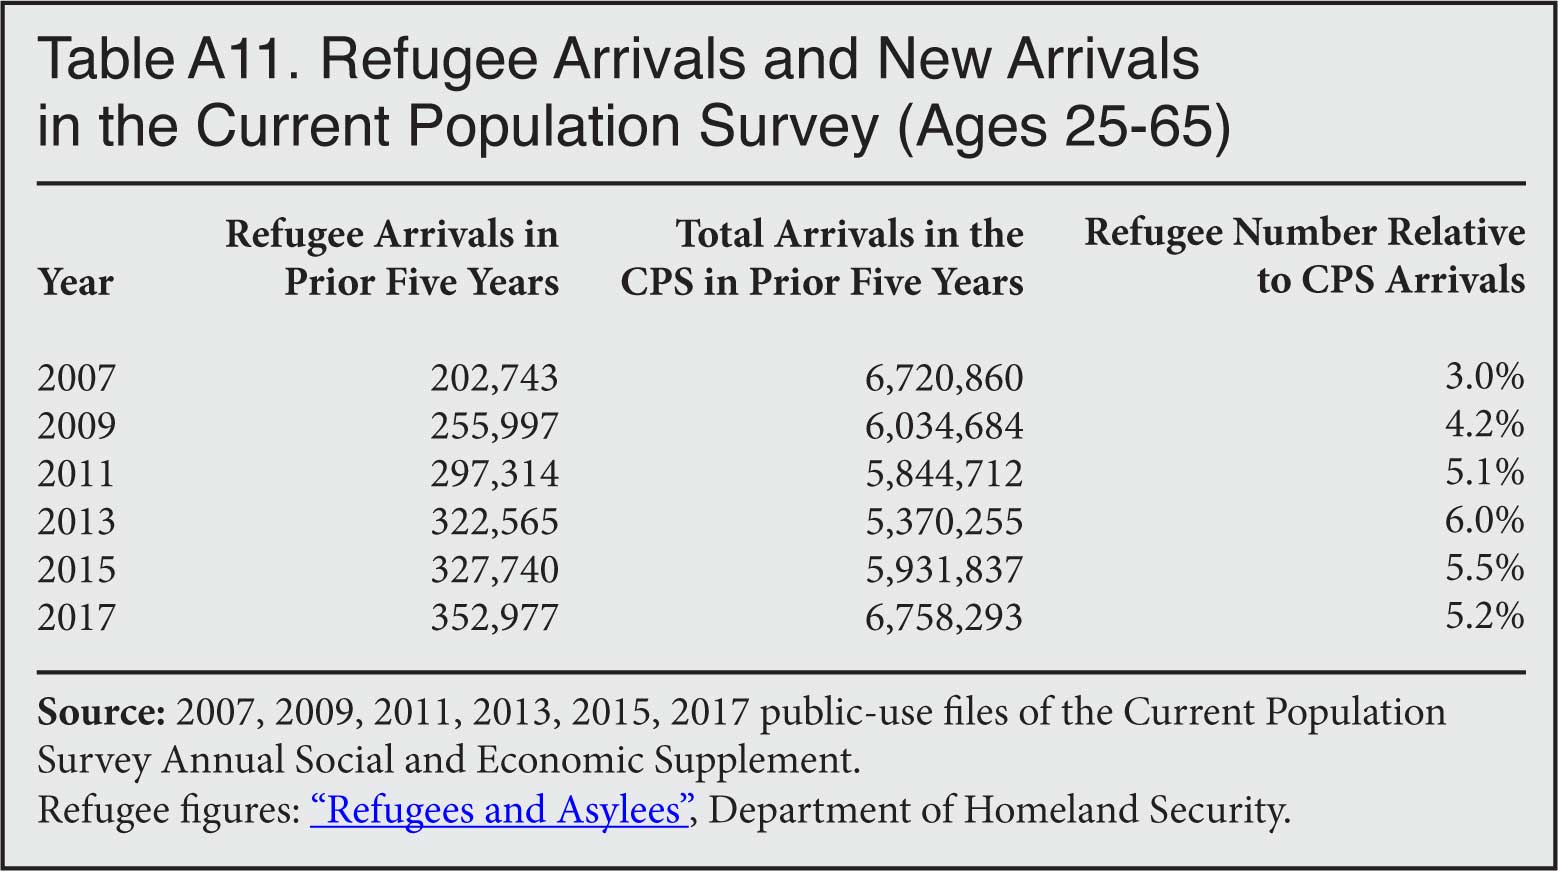
Refugee Resettlement. Refugees have immediate access to welfare programs and, not surprisingly, many struggle, at least at first, to find work.20 As a result, many are poor or have low incomes. If they are a larger share of new arrivals it could account for a decline in the economic standings of immigrants. However, they remain a modest share of all new arrivals so their impact on overall trends is proportionately modest. Table A11 in the Appendix shows that the number of new refugees arriving in the five years prior to 2017 was equal to only 5.2 percent of the total number of new arrivals in the Current Population Survey (CPS) used for this analysis and between 3 percent and 6 percent of new arrivals in prior years. Their small and relatively constant share of new arrivals makes it very unlikely that they explain our findings.
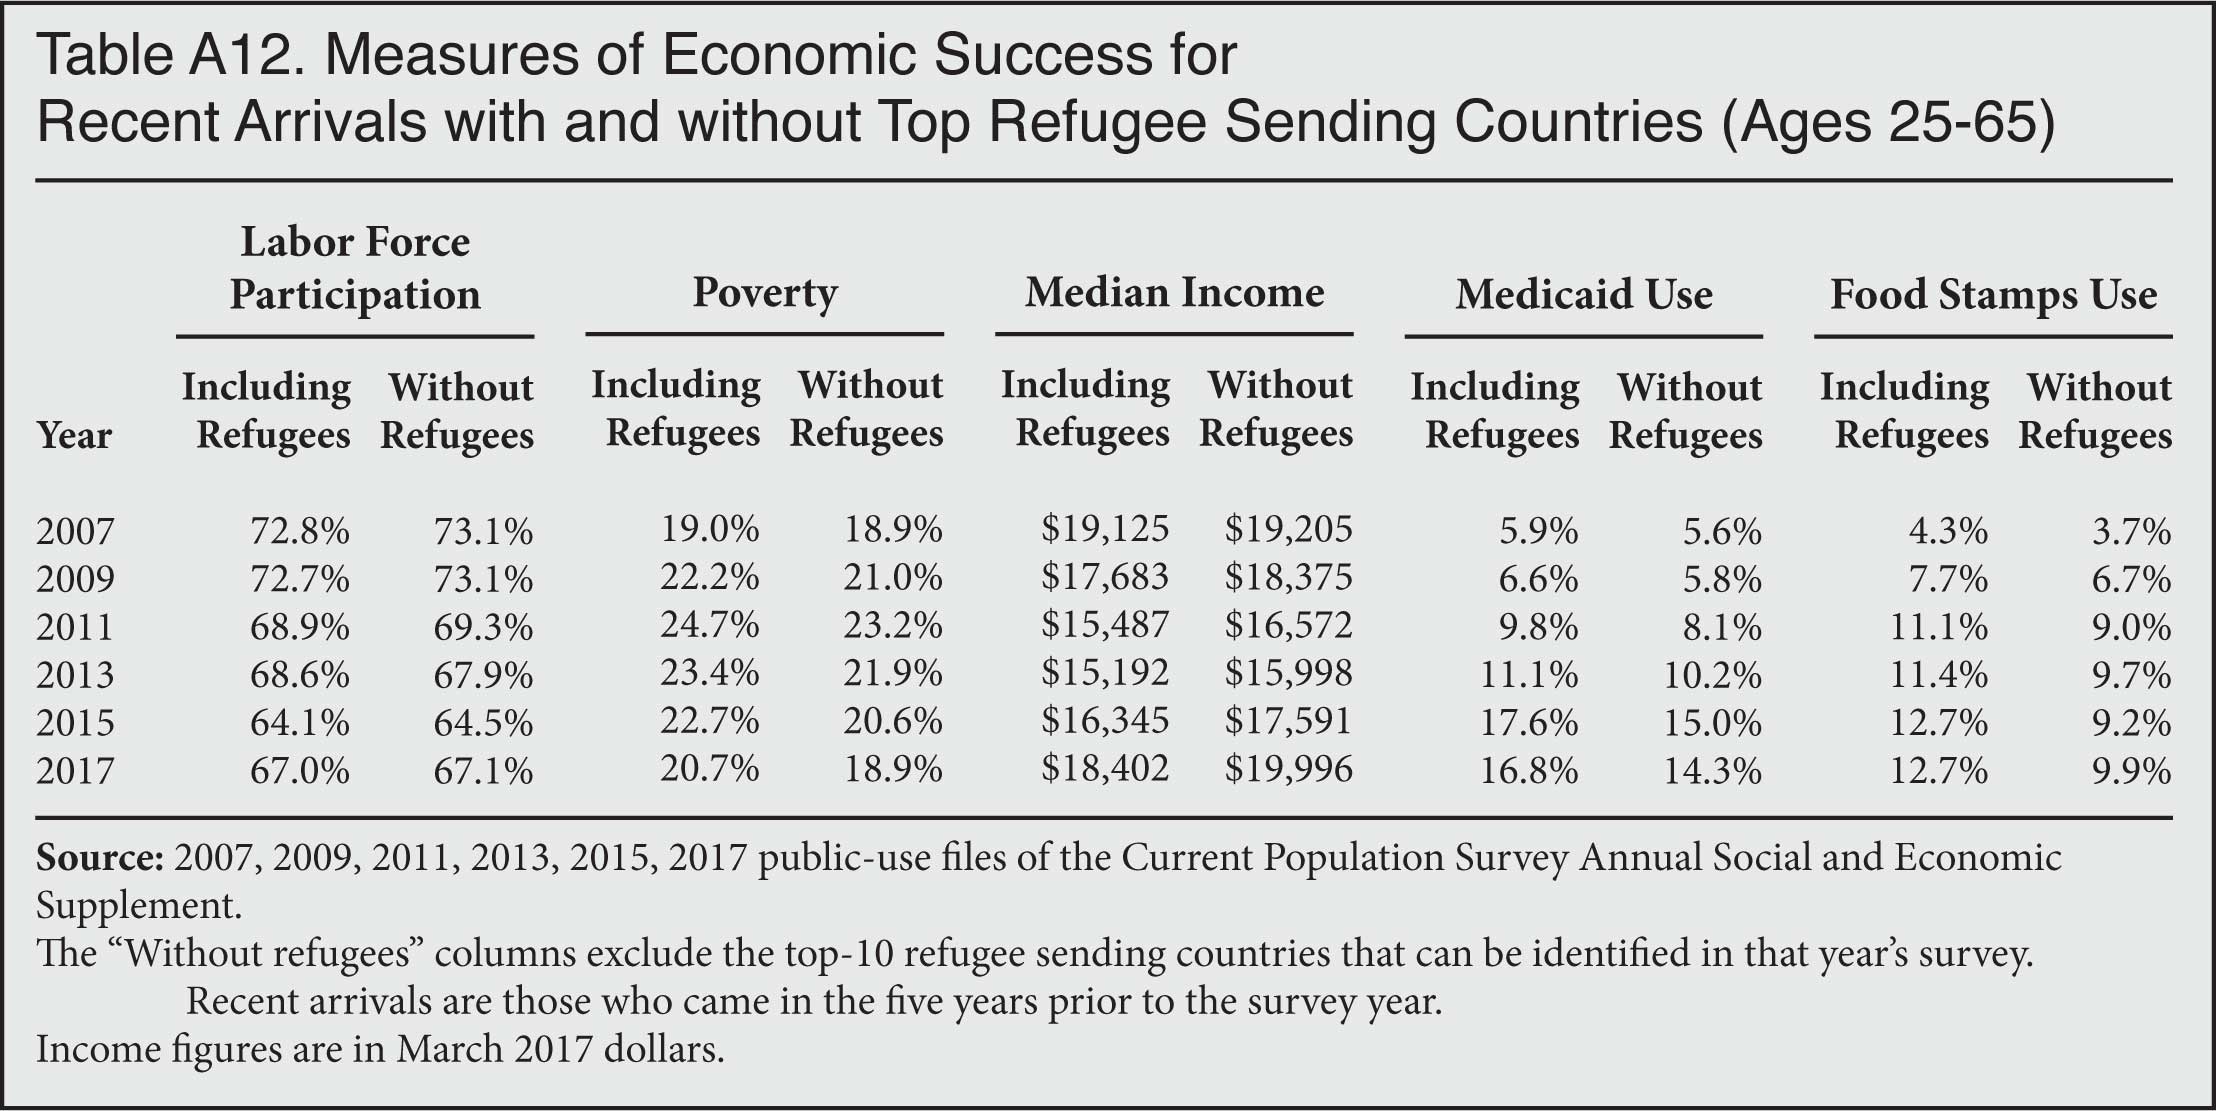
We can get some idea of the impact of refugees by excluding the top-10 refugee countries from the Current Population Survey and then recalculating measures of economic success.21 While there are some limitations to this approach, Table A12 shows that when we exclude refugee-sending countries it makes little difference to measures of economic well-being, and in particular the overall trends look the same.22 This is not surprising given their small share of new arrivals over the entire period 2007 to 2017. Based on Table A12, the one measure of success in which the removal of refugees does seem to make some difference is the share of new immigrants living in households receiving food stamps. Without those from refugee countries, the share of new immigrants in 2017 living in food stamp households is somewhat lower. But it still shows the rate is roughly equal to that of natives. Overall, it seems unlikely that the tiny increase in the share of new arrivals who are refugees between 2007 and 2017 explains why new immigrants did not close the gap with natives.
Long-Term Temporary Visitors. The number of long-term temporary visitors entering and living in the country, referred to somewhat confusingly as "non-immigrants" by the government, has increased in recent years. Visitors include guestworkers, foreign students, foreign diplomats, and exchange visitors. However, estimates of the number of such visitors ages 25 and older living in the country who might be captured in the Census Bureau data used in this analysis do not seem to have increased. The Department of Homeland Security (DHS) estimates that 1.17 million long-term temporary visitors (ages 25 and older) lived in the country in 2008, and 1.16 million did so in 2015.23 (Estimates are not available for 2007, and 2015 is the most recent year published by DHS.) It seems unlikely that the impact of temporary visitors has grown dramatically since the number over age 25 has not increased. Equally important, the inclusion of visitors in the data has an ambiguous impact on some measures of well-being examined in this report. And for other measures it should improve the figures for new immigrants.
Turning first to guestworkers and foreign diplomats, since work is a condition of their entry they should have high labor force participation, especially those 25 to 65. Most members of these two groups should also have relatively high incomes and low poverty rates. Moreover, like all temporary visitors, guestworkers and diplomats are not allowed to access welfare programs. If they comprise a larger share of new arrivals it should reduce overall rates of welfare use among new arrivals. In general, guestworkers and foreign diplomats should improve most measures of economic well-being for new immigrants.
In terms of exchange visitors, most are young. In 2015, DHS estimated that 52 percent were under age 25, so most will not show up in this analysis.24 Most of those over age 25 work for pay and, like guestworkers and diplomats, should show up in Census Bureau data as employed, though their incomes are likely to vary significantly by category. Many exchange visitors are working as doctors, researchers, teachers, and other professionals. But some exchange visitors receive more modest compensation, such as au pairs or resort workers, though many of those will be under age 25. Overall, it is not clear how these non-immigrants will impact income and poverty among new arrivals. It is worth adding that, like guestworkers and diplomats, exchange visitors are not supposed to access welfare.
As for foreign students (F and M visa holders), in 2015 the Department of Homeland Security estimated that 70 percent were under age 25, so most are excluded from our analysis.25 We can more easily identify likely foreign students in the data than other types of temporary visitors because the Census Bureau asks respondents in the CPS if they are students. However, the Census Bureau only began to do this for people over age 24 in 2013. Before 2013, only those under age 25 were asked this question.26 Therefore, we do not know the share of new arrivals ages 25 to 65 who were students in prior years in the CPS or how this might have impacted the data in the past. For 2017, we estimate that foreign students were only 5.7 percent of newly arrived immigrants (ages 25 to 65) in the CPS. We also estimate that their share of new arrivals has declined slightly from 6.5 percent in 2015 and 6.7 percent in 2013.27
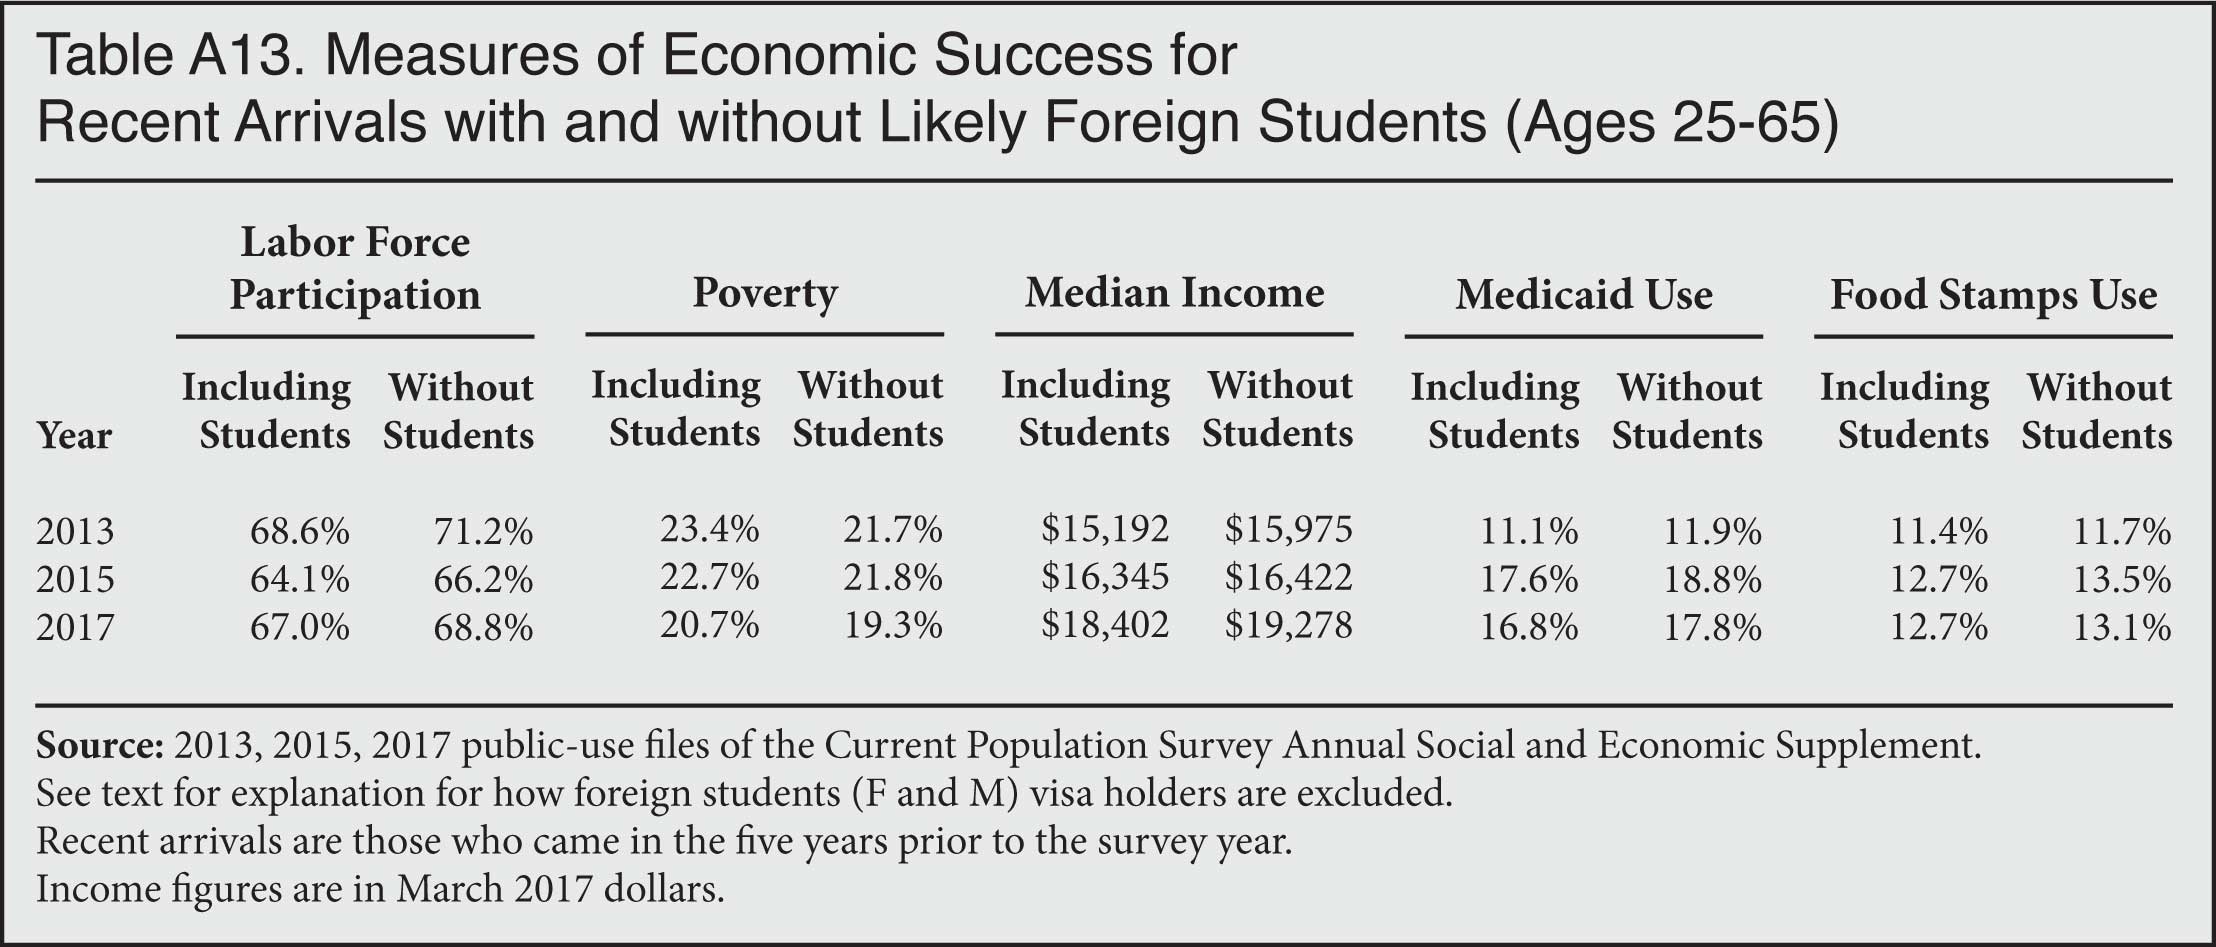
Table A13 removes the likely foreign student population among new arrivals in 2013, 2015, and 2017. Removing foreign students slightly improves labor force participation, poverty, and income among new immigrants, while increasing welfare use somewhat. But overall the effects are small. Based on Table A13, at least since 2013 foreign student visa holders do not exert a significant impact on measures of economic well-being, so it seems very unlikely that their inclusion in the data helps to explain the failure of higher levels of immigrant education to translate into a significant closing of the economic gap with natives. Of course, we cannot say how they impact trends since 2007, since we only have information going back to 2013.
Overall it seems very unlikely that temporary visitors included in Census Bureau data explain the failure of higher immigrant education levels to cause a convergence with natives in measures of socioeconomic success. The government estimates that the number living in the country over age 25 has not been increasing and their share of new arrivals is not that large.
Conclusion
There is no question that since 2007 the education levels of new immigrants have increased much faster than those of natives. This reverses a long-standing trend that dates back to at least 1970. The prior decline in the relative education of immigrants is thought to be responsible for a decline in measures of socioeconomic well-being among immigrants between 1970 and the early 2000s. This is not surprising since education is one of best predictors of economic success in modern America for immigrants and natives alike. However, the recent rapid increase in education among new arrivals, relative to natives, has not resulted in dramatic improvement in measures of socioeconomic well-being in absolute terms or relative to the native-born, at least for the measures we have examined here. In this report we focus on persons 25 to 65 because traditionally most people in this age group have completed their education and are in the labor force. New immigrants are those who arrived in the five years prior to the survey. We examined labor force participation, employment rates, income, poverty, and use of two major welfare programs. While these measures of success are not exhaustive, all of them show no convergence between newly arrived immigrants and natives over the last decade.
We explored several possible reasons for the lack of convergence. The years 2007 to 2017 have not been particularly good for either native-born Americans or immigrants. While the recovery from the Great Recession has been long-lasting, in many ways neither group has fully recovered from it, at least through the first few months of 2017. Widely cited unemployment statistics are not that meaningful because the standard unemployment rate excludes all those of working-age who are out of the labor market. For this reason, we examine labor force participation (the share working or looking for work) and the employment rate (the share actually working). For new immigrants ages 25 to 65, both measures show things were well below the 2007 level in 2017. Native rates were only slightly lower in 2017 than in 2007. As a result, the gap between new immigrants and natives for these two measures of labor force attachment has widened significantly. The same holds true for Medicaid and food stamp use; though native welfare use also increased substantially, the increase was not as large as for new immigrants. In terms of income and poverty, the gap in 2017 was not wider than it was in 2007, but it did not narrow either. We explored a number of different possibilities for why higher education levels have not produced better outcomes for new immigrants.
We suggest three possible explanations for this situation. First, the economy does not absorb new workers as well as it once did. As new entrants into the labor market, recently arrived immigrants seem to have struggled to find jobs more so than in the past. In short, economy-wide factors likely explain some of the failure of new immigrants to convert their higher education levels into greater prosperity. Second, we also think it is possible that new immigrants are not as skilled at each education level as in the past relative to natives. Our analysis of immigrant socioeconomic well-being by education shows that, in general, at every education level immigrants have tended to do worse than their native-born counterparts with the same education. Third, the increase in the share of new arrivals who are women may also have impacted some measures of economic success, particularly income. All of these factors likely have played some role in explaining our findings.
We think there are other factors that can be, for the most part, ruled out as explaining the failure of immigrant and native measures of success to converge. First, there is no evidence of a large and sudden rise in illegal immigration. Second, the share of new arrivals who are refugees was only slightly larger in 2017 than in 2007, and the refugee share of new arrivals has fallen some since 2013. Refugee resettlement is too small to explain our results. Third, it seems unlikely that an increase in long-term temporary visitors (e.g. guest workers and foreign students) explains our results. According to government estimates, the share of long-term visitors in the country over the age of 25 has not increased.
While we think our findings are important, the reasons for them are clearly in need of more analysis. In many ways this report raises more questions than it answers. At this point, all we can say is that new immigrants are much more educated than they were a decade ago and that this increase has not resulted in a convergence in their labor force attachment, income, or welfare use with natives. Of course, it is certainly possible that as new immigrants live in the United States longer and become more established, their higher education levels will lead to a more rapid improvement in their situations. But at present their initial socioeconomic situation is no better than in the recent past.
Appendix
End Notes
1 Jeanne Batalova and Michael Fix, "Immigrants and the New Brain Gain: Ways to Leverage Rising Educational Attainment", Migration Policy Institute, June 2017; and Richard Fry, "Today's newly arrived immigrants are the best-educated ever", Pew Research Center, October 5, 2015.
2 We also have done an analysis of those who arrived in the prior three years for each odd-numbered year, and results are nearly identical.
3 This includes naturalized American citizens, legal permanent residents (green card holders), illegal aliens, and people on long-term temporary visas such as foreign students or guest workers, who respond to Census Bureau surveys.
4 In 1997 the National Academies of Sciences, Engineering, and Medicine published The New Americans: Economic, Demographic, and Fiscal Effects of Immigration, which features an extensive discussion of the long-term decline in immigrant education. The study was updated in 2017 and again devoted a good deal of attention to the education of immigrants relative to natives and the economic performance of each new wave of immigrants. See The Economic and Fiscal Consequences of Immigration, National Academies of Sciences, Engineering, and Medicine, 2017.
5 Tables A2 to A7 in the appendix of this report show clearly the importance of educational attainment. Higher levels of education are associated with better economic outcomes for immigrants and native alike.
6 Table A14 shows measures of socioeconomic success for new immigrants and natives using the ACS.
7 The public-use sample of the 2016 ACS includes roughly 3.1 million respondents, nearly 360,000 of whom are immigrants.
8 The CPS has been in operation much longer than the ACS, and for many years it was the primary source of data on the labor market characteristics, income, welfare, and other socioeconomic measures of the American population. Another advantage of the CPS, compared to the ACS, is that every household in the survey receives an interview (over the phone or in person) from a Census Bureau employee. Like the ACS, the CPS is weighted to reflect the actual size of the total U.S. population. Unlike the ACS, the CPS does not include those in institutions, such as prisons or nursing homes. However, those in institutions are generally not part of the labor market, nor are they typically included in statistics on the labor market, poverty, income, and welfare use. In our analysis of the ACS in Table A14 we exclude the institutionalized population.
9 Technically these are individuals who have lived in the United States for no more than five years and two months, as the CPS ASEC reflects the population as of March 1 each year.
10 Tables A1 through A7 in the appendix report statistics for natives and new arrivals ages 25 to 65, 18 to 65, and 18 and older. Overall, we find little meaningful difference between the results for all three age groups.
11 In 2017, 34 percent of all immigrants 25 to 65 (not just new arrivals) had a college education and 24 percent had not completed high school. This compares to 36 percent of natives (25 to 65) with at least a bachelor's degree and 6 percent who had not completed high school.
12 Poverty figures are based on income for the entire prior calendar year, so the 2017 data reflects poverty in 2016, the 2015 poverty data is for 2014, and so on.
13 Federal law bars most permanent residents who have lived in the United States for less than five years from using Medicaid. Illegal immigrants and temporary visitors are barred from the program. Temporary visitors are also barred from the program. However, permanent residents (green card holders) can immediately use welfare programs if they are refugees, asylees, or entered under one of several other smaller humanitarian categories. Also, becoming a citizen, which is allowed after only three years for the spouses of U.S. citizens (and five years for most others), confers immediate program eligibility as well. Low-income pregnant women, regardless of immigration status, who are otherwise ineligible, can be enrolled in the program as well. There are other small groups of new arrivals who are also allowed to enroll in Medicaid, such as the family members of veterans and trafficking victims. A much larger group of new arrivals who are covered by Medicaid are those enrolled in the program at state expense. According to the Department of Health and Human Services, 14 states provide some adult immigrants who are otherwise ineligible for Medicaid with state-only-funded Medicaid. There is also likely some unknown amount of fraudulent receipt of this program. DHS also reports that there are seven states that provide state-only-funded food assistance to immigrants otherwise ineligible for SNAP (food stamps). This helps explain why so many recent immigrants live in households using the program. Also, in the case of SNAP, low-income immigrants can receive benefits from the program on behalf of U.S.-born children.
14 We can also examine SNAP based on the year of arrival of the household heads. Confining our analysis to only households headed by persons 25 to 65 shows that in 2007, 6.6 percent of native households received this program, as did 5.5 percent of households headed by an immigrant who arrived in the prior five years. By 2017, 11.1 percent of native households and 12.3 percent of households headed by recent immigrants used the program. Like the individual-level analysis reported in Figure 8, there has been a significant increase in both native and new immigrant use of food stamps at the household level. Also similar to the pattern shown in Figure 8, the much more rapid rise in education among new immigrants has not caused immigrant and native use rates to converge.
15 While we do not know what share of these immigrants earned their degree in the United States or overseas, since we are focused on 25 to 65 year olds who have only lived in the country for five years or less, it must be the case that the majority earned their undergraduate degrees in other countries.
16 See end note 14 for a discussion of welfare use by household head.
17 See Steven A. Camarota and Karen Zeigler, "Homeward Bound: Recent Immigration Enforcement and the Decline in the Illegal Alien Population", Center for Immigration Studies Backgrounder, July 30, 2008; Steven A. Camarota and Karen Zeigler, "A Shifting Tide: Recent Trends in the Illegal Immigrant Population", Center for Immigration Studies Backgrounder, July 27, 2009; D'Vera Cohn, Jeffrey S. Passel, and Ana Gonzalez-Barrera, "Rise in U.S. Immigrants From El Salvador, Guatemala and Honduras Outpaces Growth From Elsewhere Lawful and unauthorized immigrants increase since recession", Pew Research Center, December 7, 2017; Robert Warren, "U.S. Undocumented Population Drops Below 11 Million in 2014, with Continued Declines in the Mexican Undocumented Population", Journal on Migration and Human Security, Vol. 4, No. 1 (2016): 1-15.
18 Steven A. Camarota and Karen Zeigler, "1.8 Million Immigrants Likely Arrived in 2016, Matching Highest Level in U.S. History", Center for Immigration Studies Backgrounder, December 28, 2017.
19 The Heritage Foundation has estimated that illegal immigrants have on average 10 years of schooling. See Robert Rector and Jason Richwine, "The Fiscal Cost of Unlawful Immigrants and Amnesty to the U.S. Taxpayer", Heritage Foundation, May 6, 2013. In our study of illegal immigrants based on 2011 Census Bureau data, we found that 54 percent of adult illegal immigrants have not completed high school, 25 percent have only a high school degree, and 21 percent have education beyond high school; see Steven A. Camarota, "Immigrants in the United States, 2010, A Profile of America's Foreign-Born Population", Center for Immigration Studies Backgrounder, August 8, 2012, p. 69. The Pew Research Center estimated that 47 percent of all illegal immigrants have not completed high school, 27 percent have only a high school education, 10 percent have some college, and 15 percent have a bachelor's or more; see Jeffrey S. Passel and D'Vera Cohn, "A Portrait of Unauthorized Immigrants in the United States", Pew Hispanic Center, April 14, 2009, Figure 16, p. 11.
20 Unlike other types of immigrants, the federal government does attempt to measure the progress of new refugees and includes this information in its annual report to Congress each year. The report is based in part on the Annual Survey of Refugees conducted by the Office of Refugee Resettlement within the Department of Health and Human Services. The survey has for many years shown that a large share of new arrivals are poor, access welfare programs, and that many do not work. Since they are admitted for humanitarian reasons this is not unexpected. The annual reports to Congress can be found here.
21 We do this in a straightforward manner. For example, in 2007 the top-10 refugee-sending countries in the prior 10 years were Somalia, Ukraine, Liberia, Russia, Laos, Cuba, Sudan, Iran, Vietnam, and the countries of the former Yugoslavia. We excluded immigrants from these countries from our 2007 analysis. We exclude the top-10 refugee countries in the prior five years for the 2009, 2011, 2013, 2015, and 2017 analyses as well (a slightly different set of countries for survey). The top-10 refugee countries account for between 76 and 94 percent of all refugees, depending on the five-year period. This variation does introduce imprecision to our analysis.
22 The main limitation of this approach is that a significant shares of new arrivals from some of the top refugee-sending countries are not refugees themselves. So we are excluding too many people from the data by excluding all new arrivals from those countries. Furthermore, some refugee-sending countries cannot be identified in the CPS.
23 Partly based on Census Bureau data, the Department of Homeland Security periodically estimates the number of long-term visitors living in the country. While some have been in the United States for many years and are not new arrivals as defined in this analysis, most should show up in the Current Population Survey as having arrived in the last five years at the time of each survey. Many of these individuals are young and so would not be included in this analysis. In 2015, DHS estimated that 42 percent of long-term visitors were under age 25, in 2008, it estimated it was 36 percent. The total number of long-term visitors in the country over age 25 did increase modestly, from 1.17 million in 2008 to 1.29 million in 2011, but was only 1.16 million in 2015. See Table 5 in the 2008 estimates, Table 6 in the 2011 estimates, and Table 3 in the 2015 DHS estimates.
24 Bryan Baker, "Nonimmigrants Residing in the United States: Fiscal Year 2015", Department of Homeland Security, Office of Immigration Statistics, September 2017.
25 Ibid.
26 It now asks those under age 55 if they are students.
27 We identify likely foreign students (F and M visa holders) as those new arrivals who are not U.S. citizens and who report they do not use the Medicaid program, since those on F and M visa are barred from using this program. Further, we confine our analysis to only full-time students. In general, F and M visa holders should show up in the CPS as full-time. In 2015, DHS estimated 230,000 foreign students in the country over age 25, and our analysis of the 2015 CPS shows 241,000 foreign students among new arrivals in this age group, so we have confidence that our estimate does a reasonable job of capturing the foreign student population.
