Download this Backgrounder as a pdf
Steven A. Camarota is the Director of Research and Karen Jensenius is a demographer at the Center for Immigration Studies.
Monthly Census Bureau data show that the number of less-educated young Hispanic immigrants in the country has declined significantly. The evidence indicates that the illegal population declined after July 2007 and then rebounded somewhat in the summer of 2008 before resuming its decline in the fall of 2008 and into the first quarter of 2009. Both increased immigration enforcement and the recession seem to explain this decline. There is evidence that the decline was caused by both fewer illegal immigrants coming and an increase in the number returning home. However, this pattern does not apply to the legal immigrant population, which has not fallen significantly.
Among the findings:
- Our best estimate is that the illegal population declined 13.7 percent (1.7 million) from a peak of 12.5 million in the summer of 2007 to 10.8 million in the first quarter of 2009.
- If we compare the first quarter of 2007 to the first quarter of 2009, the implied decline is 1.3 million (10.9 percent). In just the last year the decline was 5.7 percent.
- By design, these estimates produce results similar to those from the Department of Homeland Security (DHS). DHS estimates of the illegal population show a 1.5 percent decline between January 1, 2007, and January 1, 2008. Our estimates show a 1.6 percent decline over the same time period. DHS has not yet estimated the illegal population for January 2009.
- There is evidence that the number of new illegal immigrants arriving has fallen by about one-third in the last two years compared to earlier in this decade.
- There is also evidence that the number of illegal immigrants returning home has more than doubled in the last two years compared to earlier in this decade.
- While migration patterns have fundamentally changed, it must be remembered that the overwhelming majority of illegal immigrants have not left the country, and tens of thousands of new illegal immigrants continue to settle in the country each year.
- Our analysis shows that only the illegal immigrant population has declined. The legal immigrant population does not show the same decline. This is also true for Mexico, the top illegal-immigrant-sending country.
- The fact that the legal immigrant population does not show the same decline is an indication that stepped up enforcement has played a role.
- Another indication that enforcement has played a role in the decline is that the illegal immigrant population began falling before there was a significant rise in their unemployment rate.
- While the decline began before unemployment among illegal immigrants rose, unemployment among illegal immigrants has increased dramatically and must now be playing a significant role in reducing their numbers.
- There is evidence that the illegal population rose in the summer of 2007, while Congress was considering legalizing illegal immigrants. When that legislation failed to pass, the illegal population quickly began a dramatic fall.
- There is no way to know if the current trend will continue. Given President Obama’s stated desire to legalize illegal immigrants and his backing away from enforcement efforts, it seems likely that when the economy recovers, the illegal population will resume its growth.
Introduction
There is widespread agreement that until recently the number of illegal immigrants in the United States was growing. However, there is now very strong evidence that the overall size of the illegal population is no longer increasing and, in fact, is falling. Numerous stories in the media, estimates by the federal government, and research by those outside the government all point to a significant change in migration patterns. For example, the Department of Homeland Security (DHS) estimates that between January 2000 and January 2007 the illegal alien population grew 3.3 million. But the newest DHS estimates show that between January 1, 2007, and January 1, 2008, the illegal alien population declined 180,000.1
This study analyzes the Current Population Survey (CPS), which is collected monthly by the Census Bureau. The findings show clear evidence that the illegal population has declined significantly. The evidence indicates that since hitting a peak in the summer of 2007 the illegal population may have declined by almost 14 percent through the first three months of 2009. In just the last year we find a decline of 5.7 percent from the first quarter of 2008 to the first quarter of this year. A decline in the illegal population is consistent with anecdotal evidence reported in the media of fewer immigrants coming and more returning home.2 There are also data showing a significant decline in remittances sent home by immigrants.3 In addition, it is consistent with the significant drop in border apprehensions.4 Recent migration data from the Mexican government also show a very significant decline in net migration from that country.5
Future enforcement efforts as well as the state of the economy will likely determine if the current trend continues. President Obama has repeatedly stated his strong desire to legalize those in the country illegally and it is unclear to what extent the new administration will enforce immigration laws. Also the future direction of the economy, which is likely to play a very significant role in migration trends, is another unknown factor. The relative importance of increased enforcement versus the economy is difficult to determine. What is clear is that a very long-standing migration pattern has reversed. But once the economy recovers and if enforcement is reduced, which seems likely, the illegal population will almost certainly resume it growth.
New Enforcement Efforts
When efforts to legalize illegal immigrants failed in the U.S. Senate in the summer of 2007, then Secretary of Homeland Security Michael Chertoff and Commerce Secretary Carlos Gutierrez stated that, “until Congress chooses to act, we’re going to be taking some energetic steps of our own.”6 Even before the legalization was defeated in June 2007, the administration was doing more to enforce the law. The share of the U.S. border that has a fence has increased significantly in the last three years and the number of Border Patrol agents has more than doubled recently. The number of local law enforcement personnel participating in the 287(g) program, which allows local police to enforce immigration laws, has increased dramatically as have the number of aliens removed (which includes deportations).7 The E-Verify program, which allows employers to screen workers to see if they are authorized to work in the country, now covers more than one out of 10 new hires in the country and doubled in size between 2007 and 2008.8 Worksite enforcement has seen some of the largest increases in recent years, with the number of criminal and administrative arrests increasing more than five-fold since 2005.9 Over the past two years, many state and local governments have also enacted or considered initiatives that buttress federal government efforts to enforce immigration laws.
In many ways local and federal efforts are still quite modest and represent a large relative increase from what was a very low level of enforcement. And these efforts are a significant departure from a policy of non-enforcement during the Clinton administration and for most of the George W. Bush administration. In addition to the direct impact of these efforts, all of them have received very significant coverage in the Spanish language media, which tends to magnify their effect. One can debate the effectiveness of increased enforcement in the last few years, but there is no doubt that enforcement has increased substantially.
Falling Illegal Immigrant Population
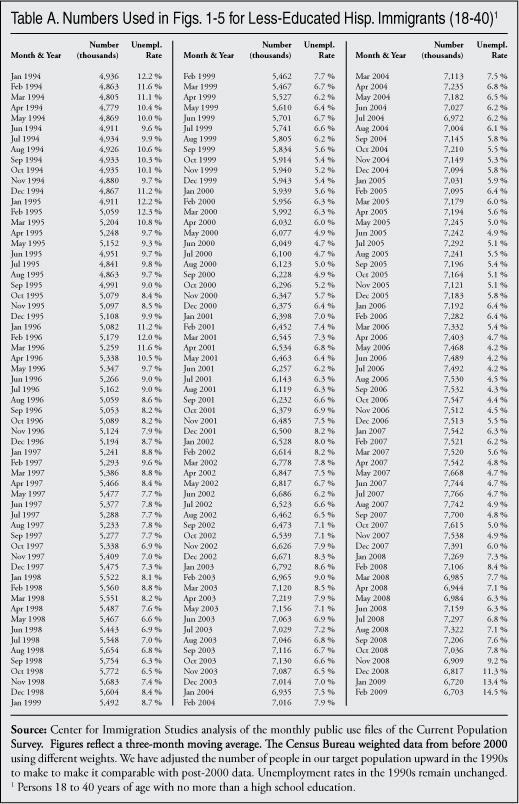
Illegal Immigrant Population. Figure 1, shows the number of foreign-born adults living in the country between January 2000 and February 2009 based on the Current Population Survey (CPS). The data points reflect a three-month moving average.10 Thus the number for February is for January, February, and March of 2009, the first quarter of 2009. (Table A at the end of this report shows the raw numbers for Figure 1.) In this report we use the terms immigrant and foreign-born synonymously.11 We also use the terms illegal immigrant and illegal alien interchangeably.12 The lower line in Figure 1, which corresponds to the left axis, shows the number of Hispanic immigrants 18 to 40 years of age with no more than a high school education living in the United States each month since January 2000. We estimate that three-fourths of these young, less-educated, foreign-born Hispanic adults are illegal aliens and that roughly two-thirds of all adult illegal aliens are young, less-educated, Hispanic immigrants. This population can be seen as the likely illegal immigrant population. There is a large body of research showing that illegal aliens are overwhelmingly Hispanic, young, and have relatively few years of schooling.13 The top line shows the remainder of the adult immigrant population or the likely legal immigrant population. Examining these two proxy populations in this way provides a great deal of insight into trends in the size and growth of the legal and illegal immigrant populations.
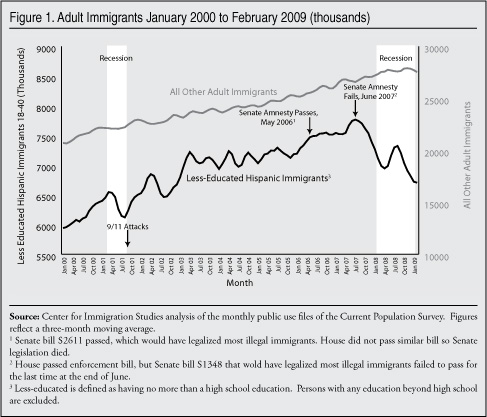
It must be remembered that there is always a significant amount of turnover in both of these populations. New immigrants (legal and illegal) arrive from abroad, while some immigrants already in the country die or return to their home countries. Since the death rate remains virtually unchanged over the time period of this study, a sudden and dramatic decline in one or both of these populations means that more people are leaving the country than are coming into the country. If it was only the case that fewer immigrants were coming, but those already in the country were not leaving, the total population should not fall sharply. Instead, it would grow modestly, remain the same, or decline slowly. We will return to the question of immigrants coming and going later in this report. What is important about the figures is that they show total populations, which represent the cumulative effect of in-migration and out-migration. If we assume that the quality of the data did not somehow deteriorate significantly in the last 19 months, then there is no way for this steep drop to occur unless there was a significant increase in out-migration.
Figure 1 makes clear that something has changed in recent years for the likely illegal immigrant population. If we compare the peak in July 2007 (June/July/August) to the first quarter of 2009 (January/February/March), we find a decline in the likely illegal population of almost 14 percent. A comparison with the very peak in July may not be the best way to look at the data since spring and summer are normally when the illegal population peaks and it also coincides with the final defeat of legislation in the U.S. Senate that would have given an amnesty to illegal immigrants. When the bill failed to pass at the end of June 2007, the illegal population began to drop almost immediately. Table 1 shows the likely illegal population in February of each year, which is also the first quarter of each year (January/February/March). The decline over the last two years has been about 11 percent. The decline since last year is 5.7 percent.
Seasonality in the Illegal Population. Figure 1 shows that in general, the illegal population tends to be larger in the spring and summer when employment in agriculture, hospitality, and construction tends to rise. But this trend is not clear-cut in every year. Moreover, if the illegal population is growing, there will be a general tendency for months later in the year to have higher totals than months earlier in the year. Figure 1 shows fluctuations in the likely illegal population in 2001 and 2002. The population of less-educated, young, Hispanic immigrants peaked in March 2001 and declined about 5 percent by September 2001. The National Bureau of Economic Research reports that a recession began in March of 2001 and ended in November of that year, though there is some debate about these dates. The second peak occurred in April 2002 followed by a 5 percent decline by September 2002. These swings seem to represent both the recession and a temporary increase in immigration enforcement that occurred after the 9/11 attacks. Another factor to consider is that in the months just prior to the 9/11 attacks, President Bush indicated his desire to legalize illegal immigrants from Mexico and perhaps elsewhere. This also could have impacted migration patterns.
The current decline in the illegal population, which began after July 2007, seems to show a return to seasonality with a significant rise in the summer of 2008. As will be shown in Figure 5, unemployment for this population fell in the middle of 2008, as it typically does in the summer. But unemployment increased dramatically in the last quarter of 2008. As this happened, the likely illegal population fell significantly.
The summer of 2008 was a contrast with the lack of seasonality in 2006 and 2007. In both years an amnesty for illegal immigrants seemed like a real possibility. This political activity could account for the lack of fluctuation in the likely illegal population in 2006 and into 2007, as many illegals took a “wait and see” approach. We do find some evidence, however, that the number of illegal immigrants returning home was very low in 2006 and the first part of 2007.
Growing Legal Immigrant Population. In contrast to the likely illegal immigrant population, the top line in Figure 1 for the likely legal immigrant population does not show a decline. It shows a continual and relatively steady increase in size until the last few months, when the population fell slightly. Between the first quarter of 2007 and the first quarter of 2008 the population of likely legal adult immigrants grew 2.9 percent and over the same period in 2008 and 2009 it grew almost 1 percent. Whatever factors affect the likely illegal population, they do not seem to be impacting legal immigrants in the same way. While the economic downturn must have some impact on legal immigrants, there is no indication that their numbers have fallen in the way that that those for illegal immigrants have declined. Since only illegal immigrants face enforcement, this tends to support the idea that enforcement accounts for some share of the decline in illegal immigration.
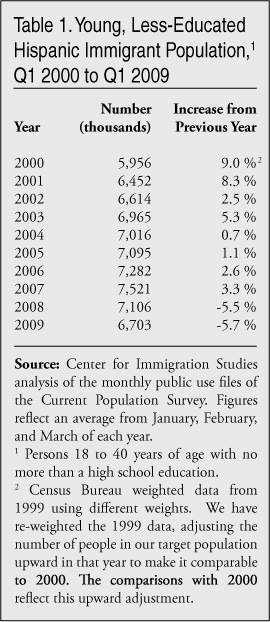
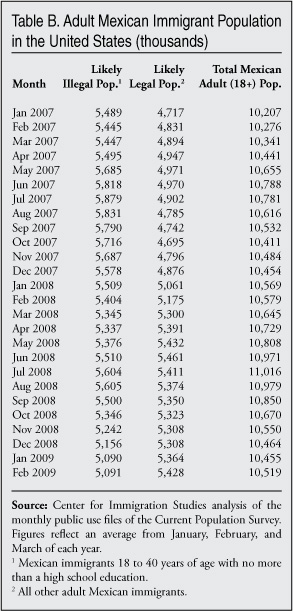
Mexican Immigrants. We can see the same pattern if we focus on just adult Mexican immigrants in the United States. Looking at Mexican immigrants can provide insight into illegal immigration because a very large share of illegal immigrants are from Mexico. In its most recent report, DHS estimates that Mexicans comprise about 61 percent of all illegal immigrants in the country. Figure 2 shows the adult Mexican immigrant population. (Table B at the end of this report provides the numbers for Figure 2.) The top line in Figure 2 shows the likely illegal Mexican immigrant population in the United States — young (18 to 40) Mexicans with no more than a high school education. It shows the same pattern of decline as likely illegal immigrants overall found in Figure 1. Since the peak in July 2007, the likely illegal Mexican population has declined 13.4 percent through February of this year. This is very similar to the 13.7 percent decline in the overall likely illegal population shown in Figure 1.
In contrast, the likely legal immigrant population from Mexico in Figure 2 has increased 10.7 percent over this period.14 Like Figure 1, we see that the rest of the adult Mexican-born adult population is not declining in the same way as the likely illegal population. This population of likely legal immigrants is older, more educated, and more firmly established in the United States. The figure supports our overall finding that it is illegal immigrants whose migration patterns have fundamentally changed, not legal immigrants. As a result, the overall adult Mexican population in the United States has fallen just 2.4 percent since July 2007. These divergent trends may make it difficult to detect changes in migration trends for Mexico as a whole.
The fact that we see this divergent trend between the likely legal and illegal immigrant populations from the top illegal immigrant-sending country gives us additional confidence that by focusing on less-educated, young, Hispanic immigrants we can examine trends in illegal immigration. We are not simply picking up a general decline in the number of Mexican immigrants in this country. In fact, the total adult immigrant population from Mexico has declined only slightly.
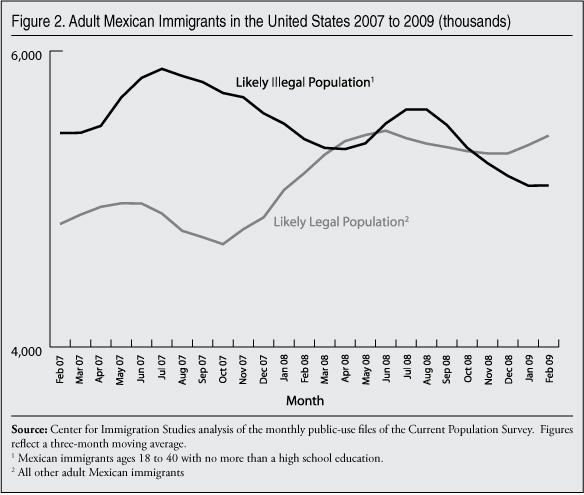
Changes from the Prior Year. We can also see just how much things have changed for the overall likely illegal immigrant population by looking at Figure 3, which shows the change in the overall size of this population compared to the same month in the prior year. It shows that until recently there had never been a sustained period in this decade when the number of likely illegal immigrants fell dramatically from year to year, though there have been times of little growth. But since the latter part of 2007 there has been a dramatic and sustained decline in this population compared to the same month in the year before. Figure 3, by showing changes each month compared to the same month in the prior year has the advantage of controlling for seasonality in the data. As already discussed, the illegal population tends to be larger in spring and summer when employment in agriculture, hospitality, and construction tends to rise. Figure 4 shows the same information as Figure 3 except that it reports the percentage change in the size of the likely illegal population. On average, since January of 2008 the likely illegal population is about 7 percent lower each month compared to same month in the prior year. This is true through the first quarter of 2009. As already discussed, if we compare the two-year period of the first quarter of 2007 (which is reported as February) to the first quarter of 2009 we find a total decline of 10.9 percent in the likely illegal population.
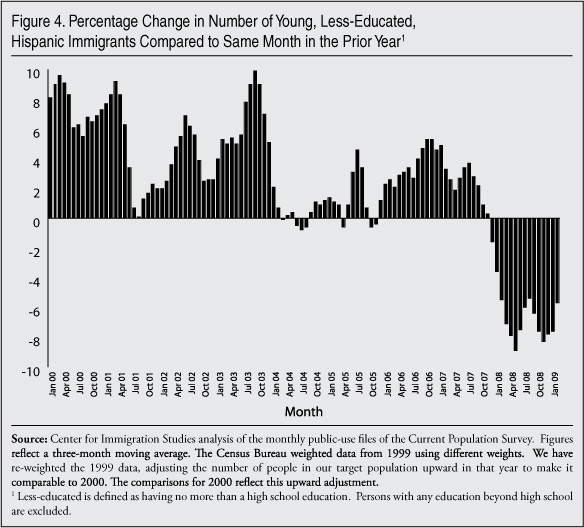
While different points of comparison produce somewhat different results, the overall picture that emerges from Figures 3 and 4 is that the less-educated, young, Hispanic immigrant population has declined in a way that is without precedent in this decade and even going all the way back to 1994.
Enforcement vs. the Economy. Figure 5 examines the size of the likely illegal immigrant population going back to January 1994, when the Census Bureau began collecting data on the foreign born on a regular basis.15 (As in all prior figures, Figure 5 uses a three-month moving average.) Until recently, the overall trend since 1994 was clearly upward, though there were fluctuations.16 The lower line in the figure shows the unemployment rate for less-educated young immigrant Hispanics. The figure shows some fluctuations in the size of this population due to a number of factors, including sampling variability, seasonality, enforcement efforts, and economic conditions in the United States and the home countries. In general, the illegal population tends to grow most in the spring and summer, though seasonality is not clearly present in all years.
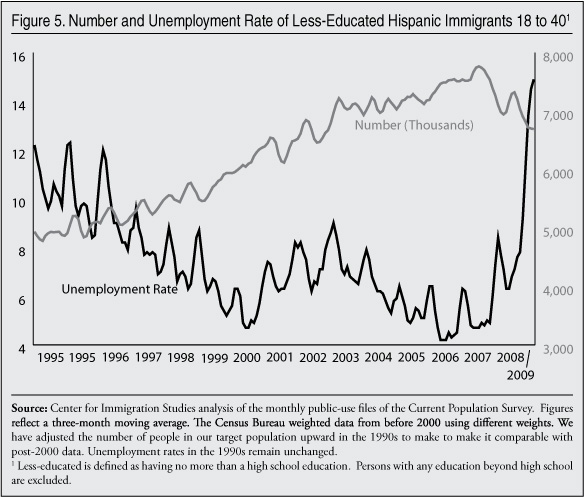
Figure 5 shows that the recent fall in the number of less-educated, young, foreign-born Hispanics began in 2007, before there was a significant jump in their unemployment rate.17 The decline in the size of the likely illegal population was statistically significant before there was a statistically significant rise in their unemployment rate. This makes sense because, as shown in Figure 1, the recession did not officially begin until December 2007. Since the decline in the number of likely illegal immigrants began before the economy deteriorated and unemployment rose in this population, it suggests that at least initially the fall in the number of likely illegal immigrants was caused by something other than the economy, probably the significant increase in enforcement in 2007. However, the rise in unemployment, especially since the summer of 2008, is truly dramatic and must be playing a very significant role in the fall in the number of illegal immigrants in the country. One factor that makes it difficult to weigh the relative importance of the economy vs. enforcement is that a rise in the unemployment rate may also be partly caused by an increase in enforcement efforts as states and the federal government make it more difficult for illegal immigrants to find or retain jobs.
Another factor that tends to support the idea that enforcement accounts for some significant share of the decline is that Figure 5 shows that in general dips in the size of the illegal population since 1994 occur after a peak in unemployment, not before. One the biggest fluctuations was in the 2001 to 2003 period. Talk of an amnesty for illegal immigrants between President Bush and Mexican President Fox in 2001, the 2001 recession, 9/11-inspired enforcement, and normal seasonality all make the years 2001 to 2003 difficult to interpret. But what is clear is that both the dip in 2001 and the dip in 2002 were preceded by a rise in unemployment. Interestingly, the period is also characterized by a sharp increase in the overall size of the likely illegal population, even with the significant swings in this population. The period from January 2001 to October 2003 shows one of the larger increases in the likely illegal population over the whole 1994 to 2009 period. After the 2001-2003 period, we see that the decline in the size of the likely illegal population in March 2003 and March 2004 was much smaller than the decline associated with the earlier unemployment spikes of 2001 and 2002. Nevertheless, a rise in unemployment happened first, followed by a modest fall in the population of less-educated young Hispanic immigrants. In general, Figure 5 shows that when the unemployment rate among illegals increased, the size of the likely illegal population tended to fall somewhat a few months later. This makes perfect sense.
As illegal immigrants start losing their jobs, some decide to go home and fewer enter the country, but the effect is not immediate. Of course, there are increases in unemployment that do not seem to be accompanied by a decline in the illegal population, so the relationship between the economy and illegal immigration flows is not clear cut. Between September 2006 and January 2007 unemployment rose somewhat for this population, as it often does in the winter months. But there is absolutely no corresponding fall in the size of the illegal population
The current decline does not fit into the typical pattern. The decline began before unemployment rose significantly. This is consistent with the idea that enforcement has played an important role in the decline in the illegal population, at least at the outset.
Failure of the Amnesty. One interesting finding in Figure 1 is the rise or “hump” in the illegal immigrant population in the summer of 2007. This hump may have been associated with congressional debate over granting legal status/amnesty to illegal immigrants. The number of less-educated young Hispanic immigrants hit a high in July 2007. The bill and its legalization provisions were widely covered by both English and foreign-language media in the United States and received significant coverage in some foreign countries, particularly in Latin America. It is certainly possible that more illegal immigrants settled in the country during the debate or fewer already here went home than otherwise would have been the case. Illegals may have hoped that by coming or remaining in the country they would qualify for the legalization. The bill failed to pass for the second and final time in June 2007 and, although there was some talk of bringing the legislation up again, after July the size of the less-educated young Hispanic immigrant population began to fall significantly. There is, of course, the seasonal component to illegal immigration, but what might be called the “amnesty hump,” does not seem to exist in prior years. So it is certainly plausible that this rise and fall was due to the congressional debate over amnesty and then the failure of the legislation to pass.
Even the most casual observers of immigration policy in 2006 and 2007 would certainly have been aware that the issue was in flux. In May 2006 the Senate passed S2611, a bill that would have granted legal status and eventual citizenship to almost all illegal immigrants in the country. At around the same time, the House of Representatives passed an enforcement bill that did not include amnesty and the two chambers never reconciled, so both bills died. This may help to explain why Figures 1 and 5 seem to show no seasonality between the spring of 2006 and fall of 2007. Many illegal immigrants may simply have been waiting to see the outcome of the legislative battles.
The Total Illegal Population. Although a number of institutions and organizations have tried to estimate the size of the illegal population, there is still some uncertainty about its actual size. In 2006 the Department of Homeland Security estimated an illegal immigrant population of 11.55 million for January 1, 2006. Their estimate for 2007 was 11.78 million and their most recent estimate, for January 1, 2008, was 11.6 million. If we compare these three estimates to the young adult, less-educated, immigrant Hispanic population we find that the ratio is about one to 1.6, with a range of 1.568 and 1.608.18 It must be remembered that the illegal numbers published by DHS include an adjustment for undercount. None of the figures in this report so far include such an adjustment. DHS uses Census Bureau data to create its estimates, but then assumes 10 percent of the illegal population is missed and adjusts its estimates upward by this amount.19 The government’s estimates also include nearly two million illegal alien children, which are not part of this study.
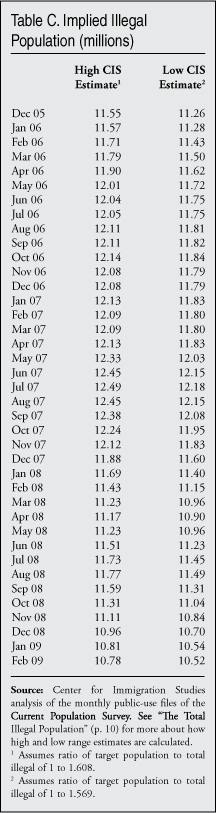
If we assume a ratio of 1 to 1.568 as a low range and a ratio 1 to 1.608 as a high range, then the total illegal immigrant population peaked in July of 2007 at between 12.2 and 12.5 million and then fell 1.7 million (13.7 percent) by February of this year to between 10.8 and 10.5 million. These results are shown in Table 2. In general we find that the high range estimate is the most plausible. Table 2 also shows that the decline in our target population is similar to DHS estimates of the illegal population in 2007 and 2008. Their estimates showed a 1.5 percent decline between January 1, 2007, and January 1, 2008. Our estimates show a 1.6 percent decline over the same time period.20
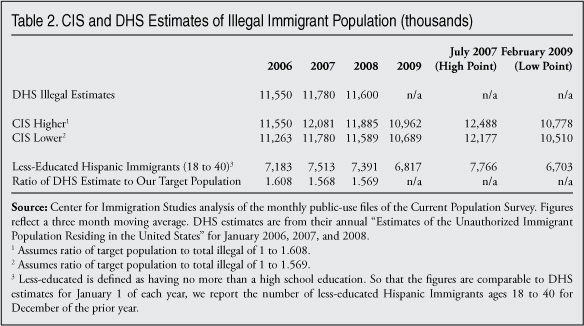
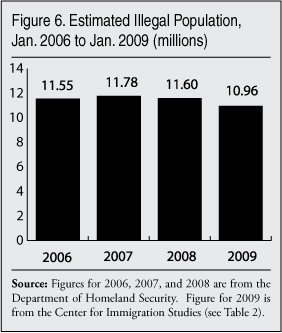
Figure 6 reports DHS estimates for the illegal population from 2006 to 2008. The figure for 2009 is based on our high range estimate for January 1 of this year. Table C at the end of this report shows our monthly estimates going back to December 2005 for the total illegal population. Estimates in Table C for December of each year correspond to DHS estimates of the illegal population on January 1 of the following year.
In- vs. Out-Migration
The Difficulty of Measuring Migration. So far we have dealt only with the overall size of the illegal population and trends in this population. These estimates should be robust because they are based on a three-month average from the CPS drawn from the entire sample. As already discussed, the observed decline must be due to a combination of less-educated young Hispanic immigrants leaving the country and fewer entering the country. In this section we estimate the number of new likely illegal immigrants settling in the country and the number leaving. The primary problem with trying to measure in- and out-migration is that individuals in the monthly CPS are asked what year they came to the United States. But in order to preserve anonymity, the Bureau groups responses into several-year cohorts. For example, in 2008 persons who said they arrived from 2006 through 2008 were coded as one response. While it may not seem like a large problem, in fact this grouping makes it very difficult to estimate the number of new immigrants arriving from abroad in a single year.21 There is the additional problem that the sample is much smaller when looking at just new arrivals, as opposed to the entire population of likely illegal immigrants. Because of the smaller sample, variability increases and this too can reduce the accuracy of migration estimates. We can partly get around this problem by using an average from three months taken together. One final problem with arrival data is that people new to the country are the most likely to be missed by the survey in the first year or two, so the undercount is almost certainly higher for new arrivals than for the overall population of less-educated young Hispanic immigrants.
Migration Based on Grouped Data. To start, we can compare large periods of time without having to worry about trying to separate the data by individual year, though the other issues associated with the year of arrival data remain. Table 3 shows the total population of likely illegal aliens and breakdowns for each arriving cohort for this population using the most detailed year of arrival data allowed in the public-use CPS. The values in the table represent three-month averages for January, February, and March for each year. Table 3 shows that at the start of 2002 the likely illegal population was 6.614 million and it grew to 7.095 million by 2005 — a 481,000 increase. The table also shows that in the 2005 CPS, 981,000 likely illegal immigrants reported that they arrived between 2002 and 2005. The difference between arrivals (981,000) and growth (481,000) is 500,000 and this can be seen as the crude level of out-migration. In other words, 981,000 people arrived, but the total population grew only 481,000 because 500,000 left that population. Of course, a more complex estimate of out-migration would have to include other factors that also cause people to “leave” our target population, such as deaths and aging. Also, the new arrival data are almost certainly understated. Nonetheless, this oversimplified analysis gives us some insight into out-migration.
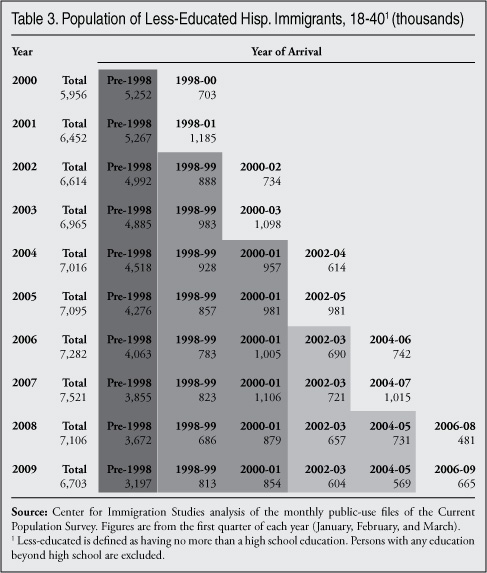
If we compare these results to the 2006 to 2009 period we see a very different pattern. Table 3 shows that the likely illegal population actually fell from 7.282 million in 2006 to 6.703 million in 2009 — a 579,000 decline. The arrival data from 2009 show 665,000 new arrivals from 2006 to 2009. For the number to fall 579,000, even with 665,000 new arrivals, out-migration would have to equal 579,000 plus 665,000 for a total out-migration of 1.244 million. Thus, out-migration in the 2006 to 2009 period would seem to be more than twice as large as in the 2002 to 2005 period. Also 665,000 is about 32 percent less than 981,000, implying a one-third decline in the number of new arrivals.
While this analysis is oversimplified and does not include other things that can reduce the likely illegal population, as we will see these other factors do not change that much over time. As a result, even this simplified analysis based on grouped-year-of-arrival data shows that out-migration must have increased significantly for the numbers to look as they do. The only alternative interpretation is that somehow the share of people in our target population who die, age out, or get more education suddenly changed. This would mean the decline was not the result of an increase in return migration. But we find no evidence that this is the case.
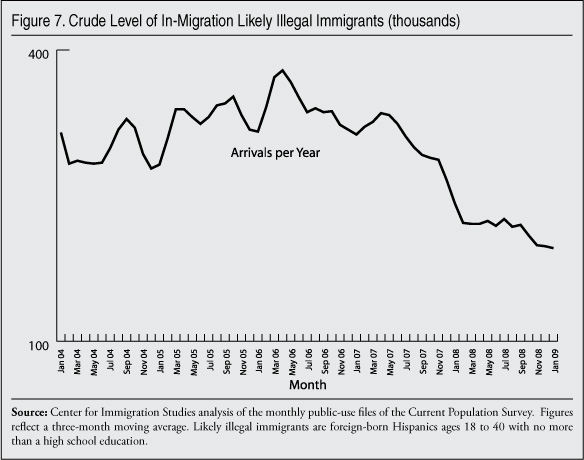
Yearly Migration Rates. To overcome the way the Census Bureau groups data and get individual year estimates from the public-use file of the CPS, we divide the results from the year of arrival question by the number of years and months in each group to get an estimate of the flow into the country. While this approach cannot produce precise yearly numbers and the results must be interpreted with caution, it can provide us with some idea of how things may change from year to year. Figure 7 shows the estimated flow of likely illegal immigrants settling in the country. Each data point in Figure 7 represents the number of new illegal immigrants who arrived in the 12 months prior. The figure shows that the number of new arrivals since the end of the 2007 has been about one-third lower than in 2005 and 2006.
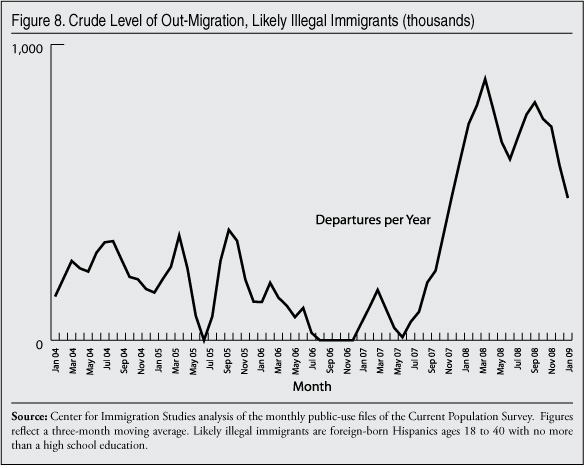
It is also possible to take the arrival data in Figure 7 and get an estimate for the crude level of out-migration. As we did with the grouped data discussed earlier, if we compare the difference in new arrivals to the change in the size of the likely illegal population year over year, the difference should provide insight into the trend in yearly out-migration. Figure 8 includes an estimate for deaths and reports the implied crude level of out-migration for the likely illegal population.22 The figure shows that the number of people leaving has more than doubled since 2005 and 2006. Again, because the out-migration estimates are based on in-migration levels that were originally grouped, the results in Figure 8 should be seen as illustrating a trend and should not be viewed as precise numbers. But they do confirm the findings from our first analysis using grouped cohorts in Table 3 — out-migration has increased substantially.
Despite their limitations, Figures 7 and 8 strongly imply that something dramatic has happened in the migration of less-educated young immigrant Hispanics. When the results in Figures 7 and 8 are combined with the overall numbers shown in Figure 1, and the results from the grouped cohorts by year of arrival, it is clear that the decline in the size of the likely illegal population is the result of both more people going home and fewer coming. Of course, Figures 7 and 8 only confirm what must be true mathematically, if Figure 1 is correct. If fewer illegal immigrants were coming, but out-migration remained about the same, the results in Figure 1 would be different.
More Precise Yearly Estimate of Migration. Figure 8 does not control for all of the factors that impact changes in the size the likely illegal population. It is possible to calculate more precise estimates and at the same time try and further overcome the limitations in the CPS. Figure 9 provides a more precise estimate of yearly in- and out-migration. Figure 9 accounts for the decrease in the likely illegal population caused by the net change in the number of people turning 41 versus those turning 18 each year. In the last few years this aging-in and aging-out caused a net reduction of 100,000 to 200,000 persons each year in this population. Figure 8 also takes into account the roughly 20,000 to 25,000 deaths that occur within this population each year and those individuals who get more educated each year.23 Deaths, aging, and increased education levels can be measured in a straightforward way using the CPS and all these factors are relatively constant, with modest variation year to year. It is the movement in and out the country that can vary significantly. Figure 9 also attempts to adjust the data to account for the grouping of year of entry responses in the CPS and undercount of new arrivals.24
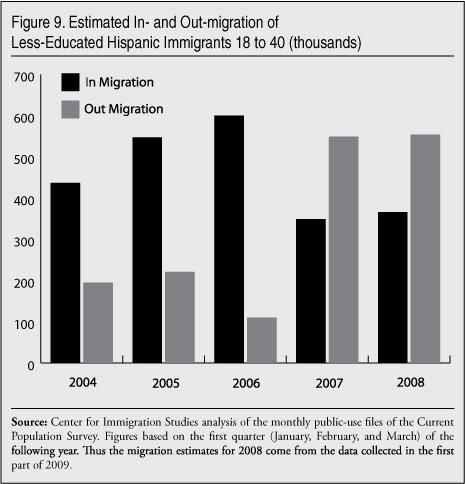
Like Figure 7 and 8, when we make all these adjustments we still find the number of illegal immigrants coming has fallen by about one-third. The number of new illegal immigrants entering the country had been running at about 590,000 a year in 2005 and 2006, but has dropped to about 360,000 — a 39 percent decline. Out-migration had been running at about 210,000 a year in 2004 and 2005, but dropped in 2006. It then increased to about 550,000 in 2007 and 2008 — a two and one-half fold increase from 2004-2005. This is much lower than the level shown Figure 8 before we make the adjustments. It is worth noting that when the government last published an estimated out-migration rate for illegal immigrants by year they estimated that three percent of illegal aliens returned home each year. Figure 9 shows that in 2004 and 2005 estimated out-migration was also about 3 percent.25
Although we are confident that the results in Figure 9 capture an important trend in illegal immigration, the limitations of the CPS should still be kept in mind. Therefore, it is best to see the results in Figure 9 as reflecting trends in the data and not absolute values.
A Dramatic Increase in Out-Migration. The grouped cohort data in Table 3 and Figures 7 through 9 all indicate that in-migration has fallen and out-migration has increased. But even without Table 3 and Figures 7 through 9 there is no question out-migration had to increase. The relatively steady process of people aging, dying, and getting more education could not cause the results shown in Figure 1. At most these factors can only reduce this population by 250,000 a year. (In most years it is less than 250,000.) Something caused the less-educated, foreign-born, young Hispanic population to fall almost 14 percent in just 19 months — July 2007 to February 2009. Alternatively, it fell almost 11 percent in just two years (the first quarter 2007 to the first quarter 2009).
Even if there were no new arrivals, the expected decline that occurs from deaths and aging could not come close to a fall-off of this magnitude. Of course, we know there were in fact some number of new arrivals. Just last year, the Border Patrol apprehended more than 700,000 people trying to enter the country illegally. Moreover, the CPS indicates that several hundred thousand less-educated young Hispanic immigrants almost certainly must have arrived in the country in 2007-2008.26 Without adjusting this new arrival data upward for undercount, we still find that the number of newly arrived, likely illegal immigrants is almost equal to the reductions caused each year by deaths, aging, and those getting more education. So the decline from February 2007 to February 2009 or from July 2007 to February to 2009 must reflect a very significant increase in out-migration for our target population.
Migration Data from Mexico. The Instituo Nacional De Estadistica y Geografia (INEGI) in Mexico tracks migration in and out of that country. They find that the number of people going to the United States has fallen significantly through the third quarter of 2008. They found that the number of Mexicans of all ages leaving Mexico (almost all of whom come to the United States), was 837,000 in the first three quarters of 2006; in the same time period in 2007 it was only 655,000 and in the first three quarters in 2008 it was just 499,000. This indicates a significant drop-off in the number of people coming from Mexico, which in our view represents the decrease primarily in illegal immigration. INEGI also finds a higher rate of return migration in the third quarter of 2007 and the first quarter of 2008, which is when we find our decline in the likely illegal population. They also find that return migration was higher in the third quarter of 2008 (the most recent data available) than in the first two quarters of 2008. This is also consistent with our findings. However, INEGI found a similar pattern of increased return migration to Mexico in the winter of 2006-2007.27 This suggests that they are picking up the seasonality of Mexican migration to the United States rather than a significant decline in the illegal population. In contrast, we do not find this pattern in the winter of 2006-2007.
It is possible that INEGI is underestimating return migration.28 Moreover, the number of people settling in Mexico reported by INEGI includes people born in other countries coming to stay in Mexico. It is not simply measuring Mexicans returning home. Also it must be remembered that Mexicans are only part of the illegal population. It also is possible that as enforcement increased in the United States and the economy deteriorated, return migration of illegal Mexicans increased, while the return migration of legal immigrants fell so that the overall number of people returning to Mexico was little changed. Illegal immigrants in the United States were heavily concentrated in some sectors of the economy, like construction, which has been very hard-hit by the recession. Legal Mexican immigrants on the other hand tend to be older, somewhat less concentrated in cyclical occupations, and more established in the United States. The Mexican economy has also seen a rapid deterioration. Thus returning to that country may not be an attractive option for these individuals. In short, legal and illegal immigrants from Mexico are following different migration patterns.
Limitations of This Analysis
Estimating trends in the illegal population is, of course, difficult. Even institutions that have studied the issue for a long time and employ similar methodologies have produced somewhat different estimates. For example, DHS’s estimate for the growth in the illegal population 2005 to 2006 was 1.05 million, two and half times that estimated by the Pew Hispanic Center. Yet in contrast to 2006 and 2007 Pew’s estimated growth of 900,000 was triple that of DHS.
Between 2007 and 2008 Pew’s estimated decline of 500,000 was almost double that of DHS.29 In short, estimating trends in the illegal population is not easy and this fact should be kept in mind when considering any estimate of the illegal population, including those in this report.
In terms of the estimates in this study, we have discussed at length the challenges associated with trying to measure the flow of immigrants into and out of the country using the Current Population Survey. But there are other potential limitations to the approach used in this report that should also be discussed.
Undercount of Illegal Immigrants. While it is clear that a large share of illegal aliens are included in Census Bureau surveys, there is always the question of those who are missed. Although DHS, as well as most researchers, assume an undercount of roughly 10 percent for illegal immigrants in Census Bureau data, there is debate about the size of this undercount.30 In the environment of stepped up enforcement that characterized much of 2007 and 2008, it is possible that the undercount might rise as a larger share of illegal immigrants become reluctant to answer a government survey. This in turn could create the illusion that the illegal population is falling when in fact the population remains unchanged. As mentioned above, the fall-off in the illegal population is certainly consistent with anecdotal evidence as well as remittance data, border apprehensions, and other administrative data. Moreover, a fall-off of 13.7 percent over a 19 month period is plausible.31
Another issue that may reduce the accuracy of the estimates in this report is that it is possible that the illegal population has become much more educated in recent years, and this explains the fall in the number of new illegal aliens arriving. For reasons already discussed, a reduction in the number of new arrivals who fall into our target population could not account for the dramatic fall-off in the size of the likely illegal population in just the 19 months between July 2007 and February of this year. As for the illegal population already here, they may have suddenly become more educated, but we find no evidence in the number of young foreign-born Hispanic adults getting post-secondary education. In its estimates of the illegal population, the Pew Hispanic Center finds no significant change in the share of illegal immigrants who have no education beyond high school in recent years.32
The Non-Hispanic Illegal Population. The most important limitation of the approach used in this study is that it does not provide direct insight into the non-Hispanic illegal population. All researchers agree that the overwhelming majority of adult illegal aliens are Hispanic and that they are young with relatively few years of schooling. Thus, we are confident that our approach captures trends in the Hispanic illegal population. We are also confident that looking at the young adult, less-educated, Hispanic immigrant population captures trends in the illegal child population, which is also overwhelmingly Hispanic. However, the trend for the roughly one-fifth of illegal immigrants that are not Hispanic may be different.
There is some evidence that the non-Hispanic illegal population is also declining. In their 2008 estimates, DHS lists the Philippines, Korea, China, India, and Brazil among the top 10 countries with the largest illegal immigrant populations in the United States. These five countries account for about 44 percent of the non-Hispanic illegal population based on DHS estimates.33 The CPS shows that young adult immigrants (18 to 40) from these five countries declined 10.7 percent between February 2007 and February 2009.34 This is very similar to the 10.9 percent decline in the number of young adult, less-educated, Hispanic immigrants over the same time period. This may indicate that the non-Hispanic illegal population is declining in the same way as the Hispanic illegal population.
Changes to the Census Bureau Data. The CPS, like virtually every modern survey, is weighted to reflect the total population and its characteristics. The survey weights are based on what the Bureau thinks is the total population and are carried forward each month and year for births, deaths, and migration. In January of each year weights are readjusted to account for new estimates of migration into and out of the United States (as well as for other factors) based partly on the results of the American Community Survey (ACS). Changes to the weights used in the survey could impact the size of our target population, but there are three reasons why that could not account for our findings. First, changes in how the data are weighted are implemented in January of each year. So the decline from July 2007 to December 2007 in our target population cannot be the result of changes in the way the weights are created. Our discussions with the Census Bureau confirm this fact.35 Second, the adjustments in January 2008 and January 2009 made to the Hispanic population in the CPS are not large and could only explain a small part of the observed decline.36 Third, the unweighted raw survey itself shows a decline in the number of young less-educated Hispanic immigrants of 14.3 percent from July 2007 to February 2009 — very similar to the 13.7 percent decline in the weighted data.37 Thus the weights are clearly not driving the decline in this population — the decline in the unweighted data is actually larger than in the weighted data. We can see the same thing if we look at the average weights. The average weight actually increased very slightly for our target population, from 2,197 in July 2007 to 2,229 in February 2009. There is no question: The small downward adjustment to the sample weights in January of 2008 and 2009 did not create the decline in the population of less-educated, foreign-born, young Hispanic adults found in this report.
Perhaps more important, even if the weights did account for the decline in the likely illegal population, it would not undermine our findings. The Hispanic population was adjusted downward slightly in January 2008 and 2009 because the Census Bureau, based on its own analysis, feels that immigration has fallen. These changes to the weights were made explicitly to make the data more accurate. So these adjustments should improve the quality of our estimates.
The Effect of Aging. One possible explanation for our findings in Figure 1 is that this population is simply growing older and leaving our target age group of 18- to 40-year-olds. As already indicated, the natural and regular process of aging out cannot explain the sudden decline found in the number of likely illegal aliens. But we can also test the effect of aging on our estimates in another way. We can confine our analysis to the same population and follow it over time. To do this we need to exclude new arrivals who can add to our population of interest and prevent us from looking at the same people. Because of the way the new arrival data are grouped, we only include people who arrived in 2003 or earlier. (See Table 3 to see how arrival data are grouped by year.) In the first quarter of 2007 there were 6.505 million less-educated Hispanic immigrants 18 to 40 who arrived in 2003 or earlier. If we age this population two years we find that in the first quarter of 2009 there were 5.818 million 20- to 42-year-old, less-educated Hispanic immigrants who arrived in 2003 or earlier. These two populations should be the same people, except that they have aged two years. The decline in this population is 10.6 percent, which is almost identical to the 10.9 percent decline we find when we look at our target population of 18- to 40-year-olds in 2007 and 2009. In other words, the decline shown in Figure 1 is not being caused by people aging out of our target population. When we follow the same age cohort for two years, we still show the same decline.
Conclusion
It is sometimes argued that illegal immigrants are so permanently attached to their lives in the United States that they would never return to their home countries. The findings of this report contradict this view. Monthly data collected by the Census Bureau show a significant drop in the number of less-educated, young, Hispanic immigrants in the country. Prior research indicates that more than three-fourths of these individuals are illegal aliens. The fall in this population implies that the total illegal immigrant population has declined almost 14 percent (1.7 million) from its peak in July 2007. In just the last year the decline between the first quarter of 2008 and the first quarter of this year is almost 6 percent.
The decline began before unemployment increased in this population in 2007, so increased enforcement seems to have played a significant role in reducing the illegal population at least initially. However, unemployment has also increased dramatically among less-educated young Hispanic immigrants, especially since the middle of 2008. Thus, the economy is also likely playing a significant role in reducing this population.
One of the most important findings of this report is that significantly more illegal immigrants must be leaving the country. While a significant number of illegal immigrants have always returned home on their own, that number seems to have more than doubled in the last two years. Unfortunately, out-migration can only be measured indirectly because of limitations in the Census data used in this study. We also find evidence that the number of new illegal immigrants arriving each year has fallen by about one-third. This reversal of migration represents a profound break with a long-standing trend of growth in the illegal immigrant population. Of course, it is worth remembering that our estimate implies that nearly 11 million illegal aliens still lived in the United States in the first quarter of 2009. The vast majority of illegal immigrants have not left the country and tens of thousands of new illegal immigrants continue to settle in the country each year.
The primary weakness of this analysis is that it may not provide much insight into changes in the one-fifth of illegal immigrants who are not Hispanic. It is possible that only the Hispanic illegal population is falling. But as we have shown, in the last three years trends in the Hispanic illegal population track changes in the overall illegal immigrant population based on government estimates. Moreover, there is some evidence that the non-Hispanic illegal population is also declining.
The numbers in this report do not indicate whether this is a desirable outcome. Nor are the political and policy implications entirely clear. One can argue that the departure of illegal immigrants is good news and we should do more to encourage it by increasing enforcement. Further, if some significant share of illegal immigrants are going home, then it undermines the argument that an amnesty is necessary because there is no way to induce illegal immigrants to leave. On the other hand, one can still argue that enforcement is mean-spirited or that now would be a good time to have an amnesty because a decline in the illegal population means that the problem is under control. A decline in the illegal population could also be seen as good news for those who would like guest worker programs expanded because it means that people can be induced to go home. If illegals do not return home in large numbers in the midst of the worst economic downturn in two generations, then it seems doubtful that a guest worker program could work, because once in the country guest workers would not go home even if you somehow prevented a large fraction from working. In short, the policy implications of our analysis are subject to interpretation.
Finally, there is also no way to know if this trend will continue. President Obama has repeatedly indicated his deep commitment to legalizing those in the country illegally. Pronouncements of this kind can have an impact. When Congress was considering legalization for illegal immigrants in the summer of 2007, there is evidence that the illegal population grew. Even debating amnesty seems to have consequences for migration trends. Recent public announcements by the administration and several of its actions, including delaying the E-verify requirement for federal contractors, reducing the Border Patrol’s access to some federal lands, and the release of illegal immigrants detained in worksite enforcement actions all indicate that the new president is likely to reduce enforcement efforts. Moreover, the future trend of the economy is unknown. Therefore, we simply do not know if the current decline in the illegal population will continue. It seems very likely, however, that if the economy recovers and enforcement weakens further, the number of illegal immigrants will begin to grown again.
End Notes
1 DHS estimates for 2008 can be found at www.dhs.gov/xlibrary/assets/statistics/publications/ois_ill_pe_2008.pdf.
2 Many news articles from across the country have reported on immigrants, typically in the country illegally, returning home. Here is just a sample of stories, which typically focus on an individual or a few individuals who have returned to their home countries or are planning to do so. The Washington Post: “Slump Disrupts Migration; Fewer Mexicans are Going to the U.S. and Sending Money Home,” p. A06, May 29, 2009; Chattanooga Times Free Press, “Job Losses Pushing Immigrants Out,” p. A7, February 16, 2009; Houston Chronicle, “Immigrants Reverse Course to Survive Return,” p. A1, March 29, 2009; Orange County Register, “Mexicans Reverse Course; Survey Indicates that Legal and Illegal Immigrants are Fleeing the Struggling U.S. Economy and Returning Home,” p. 2A, March 8, 2009; Rocky Mountain News, “Immigrants head home as jobs dry up,” p. 17, December 13, 2008; Arizona Republic, “Recession Sending Immigrants Home,” p. 1, December 10, 2008; Fort Wayne Journal Gazette, “They Moved Away, Immigrants Leave Area Amiod Legal Crackdown, Economic Lag,” p. 1A, March 22, 2009; Orlando Sentinel, “Without Jobs Illegal Immigrants Go Home,” p. A2, December 16, 2008.
3 The Central Bank of Mexico reported that remittances were down 18.6 percent between April of 2008 and 2009. See Los Angeles Times article from June 2, 2009. www.latimes.com/news/nationworld/world/la-fg-mexico-remittance2-2009jun0.... It should be noted that legal immigrants account for a significant share of money sent home by immigrants in this country. So remittances are an imperfect measure of illegal immigration.
4 Border apprehensions in FY 2005 were 1,189,108. The number dropped to 1,089,136 in 2006 and dropped again to 876,787 in 2007. See “Immigration Enforcement Actions: 2007” at http://www.dhs.gov/xlibrary/assets/statistics/publications/enforcement_a.... In FY 2008 there were 723,825 apprehensons; see “Securing America’s Borders - CBP 2008 Fiscal Year in Review” at: www.cbp.gov/xp/cgov/newsroom/highlights/08year_review.xml. The 2008 figures are one-third below what they were as recently as 2006.
5 The net outflow of migrants from Mexico — those who leave vs. those who returned home — fell by roughly half through August 2008 compared to that time period in the preceding year. The figures came the National Institute of Statistics and Geography (it is abbreviated as INEGI in Spanish) see (Communicado Num. 162/09: www.inegi.gob.mx/inegi/contenidos/espanol/prensa/Boletines/Boletin/Comun... .
6 Press release dated August 10, 2007, http://www.dhs.gov/xnews/releases/pr_1186781502047.shtm.
7 ICE’s annual report for 2007, which documents the increase in enforcement efforts, can be found at http://www.ice.gov/doclib/pi/reports/ice_annual_report/pdf/ice07ar_final... . The 2008 annual report can be found at: http://www.ice.gov/doclib/pi/reports/ice_annual_report/pdf/ice08ar_final....
8 May 21, 2008, posting by Stewart Baker, Assistant Secretary for Policy at ICE, which can be found at: www.dhs.gov/journal/leadership/labels/E-Verify.html. Janice Kephart at the Center for Immigration Studies has been able to get the latest information from ICE on E-verify. In 2007, there were 3.27 million queries for new hires to the E-verify system; in 2008 the number doubled to 6.65 million. See http://cis.org/Everify.
9 In 2005, there were only 176 criminal arrests at work sites and 1,116 administrative arrests. This grew to 1,103 criminal arrests and 5,184 administrative arrests at worksites by 2008. See Figure 9 in the 2008 ICE annual report, www.ice.gov/doclib/pi/reports/ice_annual_report/pdf/ice08ar_final.pdf.
10 We focus on adults (18 and older), because the migration of foreign-born children reflects the decision of their adult parents. We use a three-month moving average in an effort to overcome the natural volatility inherent in any survey. The middle month in the three-month average is the value reported. So for example, the figures for February are from January, February, and March and the figures for March include February and April and so on. There are about 13,000 immigrant adults in each monthly CPS file, 2,400 to 3,000 of whom are young, less-educated, Hispanic immigrants. So the values are based on the three month-sample of 7,500 to 9,000 young, less-educated, immigrant Hispanics. The Census Bureau weights the survey to reflect the nation’s total population.
11 The foreign-born are defined as persons living in the United States who were not U.S. citizens at birth. This includes naturalized American citizens, legal permanent residents (green card holders), illegal aliens, and people on long-term temporary visas such as students or guest workers who respond to the CPS. It does not include those born abroad of American parents or those born in outlying territories of the United States, such as Puerto Rico.
12 Both terms refer to individuals who are living in the United States without proper authorization. Some have overstayed a temporary visas or other time-limited stay in the United States, while others have snuck into the country.
13 The Center for Immigration Studies has estimated that 81 percent of adult illegal aliens have no more than a high school diploma. We also estimate that 79 percent of all adult illegal immigrants are Hispanic. The Center’s estimates of the characteristics of the illegal population can be found in “Immigrants in the United States, 2007: A profile of America’s Foreign-Born Population,” www.cis.org/immigrants_profile_2007. Table 3 of DHS’s 2008 estimate of the illegal population shows that 8.8 million illegal immigrants came from “North America” (including Mexico, Central America, and the Caribbean) and another 800,000 were from South America. We estimate that 480,000 illegal immigrants from North and South American are not Hispanic — mostly from Canada, Haiti, Jamaica, Guyana, and Brazil. This means that of the 11.6 million illegal immigrants estimated to be in the country by DHS in 2008, a total of 21 percent (2.48 million) are not Hispanic. This includes 480,000 non-Hispanics from North America, 1.2 million from Asia, 400,000 from Europe, and 400,000 from the rest of the world. DHS estimates for 2008 can be found at: www.dhs.gov/xlibrary/assets/statistics/publications/ois_ill_pe_2008.pdf.
In a series of studies in recent years, the Pew Hispanic Center has estimated that 78 to 81 percent of illegal aliens are from Latin America. Figure 30 in their most recent estimate for 2008 shows 81 percent are from Latin America. The report entitled, “A Portrait of Unauthorized Immigrants in the United States” can be found at http://pewhispanic.org/files/reports/107.pdf. In terms of education level, Pew estimates of illegal immigrants for 2005 showed that 74 percent had no education beyond high school. See page 23 of the report at : http://pewhispanic.org/files/reports/46.pdf.
In Pew’s 2008 estimate of the illegal population they again estimated that 74 have no education beyond high school. See figure 16 in their report at http://pewhispanic.org/files/reports/107.pdf. Older studies of the illegal population also found similar percentages of illegals have relatively little education and are Hispanic. The Urban Institute estimate of the illegal population in 2002 can be found at http://www.urban.org/url.cfm?ID=1000587. An older estimate by the INS can be found at http://www.dhs.gov/xlibrary/assets/statistics/publications/Ill_Report_12.... The Census Bureau estimate can be found at: www.census.gov/dmd/www/ReportRec2.htm (Appendix A of Report 1 contains the estimates). Both the INS and Census have found that the illegal population is about 80 percent Hispanic.
14 Between February 2007 and February 2009 Figure 2 shows that the likely legal Mexican population grew 597,000. In 2007 and, 2008 the United States issued 340,000 green cards to Mexican nationals. See U.S. Legal Permanent Residents: 2008 at http://www.dhs.gov/xlibrary/assets/statistics/publications/lpr_fr_2008.pdf. In addition, another 80,000 green cards were likely issued in the first half of fiscal year 2009, which began in September 2008. Moreover, about 35,000 Mexican nationals received H1(b) visas in 2007 and 2008, and 109,000 student visas were also issued to Mexican over this time period. In addition, 719,00 Mexicans were allowed into the country on shorter term non-immigrant visas for such activities as seasonal agricultural work and seasonal non-agricultural work. See Nonimmigrant Admissions to the United States: 2008 at http://www.dhs.gov/xlibrary/assets/statistics/publications/ois_ni_fr_200.... It is well established that some share of individuals on non-immigrant visas show up in the CPS, primary those on longer-term visas like students and guest workers. Thus the 597,000 growth in the legal Mexican immigrant population residing in the United States February 2007 to February 2009 is plausible. It is also worth noting that there are several hundred thousand people living in Mexico with green cards who can reenter the United States at any time and do not show up in new green card issuance data.
15 The Census Bureau weighted pre-2000 data using weights based on the 1990 Census carried forward. When the 2000 Census was conducted the immigrant population was shown to be much larger than had been thought to be the case based in the 1990 Census. We have adjusted the number of people in our target population of less-educated, young, Hispanic immigrants upward by 10.2 percent in the 1990s. Data from the last months of 1999 and the first months of 2000 indicated that this was the difference between the 1990-based weights and the 2000-based weights in our target population.
16 Data from January 2000 forward are based on weights issued by the Census Bureau that are derived from the 2000 Census. The 2000 Census showed that the population (primarily immigrants) was larger than was thought to be the case in the 1990s. The Census Bureau has not re-issued 2000 Census-based weights for the 1990s, but it is possible to adjust upward data from that period to make it more comparable to the post-2000 period. Based on a comparison for our target population in 1999 (old weight) to 2000 (2000-based weights) we adjust up the data for the 1990s by 10.2 percent. If we did not do this, the trends would all look the same, but there would be a sharp, implausible upward shift in January 2000.
17 The unemployment figures are not seasonally adjusted. They are, like the number of likely illegal immigrants, based on a three-month moving average. We use unadjusted numbers so that the seasonality of immigrant employment can be observed. Seasonal adjustment smooths out the rise and fall in employment. Unadjusted numbers also have the advantage of being computationally simple and easy for other researchers to replicate.
18 These ratios are for December from our three-month moving average for the size of this population. We use December because DHS estimates are for the very start of the year (January 1) and this corresponds best with our December numbers.
19 DHS uses the American Community Survey (ACS) collected by the Census Bureau as the basis for its illegal estimates. It is similar to the CPS and generally produces very similar estimates of the foreign-born population. The ACS is not available on a monthly basis. The March file of the CPS is larger and over-samples minorities. It is generally assumed that the March CPS undercounts illegals by about 10 percent, which is the same assumption built into DHS estimates of the ACS. The monthly files of the CPS probably undercount the illegal population by more like 11 or 12 percent. But this is not particularly important to this analysis because when reporting the total illegal population we simply calibrate it to the DHS estimates.
20 The Pew Hispanic Center also estimates illegal immigration. Their research shows a 4 percent decline from March 2007 to March 2008. This is not very different from the 7 percent decline we find over the same time period. Pew’s estimates for recent years can be found at: http://pewhispanic.org/reports/report.php?ReportID=94.
21 Because the data are grouped there is no way to know for sure how many people came in the calendar year prior to each monthly survey. However, it is possible to get an idea of the number of new arrivals by dividing the number of months into the number of immigrants found in each grouped cohort. There is also another survey, called the American Community Survey (ACS), which unlike the CPS, does report individual year of arrival information in the public use file. However, respondents are asked a slightly different question about when they came to the United States. Moreover, the most recent public use file of the ACS available is from only 2007, which gives the individual year of arrival data for only 2006. (The ACS only contains half a year’s information for the calendar year in which the survey was taken.) Thus, the ACS is not helpful in answering the question about what happened in 2007, 2008, and the first part of 2009. Only the CPS can provide information about these years. However, it is worth noting when we compare our estimated number of new arrivals from the CPS divided by the number of months in each cohort to the individual year results from the ACS in 2001 to 2006, the ACS values fall with the margin of error of the CPS values in every year but one. This indicates that our methods of estimating individual year of arrival from the CPS produce reasonable results.
22 Figure 7 controls for deaths among the likely illegal population. Death rates are based on the life table for Hispanics from the National Center for Health Statistics Volume 57, Number 14, which can be found at http://www.cdc.gov/nchs/data/nvsr/nvsr57/nvsr57_14.pdf. See Table 4 for age-specific death rates for Hispanics.
23 There are 10,000 to 20,000 people each year who become more educated by going to college and drop out of the target population for this study. The number of likely illegal immigrants who get a post-secondary education each year is modest partly because of the cost; this population is quite poor. Language issues also make it difficult. The American Community Survey, which asks about English proficiency, shows that less than one-fifth of 18- to 40-year-old, less-educated, Hispanic immigrants speak English well. Most important, about 63 percent of this population has not graduated high school, so they can’t get post-secondary education. We do find that a more significant number of high school dropouts eventually get GEDs, but that would not cause them to leave our target population.
24 We adjust the new arrival data upward depending on the size of the growth of the likely illegal population. In some years when we break up the grouped arrival data into individual years the growth in the likely illegal population is larger than the number of new arrivals, implying that new immigration was in fact higher. We adjust upward all the values in the same year by the same amount based on the growth year over year. For 2008, we adjust the new arrival data upward based on prior years. These upward adjustments in some years are substantial.
25 See Table C in “Estimates of the Unauthorized Immigrant Population Residing in the United States: 1990 to 2000” which can be found at: http://www.dhs.gov/xlibrary/assets/statistics/publications/Ill_Report_12....
26 Recall from Table 2 that 665,000 likely illegal immigrants arrived from 2006 to the beginning of 2009.
27 See INEGI press release (Communicado Num. 162/09): www.inegi.gob.mx/inegi/contenidos/espanol/prensa/Boletines/Boletin/Comun... The second table of the Comunicado (press release) shows “immigrants internacionales.” This should be Mexican-born people returning to Mexico. This includes people born in Mexico and returning to that country and people born outside of Mexico arriving there.
28 The number of people settling in Mexico is estimated primarily based on the results of a quarterly survey, the National Occupation and Employment Survey. However, new arrivals are equal to less than 1 percent of the sample.
29 Pew’s estimate for 2005 to 2008 can found in “Trends in Unauthorized Immigration” at: http://pewhispanic.org/reports/report.php?ReportID=94. DHS’s estimates for 2005 to 2008 are in “Estimates of the Unauthorized Immigrant Population Residing in the United States: January 2008,” at: http://www.dhs.gov/xlibrary/assets/statistics/publications/ois_ill_pe_20....
30 The Pew Hispanic Center assumes a 5.2 percent undercount of the entire foreign-born population in the Current Population Survey. See Figure 3, page 4, in their March 2006 estimate of the illegal population, http://pewhispanic.org/files/reports/61.pdf. Pew bases its 5.2 percent estimate on work done by Passel, Van Hook, and Bean. Their paper is entitled “Narrative Profile with Adjoining Tables of Unauthorized Migrants and Other Immigrants, Based on Census 2000: Characteristics and Methods,” which was done for Sabre Systems as part of a contract with the Census Bureau. The undercount adjustment for illegal immigrants in particular is about 10 percent in Pew’s research. The Department of Homeland Security also assumes a 10 percent undercount in Census Bureau data, though DHS estimates are based on the American Community Survey (ACS), which is also collected by the Census Bureau. See page three, Table 2, in the DHS’s estimates of the illegal immigrant population for January 1, 2008, at: http://www.dhs.gov/xlibrary/assets/statistics/publications/ois_ill_pe_20.... It should be noted that the monthly files of the CPS used in this report do not include an over-sample of minorities as is the case with what is called the March supplement to the CPS. The March CPS is also referred to as the Annual Social and Economic Supplement. Pew’s estimate of the undercount applies to the March supplement and not just the “core” monthly file used in this report. Typically, the March CPS produces estimates of the entire foreign-born that are 1 percent larger than the when just the core monthly CPS is used. This implies that the undercount of the illegal population in the monthly files used here is about 11 percent.
31 There are also several technical factors concerning how the CPS is conducted that should tend to prevent an increase in non-response by illegal aliens. Persons in the CPS stay in the survey for several months, and then leave for a time, returning again a few months later. This process creates a relationship with Census Bureau interviewers, which makes it less likely they would simply stop answering the Bureau’s questions all of a sudden. The Bureau also weights the data based on a complex methodology that reflects what the Bureau thinks is the nation’s actual population size by such key variables as race, sex, age, and ethnicity. The weighting procedure is specifically designed to produce accurate survey results even for populations that are difficult to capture in a survey. Weighting the data tends to smooth out sudden changes. Yet despite this fact, the figures show a sudden change in the number of less-educated, young, foreign-born Hispanics in the United States.
32 The Pew Hispanic Center in its 2005 estimates reported that 74 percent of adult illegal immigrants had no education beyond high school in 2005 and they report the same level in 2008. Pew’s 2005 estimate can be found at http://pewhispanic.org/files/reports/46.pdf. Their 2008 estimate can be found at http://pewhispanic.org/files/reports/107.pdf. Our own analysis shows no indication that the share of illegal immigrants with education beyond high school has changed significantly in recent years, though the share who are high school dropouts has fallen modestly and the share with a college degree has increased. But these changes do not impact the method used in this study because the share with no education beyond high school has remained the same.
33 Based on DHS’s 2008 estimate, 21 percent or 2.48 million illegal immigrants are not Hispanic (see end note 8). According to DHS, the top non-Hispanic illegal immigrant countries are the Philippines (300,000), Korea (240,000), China (220,000), Brazil (180,000), and India (160,000). See DHS estimates for 2008 at: www.dhs.gov/xlibrary/assets/statistics/publications/ois_ill_pe_2008.pdf
34 These estimates, like all those in this study, are based on three-month moving averages. These figures include adults of all education levels. In February of 2007 (January/February/March) the CPS shows that the 18- to 40-year-old population from these five countries stood at 2.8 million. In February 2009 it was 2.5 million. China includes Hong Kong and Taiwan.
35 In a telephone interview conducted June 12, 2009, Gregory Weyland, a survey statistician in the Current Population Survey branch at the Census Bureau stated, “Weighting control changes are implemented in January of each year, so a drop after July could not be due to technical issues like methodological changes in how the survey weights are calculated.”
36 The total Hispanic population age 16 and older in the CPS was revised downward by 349,000 in January 2008, primarily because the Census Bureau estimated that the level of net immigration has fallen. The Bureau makes weighting adjustments to the Hispanic population ages 16 and older, not the foreign-born specifically. Being foreign-born is a characteristic that varies based on the results of the survey, and is not directly controlled for by the sample weights. Only about 23 percent (349,000 * 23% = ~80,000) of the total Hispanic population age 16 and older fell into our target population of young, less-educated, Hispanic adult immigrants in January 2008. In January 2009, the Hispanic population 16 and older was also adjusted downward by 319,000, but again only 21 percent (319,000 * 21% = ~67,000) of the Hispanic population age 16 and older fell into our target population in January 2009. Furthermore, the decline in our target population between July 2007 and December 2008 — before the second adjustment in January 2009 — was 921,000. The single downward adjustment made in January 2008 could not come close to accounting for this 921,000 decline. (This 921,000 decline and the 246,000 decline mentioned above are both based on the individual months, not a three-month moving average). The adjustments made to the CPS in January 2008 and 2009 were simply too small (80,000 + 67,000 = 137,000) to significantly impact our analysis of less-educated, young, Hispanic immigrants. Even if the downward adjustments to our target population were double this size, it still would not come close to accounting for the decline in our target population. It must be remembered that the likely illegal population declined by a total of 1.063 million between July 2007 and February of 2009. Thus the adjustments could account for only about 13 percent of the observed decline. For an explanation of the adjustment that took place in January 2008, see “Adjustments to Household Survey Population Estimates in January 2008” by the Bureau of Labor Statistics at: http://www.bls.gov/cps/cps08adj.pdf. For the adjustment in January 2009 see “Adjustments to Household Survey Population Estimates in January 2009” published by the Bureau of Labor Statistics at: http://www.bls.gov/cps/cps09adj.pdf.
37 If we compare February 2007 to February 2009 we find a 13.4 percent decline in the unweighted sample. The weighted sample shows a 10.9 percent decline. It is clear that changes in weighting are not what caused the decline in our target population. There has been a significant fall off in the number of less-educated young Hispanics immigrants in the survey itself. This is actually what one would expect if there were fewer less-educated young Hispanic immigrants in the country. (These figures refer to a single month of data and not a three-month moving average.)