Download a PDF of this Backgrounder.
Karen Zeigler is a demographer and Steven A. Camarota is the director of research at the Center.
Newly released Census Bureau data for 2017 shows nearly half (48.2 percent) of residents in America's five largest cities now speak a language other than English at home. Overall, the number of U.S. residents speaking a foreign language at home reached a record of nearly 67 million. The total number is up seven million since 2010 and has increased by nearly 35 million since 1990.
Among the findings:
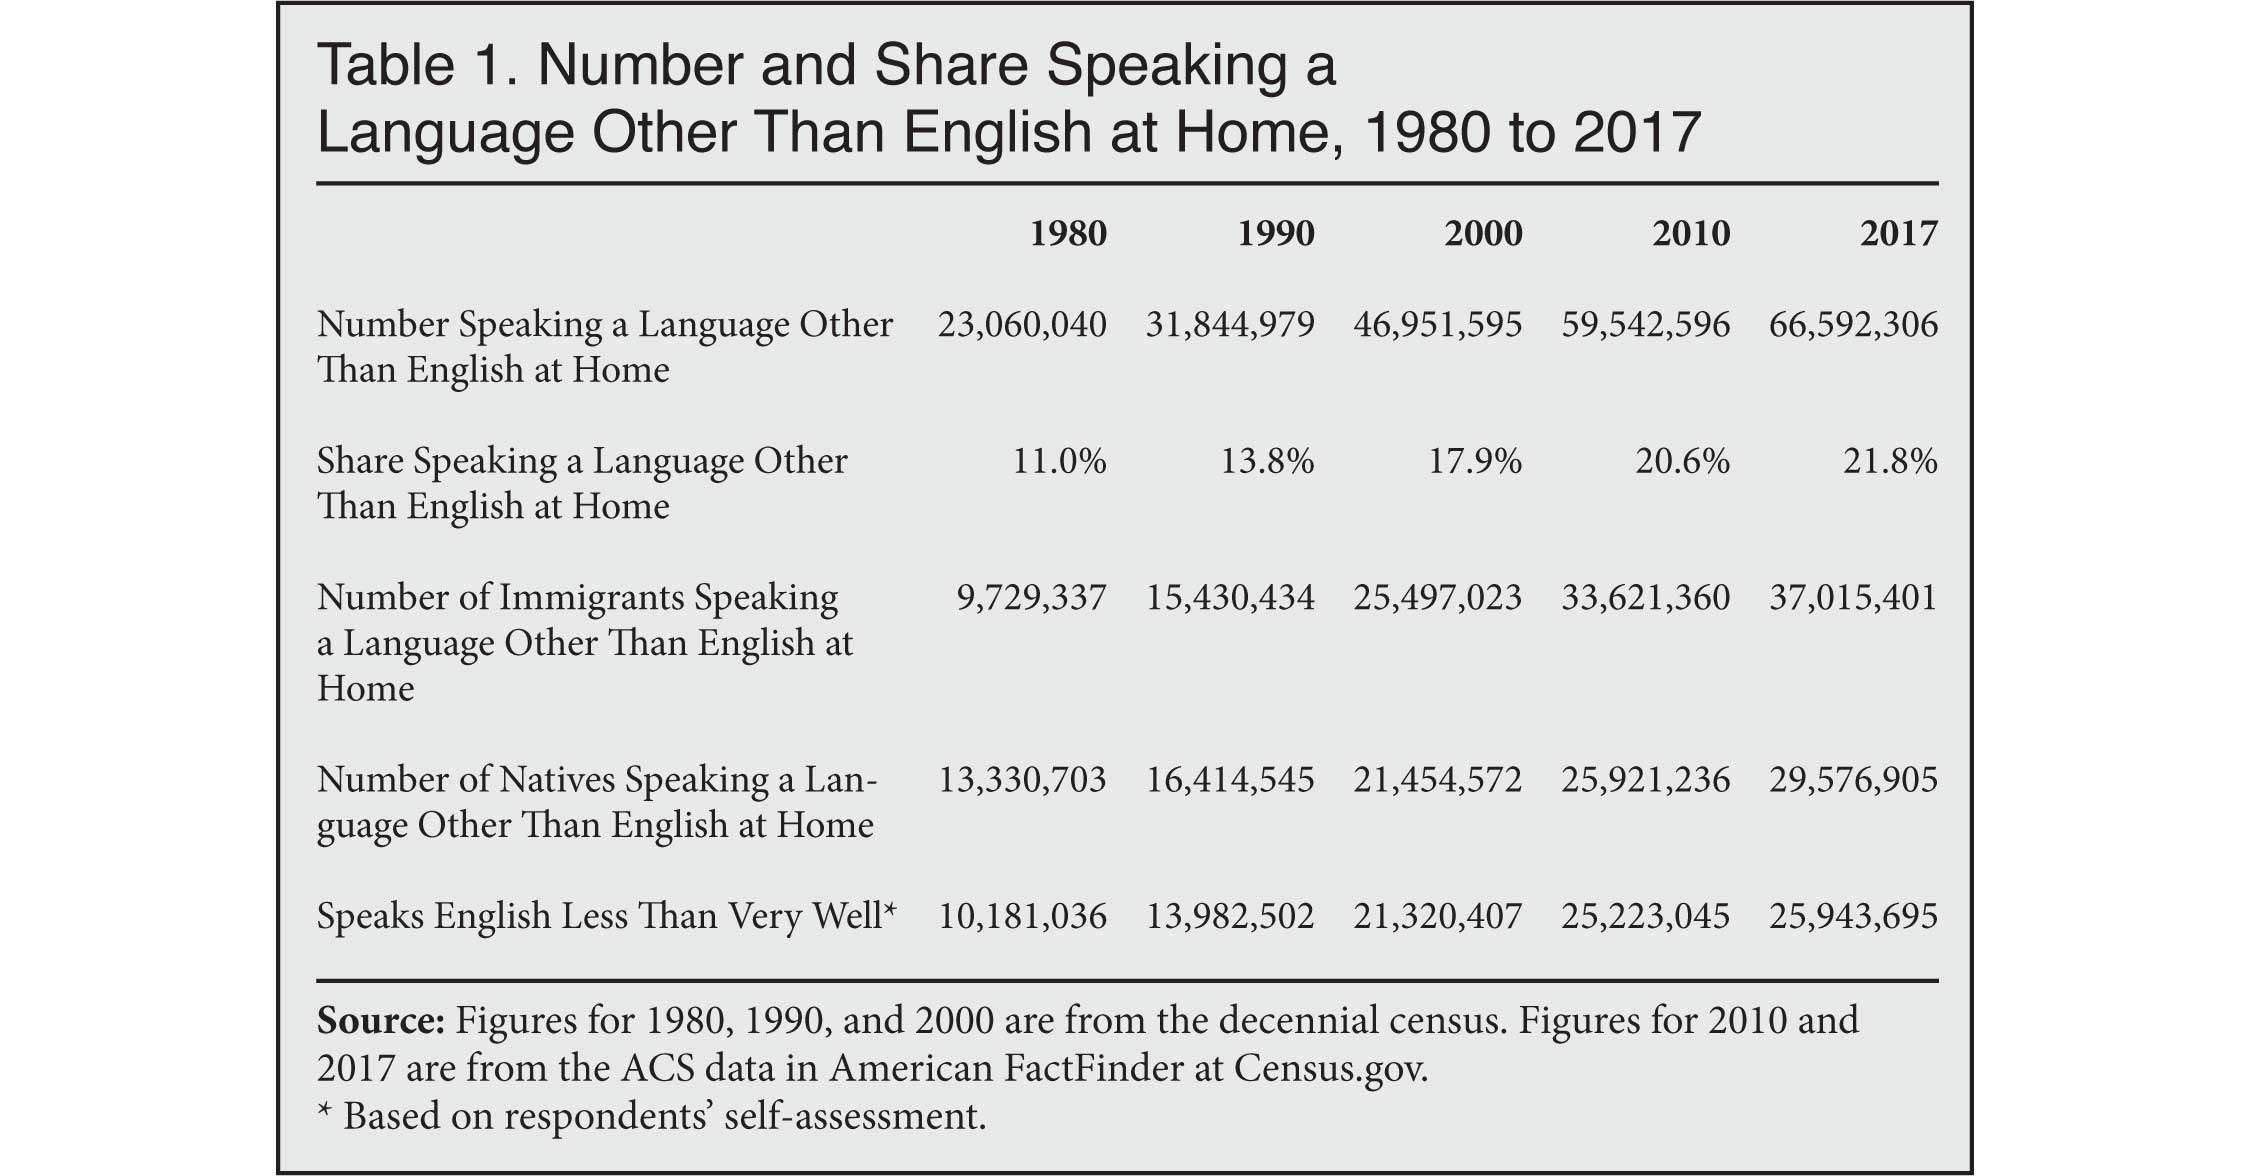
- In 2017, a record 66.6 million U.S. residents (native-born, legal immigrants, and illegal immigrants) ages five and older spoke a language other than English at home. The number has more than doubled since 1990, and almost tripled since 1980.
- As a share of the population, 21.8 percent of U.S. residents speak a foreign language at home — roughly double the 11 percent in 1980.
- In America's five largest cities, 48 percent of residents now speak a language other than English at home. In New York City and Houston it is 49 percent; in Los Angeles it is 59 percent; in Chicago it is 36 percent; and in Phoenix it is 38 percent.1
- In 2017, there were 85 cities and Census Designated Places (CDP) in which a majority of residents spoke a foreign language at home. These include Hialeah, Fla. (95 percent); Laredo, Texas (92 percent); and East Los Angeles, Calif. (90 percent). Perhaps more surprisingly, it also includes places like Elizabeth, N.J. (76 percent); Skokie, Ill. (56 percent); and Germantown, Md., and Bridgeport, Conn. (each 51 percent).
- Nearly one in five U.S. residents now lives in a city or CDP in which one-third of the population speaks a foreign language at home. This includes Dale City, Va. (43 percent); Norwalk, Conn., and New Rochelle, N.Y. (each 42 percent); and Aurora, Colo., and Troy, Mich. (each 35 percent).
- In contrast to many of the nation's cities, in rural areas outside of metropolitan areas just 8 percent speak a language other than English at home.2
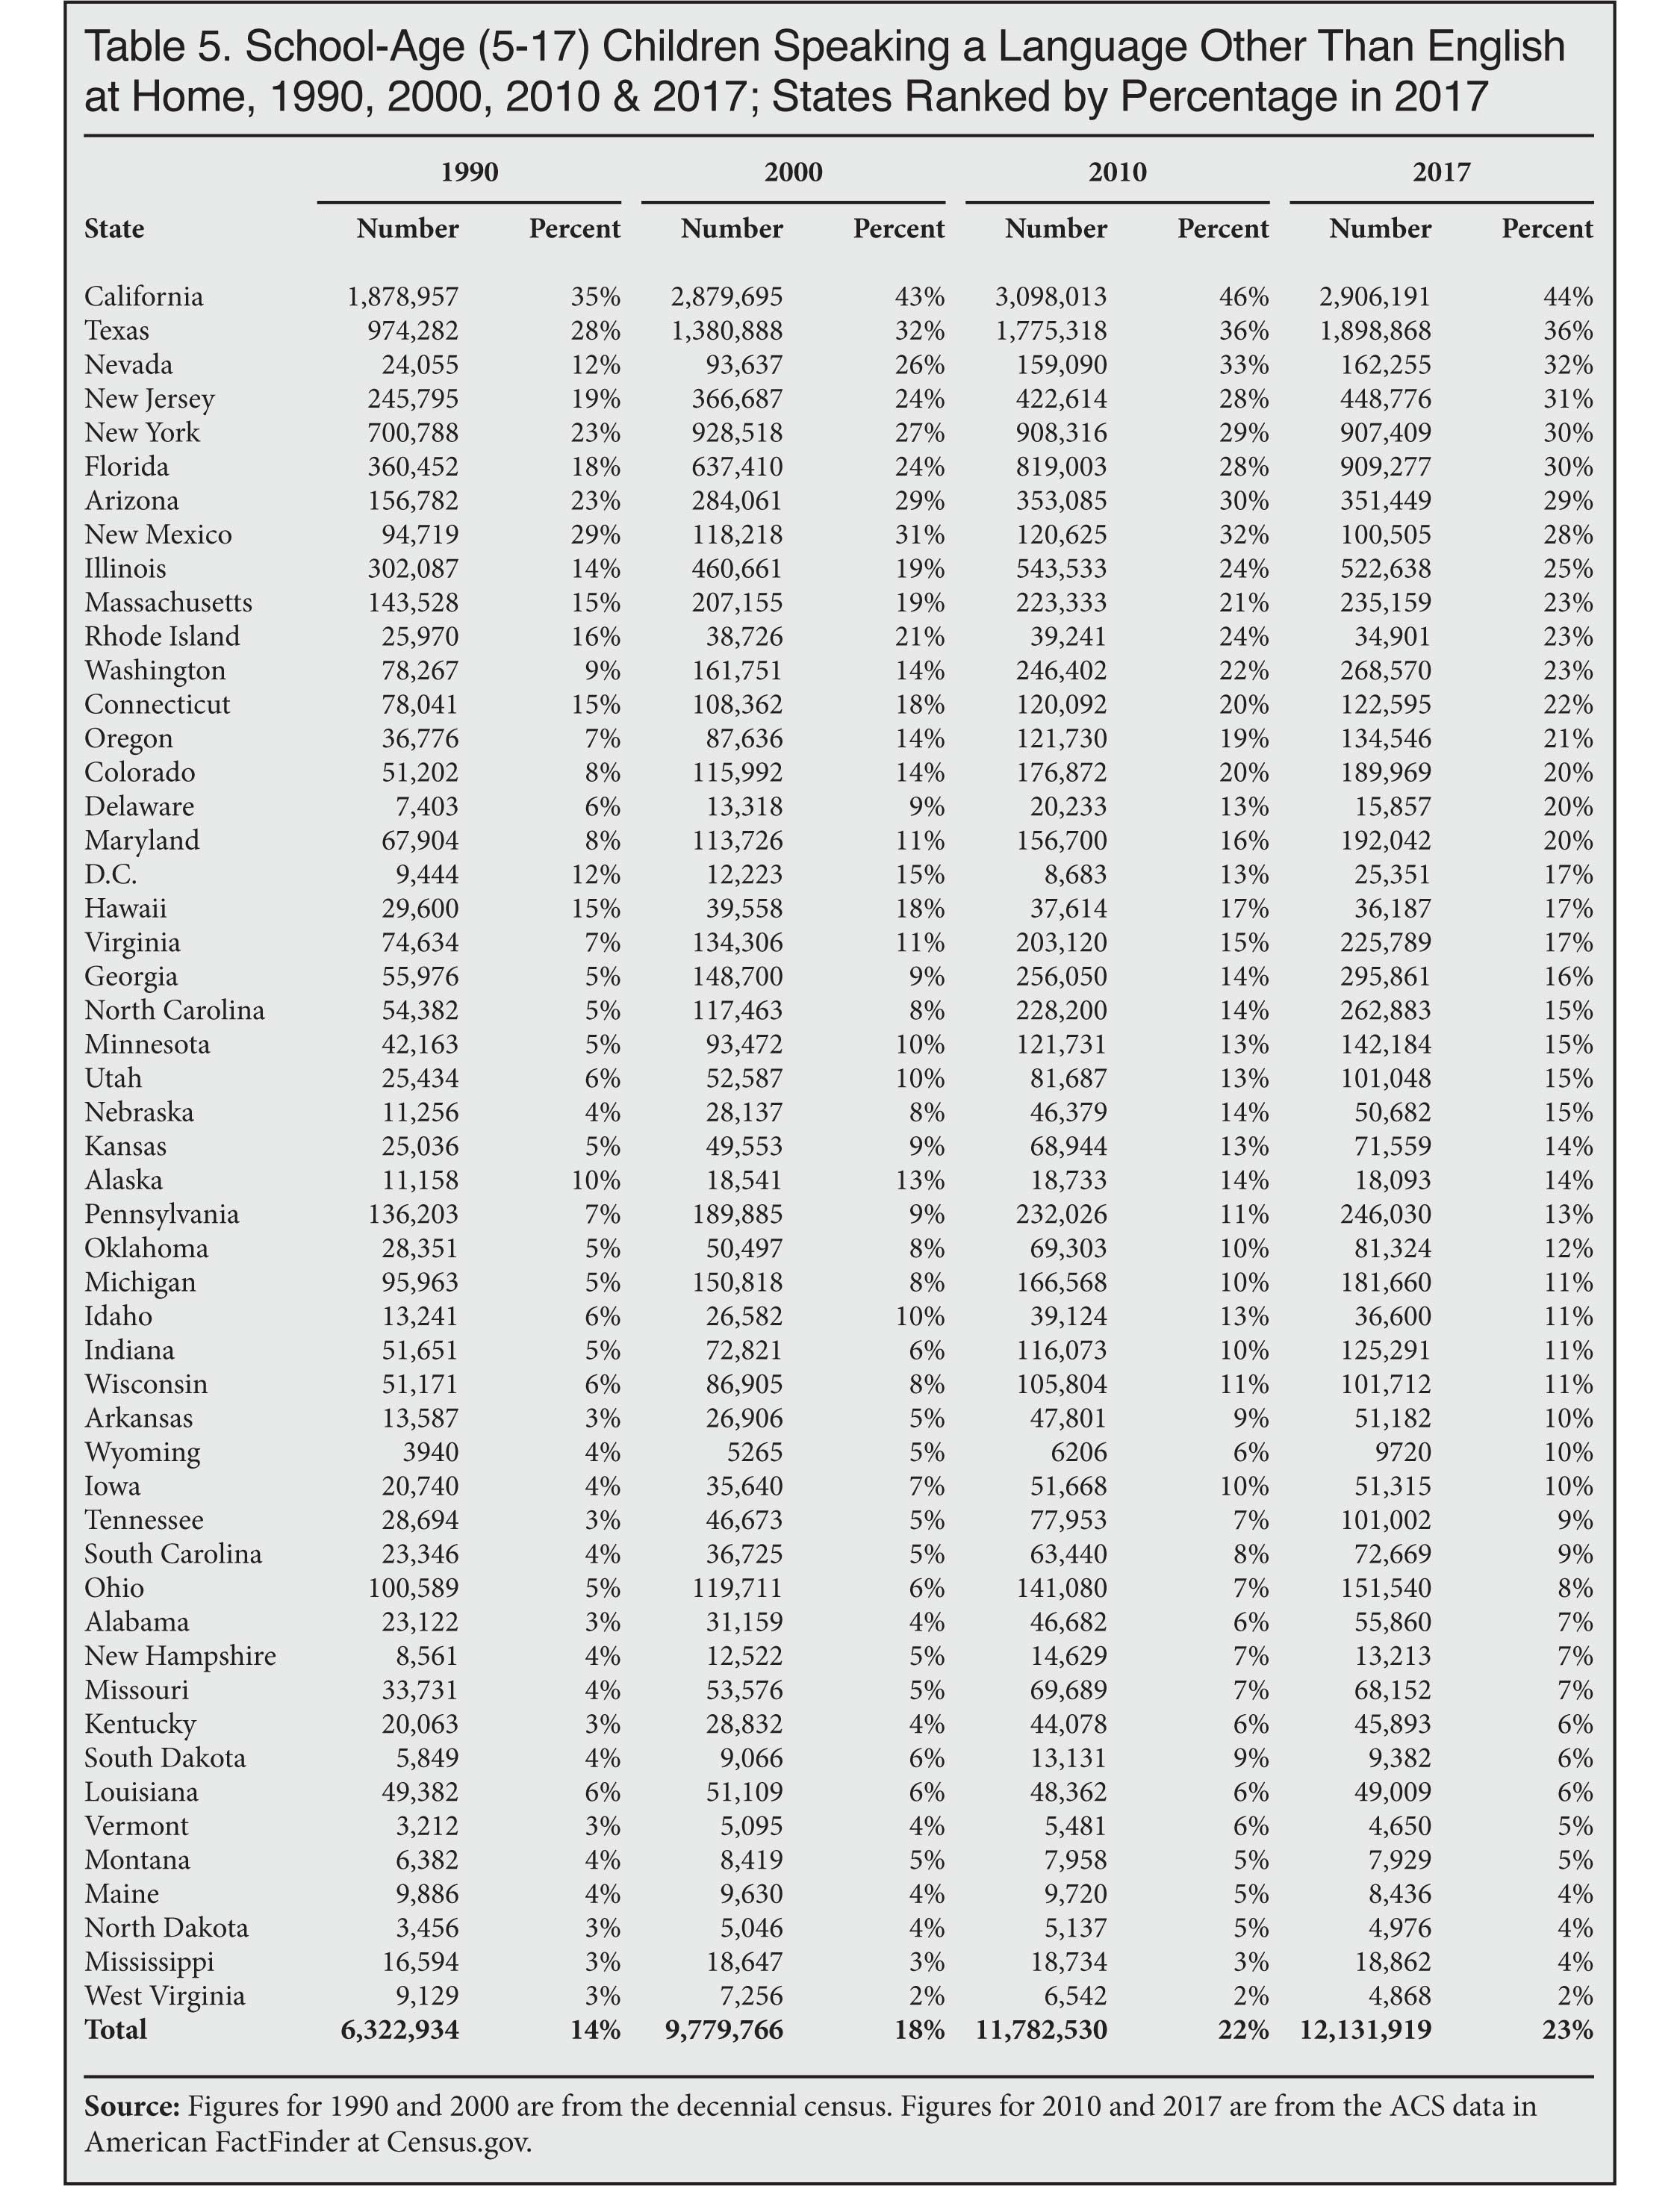
- The data released thus far indicates that nationally nearly one in four public school students now speaks a language other than English at home.3 In California, 44 percent of school-age (5-17) children speak a foreign language at home, and it's roughly one-third in Texas, Nevada, New Jersey, New York, and Florida.
- Of school-age children (5-17) who speak a foreign language at home, 85 percent were born in the United States. Even among adults 18 and older, more than one-third of those who speak a foreign language at home are U.S.-born.4
- Of those who speak a foreign language at home, 25.9 million (39 percent) told the Census Bureau that they speak English less than very well. This figure is entirely based on the opinion of the respondent; the Census Bureaus does not measure language skills.5
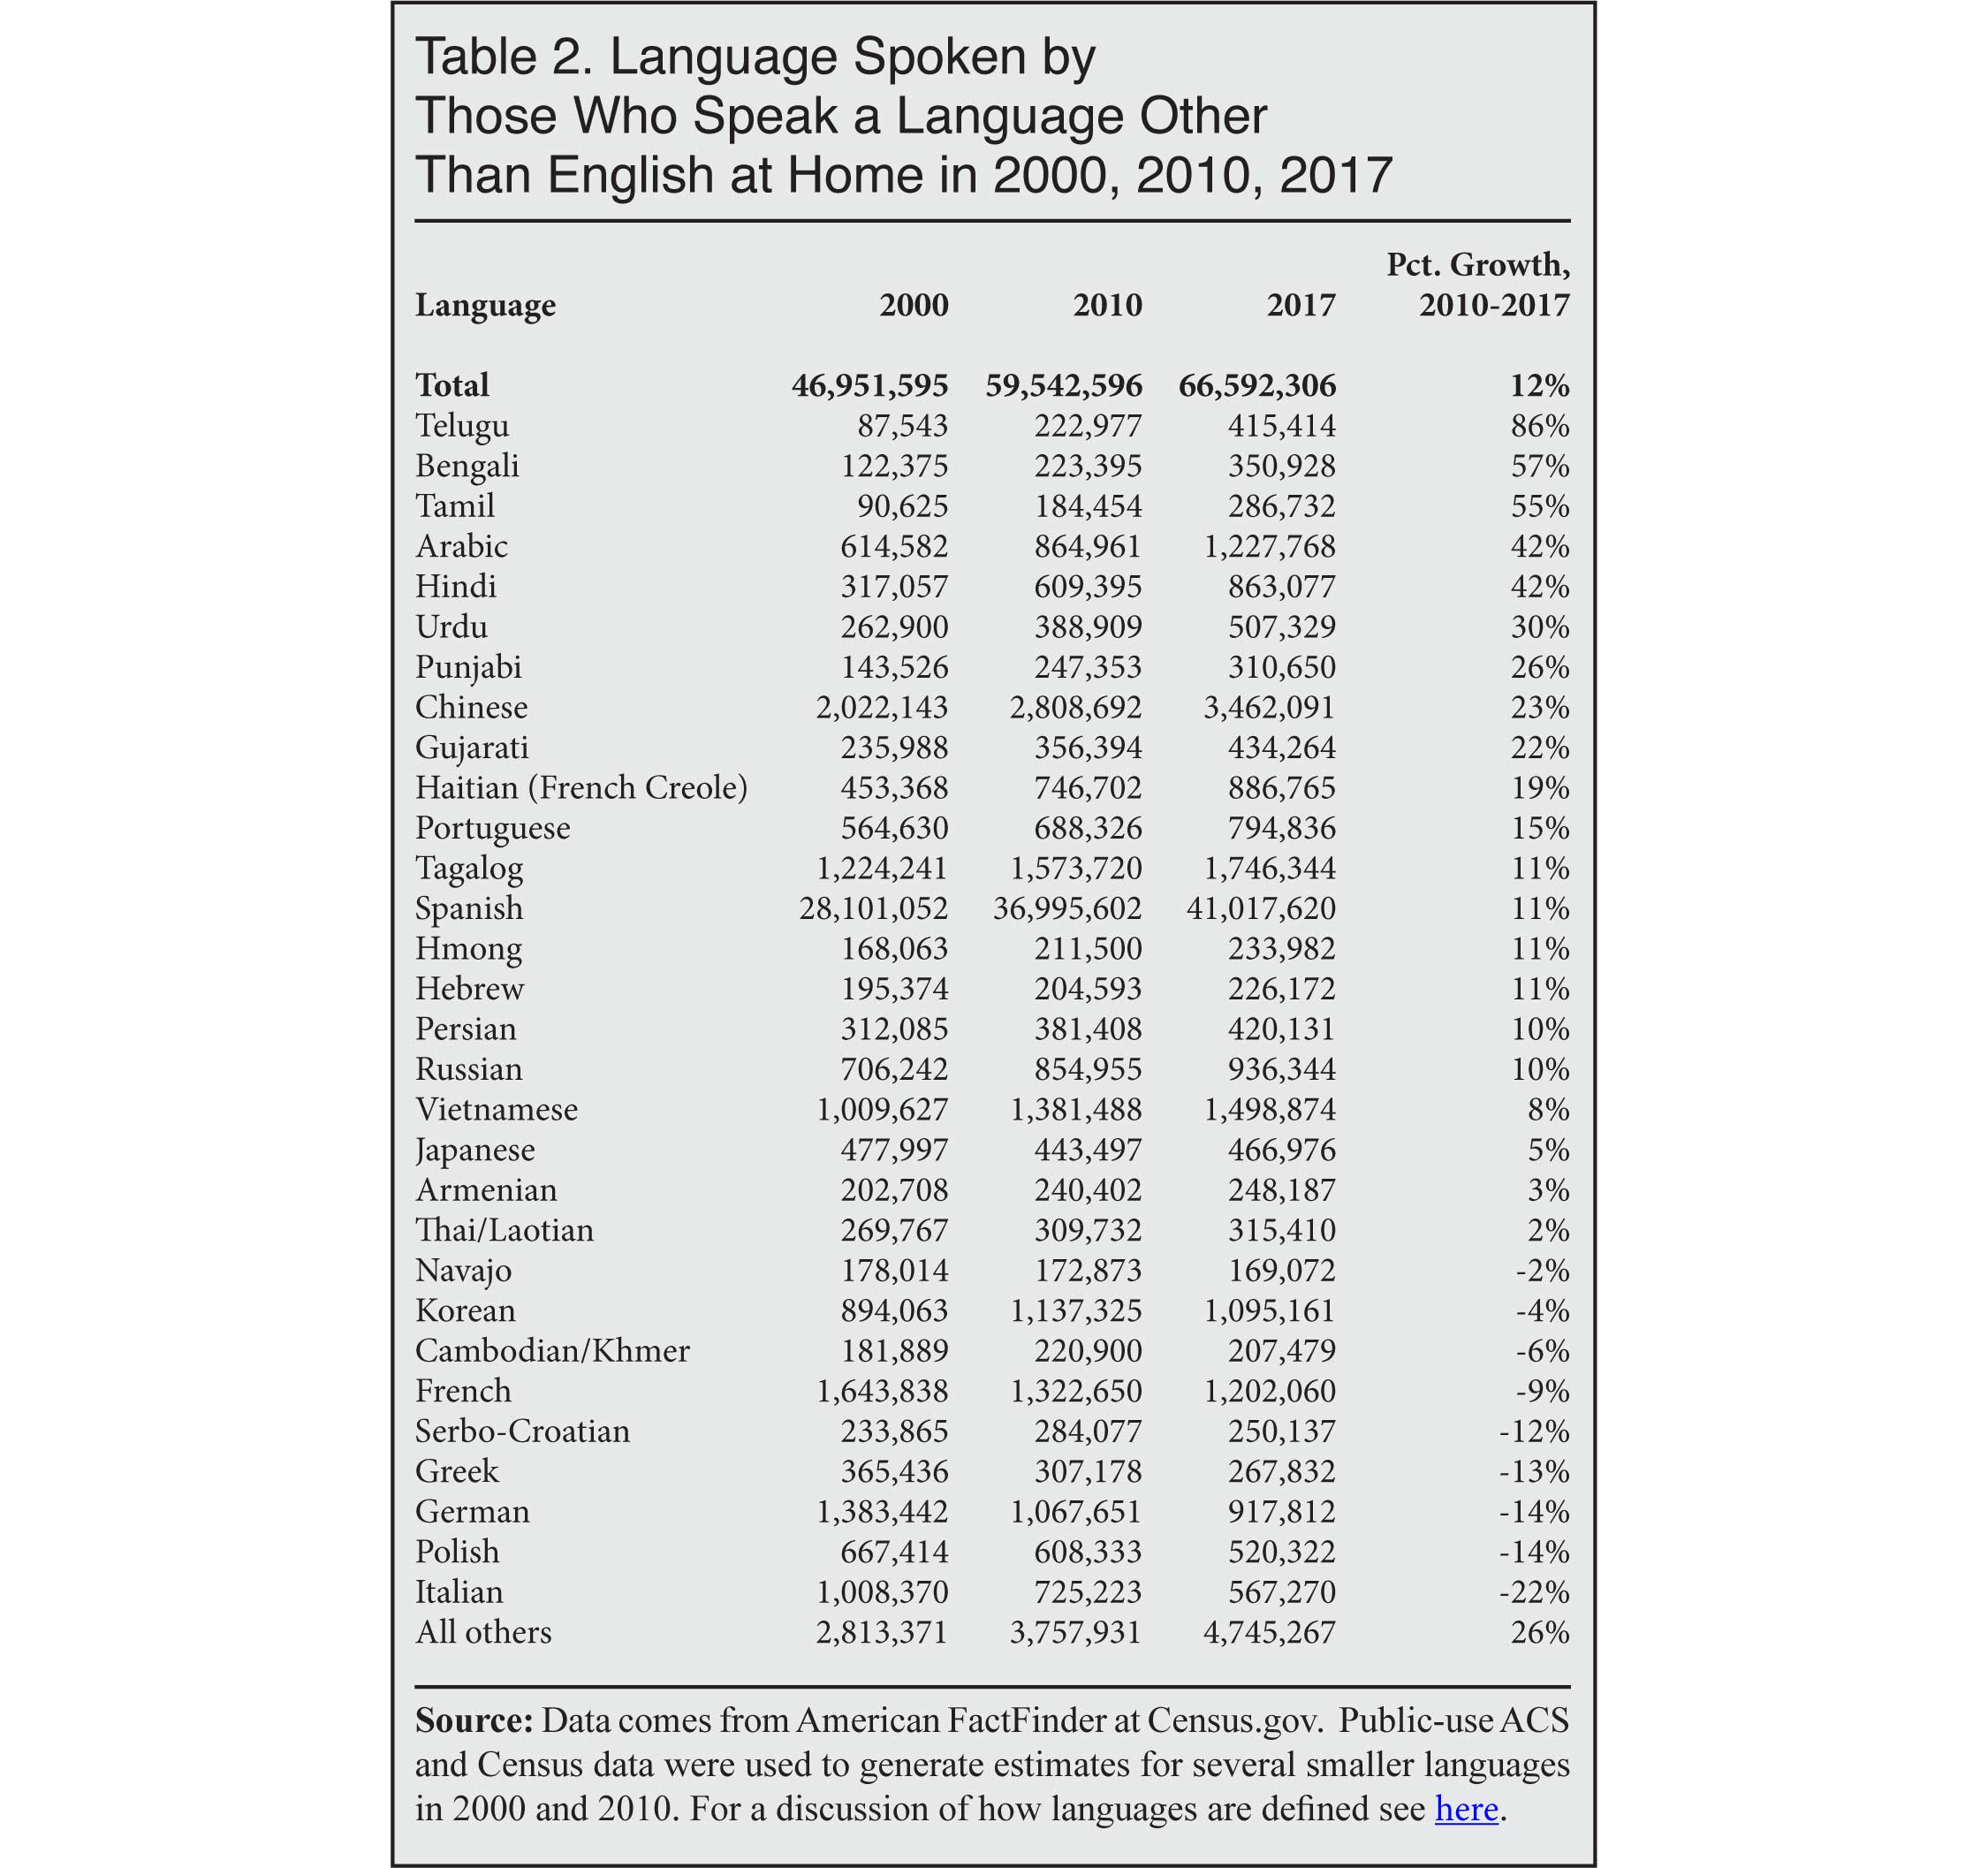
- Of languages with more than 400,000 speakers in 2017, the largest percentage increases from 2010 to 2017 were among speakers of Telugu (up 86 percent); Arabic (up 42 percent); Hindi (up 42 percent); Urdu (up 30 percent); Chinese (up 23 percent); Gujarati (up 22 percent); and Haitian Creole (up 19 percent). Hindi, Telugu, and Gujarati are spoken in India, and Urdu is the national language of Pakistan.
- The largest numerical increases from 2010 to 2017 were among speakers of Spanish (up four million); Chinese (up 653,000); Arabic (up 363,000); Hindi (up 254,000); Telugu (up 192,000); Tagalog (up 173,000); Haitian Creole (up 140,000); Bengali (up 128,000); Urdu (up 118,000); and Vietnamese (up 117,000). Telugu and Tamil are spoken in India, Tagalog is the national language of the Philippines, and Bengali is spoken in India and is also the national language of Bangladesh.
- Languages with more than a million speakers in 2017 were Spanish (41 million); Chinese (3.5 million); Tagalog (1.7 million); Vietnamese (1.5 million); Arabic (1.2 million); French (1.2 million); and Korean (1.1 million).
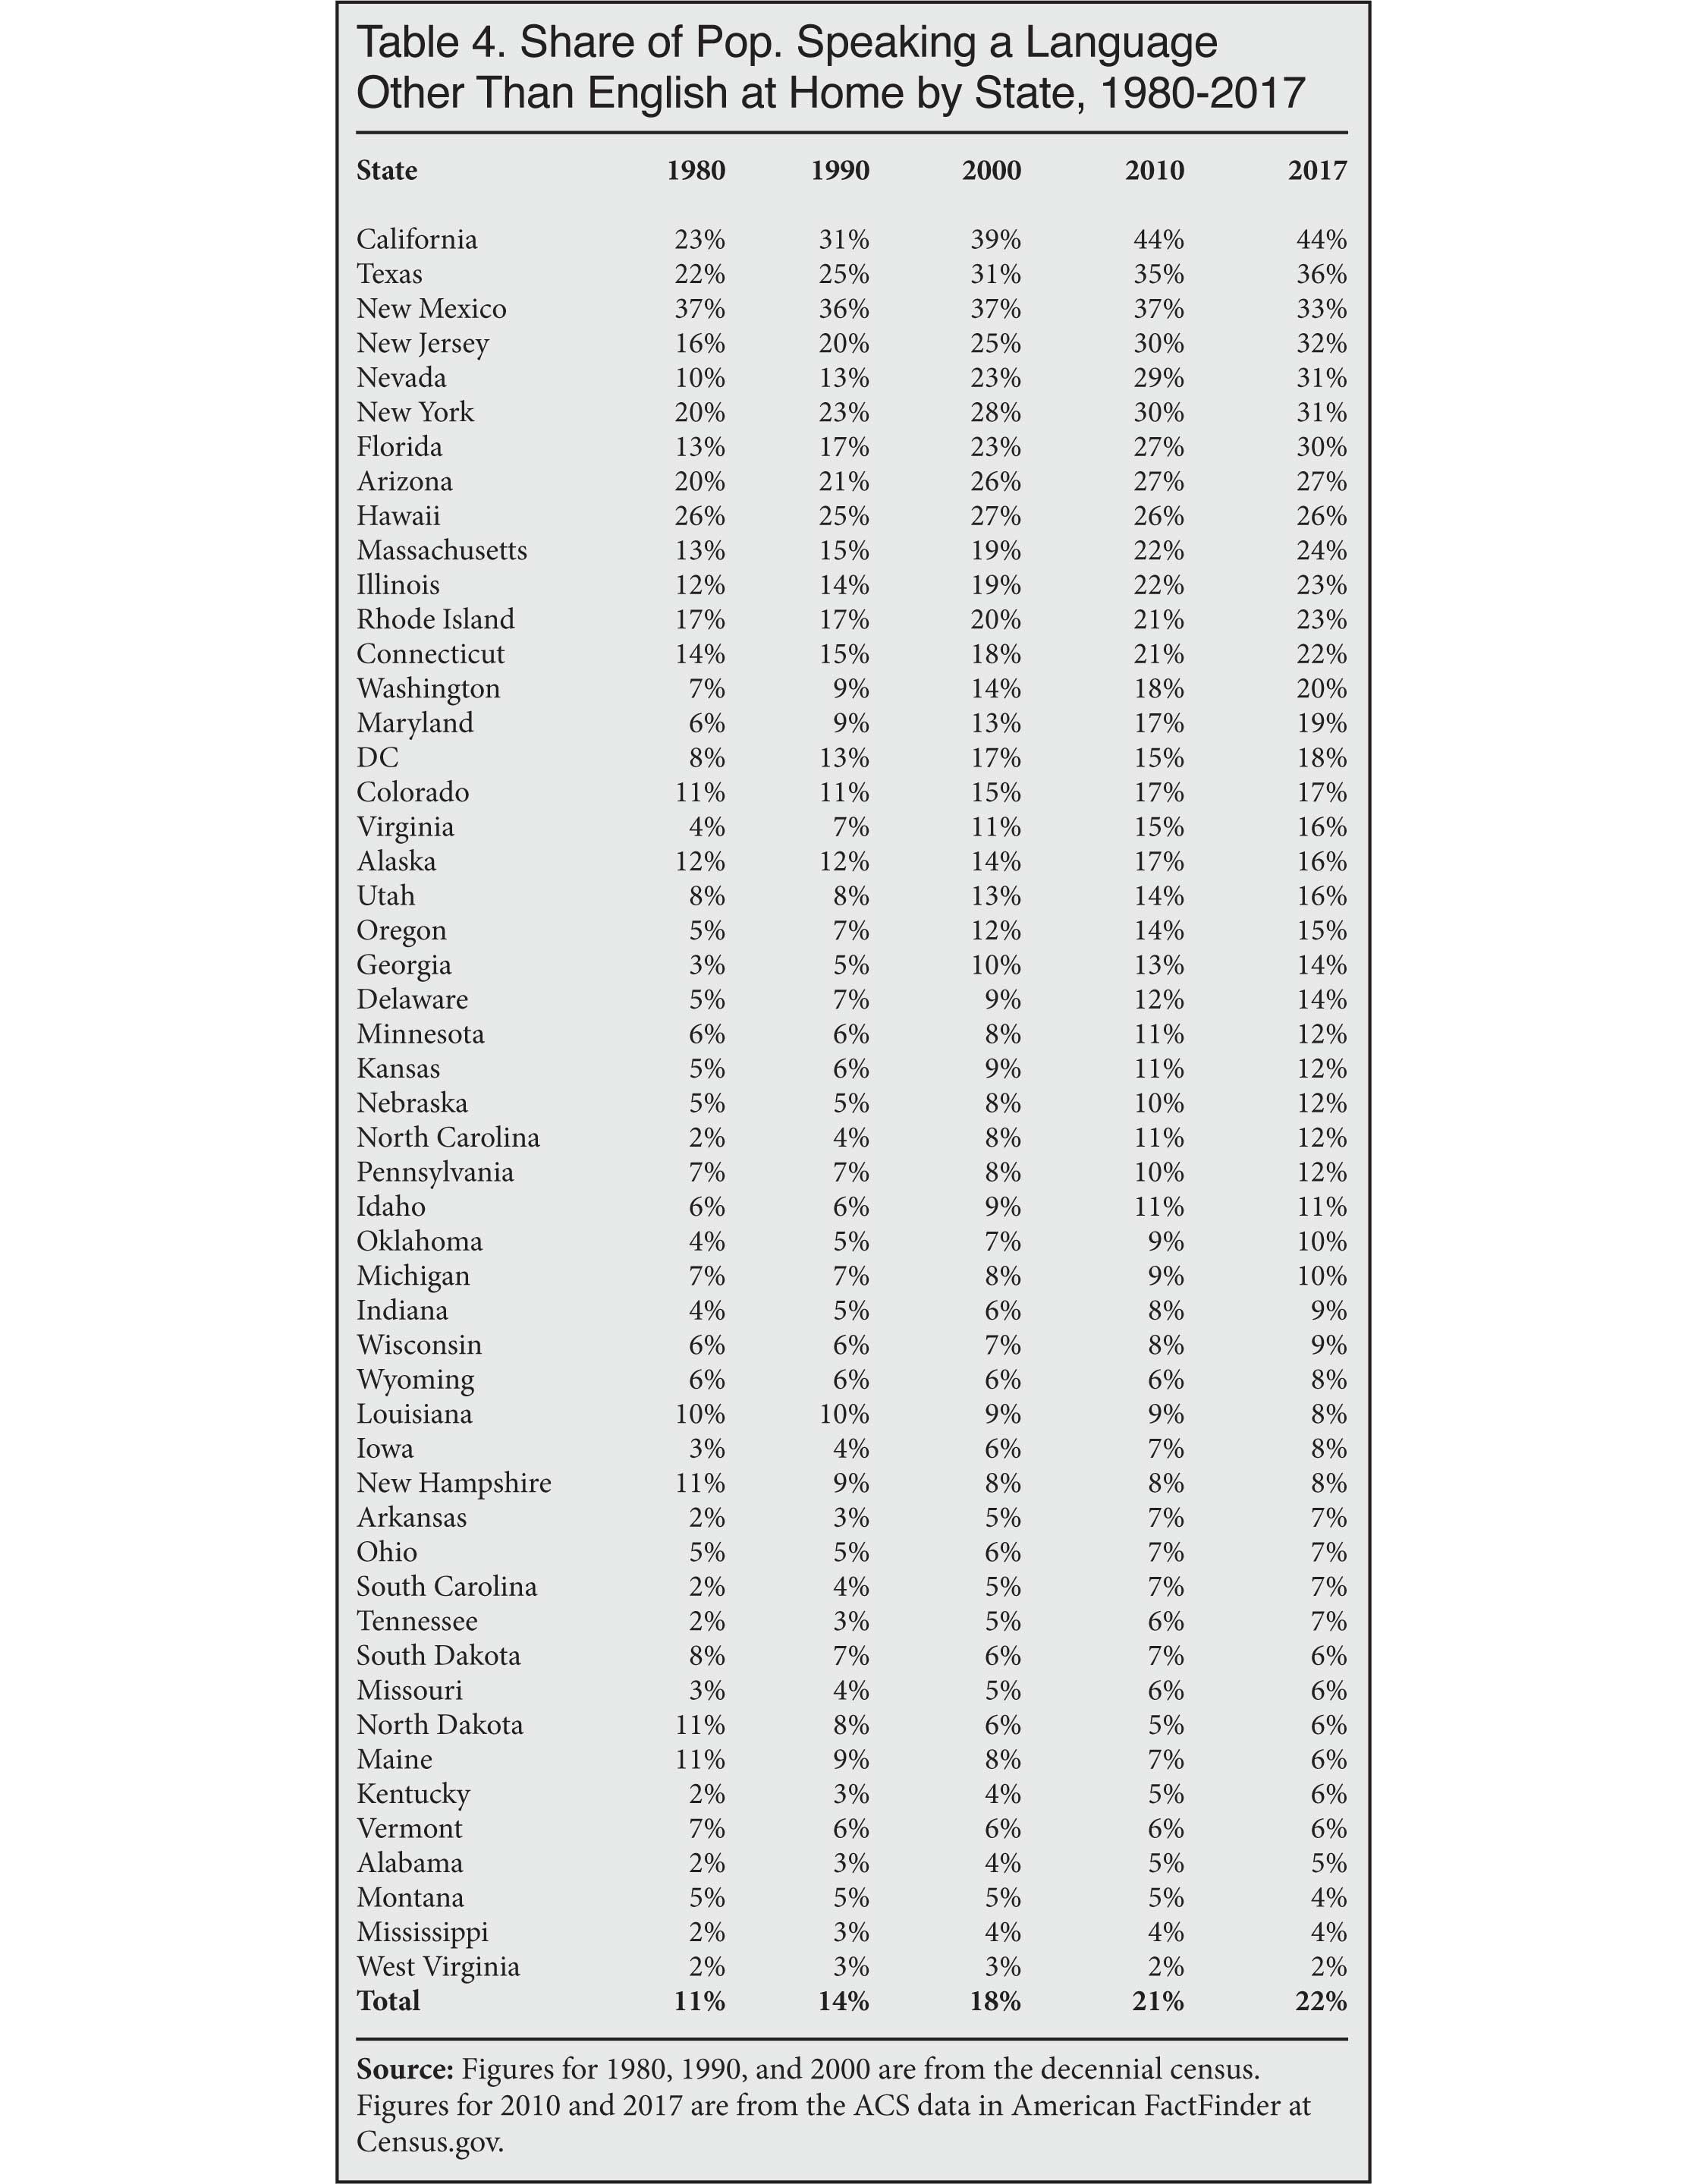
- States with the largest share of their populations speaking a foreign language at home in 2017 were California (44 percent); Texas (36 percent); New Mexico (33 percent); New Jersey (32 percent); New York and Nevada (both 31 percent); Florida (30 percent); Arizona (27 percent); Hawaii (26 percent); and Massachusetts (24 percent).
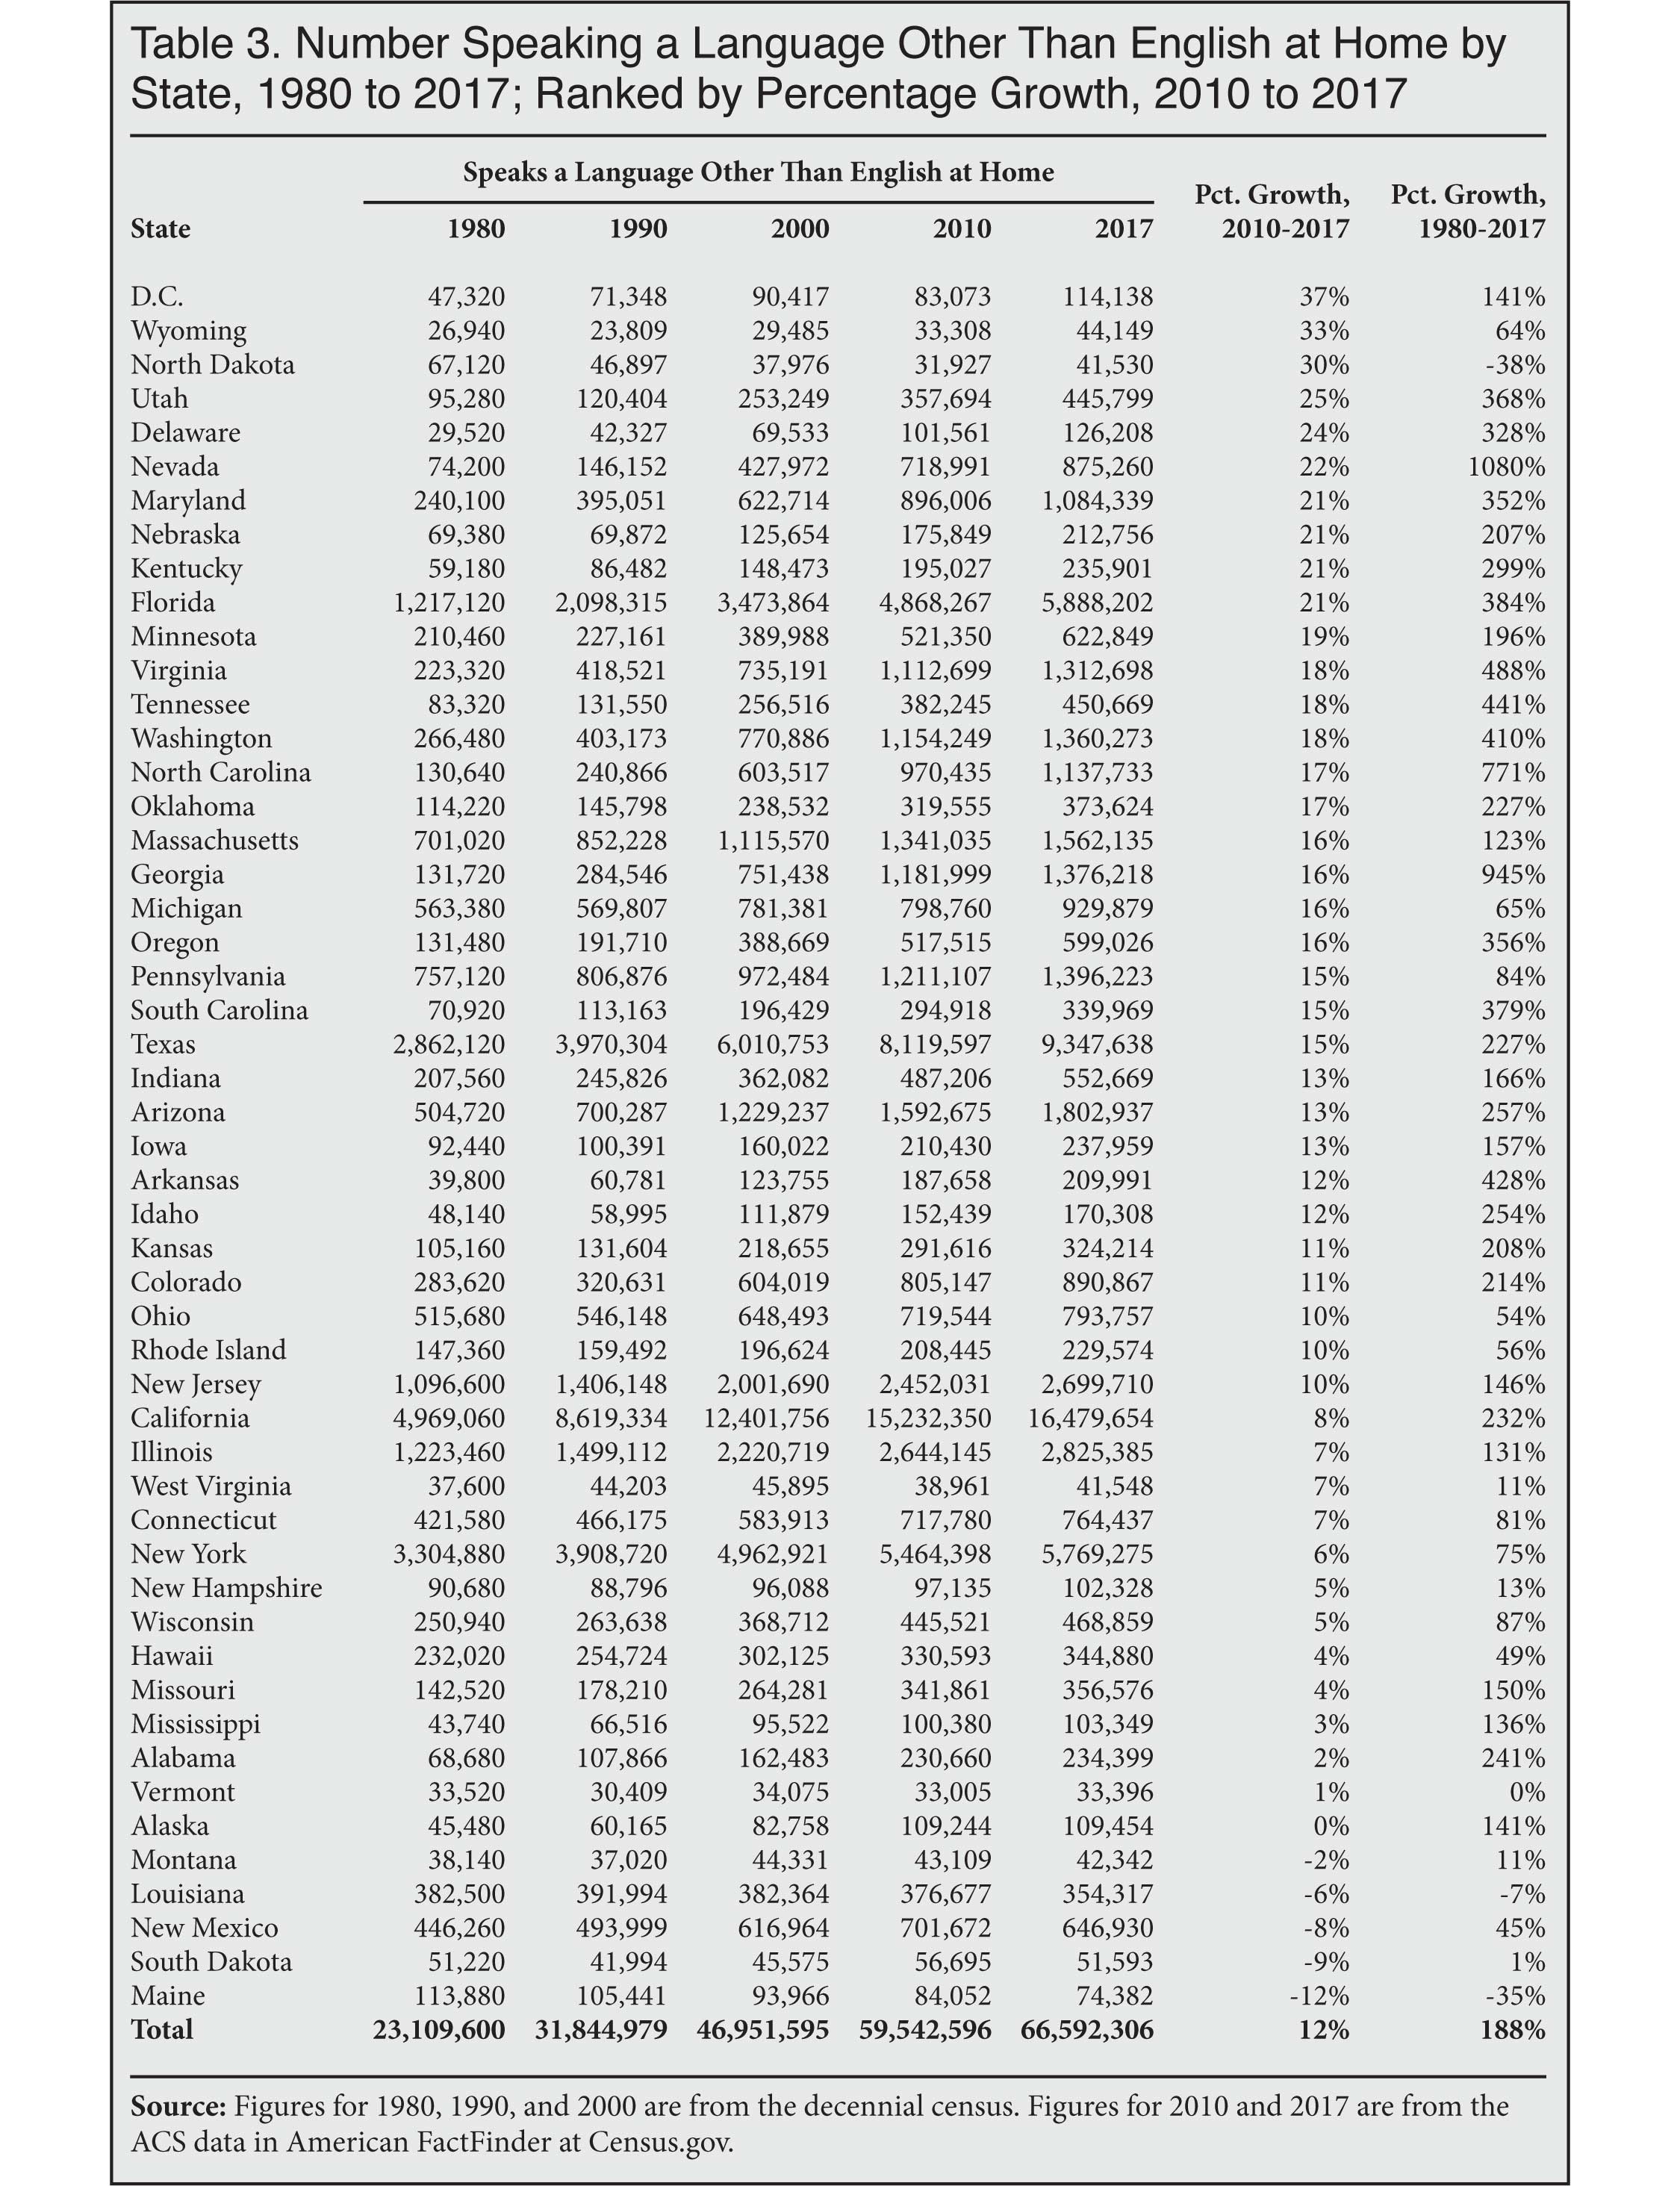
- States with the large percentage increase in the number of foreign language speakers from 2010 to 2017 were Wyoming (up 33 percent); North Dakota (up 30 percent); Utah (up 25 percent); Delaware (up 24 percent); Nevada (up 22 percent); Maryland, Nebraska, Kentucky, and Florida (each up 21 percent); and Minnesota (up 19 percent).
- Taking the longer view, states with the largest percentage increase in foreign language speakers from 1980 to 2017 were Nevada (up 1,080 percent); Georgia (up 945 percent); North Carolina (up 771 percent); Virginia (up 488 percent); Tennessee (up 441 percent); Arkansas (up 428 percent); Washington (up 410 percent); Florida (up 384 percent); South Carolina (up 379 percent); Utah (up 368 percent); and Oregon (up 356 percent).
Data Source. In September of this year, the Census Bureau released some of the data from the 2017 American Community Survey (ACS). The survey reflects the U.S. population as of July 1, 2017. The ACS is by far the largest survey taken by the federal government each year and includes over two million households.6 The Census Bureau has posted some of the results from the ACS to American FactFinder on the Bureau website.7 It has not released the public-use version of the ACS for researchers to download and analyze. However a good deal of information can be found at FactFinder. Unless otherwise indicated, the information in this analysis comes directly from FactFinder.
There are three language questions in the ACS for 2010 and 2017. The first asks whether each person in the survey speaks a language other than English at home. Second, for those who answer "yes," the survey then asks what language the person speaks. Third, the survey also asks how well the person speaks English. Only those who speak a language at home other than English are asked about their English skills. The 1980, 1990, and 2000 decennial censuses (long form) asked almost the exact same questions.
In this report, we provide some statistics for the immigrant population, referred to as the "foreign-born" by the Census Bureau. The foreign-born population is comprised of those individuals who were not U.S. citizens at birth. It includes naturalized citizens, legal permanent residents (green card holders), temporary workers, and foreign students. It does not include those born to immigrants in the United States, including to illegal-immigrant parents, or those born in outlying U.S. territories such as Puerto Rico. Prior research by the Department of Homeland Security and others indicates that some 90 percent of illegal immigrants respond to the ACS.8
End Notes
1 Figures for 539 cities and Census Designated Places (CDP) are in the Excel spreadsheet available here. The 48.2 percent figure is based on the entire population of these cities. If the share for each city is averaged together without regard to each cities' size, then 46 percent speak a language other than English. As for the school-age children (5-17) in these cities, more than half (50.3 percent) speak a foreign language.
2 In the nation's Metropolitan Statistical Areas (MSAs) defined by the Census Bureau, 24 percent of the population speak a language other than English at home, in the areas of the country outside of MSAs only 8.4 percent of the population speak a foreign language at home.
3 Unfortunately, the Census Bureau has not released the public-use data for 2017 yet. From the data that has been released for 2017, we do know that for those ages five to 17, 22.5 percent spoke a foreign language at home. In the 2016 ACS, 22.5 percent of those in this age group also spoke a foreign language at home. The 2016 data shows that 23.3 percent of students in public schools spoke a language other than English at home. It seems very likely that when all the data from 2017 is released, it will also show that 23.3 percent of public school students speak a foreign language at home. It should be pointed out that immigrants are more likely to send their children to public school than are natives. As a result, foreign-language students comprise a somewhat larger share of students in public schools than they do of the overall school-age population.
4 Of the native-born who speak a language other than English at home, 10.3 million or 34.9 percent are ages 5-17; the remaining 65.1 percent (19.3 million) are adults. Of those ages 5 to 17, 10,323,101 in 2017 were native-born and 1,808,818 were immigrants. Of adults 18 and older, 19,253,804 were native-born and 35,206,583 were immigrants.
5 There is some other data that does measure the English-language ability of U.S. residents, including those who speak a foreign language at home. The Program for the International Assessment of Adult Competencies (PIAAC) measured English literacy among a representative sample of Americans between 2012 and 2014. Publicly available data from the PIAAC shows that among people who spoke a foreign language most often at home, 49 percent scored "below basic" on an objective test of English literacy — including immigrants and the native born. "Below basic" has been likened to functional illiteracy. It seems likely that the self-assessment reported in the ACS overstates English-language ability while the PIAAC probably does a better job of capturing language ability. However, the PIAAC data must be interpreted with caution due to differences in question wording. The PIAAC asks which language is spoken most often at home, whereas the census simply asks if a non-English language is spoken at home. Furthermore, about a third of PIAAC participants did not answer the question about language use at home, for reasons that are unclear. See Jason Richwine, "Immigrant Literacy: Self-Assessment vs. Reality", Center for Immigration Studies, June 21, 2017.
6 Detailed information on the survey methodology, questions, and other information on the American Community Survey can be found here.
7 FactFinder can be found here.
8 See Table 2 on page 5 in Bryan Baker, "Estimates of the Unauthorized Immigrant Population Residing in the United States: January 2014", Department of Homeland Security, Office of Immigration Statistics", Department of Homeland Security, Office of Immigration Statistics, July 2017.