Download a pdf of this Memorandum
Steven A. Camarota is the Director of Research at the Center for Immigration Studies.
Less-educated, younger, and minority American workers face the worst job market in decades, far worse than their more educated counterparts. However the situation for these workers was very difficult even before the current recession began at the end of 2007. This report examines their employment situation in the second quarters of 2010 and 2007 (before the recession). Younger and less-educated workers are the most likely to be in competition with immigrants — legal and illegal. (Figures in this report are seasonally unadjusted.)
Among the findings:
- Younger and less-educated natives often do the same jobs as immigrants. In the second quarter of 2010, in the occupations employing the most young and less-educated U.S.-born adults, one in five workers was an immigrant.
- In the second quarter of 2010, the unemployment rate for U.S.-born adults who have not completed high school was 20.8 percent. But even in the second quarter of 2007, before the recession, it was 11.1 percent.
- Using the broader measure of unemployment that includes those who want to work, but have not looked recently, and those forced to work part-time, the rate for those who haven’t completed high school was 32.4 percent in the second quarter of 2010 and 18.7 percent in the same quarter of 2007.
- The unemployment rate for U.S.-born workers, ages 18 to 29, who have only a high school education was 20 percent in the second quarter of 2010 and 9.6 percent in 2007.
- The broader measure of unemployment for 18- to 29-year-old U.S.-born workers with only a high school education was 32.4 percent in the second quarter of 2010 and 16.6 percent in 2007.
- For U.S.-born minorities:
- black, less than high school, unemployment 2010: 29.0 percent; 2007: 17.4 percent
- black, less than high school, broader measure 2010: 43.1 percent; 2007: 27.6 percent
- black, high school only, young, unemployment 2010: 27.4 percent; 2007: 17.8 percent
- black, high school only, young, broader measure 2010: 40.7 percent; 2007: 25.6 percent
- Hispanic, less than high school, unemployment 2010: 22.9 percent; 2007: 12.8 percent
- Hispanic, less than high school, broader measure 2010: 35.0 percent; 2007: 20.6 percent
- Hispanic, high school only, young, unemployment 2010: 23.3 percent; 2007: 9.4 percent
- Hispanic, high school only, young, broader measure 2010: 36.0 percent; 2007: 16.0 percent - Teenagers are another group that also tends to compete with immigrants. In the second quarter of 2010, in the 25 occupations employing the most U.S.-born teenagers (16 and 17) one in five workers was an immigrant.
- In the second quarter of 2010, the unemployment rate of U.S.-born teens (16 and 17) was 31.2 percent; it was 18.9 in second quarter of 2007.
- If we examine the broader measure for U.S.-born teenagers, unemployment was 40.3 percent in the second quarter of 2010 and 24.6 percent in the same quarter of 2007.
- The situation for U.S.-born minority teenagers is worse than for teenagers generally. Black teen unemployment, for example, was 46.2 percent in the second quarter of 2010; it was 35.9 percent for Hispanic teenagers.
- The total number of young and less-educated U.S.-born workers unemployed is enormous. If we look at the broad measure of unemployment for all workers who lack a high school education or have only a high school education and are young (18 to 29) or are teenagers (16-17), seven million were unemployed in the second quarter of 2010.
- In addition to the seven million unemployed or underemployed, there were another 16 million of these younger and less-educated individuals who were entirely out of the labor market. That is, they were not working, nor were they looking for work, even using the broadest measure of unemployment.
- To place these numbers in perspective, there are an estimated seven to eight million illegal immigrants holding jobs.
Introduction
The argument is often made that there are not enough workers in the country to do jobs that require relatively little education.1 This is used to justify continuing to allow large numbers of less-educated immigrants into the country. It is also used as one of the justifications for legalizing illegal immigrants. Research indicates that the overwhelming majority of illegal immigrants and nearly half of legal immigrants have no more than a high school education.2 Taken together, 55 percent of legal and illegal immigrants ages 18 to 65 had no more than a high school education in the second quarter of 2010.3
The latest data show that unemployment is very high among less-educated and younger U.S.-born workers. Moreover, a very large share of less-educated natives are not even looking for work, and are thus not officially unemployed, even using the broadest measure of unemployment. While these workers faced a very poor labor market situation in 2010; even in 2007, before the current recession began, younger and less-educated U.S.-born workers had high rates of unemployment. It is difficult to reconcile the argument that there are not enough less-educated workers in the country with the extremely difficult employment situation these workers have faced for a number years. In this report we use the terms U.S.-born, native, and native-born interchangeably. We also use the terms immigrant and foreign-born synonymously.
Unemployment Rates for Young And Less-Educated Natives
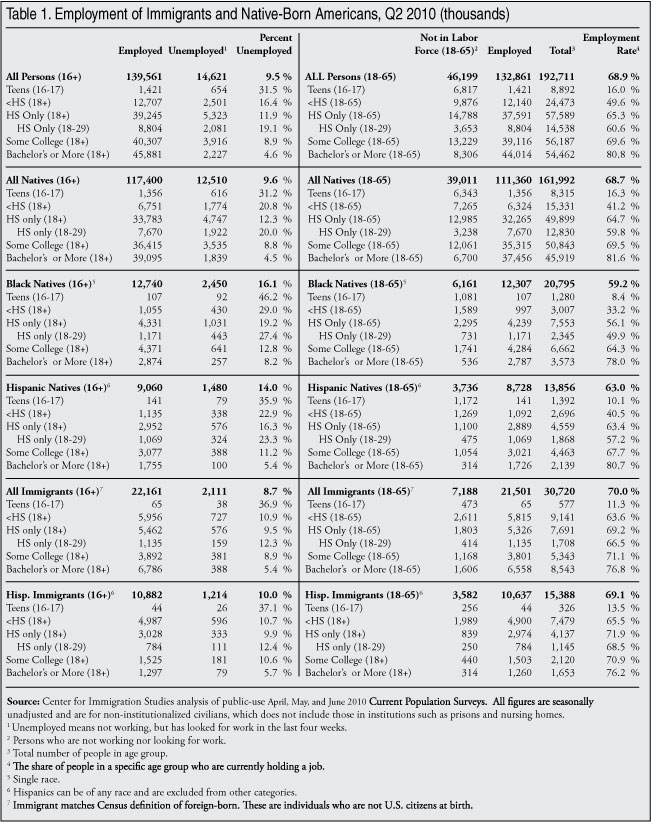
The left side of Table 1 shows the unemployment rate for all workers. Table 1 shows that unemployment varies significantly by group. For example, unemployment for adult (18-plus) native-born workers with less than a high school education was 20.8 percent. In contrast, it was just 4.5 percent for natives with at least a bachelor’s degree. Unemployment is much higher for teenagers, those without a high school diploma, and young high school graduates than it is for all workers and for the most educated workers. One of the most important findings in Table 1 is that those with a high school education who are young (18 to 29) have an unemployment rate similar to those who have not completed high school. Having completed high school does not seem to make much difference in terms of unemployment for young U.S-.born workers. Another important finding is that unemployment is much higher for young and less-educated U.S.-born minorities than for the population as a whole.
Employment Rates for Young And Less-Educated Natives
In contrast to the left side of Table 1, the right side of the table shows those who are employed and those who are considered outside of the labor force. To be in the labor force, one has to be working or have looked for a job in the last four weeks. Thus the labor force is comprised of those working and those who are not employed, but have looked recently. The right side of Table 1 shows that the employment rate (those holding a job) for U.S.-born high school dropouts was just 41.2 percent. This means that only four out of 10 natives who have not completed high school are working. For U.S.-born teenagers it was just 16.3 percent. For those who are young (18 to 29) with only a high school education it was 59.8 percent, or just six out of 10. In contrast, 81.6 percent of U.S.-born individuals with a college degree or higher had a job in the second quarter of 2010. As is the case with unemployment, the employment rates for U.S.-born minorities are much worse than for natives overall. And the contrast is especially stark when compared to the most educated natives.
It should be pointed out that a significant share of those not in the labor force may not wish to work. Some of those out of the labor force are parents staying home with young children who have no interest in working. Others are disabled in some way that prevents them from holding a job. Some are also full-time students. But the overwhelming majority of native-born high school dropouts and young high school graduates not in the labor force are not students.4 And of course, being a student certainly does not preclude working. Nearly half of all full-time adult students (18 to 65) were in the labor force in the second quarter of 2010. Non-work has become very common among the least educated natives.
Broader Measure of Unemployment
The standard unemployment rate shown on the left side of Table 1 excludes some people who may want to work, but who are not actively looking for a job and are therefore not officially unemployed. Also, the official unemployment figures do not include those working part-time, but who want to work full-time. In order to get a broader, more comprehensive measure of unemployment and underemployment, the Bureau of Labor Statistics (BLS) developed the U-6 measure (the official unemployment rate is referred to as U-3). The methodology section of this report explains in detail who is included in the U-6 measure of unemployment. Table 2 reports standard unemployment figures and the broader U-6 measure of unemployment. This more comprehensive measure of unemployment includes those who are officially unemployed, those who are involuntarily working part-time, and those “marginally” attached to the labor market. People who are marginally attached indicate that they would like to work but are not actively looking for a job because economic conditions and their own experience indicate that it is futile.

Looking at the U-6 unemployment rate in the last column of Table 2 shows that unemployment was 40.3 percent for U.S.-born teenagers and 32.4 percent for U.S.-born high school dropouts, and young natives (18 to 29) with only a high school education. These unemployment rates give a profound sense of just how difficult the current labor market is for the young and least educated. In contrast, the U-6 measure is 8 percent for natives with at least a bachelor’s degree.
Situation Before the Current Recession
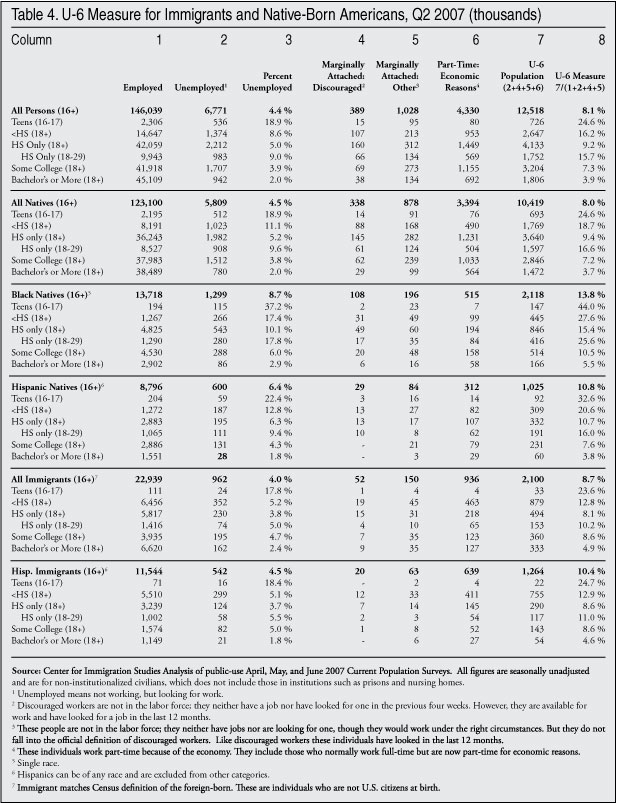
The extremely difficult employment situation during the current downturn may not be too surprising. But Tables 3 and 4 show that the least-educated and youngest workers faced a difficult labor market even before the current recession began. Table 3 reports the same information as Table 1 except that the figures are for the second quarter of 2007, before the recession. Table 3 shows that unemployment for natives with less than a high school education was 11.1 percent; for young high school graduates (18 to 29) it was 9.6 percent; and for teenagers (16 and 17) it was 18.9 percent. Table 4 shows that the U-6 measure for natives with less than a high school education was 18.7 percent in the second quarter of 2007. For young U.S.-born workers with only a high school education it was 16.6 percent; and for teenagers it was 24.6 percent. Tables 3 and 4 make clear that the very bad employment situation is not a new development for the young and least educated. While their employment picture has clearly worsened since before the recession, it was not good even before the economic downturn. Despite this employment situation in 2007, many employer groups and political commentators continued to argue for more unskilled immigration on the grounds that no American workers are available to fill jobs that require relatively little education.

It is very difficult to argue that there is a shortage of less-educated workers in the country. If the United States were to enforce immigration laws and encourage illegal immigrants to return home, we would seem to have an adequate supply of less-educated natives to replace these workers. We could also allow in fewer legal immigrants with relatively little education. At present, most legal immigrants are allowed into the country because they have a relative in the United States. As a result, a large share of legal immigrants have few years of schooling.
U.S.-Born Workers and Immigrants Often Do the Same Jobs
Tables 5, 6, and 7 report the top-25 occupations employing the largest number of less-educated and younger U.S.-born workers.5 In Table 5, the first column shows the number of U.S.-born teenagers (16 and 17) employed in each occupation in the second quarter of 2010. The second column shows the number of foreign-born workers (legal and illegal) in each occupation. The third column shows the share of workers in each occupation who are immigrants, and the last column shows the total number of people employed in each occupation (immigrant and native-born). Tables 6 and 7 report the same information for the top-25 occupations for native-born workers who have not completed high school and those who are young (18 to 29) with only a high school education, respectively. Although there is a good deal of overlap between the top occupations for each of these three groups, a number of the occupations are different across the tables.
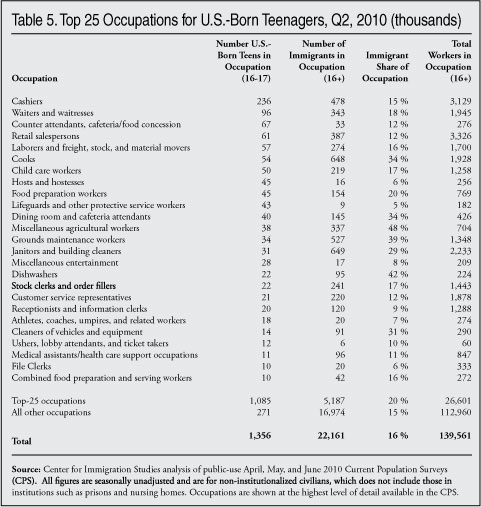
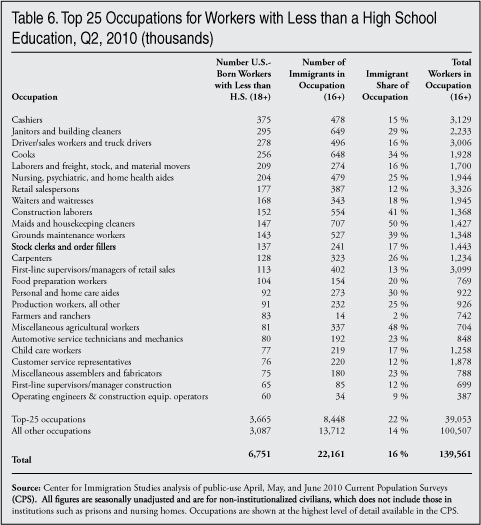
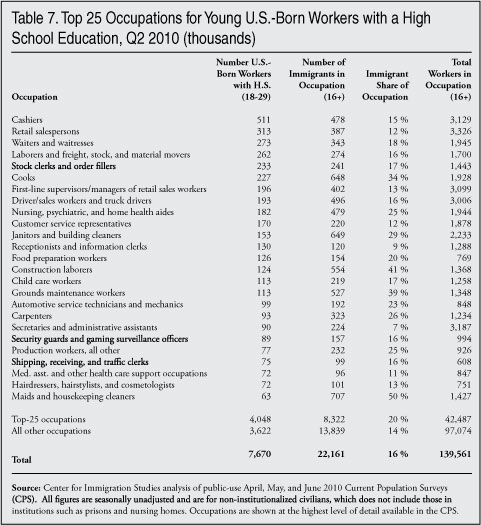
Table 5 shows that in the top-25 teenage occupations, 20 percent of workers are immigrants. These occupations employ 80 percent of all teenagers. If we look at Table 6, for those natives without a high school diploma, again we find that 22 percent of workers in these top occupations are immigrants. These occupations employ 54 percent of native-born Americans who have not completed high school. We see a very similar pattern for young U.S.-born workers with only a high school education. Table 7 shows that 20 percent of workers in these top-25 occupations for young high school graduates are immigrants. In these occupations, young U.S.-born high school graduates account for 53 percent of all U.S.-born young workers who have only a high school degree. If the often-made argument that young U.S.-born workers and immigrants do not compete for the same jobs is correct, then there should be very few if any immigrants employed in these top occupations. But, in fact, one in five workers are foreign-born in these occupations.
In the 25 occupations employing the most U.S.-born workers with education beyond high school, just 12 percent of workers are foreign-born. Thus, more-educated natives face significantly less competition from immigrants than younger and less-educated native-born workers. In general, the young and less educated who have the highest unemployment rates are the ones mostly likely to face competition with immigrants, while those with the lowest unemployment face the least competition.
Methodology
The data for Tables 1 and 2 come from the public-use files of the April, May, and June 2010 Current Population Surveys (CPS), which are collected monthly by the Census Bureau for the Bureau of Labor Statistics (BLS). The data for Tables 3 and 4 are for the same months in 2007, also from the CPS files. Each CPS includes about 131,000 respondents, roughly half of whom are in the labor force. The tables presented here are reported by quarter. Quarterly data is more statistically robust, especially for smaller populations like immigrants and minorities, due to the inclusion of three months of data. Persons in institutions like prisons and nursing homes are not included in the CPS. The CPS is the nation’s primary source for unemployment and other labor force statistics. Like all government surveys, the data are weighted to reflect the actual size and demographic makeup of the U.S. population.
The government publishes employment statistics that are both seasonally adjusted and unadjusted from the survey. The figures in this analysis are seasonally unadjusted. Unadjusted figures are computationally simpler and easy for other researchers to replicate. In general, BLS does not provide separate estimates for the foreign-born (immigrants) and the native-born broken down by characteristics like education, race, and age. However, all CPS respondents are asked these questions. The Census Bureau defines the foreign-born as persons who are not U.S. citizens at birth, which includes naturalized citizens, legal immigrants who are not citizens (green card holders), temporary visitors and workers, and illegal immigrants. All figures for the total U.S. population match those from the BLS.
The U-6 measure divides the sum of the unemployed population, involuntary part-time workers, and marginally attached people (discouraged and other) by the civilian labor force (employed and unemployed) plus marginally attached workers. The column headings in Tables 2 and 4 show this calculation. An unemployed worker is someone who does not currently hold a job, but is available to work and has looked for a job in the previous four weeks. Marginally attached workers indicate that they want and are available for jobs and they have looked for work in the past 12 months.6 However, they are not considered unemployed because they have not searched for a job in the previous four weeks. Involuntary part-time workers are those individuals who report that they are working part-time for economic reasons. They want and are available for full-time work, but must instead settle for part-time hours.7 Because the total U-6 measure includes the unemployed, those working involuntarily part-time, and those marginally attached to the labor market (discouraged and other), it provides the broadest possible measure of problems in the U.S. workforce.
End Notes
1 One of the many commentators and activists arguing that there is a “shortage” of unskilled workers is Tamar Jacoby, president of Immigration Works. A large share of her organization’s website is devoted to this perspective. See http://www.immigrationworksusa.org/index.php?p=40. The U.S. Chamber of Commerce is the largest and most important business group in the country. It has put out numerous statements, reports, press releases, and congressional testimonies that argue that not enough legal immigrants are allowed into the United States. They feel very strongly that, “We face a larger and larger shortage of workers, especially at the low-skilled end of the economy.” See their 2006 Congressional testimony at http://library.uschamber.com/issues/testimony/2006/testimony-guest-worke.... The Chamber’s views are echoed by the Business Roundtable, the Essential Workers Coalition, and a host of other organizations representing the interests of employers. The Catholic Church argues that there are not enough less-educated workers allowed into the country and the law must be reformed so that more “laborers from other countries can enter the country.” See Catholic Bishops’ “Call for Comprehensive Immigration Reform,” at http://www.usccb.org/jfi/bishops-call.html. To examine the views of leaders of other religious communities, which are similar to those of the Catholic Bishops, see “Religious Leaders vs. Members: An Examination of Contrasting Views on Immigration,” http://www.cis.org/ReligionAndImmigrationPoll#2.
2 The Pew Hispanic Center has estimated that 74 percent of illegal immigrants ages 25 to 64 have no more than a high school education and 46 percent of legal immigrants in the same age group also have no education beyond high school. See Figure 16 in “A Portrait of Unauthorized Immigrants in the United States,” at http://pewhispanic.org/files/reports/107.pdf.
3 See right side of Table 1 in this report.
4 Of U.S.-born adults (18 to 65) with less than a high school education and not in the labor force, only 22 percent were full-time students in the second quarter of 2010. For young natives (18 to 29) with only a high school education and not in the labor market, just 6.5 percent were full-time students. Clearly school attendance is not the reason so many of these individuals are not working or looking for work.
5 For a detailed examination of all workers and occupations see, “Jobs Americans Won’t Do? A Detailed Look at Immigrant Employment by Occupation,” at http://www.cis.org/illegalimmigration-employment.
6 Marginally attached workers indicate that they looked for work in the last 12 months, but not in the prior four weeks. The marginally attached are comprised of two groups, both of which are included in U-6. One group is considered “discouraged.” (The variable in the CPS used to determine this population is pemlr). Discouraged workers provide a reason related to market conditions for why they are not currently looking for a job. The second group of the marginally attached indicate that they are conditionally interested in finding work and are referred to as “other marginally attached workers.” (The variable in the CPS used to determine this population is prdisc). These individuals provide reasons such as family responsibilities, school attendance, illness, and transportation problems for why they have not searched for work in the previous four weeks.
7 Involuntary part-time workers respond that they are working part-time (one to 34 hours a week) for economic reasons, and include those who usually work full-time and those who usually work part-time. They share a desire to work full-time.