Detailed immigration enforcement records we obtained through FOIA confirm that Biden administration policies have caused a sharp decline in all removals, and in the removal of criminal aliens. This is the first in a series of reports to examine ICE enforcement activity under Biden policies, which will provide much greater detail than the information disclosed in the ICE director’s annual report, recently published after pressure from Congress in lieu of ICE’s traditional annual report that gives a more extensive record of ICE activity.
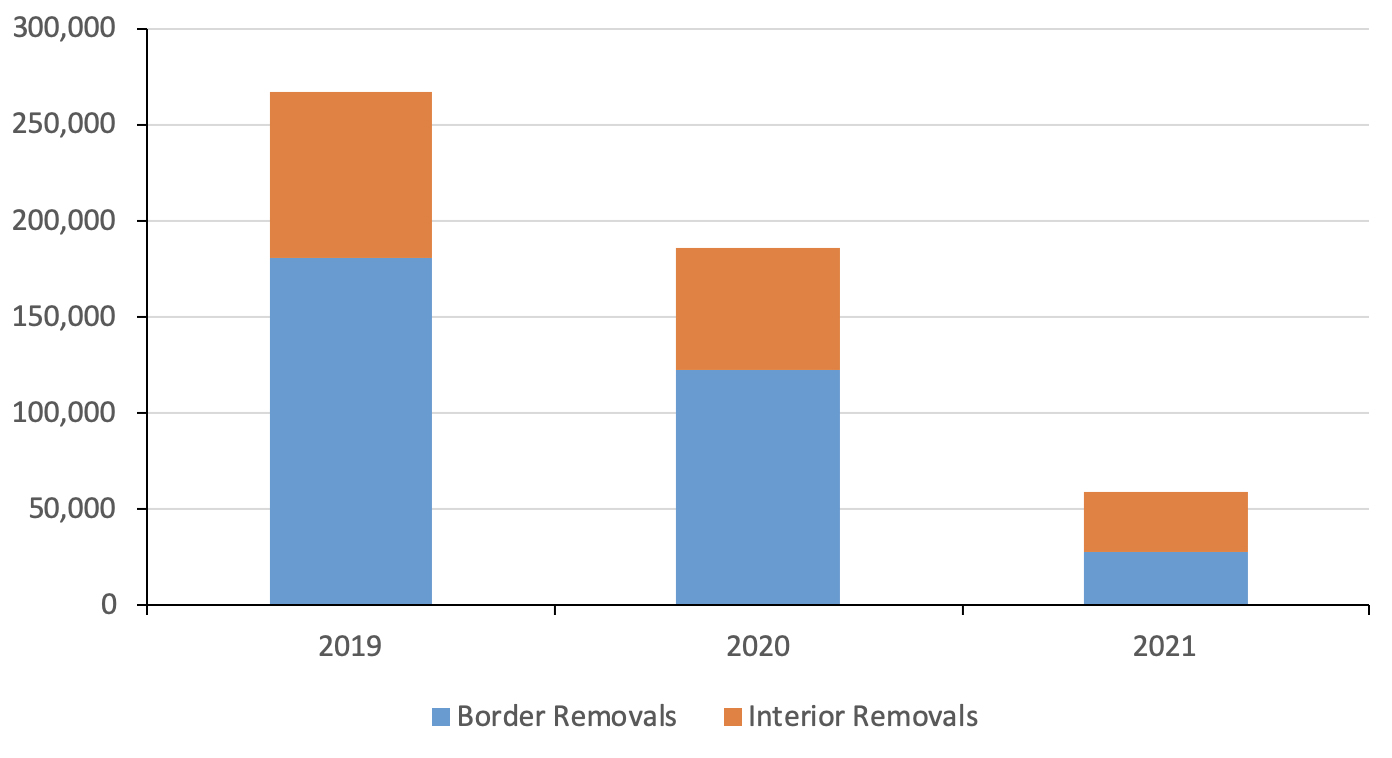
The Total Number of ICE Removals. In fiscal year 2021, total ICE removals were 59,011, including both border and interior removals. That is nearly 70 percent lower than fiscal year 2020, when ICE removed 185,884 aliens (See Table 1). By comparison, in 2019, which is the last full year under Trump administration policies and the last full year in which ICE operated without pandemic restrictions, ICE removed 267,258 aliens — more than four times the number removed in 2021. During 2021, ICE operated under Trump policies from October to January (somewhat restricted by pandemic conditions), and then under Biden policies starting in January that were then formally adopted in February (still somewhat restricted by the pandemic).
Table 1. ICE Criminal Alien Removals: 2019-2021 |
|||
| 2019 | 2020 | 2021 | |
| Total Removals (Border and Interior) | 267,258 | 185,884 | 59,011 |
| Convicted Criminals | 150,141 | 103,762 | 39,149 |
| Aggravated Felons | 12,200 | 9,161 | 5,221 |
| Interior Removals | 85,958 | 62,739 | 31,557 |
| Convicted Criminals | 64,991 | 48,606 | 26,210 |
| Aggravated Felons | 7,316 | 5,352 | 3,116 |
| Selected Criminal Convictions | |||
| Homicide | 1,036 | 880 | 856 |
| Sex Assault | 2,384 | 2,059 | 1,911 |
| Weapons Offenses | 3,121 | 2,546 | 1,662 |
| Dangerous Drugs (Excl. Possession & Marijuana) | 9,728 | 7,971 | 5,924 |
| Kidnapping | 451 | 379 | 288 |
| Human Slavery/Trafficking | 52 | 38 | 28 |
| 287(g) Program (Local LEA Partners) | 6,536 | 4,319 | 1,613 |
|
Source: ICE records obtained through FOIA. |
|||
Removals of Criminal Aliens. Removals of convicted criminals fell 62 percent in 2021, to 39,149 from 103,762 in 2020. Removals of aggravated felons fell 43 percent in 2021, to 5,221 from 9,161 in 2020.
Some have suggested that the decline in ICE removals is due to the use of Title 42 authority at the border, in which illegal border-crossers are expelled instead of removed, as is the practice in typical years. Yet, as Table 1 shows, removals of aliens, criminal aliens, and aggravated felons in the interior have also declined dramatically. Figure 1 shows the share of ICE removals that are border cases and interior cases.
Figure 1. ICE Removals: 2019-2021 |
 |
|
Source: ICE records obtained through FOIA. |
Interior Removals. Interior removals dropped by 50 percent in 2021, from 62,730 in 2020 to 31,557 in 2021 — and remained far below the 2019 level of 85,958, even as pandemic restrictions began to ease in the interior in 2021. Similarly, removals of criminal aliens from the interior also dropped significantly, from 48,606 in 2020 to 26,210 in 2021 — despite the alleged focus on removing criminals and other threats to public safety.
Removals in Fiscal Years Before and After February 18, 2021. The ICE records indicate that the drop in enforcement activity in 2021 is directly attributable to the implementation of the Biden enforcement policies. Table 2 provides a breakdown of removals in the fiscal year before and after February 18, 2021, when the Biden policies were formally adopted, and shows a substantial decline in every category: border and interior, aliens with criminal convictions, and aggravated felons.
Table 2. ICE Removals in 2021
|
|||||||||
| 2021 | | | |
10/1-2/17 | Per Day |
| | |
2/18-9/30 | Per Day |
| | |
Percent Change |
|
| Total Removals (Border and Interior) |
59,011 | | | |
27,971 | 200 | | | |
31,040 | 138 | | | |
-31% |
| Aggravated Felons | 5,221 | | | 2,193 | 16 | | | 3,028 | 13 | | | -19% |
| | | | | | | |||||||
| Interior Removals | 31,557 | | | 16,972 | 121 | | | 14,585 | 65 | | | -46% |
| Aggravated Felons | 3,116 | | | 1,364 | 10 | | | 1,752 | 8 | | | -20% |
| | | | | | | |||||||
| 287(g) Program (Local LEA Partners) |
1,613 | | | |
979 | 7 | | | |
634 | 3 | | | |
-57% |
|
Source: ICE records obtained through FOIA. |
|||||||||
Another factor likely contributing to the decline in interior criminal alien removals is the Biden administration’s move to curtail use of the 287(g) partnerships with local law enforcement agencies. The number of removals attributed to local 287(g) programs numbered just 1,613 in 2021, down sharply from prior years. The Biden administration took action to shut down a few of these programs very quickly, including one of the larger programs in Bristol County, Mass.
ICE Records Contradict Claims Made Earlier This Year. The records contradict claims made by ICE Director Tae Johnson in the aforementioned ICE annual report. In that report, Biden officials emphasized one particular metric — arrests and removals of aggravated felons — as evidence of the public safety value of their new policies.
Specifically, that report stated that under the new Biden policies, ICE had removed “an average of 937 aggravated felons per month — the highest level ever recorded since ICE began collecting detailed criminality data”. It further stated that since February 2021, “Twenty-six percent of ICE removals were of aggravated felons.”
The deportation records provided to us by ICE do not support these claims. As illustrated in Table 2, ICE records show that 5,221 aggravated felons were removed in 2021, with 3,028 of them occurring on February 18 or after. That is a rate of 13 per day, or just over 400 per month. In comparison, in 2021 under Trump policies, ICE removed 2,193 aggravated felons, at a rate of 16 per day, or nearly 500 per month. In 2020, prior to the Biden administration and at the height of the pandemic, ICE removed 9,161 aggravated felons, at a rate of 446 per month.
Under the Biden policies, 3,028 out of 31,040 removals were aggravated felons, which is just under 10 percent, not 26 percent, as claimed by Johnson. The number of interior removals who were classified as aggravated felons (1,752 out of 14,585) is only 12 percent of the total.
Stay tuned for future reports on the 2021 ICE enforcement record.