Download a PDF of this Backgrounder
Steven A. Camarota is the director of research and Karen Zeigler is a demographer at the Center.

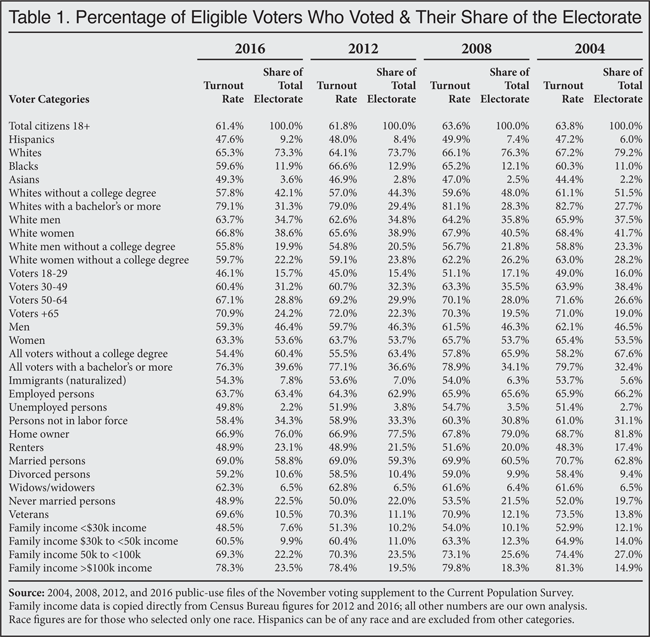
Donald Trump’s surprising win in the 2016 presidential election has caused some to wonder if his success was driven in part by significant changes in turnout among demographic groups. This report analyzes newly released Census Bureau data from November 2016 that reports the demographics of voters in 2016. Three key findings emerge from the data: First, the black turnout rate declined significantly between 2012 and 2016 — returning to levels seen before Obama’s candidacy. Second, despite predictions that Trump’s rhetoric on illegal immigration would animate Hispanics, their 2016 turnout rate was virtually identical to what it was in 2012. Third, there was no national surge in white turnout, including among those without a college degree. These same national patterns also generally hold for battleground states and in the six states that flipped from supporting Obama in 2012 to supporting Trump in 2016, with some exceptions.
Among the findings:
- The share of eligible black Americans who voted (the turnout rate) declined significantly, from 67 percent to 60 percent between 2012 and 2016. The 2016 rate matches the rate from 2004. As a share of all voters, blacks declined from 13 percent to 12 percent nationally.
- The share of eligible Hispanics who voted held almost constant at 47.6 percent in 2016, compared to 48 percent in 2012. Reflecting the long-term impact of prior immigration and above-replacement-level fertility, the total number of Hispanic voters continued its slow, steady increase — from 7 percent in 2008, to 8 percent in 2012, to 9 percent of the total electorate in 2016.
- The share of eligible immigrants (naturalized U.S. citizens) who voted held roughly constant at 54 percent between 2012 and 2016. Like the figures for all eligible Hispanics (native and foreign-born) reported above, there is no evidence that Trump’s positions increased or decreased immigrant turnout rates.
- In 2016, 65 percent of eligible whites voted; a slight increase from the 64 percent in 2012. This compares to 66 percent in 2008 and 67 percent in 2004.
- Due to prior immigration policies and relatively low fertility, whites are a declining share of the national electorate. However their share declined by just 0.4 percentage points between 2012 and 2016. This compares to a 2.5 percentage-point decline in their share of the total vote between 2008 and 2012 and a 2.9 percentage-point decline between 2004 and 2008.
- The slight increase in the share of eligible whites who voted and the large decline in black turnout partly explain why the white share of the national electorate did not decline as it had in prior elections, even though the Hispanic share continued its slow, steady increase in 2016.
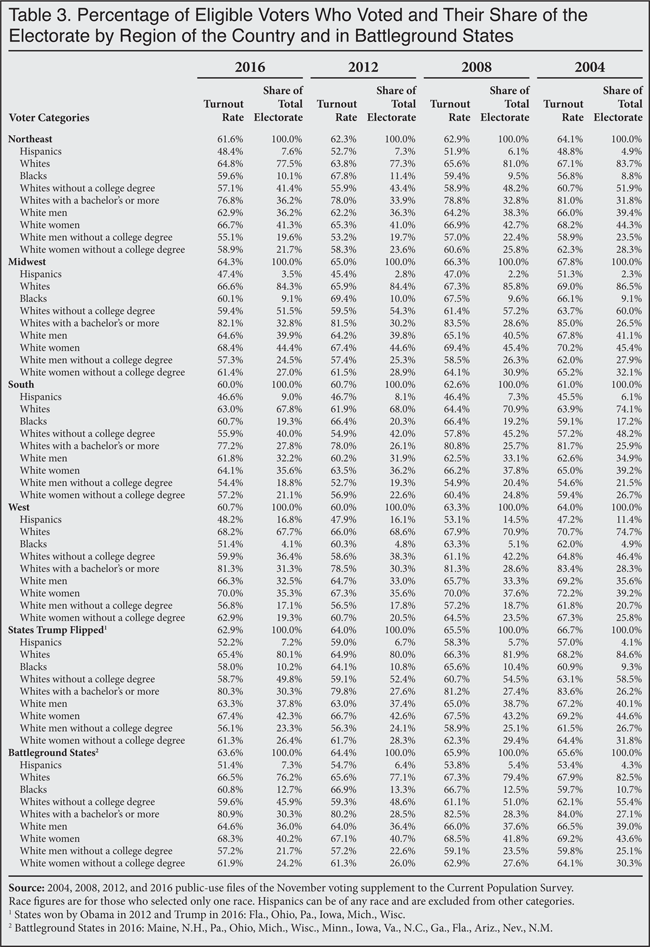
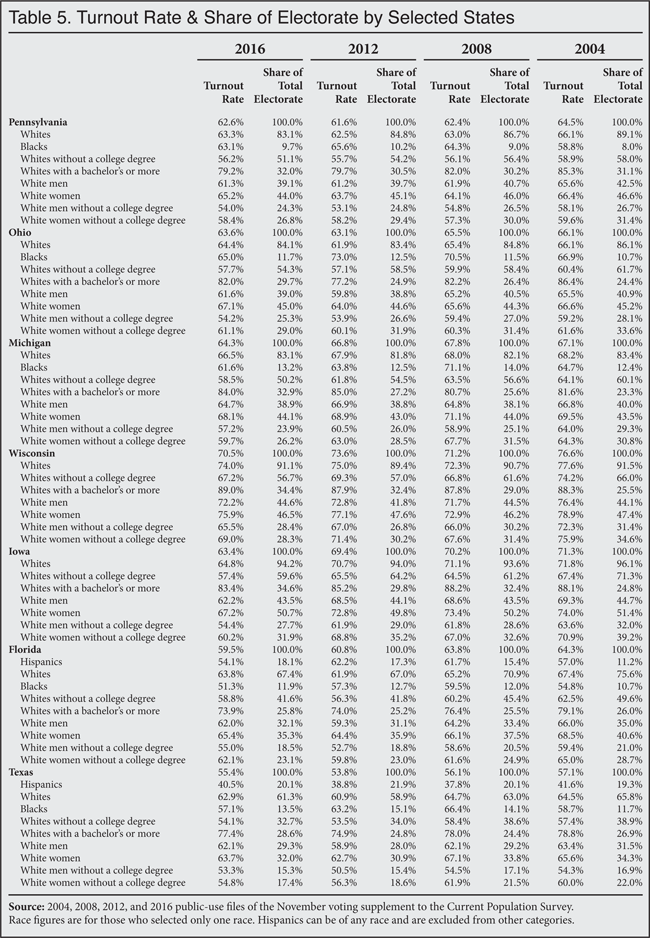
- In the six states (Florida, Ohio, Pennsylvania, Iowa, Michigan, and Wisconsin) that “flipped” from sup¬porting Obama in 2012 to supporting Trump in 2016, the pattern of black decline and white stability generally holds; however in Florida, the largest of these states, the Hispanic turnout rate declined.
- In Ohio, the turnout rate among eligible whites increased 2.5 percentage points from 2012 to 2016. As a share of all voters, whites in the state may have actually increased slightly.
- The turnout rate of blacks declined somewhat more dramatically in Ohio than in the nation as a whole — from 73 percent in 2012 to just 65 percent in 2016. As a result, their share of the Ohio electorate also may have fallen slightly.
- In contrast to the country as a whole, in Florida Hispanic turnout fell from 62 percent in 2012 to 54 percent in 2016.
- In contrast to blacks and Hispanics in Florida, white turnout in the state rose slightly, from 62 percent in 2012 to 64 percent in 2016, and their share of the total electorate did not decline.
- In Iowa, the white turnout rate declined significantly from 71 percent to 65 percent between 2012 and 2016. As a share of the electorate in the state, whites held constant because non-white turnout was also down.
- Although not a battleground state, the relative closeness of the 2016 Texas presidential race compared to prior races has prompted some to wonder if changing demographics was the cause. However, black and Hispanic turnout followed the same trends in the state as they did nationally; and whites may have increased their share of the total electorate slightly in 2016 compared to 2012.
Data Source. The data for this analysis comes from the Voting and Registration Supplement of the Current Population Survey (CPS) collected by the Census Bureau, which contains about 100,000 adults. The Voting and Registration Supplement is conducted by the Bureau in November every other year after Election Day.1 The public-use file of this data for the 2016 election was recently released. The survey asks individuals if they are registered to vote and if they voted. The survey also asks a number of other socio-demographic questions. This analysis draws on our analysis of public-use data of the voting supplement.
Difference with Exit Polls. The Voting and Registration Supplement does not report how people voted, only who was eligible, registered, and voted. In contrast, the national exit poll conducted by Edison Research for major news outlets reports who voted and how they voted.2 In some cases, the vote shares by demographic groups from the Voting and Registration Supplement do not exactly match the shares reported in national exit poll. So, for example, CNN reports that the national exit poll showed that 11 percent of the electorate was Hispanic in 2016, while the Census data shows they were 9.2 percent of the electorate. It must be remembered that the Census Data has a margin of error of 0.3 percentage points, so the range for the Hispanic share of voters is 8.9 percent to 9.5 percent, assuming a 90 percent confidence interval.3 The exit poll also has a margin of error of one percentage point, assuming a 95 percent confidence interval. Further, since the exit poll rounds to the nearest whole percentage, the Hispanic share could be 10.5 to 11.4 percent, but is rounded to 11 percent. To this rounding error, a one-point statistical margin of error must be added. Thus the 1.8 percentage-point difference between the Census Bureau data is probably not statistically significant given sampling error in both surveys and rounding error in the exit poll.
Having said this, it seems likely that the exit poll did slightly understate the white share of the electorate. When the poll was first released, Edison Research estimated whites were 70 percent of the electorate; this was revised upward to 71 percent in the days following the election. However, this is still significantly less than the 73.3 percent shown in the Census Bureau survey. All surveys, including the exit poll and the Census Bureau voting supplement, are weighted to reflect the composition of the population. It seems likely that the exit poll either did not capture or did not weight white respondents correctly and this modest undercount reduced their share of the electorate somewhat below their actual share. This may help to explain why the exit polls were wrong in a number of states. However, the national exit poll was not off in the way that it was in several key states, suggesting that the problem was more pronounced in particular states rather than a systemic error throughout the country. While well beyond the scope of this analysis, the problems with exit polling in 2016 are a reminder why the Census Bureau’s election survey, which provides another independent look at the electorate, is so valuable.
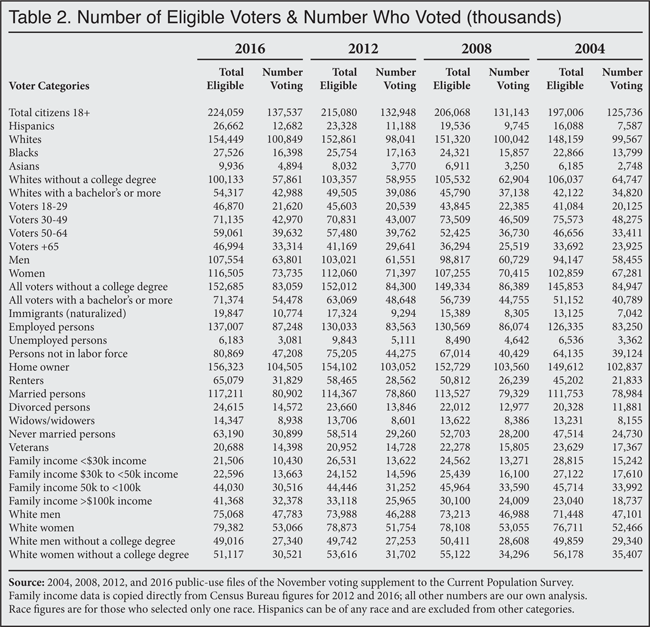
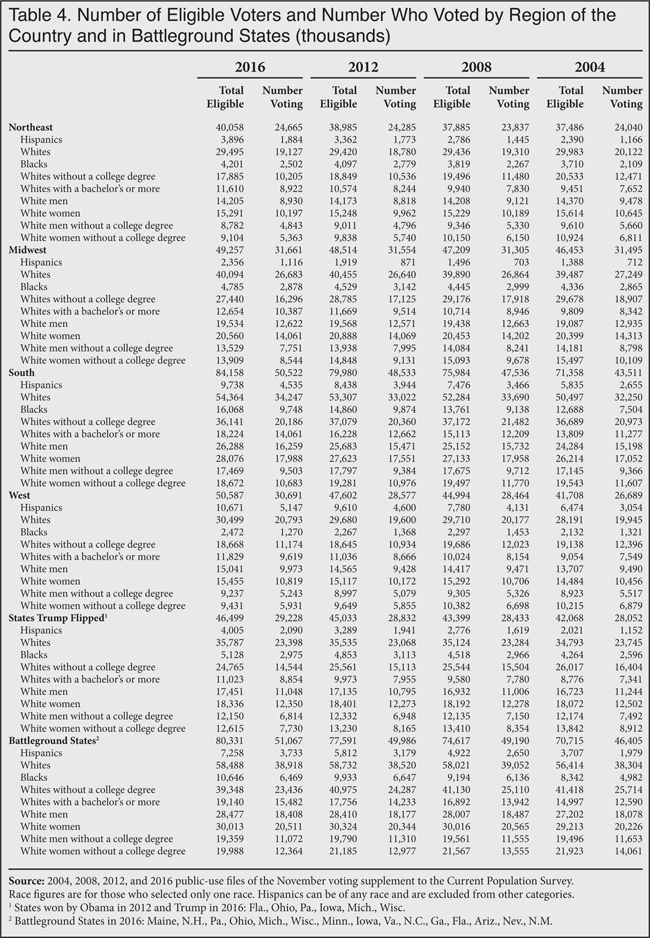
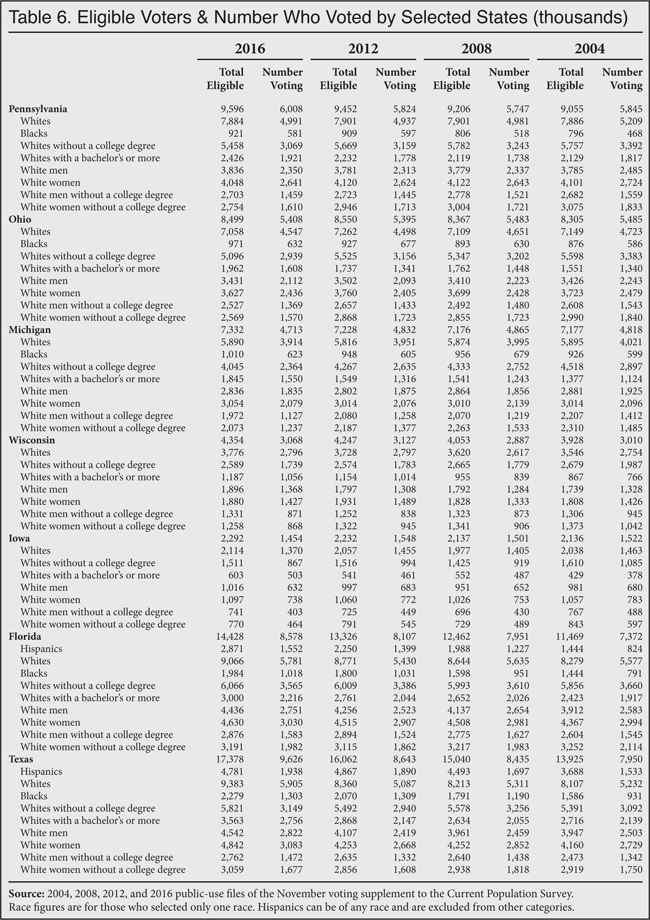
Results in the Tables. Table 1 reports the percentage of eligible voters who cast a ballot on Election Day in the 2004, 2008, 2012, and 2016 presidential elections based on Census Bureau data. This can be referred to as the turnout rate. It also reports the percentage of the electorate each group represented. So, for example, the table shows that 63.3 percent of all women eligible to vote actually did so in 2016 and they comprised 53.6 percent of the electorate. Table 2 reports the number of eligible voters by demographic group and the number who voted. Tables 3 and 4 report the same information as Tables 1 and 2, though for fewer variables, for regions of the country, with battleground states and the six states won by Trump in 2016 that were carried by Obama in 2012 grouped together. Tables 5 and 6 report this same information for each of the six states that changed party between 2012 and 2016.
Conclusion
The Voting and Registration Supplement collected by the Census Bureau is a valuable data source for examining who was eligible to vote and who actually voted. The voting supplement results reported in the tables show the great diversity of the American electorate. The electorate is comprised of numerous overlapping voting blocs. Many factors influence voting decisions, including, race, education, income, gender, occupation, marital status, and age. Furthermore, there is ideology, party identification, religion, and voters’ perception of a candidate’s character that are not included in the Census data, but certainly matter a great deal. It would be a mistake to think of the electorate one-dimensionally.
End Notes
1 Results and information about the November supplements to the Current Population Survey can be found here.
2 The result for the 2016 exit poll as reported by CNN can be found here.
3 The latest source and accuracy statement for the November voting supplement can be found here.
