Download a pdf of this Backgrounder
Steven A. Camarota is the Director of Research at the Center for Immigration Studies.

The Center for Immigration Studies has used newly released Census data to examine the November 2012 election. The new data show that the share of eligible Hispanics who voted in 2012 was lower than in 2008, while the black share was higher than in 2008. The biggest decline in eligible voters was among whites, particularly those without a college degree. Had eligible white voters turned out at the 2004 rate, 4.7 million more of them would have voted, 4.2 million without a college degree.
Among the findings:
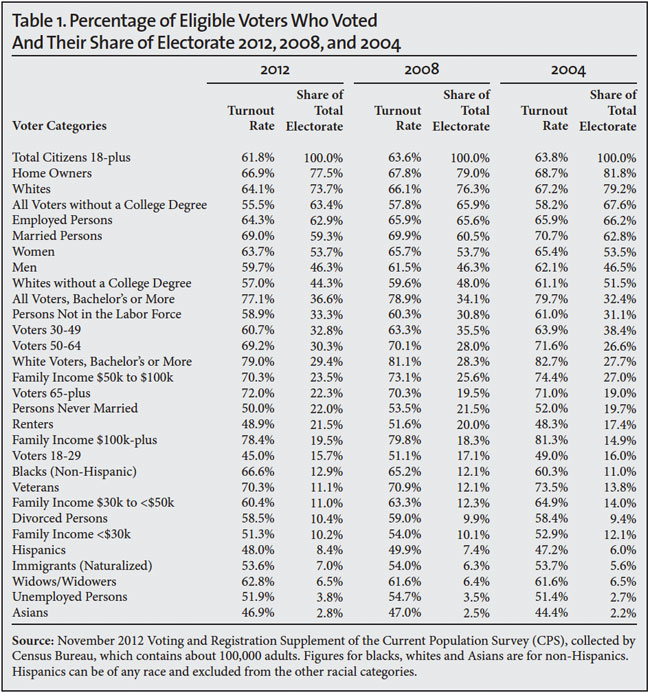
- Overall, 61.8 percent of eligible voters turned out in 2012, down from 63.6 percent in 2008 and 63.8 percent in 2004.
- Prior to the election there was speculation that Hispanics would be particularly animated in 2012. However, this turned out not to be the case. Only 48.0 percent of eligible Hispanics voted, down from 49.9 percent in 2008. The 2012 turnout was similar to 2004, when 47.2 percent voted.
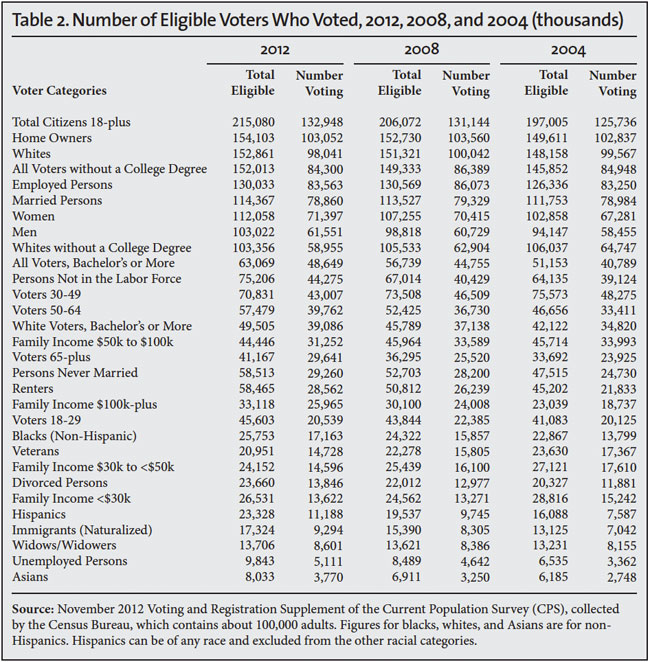
- Hispanics were 8.4 percent of voters (11.2 million), close to the 8.9 percent the Center for Immigration Studies projected prior to the November election.1 If Hispanic turnout had been what it was in 2008, 450,000 more Hispanics would have voted.
- Whites were also unengaged in the election, with a 64.1 percent turnout among eligible voters, down from 66.1 percent in 2008 and 67.2 percent in 2004. (There is a break in the continuity of data by race, so elections prior to 2004 are not directly comparable to more recent presidential elections.)2
- If white turnout had been what it was in 2004, 4.7 million more of them would have voted. Of the 4.7 million whites who sat home on Election Day relative to 2004, 4.2 million did not have a bachelor's degree.
The President received five million more votes than Governor Romney. What would have it taken for Romney to have won at least a plurality of the popular vote?3 (This does not mean Romney would have won the election since the Electoral College determines the outcome.)
- If Governor Romney had increased his share of the women's vote by four percentage points, from the 44 percent he actually received to 48 percent, then he would have won the popular vote. Each percentage point of the female vote equaled 714,000 votes.
- If Governor Romney had increased his share of the black vote by 15 percentage points, from the 6 percent he actually received to 21 percent, then he would have won the popular vote. Each percentage point of the black vote equaled 172,000 votes.
- If Governor Romney had increased his share of the Hispanic vote by 23 percentage points, from the 27 percent he actually received to 50 percent, then he have won the popular vote. Each percentage point of the Hispanic vote equaled 112,000 votes.4
- If Governor Romney had increased his share of the white vote by three percentage points, from the 59 percent he actually received to 62 percent, then he would have won the popular vote. Each percentage point of the white vote equaled 980,000 votes.
Data Source. The data for this analysis come from the Voting and Registration Supplement of the Current Population Survey (CPS) collected by Census Bureau, which contains about 100,000 adults. The Voting and Registration Supplement is conducted every other year after Election Day in November.5 The public-use file for this data was recently released. The survey asks individuals if they are registered to vote and if they voted. The survey also asks a number of other socio-demographic questions. The above analysis draws on both published figures and an analysis of public-use data of the voting supplement by the Center for Immigration Studies.
Difference with Exit Polls. The Voting and Registration Supplement does not report how people voted, only who was eligible, registered, and voted. In contrast, the national exit poll conducted by Edison Research for major news outlets reports who voted and how they voted.6 In some cases, the vote shares by demographic group from the Voting and Registration Supplement do not exactly match the shares reported in national exit poll. So, for example, CNN reports that the national exit poll showed that 10 percent of the electorate was Hispanic in 2012, while Census data show they were 8.4 percent. It must be remembered that the Census data have a margin of error of 0.3 percentage points so the range for the Hispanic share of voters is 8.1 percent to 8.7 percent — assuming a 90 percent confidence interval.7 Since the exit poll rounds to the nearest whole percentage, the Hispanic share could be 9.5 percent to 10.4 percent in the poll. The exit poll also has a margin of error of one percentage point, assuming a 95 percent confidence interval.8 Thus the range for the exit poll is 8.5 percent to 11.4 percent. Therefore, the 1.6 percentage-point difference between Census data and the national exit poll for the Hispanic share of the vote is not statistically significant.
Results in the Tables. Table 1 at the end of this Backgrounder reports the percentage of eligible voters who cast a ballot on Election Day in the 2004, 2008, and 2012 presidential elections. It also reports the percentage of the electorate each group represented. So for example, the table shows that 66.9 percent of eligible voters who live in owner-occupied housing voted in 2012. Homeowners were also 77.5 percent of all voters in 2012. Table 2 reports the number of eligible voters by demographic group and the number who voted.


Conclusion
The Voting and Registration Supplement collected by the Census Bureau is a valuable data source for examining who was eligible to vote and who actually voted. The voting supplement results, reported in the tables, show the great diversity of the American electorate. The electorate is comprised of numerous overlapping voting blocs. Many factors influence voting decisions, including race, education, income, gender, occupation, marital status, and age. Furthermore, there is ideology, party identification, religion, and voters' perception of a candidates' character that are not included in the Census data, but certainly matter a great deal. It would be a mistake to think of the electorate as one dimensional.
End Notes
1 The Center for Immigration Studies projections of the Hispanic vote for 2012, which were released in August of that year can be found here. The margin of error for their share of the vote is 0.3 percent, so our projection of 8.9 percent and the actual vote of 8.4 percent do overlap.
2 Starting with the 2004 November supplement, voters could choose more than one race. In contrast, the question that identifies Hispanics is separate from the race question, and has remained virtually unchanged over time. Thus the Hispanic share is comparable over time.
3 The popular vote totals were 65,899,660 (51.1 percent) for President Obama and 60,932,152 (47.2 percent) for Governor Romney — a 4,967,508 difference. Slightly less than 2 percent of the electorate chose another candidate. The calculations looking at women, black, Hispanic, and white voters assume the level of support for each candidate by demographic group as shown by the National Exit Poll done by Edison Research for major media outlets and reported by CNN. The results can be found here and here. CNN reports only whole percentage points without decimal places, our calculations reflect this. The population shares for each demographic group are based on the 2012 voting supplement shown in Tables 1 and 2. We subtract one percentage point of support from the president and add one percentage point to Governor Romney's total until the point at which Romney has a larger vote total than Obama. So, for example, each percentage point of the women's vote equaled 714,000. This number multiplied by four equals 2.86 million. Subtract this amount from the president and add it to the governor and the Republican candidate wins a plurality of the popular vote. Thus a four percentage-point shift flips the popular vote. One limitation of this approach is that it uses whole percentages. In the case of women, for example, a shift of 3.5 percentage points rather than four percentage points might have been enough to change the popular vote.
4 The fact that Romney would have had to secure half of the Hispanic vote implies that mathematically, even if there were no Hispanic voters, the president might still have won a plurality of the popular vote. Consider the following: Obama's margin of victory in the popular vote was 4.968 million. The total Hispanic vote as shown in Table 2 was 11.188 million. Assuming the national exit poll is correct, 7.943 million (71 percent) of Hispanics voted for Obama and 3.021 million (27 percent) voted for Romney, the difference (7.943 minus 3.021) is 4.923 million, which is slightly smaller than the president's margin of victory. This means that without the Hispanic vote, the president would still have won a plurality of the popular vote. However, given the small difference between the president's margin of victory and the president's net gain of Hispanic votes, coupled with sampling and non-sampling error in the exit poll and the voting supplement, this conclusion is not certain. Of course it must also be emphasized that the popular vote does not decide elections, which are determined by the distribution of electoral votes.
5 Results and information about the November supplements to the Current Population Survey can be found here.
6 The results for the 2012 exit poll as reported by CNN can be found here.
7 The latest source and accuracy statement for the November voting supplement can be found here.
8 In an email dated May 22, 2013, Joe Lenski, a researcher at Edison Research, was kind enough to advise me that there were 2,500 Hispanics in the national exit poll and the margin of error for their share of the total population was one percentage point. But he also advised me that Edison Research does not report the decimal point for its percentages.
