Steven A. Camarota is the director of research at the Center for Immigration Studies.
Analysis of data from the Current Population Survey (CPS) collected in the first half of 2022 shows that the number and share of new immigrants (legal and illegal together) from the Western Hemisphere, excluding Canada, has increased significantly. Not only is immigration up from Mexico, Central America, the Caribbean, and South America, but immigration from the rest of the world has declined. As a result, 2022 is the first time since 2006 that the CPS shows more than half of new legal and illegal immigrants, also referred to as the foreign-born, came from these regions. Newly arrived immigrants in the CPS include the survey year and the two prior years, so the new numbers include the fall-off in all immigration due to Covid-19, particularly in 2020, as well as the surge of illegal immigration that began in 2021. As more data is released from the Census Bureau, a clearer picture will emerge, but it seems that a significant shift has occurred in the composition of new immigrants.
Among the findings:
- In 2022, 52 percent of all new immigrants (legal and illegal together) were from the Western Hemisphere, excluding Canada, compared to 33 percent of new arrivals in 2014. New arrivals are those who came in 2020, 2021 or the first part of 2022.
- The increase in the share from the Western Hemisphere was partly due to a numerical increase in newcomers from that region relative to the recent past, particularly from countries other than Mexico, but was also caused by a decline in newcomers from the rest of the world.
- The number and share of new immigrants from East Asia has declined significantly. In 2022, only 12 percent of newcomers came from the region, compared to 25 percent in 2014.
- The number and share of new immigrants from the Indian subcontinent also fell, declining from 16 percent of newcomers in 2018 to only 11 percent in 2022.
- The increasing share of immigrants from the Western Hemisphere almost certainly reflects, in part, the surge of illegal immigration since the start of 2021, but also that new legal immigration has returned to pre-Covid levels somewhat more quickly from the Western Hemisphere than it has for the rest of the world.
- Immigrants from the Western Hemisphere tend to be less educated than those from other sending regions. As a result, the increase in new immigration from this part of the world means that the education level of new immigrants overall has fallen somewhat, after steadily increasing for a number of years.
- In 2022, 18 percent of all new immigrants (ages 18 to 64) had not completed high school, compared to 12 percent of new arrivals in 2018. The share of new immigrants with at least a bachelor’s degree fell from 50 percent in 2018 to 44 percent in 2022.
- We do not have an estimate of new illegal immigrants based on the arrival data in the CPS at this time. But it is almost certain that more than half of all immigrants who have arrived since 2020 are illegal immigrants. This includes those encountered at the border and released, those who made it past the border patrol, and visa overstayers.
Introduction
This analysis uses the Current Population Survey (CPS), which is collected each month by the Census Bureau for the Bureau of Labor Statistics (BLS), primarily to measure labor market conditions. The monthly CPS, which is sometimes called the “household survey”, includes some 60,000 households. Beginning in 1994, the survey began to ask questions on citizenship, country of birth, and year of entry into the United States on a regular basis. It is the most up-to-date survey data available designed to be representative of the U.S. population that identifies immigrants. Immigrants in Census Bureau data, whom the government typically refers to as the foreign-born, include all persons who were not U.S. citizens at birth — naturalized citizens, lawful permanent residents, temporary visitors, and illegal immigrants.
To obtain more statistically robust estimates of newcomers, we average the monthly Current Population Survey for the first six months of 2022. The data shows that immigrants from the Western Hemisphere except Canada — Mexico, Central America, the Caribbean, and South America — accounted for more than half of newly arrived legal and illegal immigrants. Throughout this report we use the terms “Western Hemisphere”, “Latin America”, and “the Americas” interchangeably.
Later this month, the Census Bureau will begin to release data from the 2021 American Community Survey (ACS). While a much larger survey than the CPS, the ACS data will only reflect conditions through July 2021, so it will not reflect most of the surge of illegal immigration that took place at the southern border beginning in 2021. In contrast, the CPS does reflect conditions through the first part of 2022. However, the government codes responses in the public-use CPS to the year of entry question into multi-year cohorts. In even-numbered years, like 2022, recent arrivals are those who came in the two years prior to survey, plus the year the data was collected.1 This means that in the 2022 data, new arrivals came in 2020, 2021, and the first part of 2022. In the CPS from 2020, new arrivals came in 2018 to 2020; in 2018, newcomers arrived in 2016 to 2018, and so on.
Findings
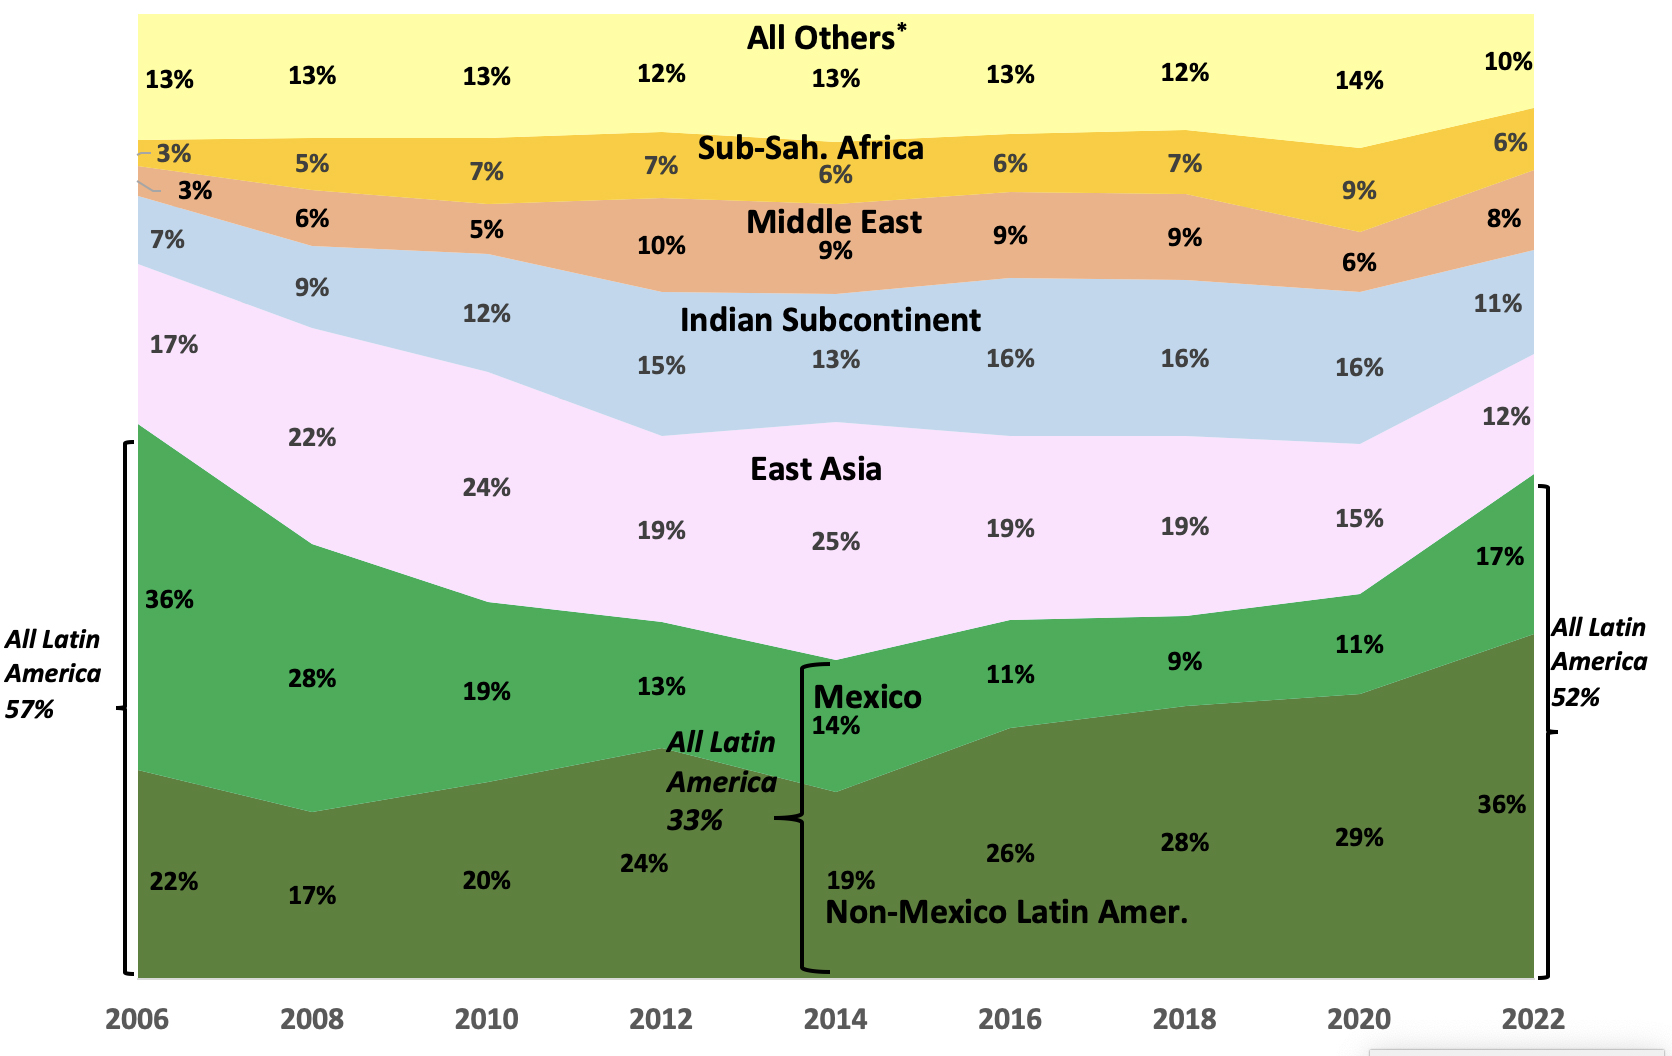
An Increasing Share from the Western Hemisphere. Figure 1 reports the share of recent immigrants from different regions of the world using the CPS.2 It shows that, in 2022, 52 percent of all new immigrants (legal and illegal together) were from the Western Hemisphere, excluding Canada, compared to 33 percent of new arrivals in 2014. After declining from the early 2000s, the increase in the share of new immigration from Latin America represents a significant rebound. The big increase is in the share of newcomers from non-Mexican Western Hemisphere countries. However, Mexico, which declined significantly as a share of newcomers after 2006, has also increased to some extent in the newest data, from 9 percent of new arrivals in 2018 to 17 percent in 2022. Their share of new immigrants in 2022 is the highest percentage from Mexico since 2010, though the current share is still well below the level in the early 2000s. Prior research as well as border encounter figures all show that immigrants from Latin America make up most, but by no means all, of the illegal immigrant population.3 The increasing share of new arrivals from the region reflects, at least in part, the surge of illegal immigration on the southern border. Also, as we discuss below, legal immigration from Latin America seems to have returned more quickly to pre-Covid levels in 2021 and 2022 than legal immigration from the rest of the world and this, too, helps explain the results in Figure 1.
Figure 1. The share of newly arrived immigrants (legal and illegal together) who are from Latin America has rebounded after having hit a low about a decade ago.(New arrivals have lived in the U.S. for less than three years.) |
 |
|
Source: January through June public-use files of the Current Population Survey in even-numbered years, 2006 to 2022. * Includes Canada, Australia, New Zealand, Oceania, Europe, and all other countries not specified in the data. See end note 2 for countries in each region. |
It should be noted that Figure 1 is only the population shares for new legal and illegal immigrants; it does not reflect the total stock of legal and illegal immigrants in the United States. The population shares by region in the overall population of immigrants living in the country shift much more slowly compared to fluctuations in new arrivals because new arrivals are only a modest share of the total immigrant population.
A Decline from East and South Asia. In contrast to the Western Hemisphere, East Asian immigrants declined substantially as a share of newcomers, from one-quarter of new arrivals in 2014 to just 12 percent in 2022. Immigrants from the Indian subcontinent, which is also sometimes referred to as “South Asia”, were 16 percent of new arrivals as recently as 2020, but only 11 percent in 2022. Administrative data shows that the number of new lawful permanent residents (LPRs) arriving from abroad declined significantly due to the Covid-19 pandemic in 2020 from every region of the world. A relatively larger share of newcomers from East and South Asia are legal immigrants compared to Latin American newcomers. Thus, the decline in legal immigration due to the pandemic and the increase in illegal immigration in the period covered by this analysis is part of the reason that immigration overall (legal and illegal) from regions other than Latin America fell while the number coming from the Americas did not decline in the same way.
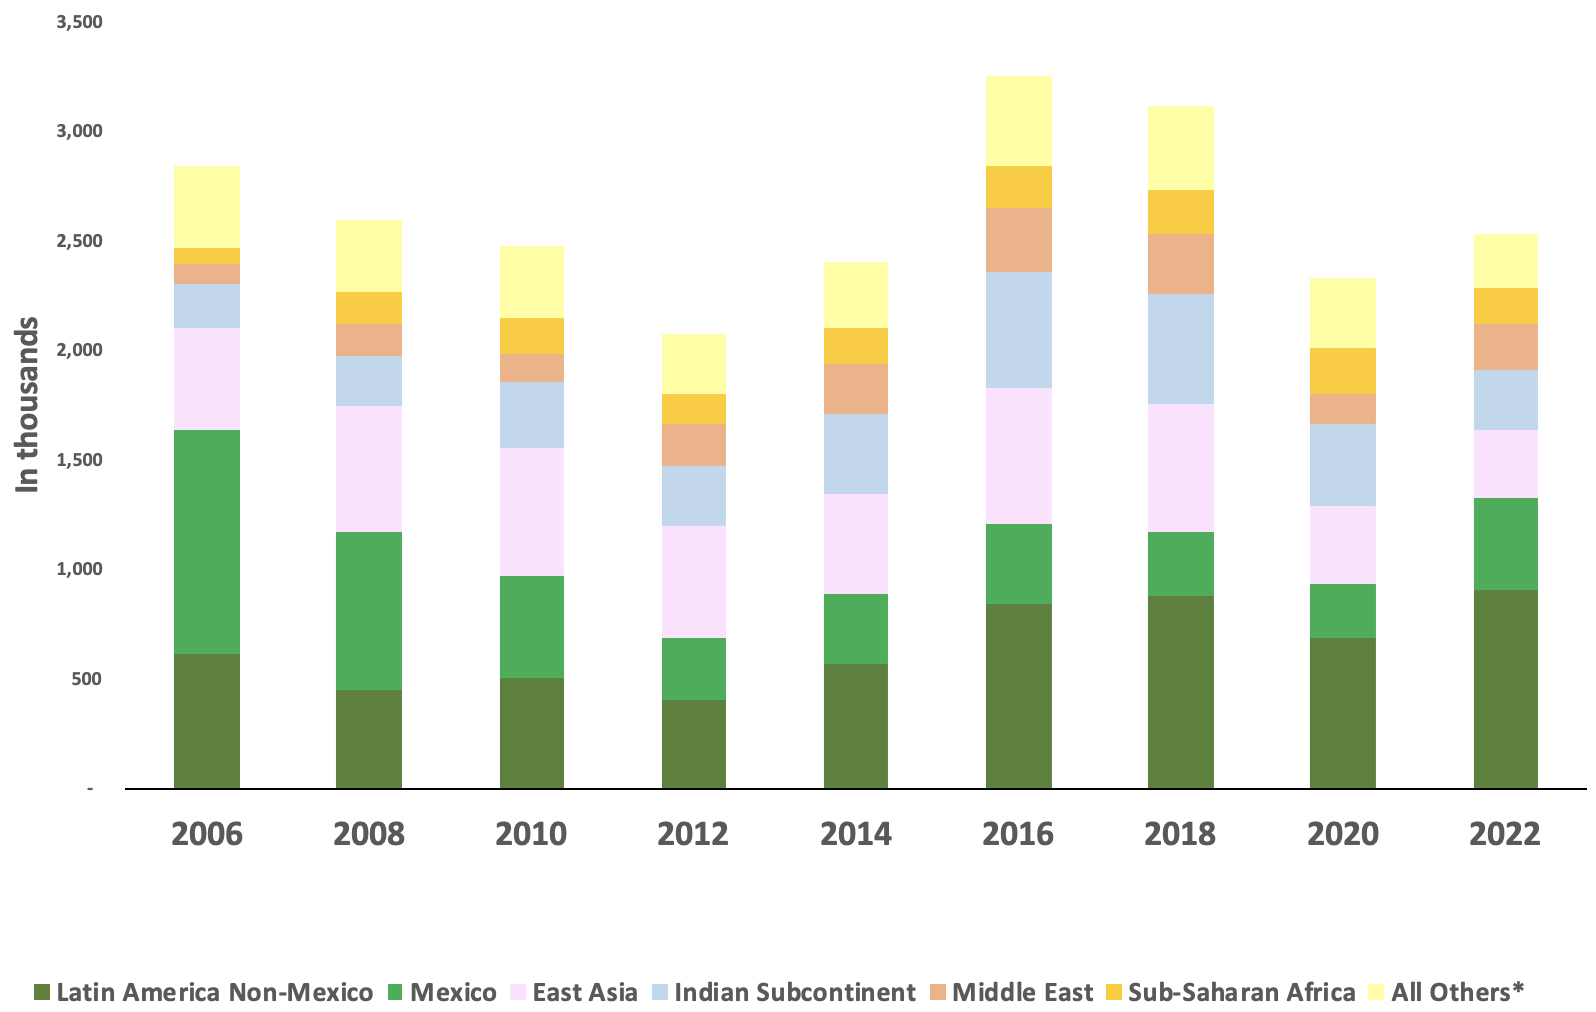
Numerical Change. Figure 2 shows that the number of new arrivals was down from almost every part of the world other than Latin America in both 2020 and 2022 after peaking in 2016. As we have argued in prior reports, the fall-off in 2018-2019, which is reflected in the 2020 new arrival numbers, can be attributed in part to policy changes and perhaps the rhetoric of the Trump administration. As we have also discussed, the economy was strong during the first three years of the Trump administration, so the fall-off in immigration during this time was not due to an economic deterioration.4
Figure 2. Number of Newly Arrived Immigrants (Legal and Illegal Together) by Sending Region(New arrivals have lived in the U.S. for less than three years.) |
 |
|
Source: January through June public-use files of the Current Population Survey. * Includes Canada, Australia, New Zealand, Oceania, Europe, and all other countries not specified in the data. See end note 2 for countries in each region. |
We know there was a dramatic decline in new legal permanent immigration from all regions of the world in 2020 due to Covid-19. But since 2020, the number of new permanent legal immigrants arriving from abroad from Latin America has returned somewhat more quickly to pre-Covid levels than it has for the rest of the world. In calendar year 2020, 114,000 new lawful permanent residents arrived in the United States from countries outside of Latin America — equal to only 39 percent of the 2019 level. In calendar year 2021 the number of new non-Latin American LPRs bounced back some to 184,000, though this was still only equal to 63 percent of the 2019 number. For Latin America, the number of new LPRs arriving in the country in calendar year 2020 was 60,000, which was 36 percent of the 2019 number, but in 2021 it bounced back to 132,000, or 79 percent of the 2019 level. Moreover, in the first quarter of calendar year 2022 the number of newly arrived LPRs from Latin America equaled the number in the first quarter of 2019, but for non-Latin-American countries it was still only 80 percent of what it was in the same quarter of 2019.5,6 Overall, the data shows that, at least for new LPRs arriving from abroad, Latin America returned to pre-pandemic levels more quickly than new arrivals from the rest of the world. This helps explain some of the results we see in Figures 1 and 2.
Turning to illegal immigration, we can say that there was a decline in the number of families and unaccompanied children encountered at the border in 2020, and then a dramatic rebound in the numbers, to near-record levels, in 2021 and 2022.7 Although border encounters are a very imperfect proxy for new illegal immigration, the increase in 2021 and 2022 can be taken as a clear indication that new illegal immigration increased substantially. As already discussed, prior research by the government and outside organizations, as well as apprehensions data, all indicate illegal immigrants are disproportionately from Latin America. This fact, coupled with the more rapid recovery of legal immigration from the Americas in 2021 and the beginning of 2022, explains why arrivals from this region have increased numerically and as a share of all new immigrants.
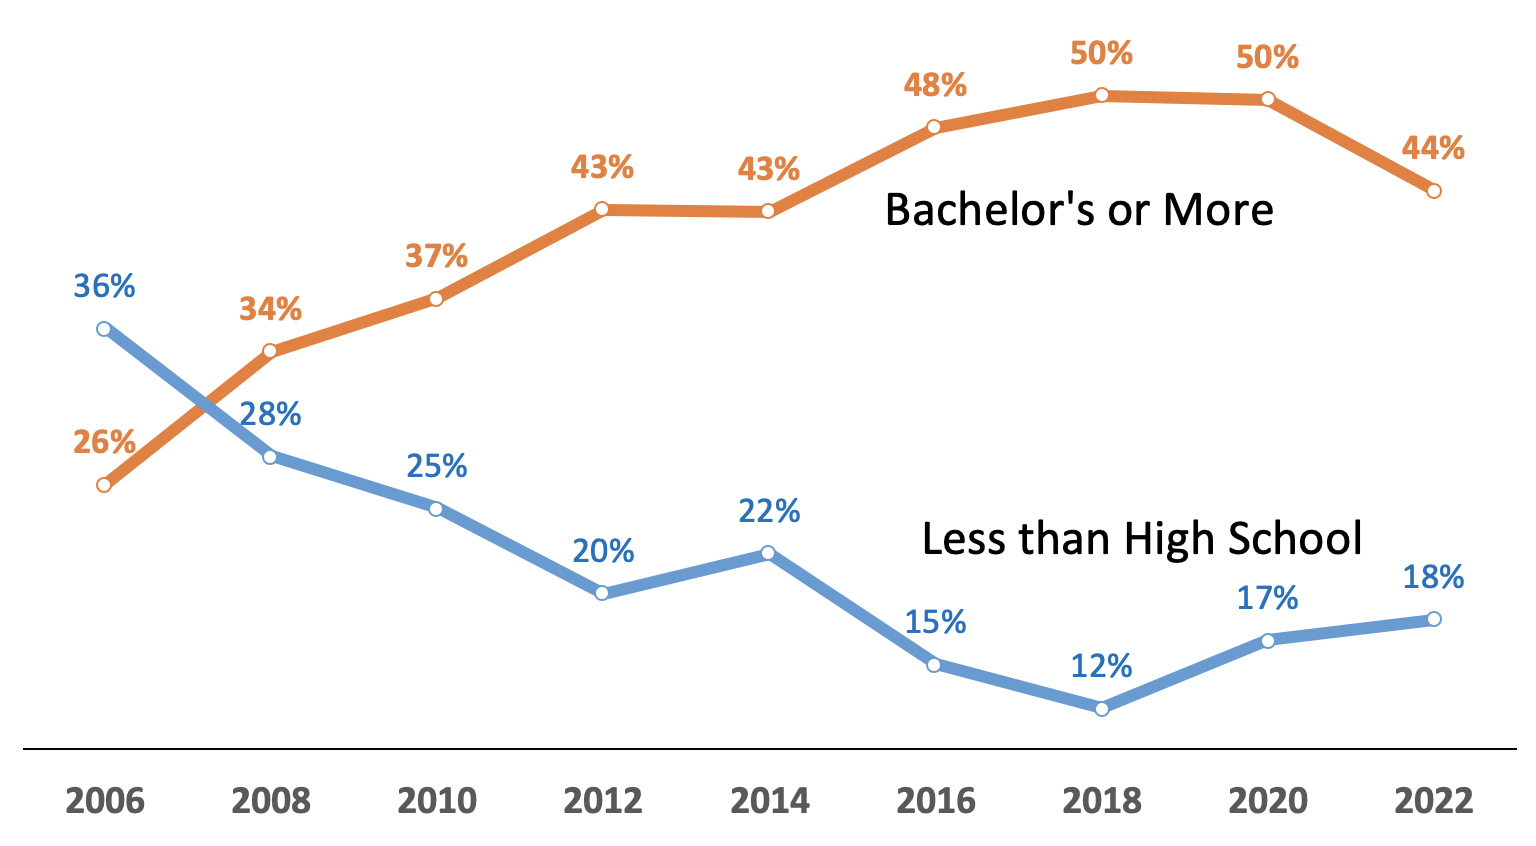
Impact on Educational Attainment. It has long been known that the education level of immigrants at arrival has a very large impact on their future socio-economic status in the United States. Immigrants from the Americas tend to be the least educated of any major sending region. Figure 3 shows that, after increasing for a number of years, the share of recently arrived immigrants with a college degree was lower in the 2022 data than in prior years and the share who have not completed high school is higher. Table 1 does not show any clear evidence that, within sending regions, new immigrants are becoming less educated, with the possible exception of some decline among newcomers from Central America. That is, new arrivals from each region are about as educated in 2022 as new arrivals in 2020 or 2018. Rather, the increasing share of all newcomers who hail from Latin America is what seems to be driving the change in overall percentages shown in Figure 3.
Figure 3. After improving for more than a decade, the educational level of new immigrants (18-64) declined in more recent data.(New arrivals have lived in the U.S. for less than three years.) |
 |
|
Source: January through June public-use files of the Current Population Survey. |
The CPS vs. the American Community Survey (ACS). Immigration researchers often rely on the much larger annual American Community Survey (ACS). But we use the CPS because the Census Bureau reported significant problems with the ACS in 2020 and when the 2021 ACS data is released later this year it still will only cover the period through July 2021 and therefore will not reflect most of the ongoing surge of illegal immigrants at the southern border. For these reasons, we rely on the monthly CPS, which the BLS reports did produce reliable estimates even during the pandemic. Because the CPS is a smaller survey, we average six months of CPS data for each year to arrive at more statistically robust estimates. However, given its much smaller sample size, there is more error and fluctuation in the CPS arrival figures than those from the ACS. The results from the CPS should be interpreted in light of this variability. That said, it is worth noting that the CPS does show a marked increase in both new Afghan and Venezuelan immigration in the 2022 data, which is entirely consistent with anecdotal evidence and the increase in economic, social, and political turmoil in those countries causing an increase in out-migration. This gives us some confidence that the CPS is able to pick up changes in population shares by sending regions.
Of large government surveys that include questions on citizenship and year of entry into the country, only the CPS monthly data from 2022 will reflect the ongoing surge of illegal immigration at the border at this time.8 Table 2 shows that the monthly CPS and annual ACS produced similar results for the share of new immigrants from each region, though of course there is sampling variability between the two surveys, as well as differences due to the way the two are collected.9 The Census Bureau provides a detailed summary of all of these differences.10 The bottom of Table 2 shows that the CPS generally produces a smaller total number of new arrivals overall than the ACS in almost every even-numbered year from 2006 to 2018.11 It is not entirely clear why the CPS should show a smaller total number of new arrivals, while at the same time the population shares by region are similar. This is certainly an area in need of further inquiry.
Illegal Immigration in the CPS. The Census Bureau and the Bureau of Labor Statistics both acknowledge that illegal immigrants are included in the CPS. Based on an analysis done in March of this year and our preliminary estimates for April, we estimate that the illegal population increased by 1.35 million between January 2021 and April 2022. We can say that 1.35 million equals 53 percent of the 2.54 million new arrivals (2020-2022) in the monthly CPS from the first half of 2022 we use in this study. It is also the case that for the illegal population to increase by 1.35 million, more than 1.35 million new illegal immigrants had to arrive over this time period because new arrivals are offset by deportations, voluntary return migration, legalizations, and natural mortality among the existing illegal population. Our best guess is that something like two million new illegal immigrants arrived in 2020, 2021, and the first part of 2022.12,13 (This includes the low level of illegal immigration in 2020.) But we are not very certain of this estimate.
Conclusion
Analysis of government data from the first part of 2022 shows that Latin America has constituted a growing share of all new immigrants (legal and illegal) who arrived in the United States since 2020. Immigration from this part of the world increased from one-third of all new immigrants in 2014 to more than half in 2022. The increase was due in part to an increase in the absolute number of new arrivals from Western Hemisphere countries relative to all newcomers since 2020 and a decline from other sending regions. The resurgence of immigration from the Western Hemisphere likely reflects, at least in part, the increase in illegal immigration in 2021 and 2022 characterized by the ongoing surge at the southern border. It is unknown if this trend will continue. But it seems likely that as long as illegal immigration remains at record levels, Western Hemisphere countries will comprise a larger share of all new immigrants (legal and illegal) than was the case a decade ago.
Our findings show that because immigrants from the Western Hemisphere tend to be less-educated than those from other sending regions, their increasing share of new immigrants means that the overall education level of newcomers has fallen somewhat, after steadily increasing for a number of years. The growing share of immigrants who are illegally in the country and the fall-off in educational attainment among new arrivals likely has important implications for the future assimilation and integration of these immigrants into American society.
End Notes
1 In odd-numbered years, the most recent entering cohorts are the three years prior to the survey plus the survey year.
2 We define regions in the following matter: East Asia: China, Japan, Korea, Mongolia, Cambodia, Indonesia, Laos, Malaysia, Philippines, Singapore, Thailand, Vietnam, Burma, Asia NEC/NS (Not elsewhere classified or not specified); Indian Subcontinent: India, Bangladesh, Bhutan, Pakistan, Sri Lanka, Nepal; Middle East: Afghanistan, Iran, Iraq, Israel, Palestine, Jordan, Lebanon, Saudi Arabia, Syria, Turkey, Kuwait, Yemen, United Arab Emirates, Azerbaijan, Uzbekistan, Kazakhstan, Northern Africa, Egypt/United Arab Rep., Morocco, Algeria, Sudan, Libya, and Middle East NS; Sub-Saharan Africa: Ghana, Nigeria, Cameroon, Cape Verde, Liberia, Senegal, Sierra Leone, Guinea, Ivory Coast, Togo, Eritrea, Ethiopia, Kenya, Somalia, Tanzania, Uganda, Zimbabwe, South Africa (Union of), Zaire, Congo, Zambia, and Africa NS/NEC. Unless otherwise specified, “All Others” includes the following: Europe: Denmark, Finland, Iceland, Norway, Sweden, United Kingdom, Ireland, Belgium, France, Netherlands, Switzerland, Greece, Italy, Portugal, Azores, Spain, Austria, Czechoslovakia, Slovakia, Czech Republic, Germany, Hungary, Poland, Romania, Bulgaria, Albania, Yugoslavia, Bosnia and Herzegovina, Croatia, Macedonia, Serbia, Kosovo, Montenegro, Estonia, Latvia, Lithuania, Other USSR/Russia, Ukraine, Belarus, Moldova, USSR NS, Cyprus, Armenia, Georgia, and Europe NS. Australia/Oceania/Elsewhere: Australia, New Zealand, Pacific Islands, Fiji, Tonga, Samoa, Marshall Islands, Micronesia, Other, NEC, North America NS, Canada, Americas NS/NEC and unknown. Western Hemisphere/Latin America: (except Canada) includes: Mexico; Central America: Belize/British Honduras, Costa Rica, El Salvador, Guatemala, Honduras, Nicaragua, Panama, Central America NS.; Caribbean: Cuba, Dominican Republic, Haiti, Jamaica, Bahamas, Barbados, Dominica, Grenada, Trinidad and Tobago, Antigua and Barbuda, St. Kitts-Nevis, St. Lucia, St. Vincent and the Grenadines, and the Caribbean NS; South America: Argentina, Bolivia, Brazil, Chile, Colombia, Ecuador, Guyana/British Guiana, Peru, Uruguay, Venezuela, Paraguay, and South America NS.
3 The Pew Research Center estimates that 77 percent of illegal immigrants are from Latin America. The most recent estimates from DHS and the Center for Migration Studies do not have detailed regional breakdowns, but based on the top illegal sending countries they do report, both of their estimates show that at least two-thirds of illegal immigrants are from Latin America. In FY 2020 through July 2022, slightly more than 70 percent of all border encounters were with nationals from just Mexico, El Salvador, Honduras, and Guatemala. When the other countries which CBP reports are included (Brazil, Colombia, Cuba, Ecuador, Haiti, Nicaragua, and Venezuela), the Western Hemisphere accounts for about 95 percent of border encounters over this time period.
4 See Steven A. Camarota, “There Really Has Been a ‘Trump Effect’ on Immigration: And some American workers seem to have benefited”, National Review, October 28, 2020; and Steven A. Camarota and Karen Zeigler, “Immigrant Population Growth Slows: ‘Trump Effect’ likely explains slowdown”, Center for Immigration Studies, October 22, 2020.
5 DHS reports here and here figures for new LPRs for FY 2019 through 2022, including new arrivals vs. those who adjusted status from within the United States. New LPRs are permanently settling in the country from abroad and a large share are joining family members already well-established in the country. This makes them more likely to show up in Census Bureau surveys than long-term temporary visitors such as guestworkers, foreign students, or new illegal immigrants.
6 East and South Asian legal immigration follows the same general pattern as new legal immigration from the rest of the world. In calendar year 2020, 76,000 new LPRs arrived from all of the Asian continent, just 40 percent of the 2019 level. (DHS groups arrivals by continent and not by the regions we use in this report.) The number of newly arrived LPRs from all of Asia recovered some in 2021 to 117,000, but this was still only 61 percent of what it was in 2019. In the first quarter of calendar year 2022, 30,000 new LPRs came from Asia, still 24 percent below what it was in the same quarter in 2019 before Covid-19.
7 Border encounter data (accessed on August 26, 2022) shows that, in FY 2020, 71,000 individuals in family units were encountered at the border, as were 33,000 unaccompanied minors, but in 2021 those numbers jumped to 480,000 and 147,000, respectively. In FY 2022 through July, the number of people in family units and the number of unaccompanied minors already nearly matched those for all of 2021, with two months remaining in the current fiscal year. The vast majority of these individuals are released into the United States to join the existing illegal immigrant population. The situation for single adults is more complex. The number of single individuals encountered at the southern border increased dramatically, from 353,000 in FY 2020 to 1.1 million in FY 2021, and to 1.4 million in the first 10 months of FY 2022. However, data for individual adults is much more difficult to interpret because in many cases it is the same person trying to enter again and again after having been returned to Mexico. This is especially true after April 2020 because under Title 42 (a Covid-19-related public health measure) many single adults from countries other than Mexico were returned to that country along with Mexican nationals. Nonetheless, all the information we have indicates that the number of new illegal adult border-crossers increased significantly.
8 In addition to the ACS and monthly CPS, there is the Annual Social and Economic Supplement of the Current Population Survey (ASEC CPS), which is collected in March; it includes more questions than the monthly CPS used here and over-samples minorities. That supplemental information is supposed to be released mid-September 2022. The CPS data with the supplemental information generally shows a somewhat larger foreign-born population in March than the monthly CPS shows without the supplement. But overall, the arrival data from the ASEC CPS should be very similar to the March monthly data or even the average of the arrival data from January to June.
9 One of the biggest differences is the sample size of the two surveys. In 2018, before Covid-19, the unweighted sample size for new arrivals (arrived 2016-2018) using the January to June CPS was 6,151. In comparison, the sample size of new arrivals (2016-2018) in the 2018 ACS was 31,108 (or 26,093 using only one-third of those who specifically arrived in 2018). In 2020, the unweighted sample size for new arrivals (2018-2020) using the January to June CPS was 3,693; and the ACS sample for new arrivals (2018-2020) was 20,224 (or 18,253 using only one-third of those who specifically arrived in 2020).
10 The Census Bureau discussion of the differences in the two surveys is focused on the ACS relative to the Annual Social and Economic Supplement to the CPS collected in March each year. While there are some differences, the same information generally applies to the monthly CPS as to the CPS with the annual supplement. One of the biggest differences between the CPS and the ACS is that the CPS uses “usual residents” to determine who is part of a household, which is supposed to be the place where the respondent “lives and sleeps most of the time”. In contrast, the ACS uses a two-month rule for inclusion in a household, which means that a respondent should have lived at the address for at least two months.
11 The total number of new arrivals in even-numbered years (January to June averaged) from the CPS is shown at the bottom of Table 2, along with new arrivals from the ACS. Since the ACS reflects the population in July of each year and our new arrival numbers from the CPS reflect an average of the first six months of the year, we adjust the ACS to roughly match the CPS in terms of the time period covered for new arrivals. Unlike the CPS, which groups responses to the year of entry question into multi-year cohorts, the ACS public-use files report individual years of arrival. We define new arrivals in the ACS to include the two years prior to the survey year and combine it with one-third of those who said they came in the year of the survey. This should produce roughly comparable arrival figures. For the total size of the foreign-born population in even numbered years shown in Table 2, we use the monthly CPS (June, July, and August) since, again, the ACS represents the population at mid-year.
12 Court filings indicate that the Biden administration released 1.129 million illegal immigrants into the country who were encountered at the southern border in the last year. These figures do not include “got-aways” — those estimated to have been missed by the Border Patrol. Some media reports indicate that got-aways may total 900,000 so far during the Biden administration. These numbers suggest that the arrival of two million new illegal aliens is certainly a plausible estimate.
13 One way to think about the possible number of illegal immigrants who arrived from abroad in the time period of this analysis is to “remove” from the data legal immigrants who might be picked up by the CPS. This approach of estimating the possible number of illegal immigrants in Census Bureau data by first removing new lawful permanent residents (LPRs), refugees, and long-term temporary visitors (nonimmigrants) from the data is a common method in immigration research. Those who are not legal immigrants — the “residual” or those left over in the data — constitute the illegal population. However, we do not know of any research that attempts to measure the undercount of new LPRs, nonimmigrants, and refugees among new arrivals in the CPS. Such an estimate is important so we can subtract these legal arrivals from the total number of arrivals in the survey data in order to estimate new illegal arrivals. The lack of such research introduces a lot of uncertainty into our estimate of new illegal immigration.
DHS reports here and here indicate that 587,000 new LPRs entered the country between January 2020 and March 2022. (This figure excludes adjustments of status over this time period). The Refugee Processing Center indicates that 29,000 refugees entered between January 2020 and March 2022. If we make the reasonable assumption that 10 percent of new LPRs and refugees are missed by the CPS, it would leave a total of 554,000 of these new immigrants who might be among the newly arrived in the 2022 CPS (January to June files). We also estimate there were 236,000 student visa holders among new arrivals in the CPS, while State Department data shows 533,000 student visas were issued 2020 to 2022, indicating a ratio of 2.2597 visas issued for each student who shows up among new arrivals in the CPS. (The seemingly high undercount of foreign student visa holders missed in the CPS may not simply be due to those missed by the survey. Some students may not have yet entered the U.S. even though they received a visa, while others may have dropped out of school and gone home over this time period. Equally important, the CPS stopped surveying dorms in 2018. Of course, many foreign students live off campus and are still in the survey.) In addition to foreign students, there were 891,000 other long-term, nonimmigrant visas (including dependents of students) issued by the State Department between January 2020 and March 2022 who might be captured in the new arrival data from the CPS — mainly E, G, H, J, K, L, O, and T visas. (This figure reflects the assumption that only half of J1 and J2 visas issued in FY 2020 and FY 2021 are still present, along with all those issued in FY 2022).
If we assume that the same ratio of new long-term, temporary visa holders who are not students are captured in CPS arrival data as for foreign students, then 410,000 nonimmigrants who are not foreign students might be in the CPS. Adding new LPRs, refugees, students, and all other nonimmigrants totals 1.2 million new legal arrivals that might be in the CPS. Subtracting this total from the 2.54 million new arrivals (legal and illegal) shown in the CPS at the bottom of Table 2 leaves 1.33 million possible illegal immigrants among newcomers in the CPS. We would need to further adjust this number upward by some amount to account for illegal immigrants missed by the survey, but there is no research of which we are aware specifically on the undercount of illegal immigrants among new arrivals in the monthly CPS. If we assume an undercount of 25 percent, then the total number of new illegal immigrants would be roughly two million, with the overwhelming majority having come in 2021 and the first part of 2022, since as best we can tell new illegal immigration was quite low in 2020. While this number is plausible, especially in light of the number of border encounters and the number released into the country, the lack of specific research on the undercount of new permanent residents, refugees, nonimmigrant visa holders, and illegal immigrants among new arrivals in the monthly CPS makes this estimate only an educated guess.