Download a PDF of this Backgrounder.
Steven A Camarota is the director of research and Karen Zeigler is a demographer at the Center.
Under current policy all persons — not just citizens — are included in the population count when apportioning seats to states in the U.S. House of Representatives and for votes in the Electoral College, which is based on House seats. Although we focus on the next census in 2020, the impact of immigration has been building for decades as the number of people settling in the country has increased dramatically. This report examines the cumulative impact of immigration, both legal and illegal, on the apportionment of House seats; this is not an analysis of the impact of immigration only since the previous census. Apportionment is a zero-sum system; by adding more population to some states rather than others, immigration will continue to significantly redistribute political power in Washington.
Among the findings:
- The 2020 census will show that the presence of all immigrants (naturalized citizens, legal residents, and illegal aliens) and their U.S.-born minor children is responsible for a shift of 26 House seats. This is the cumulative impact of immigration, not the change from the previous census.
- To put this number in perspective, changing the party of 21 members of the current Congress would flip the majority in the U.S. House. The 26 seats represent the effect of all immigrants and their children 17 years of age and younger, and is not the change from one census to another.
- Ohio will have three fewer seats in 2020 than it otherwise would have had but for the presence of all immigrants and their minor children in other states. Michigan and Pennsylvania will have two fewer; and Alabama, Arkansas, Georgia, Idaho, Indiana, Iowa, Kentucky, Louisiana, Minnesota, Mississippi, Missouri, North Carolina, Oklahoma, Rhode Island, South Carolina, Tennessee, Utah, West Virginia, and Wisconsin will each have one fewer seat. California will have 11 more seats in 2020 than it otherwise would have; New York and Texas will have four more seats each; Florida will have three more seats; New Jersey will have two more seats; and Illinois and Massachusetts will each have one additional seat.
- Of the 26 seats that will be lost, 24 are from states that voted for Donald Trump in 2016. Of states that will gain House seats because of immigration, 19 seats will go to the solidly Democratic states of California, New York, New Jersey, Massachusetts, and Illinois. Texas is the only solidly Republican state that gains, while Florida is a swing state.
- Doing the same calculation, but counting only immigrants themselves (naturalized citizens, legal permanent residents, guestworkers, foreign students and illegal aliens), but not their U.S.-born minor children, will redistribute 18 seats in the House in 2020. Ohio will have two fewer seats than it otherwise would have had but for the presence of immigrants in other states. Alabama, Georgia, Idaho, Iowa, Indiana, Kentucky, Louisiana, Michigan, Minnesota, Missouri, North Carolina, Oklahoma, Pennsylvania, Tennessee, Utah, and West Virginia will each have one fewer seat. California will have seven more seats in 2020 than it otherwise would. New York and Florida will have three more each; Texas and New Jersey will have two more seats; and Illinois will have one more seat.
- Looking at non-citizens and their U.S.-born minor children redistributes 10 seats, with Ohio, Michigan, Alabama, Idaho, Minnesota, Missouri, West Virginia, Tennessee, Pennsylvania, and Rhode Island each having one fewer seat. California will have four more seats than it otherwise would have; Texas will have three more seats; and New York, Florida, and New Jersey will have one additional seat each.
- Looking at only non-citizens (legal residents and illegal immigrants) redistributes eight seats, with Ohio, Michigan, Missouri, Minnesota, Alabama, Idaho, West Virginia, and Rhode Island each having one fewer seat in 2020 due to the presence of non-citizens in other states. California will have three additional seats; Texas will have two more seats; and Florida, New Jersey, and New York will each have one more seat.
- Illegal immigrants and their U.S.-born minor children will redistribute five seats in 2020, with Ohio, Michigan, Alabama, Minnesota, and West Virginia each losing one seat in 2020 that they otherwise would have had. California and Texas will each have two additional seats, and New York will have one additional seat.
- Illegal immigrants alone in the 2020 census will redistribute three seats, with Ohio, Alabama, and Minnesota each having one fewer seat than they otherwise would have had, while California, New York, and Texas will have one additional seat.
Introduction
Article 1, Section 2 of the U.S. Constitution requires that a census be taken every 10 years for the purpose of apportioning seats in the House of Representatives. Each state is assigned the one seat it is required to receive, and the remaining 385 seats are allocated based on each state's share of the total U.S. population, excluding the District of Columbia. (Congress capped the number of House members at 435 in 1911.) Immigrants, referred to as the "foreign-born" by the Census Bureau, include naturalized citizens, as well as non-citizens such as green card holders, foreign students, and guestworkers. It also includes illegal immigrants counted in the decennial census. Immigrants also have U.S.-born children. The presence of all of these individuals has a significant impact on the distributions of seats in the House of Representatives and votes in the Electoral College. This report examines that redistribution.
We focus on 2020 and report how the number of seats in each state changes with and without including immigrants and/or their U.S.-born minor children. While there is an absolute consensus that all U.S. citizens should be counted and included in the apportionment population, opinions vary as to whether non-citizens in general or illegal immigrants in particular should be counted when apportioning seats. This report does not explore the question of which populations should or should not be included when seats are apportioned, nor do we take a position on whether the children of illegal immigrants should be automatically granted citizenship. This analysis simply informs the immigration debate by reporting the impact of immigration on the distribution of House seats.
Our findings indicate that, over time, immigration profoundly redistributes political power at the federal level by changing the apportionment of House seats and votes in the Electoral College. Immigration laws were changed significantly in 1965, spurring a new "Great Wave" of immigration as the number of immigrants grew roughly four-and-a-half fold between 1965 and 2019.1 Of all immigrants living in the United States today, 97 percent arrived after 1965. In effect, this analysis measures the impact of post-1965 immigration on the distribution of political power in Washington.2
The methods section of this report explains in detail how we estimate the impact of immigration on apportionment. In sum, we first project the population of the 50 states for 2020. We then calculate the apportionment of House seats based on these populations for 2020. We then use this as a baseline to compare what the apportionment of house seats would be without immigrants, non-citizens, or other populations of interest. The difference represents the impact of immigration.
Findings
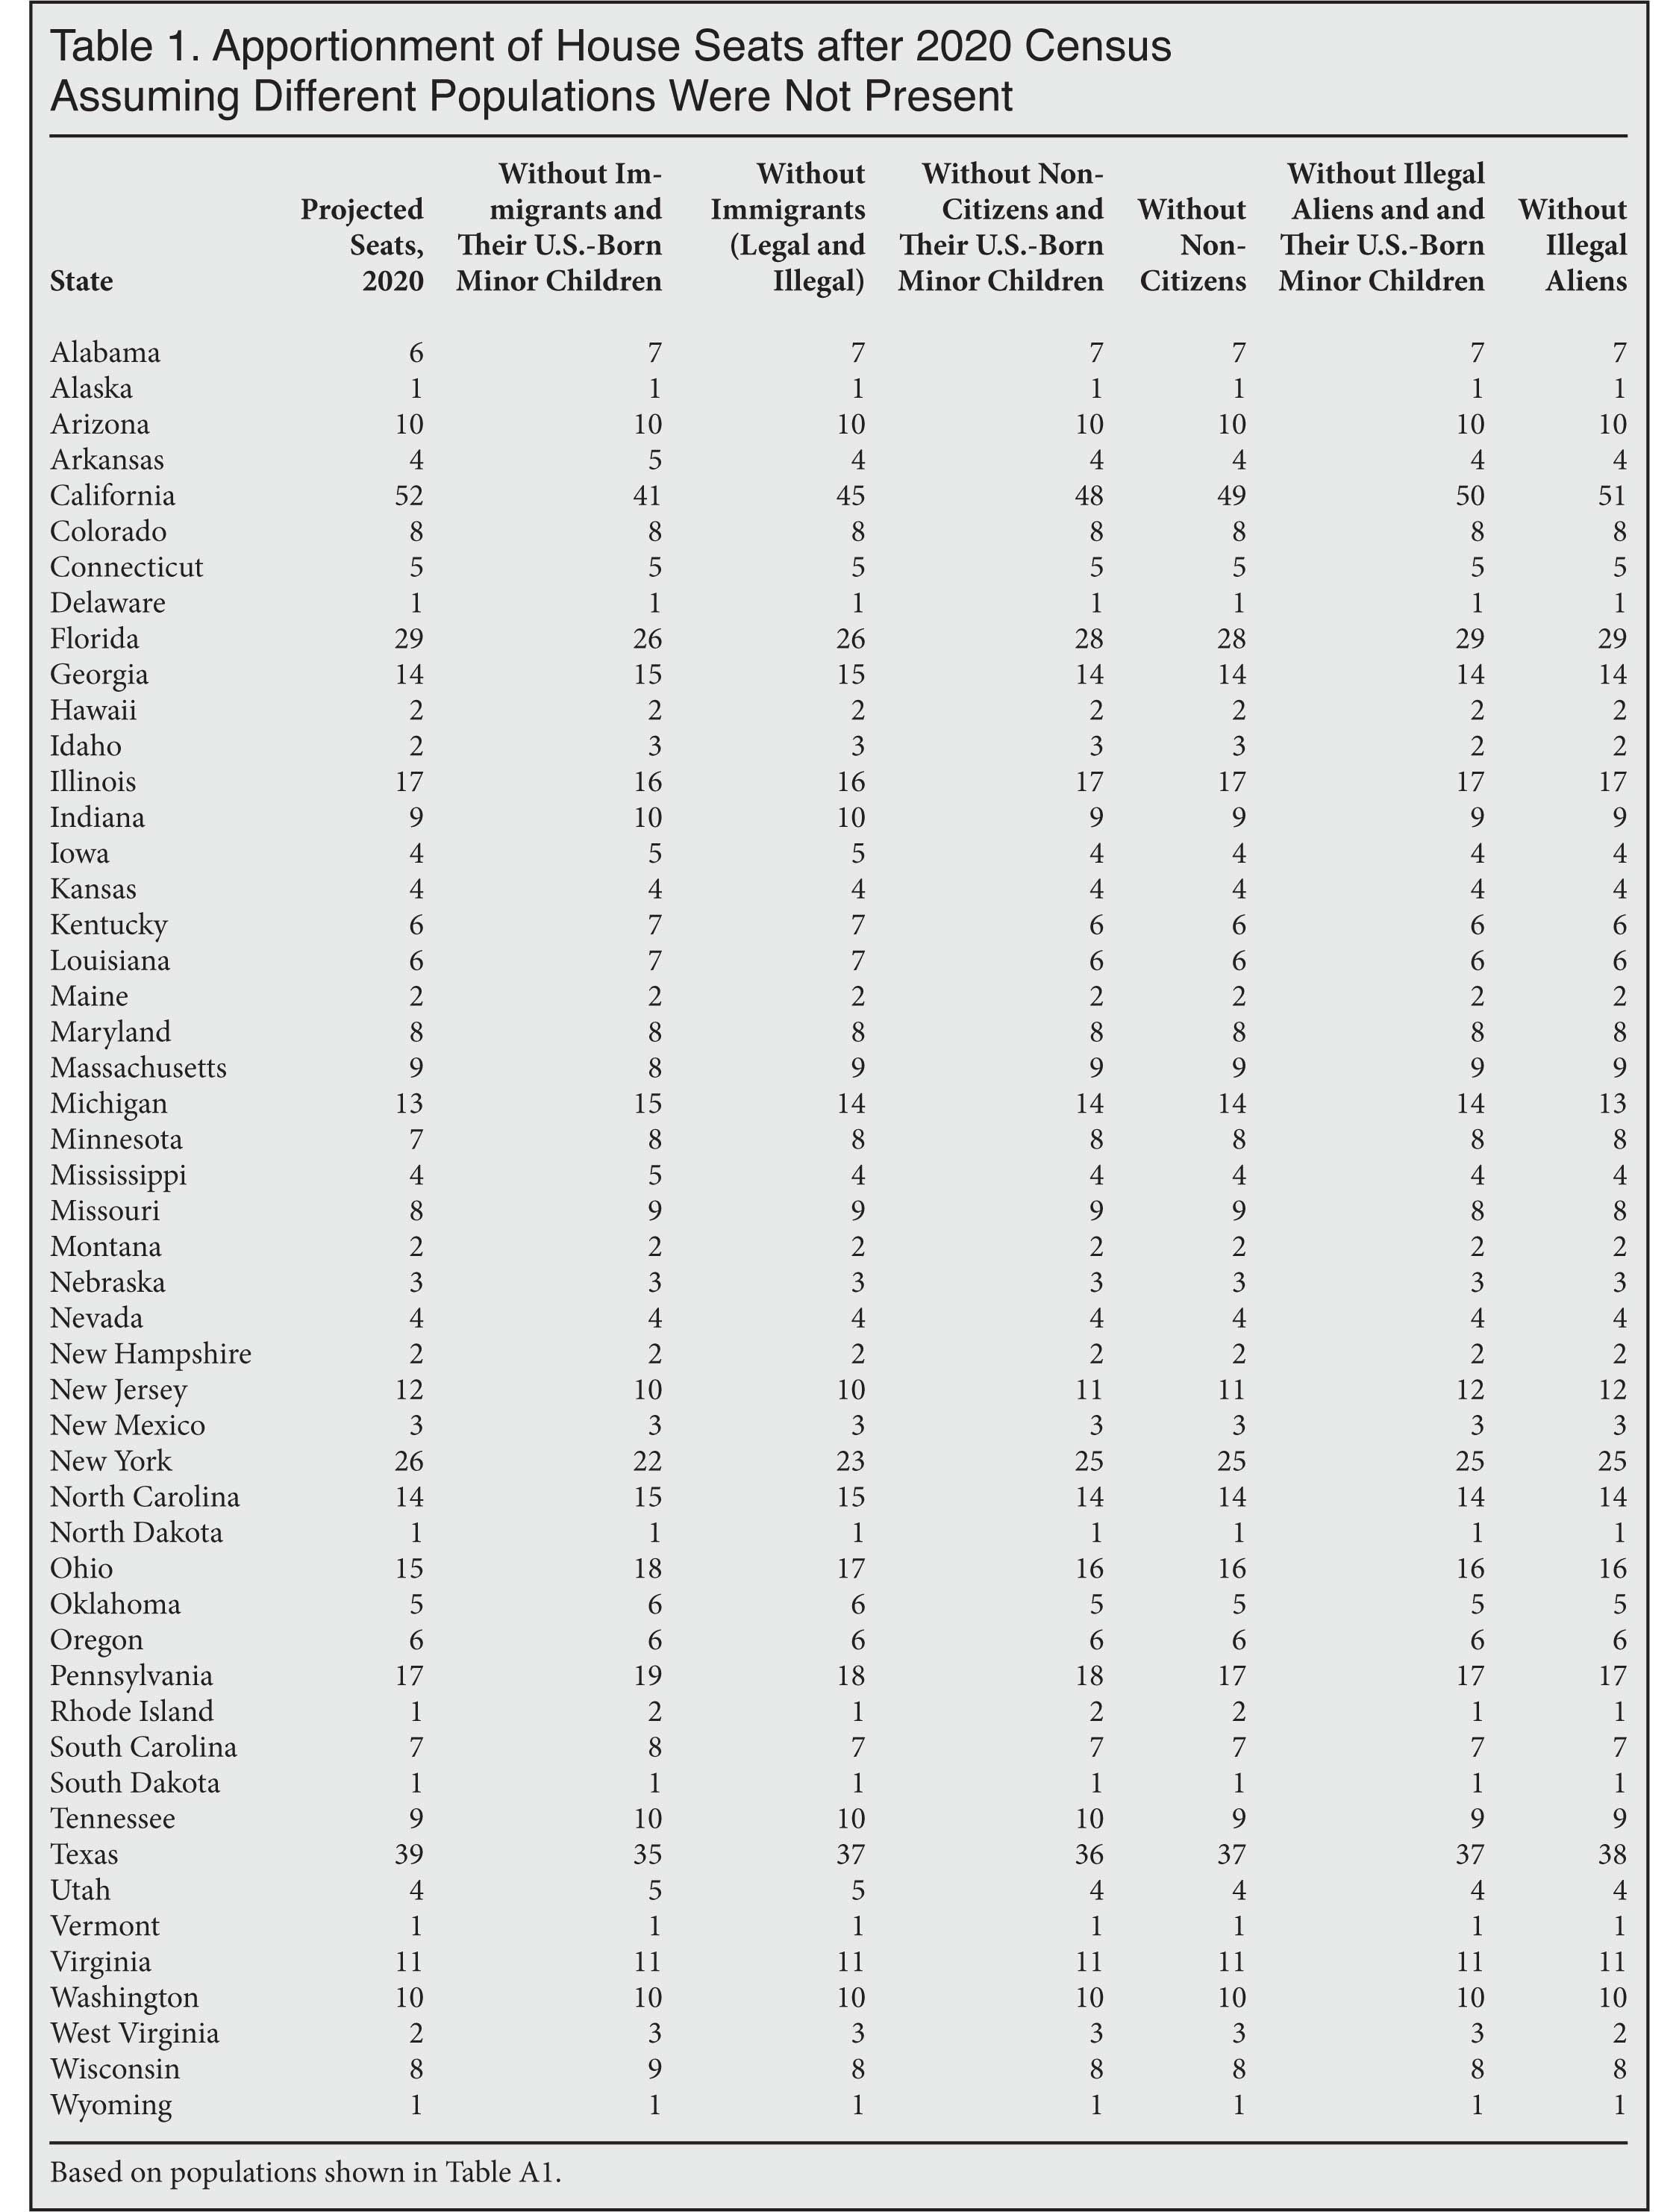
Impact of All Immigrants. The second column in Table 1 shows the likely distribution of seats in the House after the 2020 census, based on current trends. This is the baseline projection against which all other scenarios are compared. The other columns in Table 1 show the distribution of seats under different population scenarios.3 Table 2 uses Table 1 and compares changes in the distribution of seats caused by what is likely to happen in 2020 under each scenario. The 21 states that are unaffected in any of the scenarios are not shown in Table 2. The bottom of Table 2 shows the total number of seats that change hands under each scenario.
 |
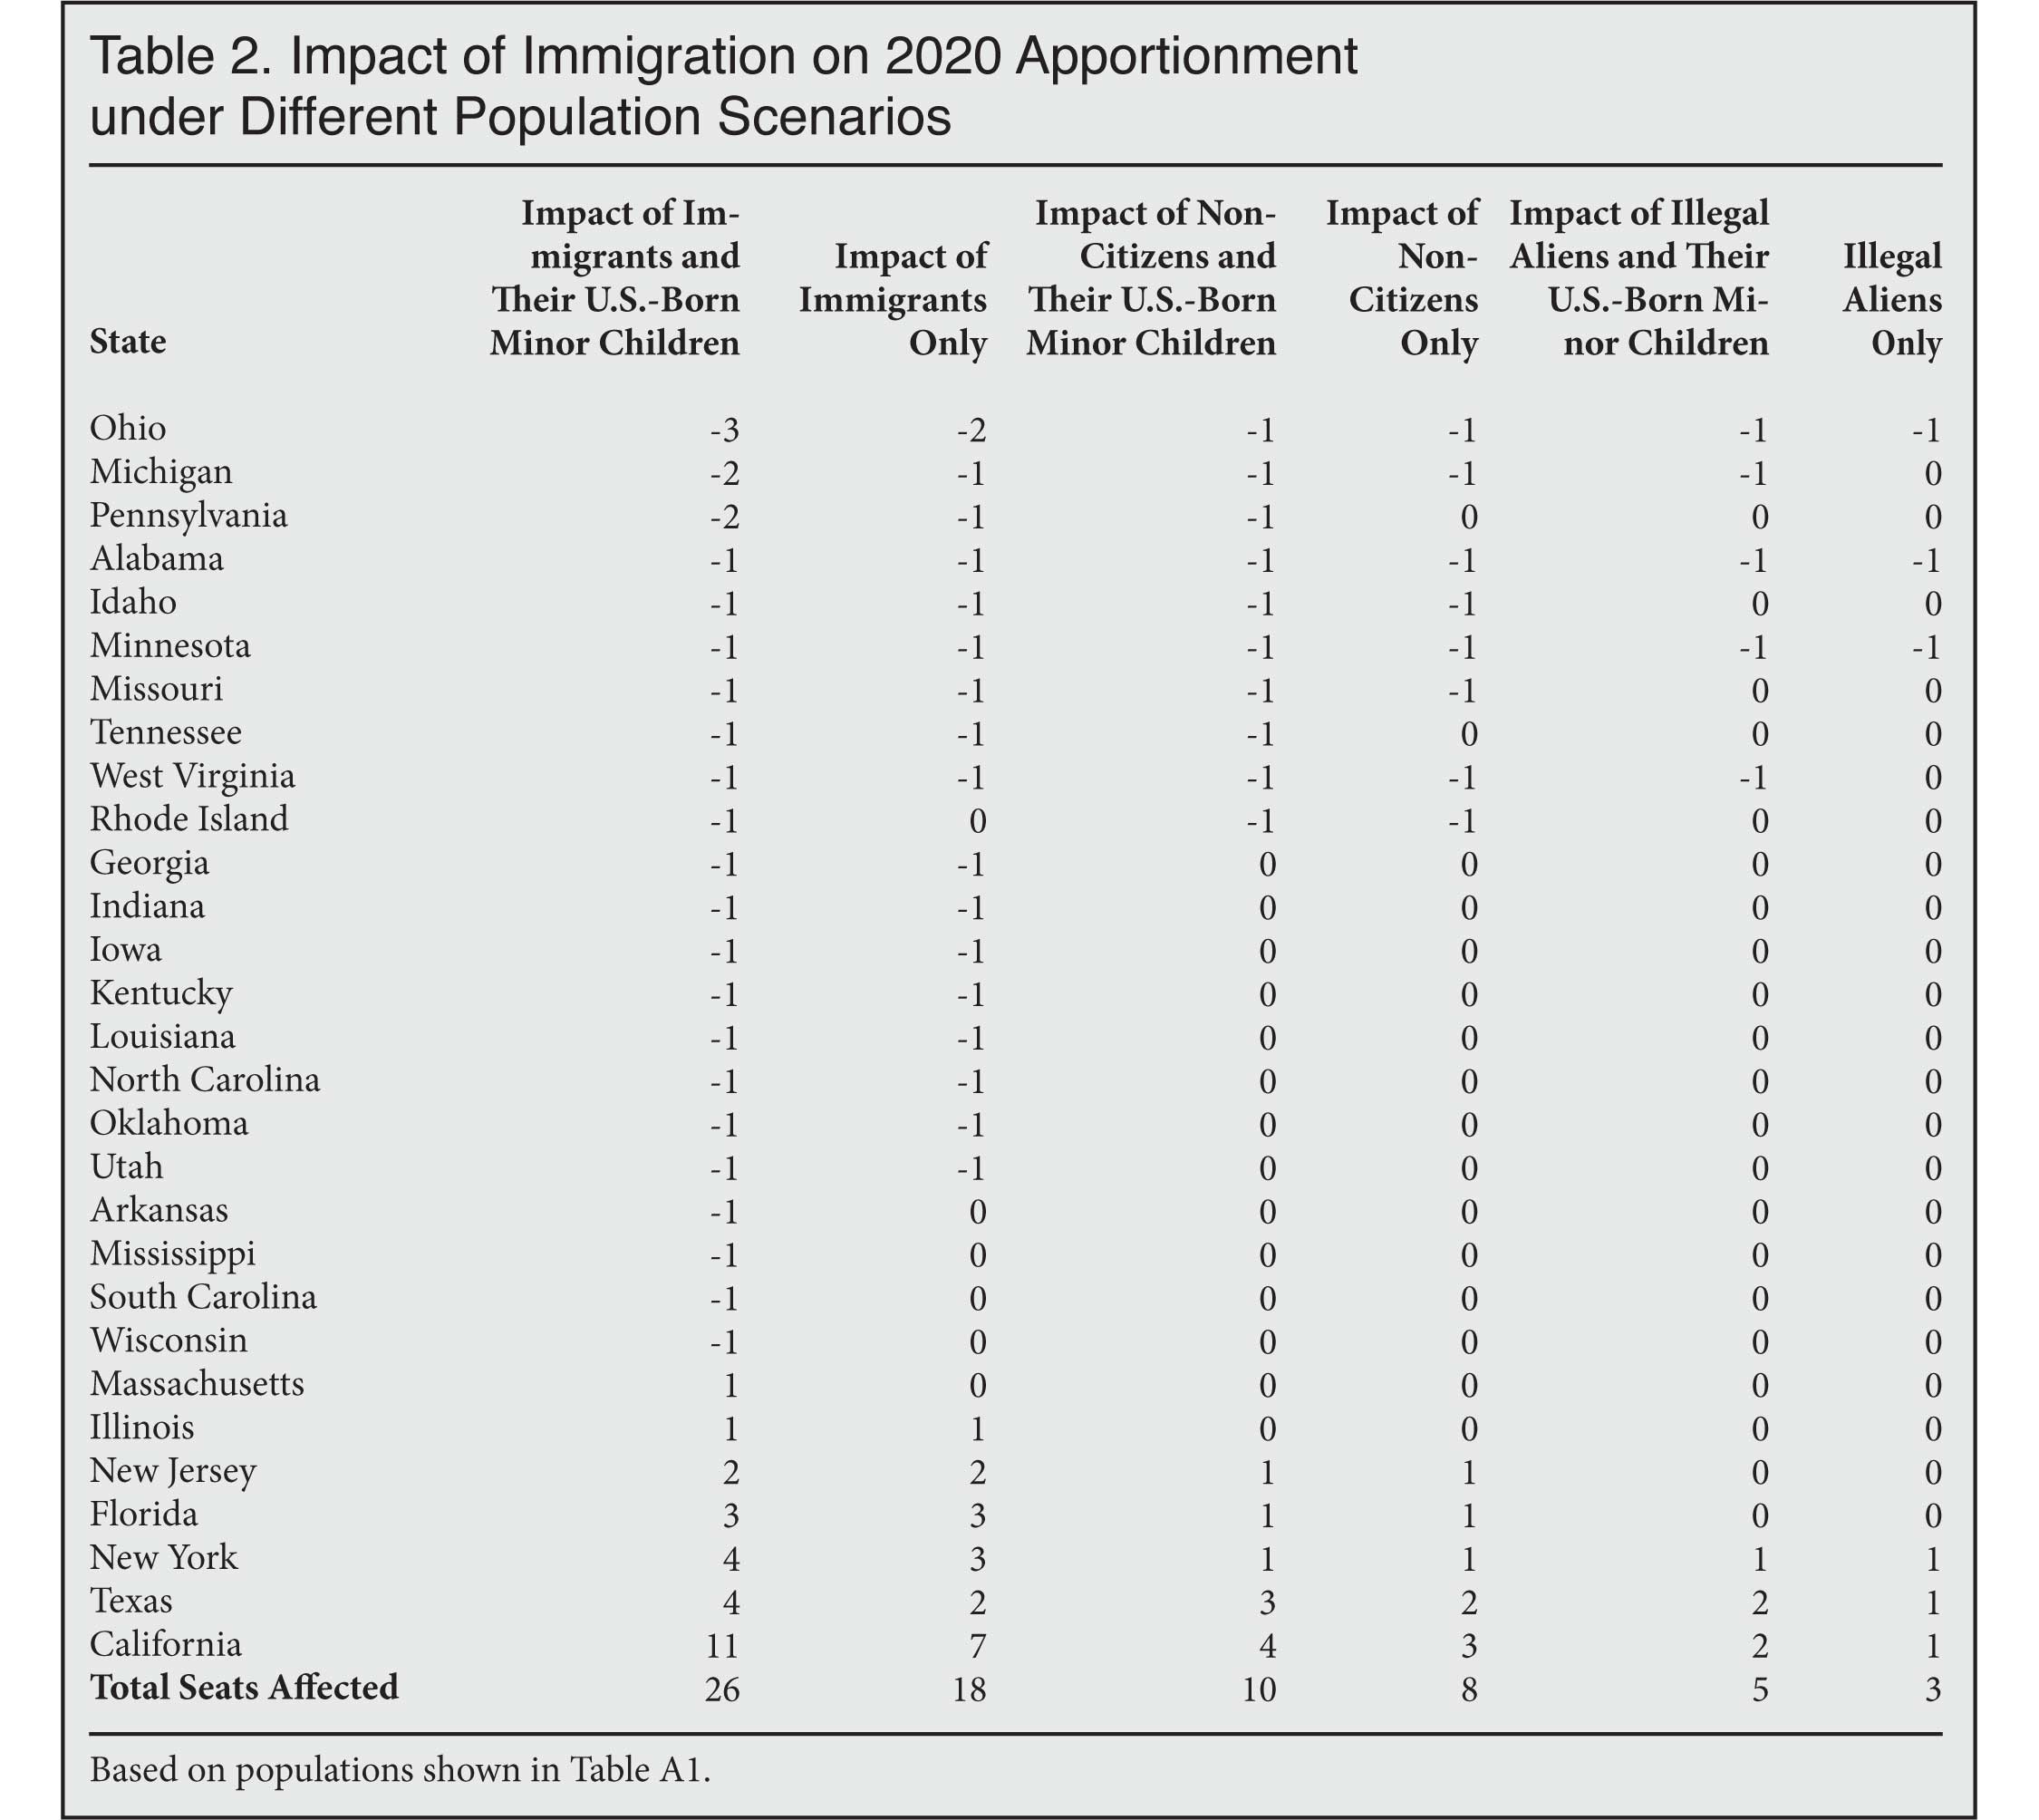 |
In 2020, there will be more than 61 million immigrants and their U.S.-born minor children in the United States, representing nearly one in five U.S. residents. In 2020, the average House seat will represent roughly 760,000 people. So it is not surprising that immigration redistributes seats. Of course it is not just the number of immigrants or the number of children that matter. In 2020, just four states (California, Texas, Florida, and New York) will have 53 percent of the nation's immigrants and their U.S.-born children under age 18. It is both the size of this population and its uneven distribution that causes the significant redistribution shown at the bottom of Table 2.
Table 2 shows that Ohio is the biggest loser from immigration, with three fewer seats due to the presence of immigrants and their U.S.-born children residing in other states. Michigan and Pennsylvania will have two fewer seats, while Alabama, Arkansas, Georgia, Idaho, Indiana, Iowa, Kentucky, Louisiana, Minnesota, Mississippi, Missouri, North Carolina, Oklahoma, Rhode Island, South Carolina, Tennessee, Utah, West Virginia, and Wisconsin will each lose one seat. California is the biggest winner, as it will gain 11 more congressional seats due to immigrants and their young children; New York and Texas will get four more seats each, while Florida will get three seats, New Jersey two seats, and Massachusetts and Illinois one seat each. Table 2 also shows that immigrants (legal and illegal) alone, not including their U.S.-born children, redistribute 18 seats. Ohio would have two fewer seats due to immigrants, while Alabama, Idaho, Michigan, Minnesota, Missouri, Pennsylvania, Tennessee, West Virginia, Georgia, Indiana, Iowa, Kentucky, Louisiana, North Carolina, Oklahoma, and Utah would lose one seat under this scenario. California would still be the big winner, followed by New York, Florida, Texas, New Jersey, and Illinois. Immigrants alone, not counting their U.S.-born minor children, have a very large impact on the apportionment of House seats.
The Impact of Non-Citizens and Illegal Immigrants. There will be nearly 30 million non-citizens and their U.S.-born minor children in the country in 2020. Non-citizens include green card holders (permanent residents), long-term temporary visa holders (mainly foreign students and guestworkers), and illegal immigrants. Together with their U.S.-born children, these non-citizens will redistribute 10 seats in 2020. California will have four more seats than it otherwise would but for non-citizens and their young children; Texas will have three additional seats; and New Jersey, Florida, and New York will each have one additional seat. Alabama, Idaho, Michigan, Minnesota, Missouri, Ohio, Pennsylvania, Tennessee, West Virginia, and Rhode Island will each have one fewer seat as a result of non-citizens and their minor children. Non-citizens, not including their U.S-born minor children, will redistribute eight seats. The states that gain seats are the same, with Texas and California gaining one fewer than when the children are included. The losing states are also the same with the exception that neither Pennsylvania nor Tennessee will lose a seat.
Turning to illegal immigrants and their minor children, Table 2 shows that including them in the census redistributes five seats. California and Texas will each gain two seats as a result of including illegal immigrants and their young children, while New York will gain a seat. Alabama, Michigan, Ohio, Minnesota, and West Virginia each lose a seat because of illegal immigrants and their U.S.-born children in other states. If we look at only illegal immigrants, we find that including them in the count redistributes three seats in the House. California, Texas, and New York will each gain a seat; Alabama, Ohio, and Minnesota will each lose one.
Implications
High Immigration Causes Political Redistribution. If immigrants were evenly spread throughout the country, they would have no impact on the distribution of House seats. Historically, immigrants have always been concentrated in some areas, and that is still true today. Of course, immigrants do tend to become more dispersed over time, but it is a very gradual process. In 1990, the top six states of immigrant settlement accounted for 73 percent of the total foreign-born population, while in 2000 these same six states accounted for 69 percent of the total foreign-born population. In 2020, the top six states will account for 63 percent of all immigrants, but only 40 percent of the nation's total population. Although immigrants will almost certainly continue to move into new parts of the country, for decades to come there will continue to be states with very large immigrant populations, while other states have only a modest number. In 2020, there will still be 11 states with fewer than 100,000 immigrants, while five states will have more than two million.
The redistributive effects of immigration are not just a result of its concentration, but also partly depend on immigrants' share of the total population. A very large immigrant population, even if it becomes more dispersed, can still have a significant impact on the distribution of House seats and Electoral College votes. As long as the number of immigrants (legal and illegal) entering the country remains very high, immigration will continue to redistribute political power in Washington. (While not examined in this report, the same dynamic applies within states, in drawing districts for the state legislatures.)
Representing Non-Citizens in Congress. Although the political stakes for low-immigration states from continued high levels of immigration are clearly very significant, the related question of creating districts because of the presence of non-citizens is equally important to consider. While there is a consensus that naturalized citizens should be represented in Congress just like any other American, awarding congressional seats to states on the basis of their non-citizen populations raises important questions about political representation. This is especially true when one considers that these districts are created by taking representation away from states comprised of American citizens.
Consider the case of Ohio, the biggest loser from immigration-induced reapportionment. In 2020, there will be 292,000 non-citizens in Ohio, accounting for just 2 percent of the state's population; California will be home to nearly 4.8 million non-citizens, accounting for 12 percent of the state's population. Non-citizens cannot vote in federal elections, serve on juries, or work for the federal government in most cases. Many non-citizens, including foreign students, guestworkers, and illegal immigrants also may not make campaign contributions. Thus, it may seem odd that they are "represented" in Congress. This is especially true because the majority of non-citizens in the country are either illegal immigrants or temporary visitors such as foreign students or guestworkers.4 While one can at least argue that legal permanent residents who have not naturalized are entitled to representation in Congress because they are future Americans, illegal aliens and temporary visitors can make no such claim.
Non-Citizens vs. "One Man, One Vote". There are a significant number of congressional districts in high immigration states where a larger share of voting-age people are non-citizens and, as a result, it takes relatively few votes to elect a member of Congress. Taking away representation from states composed almost entirely of U.S. citizens so that districts can be created where a large share of the population is made up of non-citizens can be seen as in conflict with the principle of "one man, one vote". In the 2018 election in the five congressional districts where the largest share of the voting-age population were not citizens, only 132,000 votes were cast on average. In the five districts with the smallest non-citizen shares, 232,000 votes were cast on average. If nothing else, it means it takes far fewer votes to win a House seat in a district where a large share of adults is made up of non-citizens. Allowing in a large number of legal immigrants and tolerating illegal immigration has created a situation in which the votes of American citizens living in low-immigration districts count much less than those of citizens is living in high-immigration districts.
While it's clear that American citizens in low-immigration states lose from mass immigration, the winners are not necessarily the non-citizens who cause the reapportionment, since they cannot vote or otherwise fully take part in the political process. Instead, it is citizens who live in the same districts with non-citizens whose political power is enhanced. Put simply, in a district in which a large share of the population cannot vote, those who do vote count more than citizens in districts where almost everyone is an American citizen. Put a different way, large non-citizen populations take voting power from some Americans and give it to other American citizens in high-immigration districts.
Conclusion
Given the large number of immigrants allowed into the country and their concentration in relatively few states, it is inevitable that immigration will exact a political cost from those states that receive relatively few immigrants. Because family relationships and existing cultural ties determine where immigrants live, movement into new areas will take many decades. Thus, immigrants will continue to be concentrated in only a few states, and this in turn will continue to shift political power in the House of Representatives and the Electoral College.
It is important, then, when making decisions regarding immigration policy, to take into account not only the economic, fiscal, cultural, and demographic impacts of immigration, but also the political impact, part of which is the realignment of power in Congress away from states receiving relatively few immigrants. In addition to this realignment, careful consideration should also be given to the loss of representation suffered by citizens in low-immigration states. Trying to deal with this problem by excluding non-citizens, legal or illegal, would be challenging. Whether the Constitution requires non-citizens to be included in the apportionment population is an open question.
Encouraging legal immigrants who are not citizens to naturalize would help to alleviate at least some of the problem. Of course, increased naturalizations would have no impact on the problem created by the presence of illegal aliens or the large number of long-term temporary visitors in the country. In addition, as long as one million or more new legal permanent immigrants are allowed in annually, there will always be a significant number of legal immigrants who have not lived here long enough to naturalize or chose not to do so even when eligible. Absent a change in policy, the non-citizen population will remain large even if new legal permanent immigrants naturalize at higher rates in the future.
Since the amount of redistribution is a direct consequence of the level of immigration, a more moderate level of immigration would produce less immigration-based reapportionment. Given the apparent remoteness of the other effects of immigration on low-immigrant states, citizens of such states and their elected representatives need to be particularly sensitive to the political costs of immigration.
Methods
While the Constitution requires the reapportionment of seats in the House of Representatives after each decennial census, it is not clear on the exact method of apportionment. The Method of Equal Proportions has been used since the 1940 Census.5 This analysis assumes it will again be the method used in 2020. The Census Bureau attempts to capture all U.S. residents in the census.
To estimate the impact of immigration on the 2020 census requires six steps. First, project the resident population of the 50 states for 2020, excluding the District of Columbia. Second, project the size and state distribution of the Federally Affiliated Overseas Population (FAOP) in 2020, which is included in the apportionment population. Third, add the FAOP to the projected resident population in each state and calculate the apportionment of seats in the U.S. House of Representatives based on the projections. Fourth, estimate the likely number of illegal immigrants, non-citizens, all immigrants (foreign-born), or other populations of interest that will be included in the apportionment population in 2020 by state. Fifth, remove the population of interest from the 2020 apportionment population and recalculate the distribution of House seats.
Sixth, compare the distribution of House seats from step three to the distribution of seats with the population of interest removed to determine the impact. The sections that follow explain in detail how this is done.
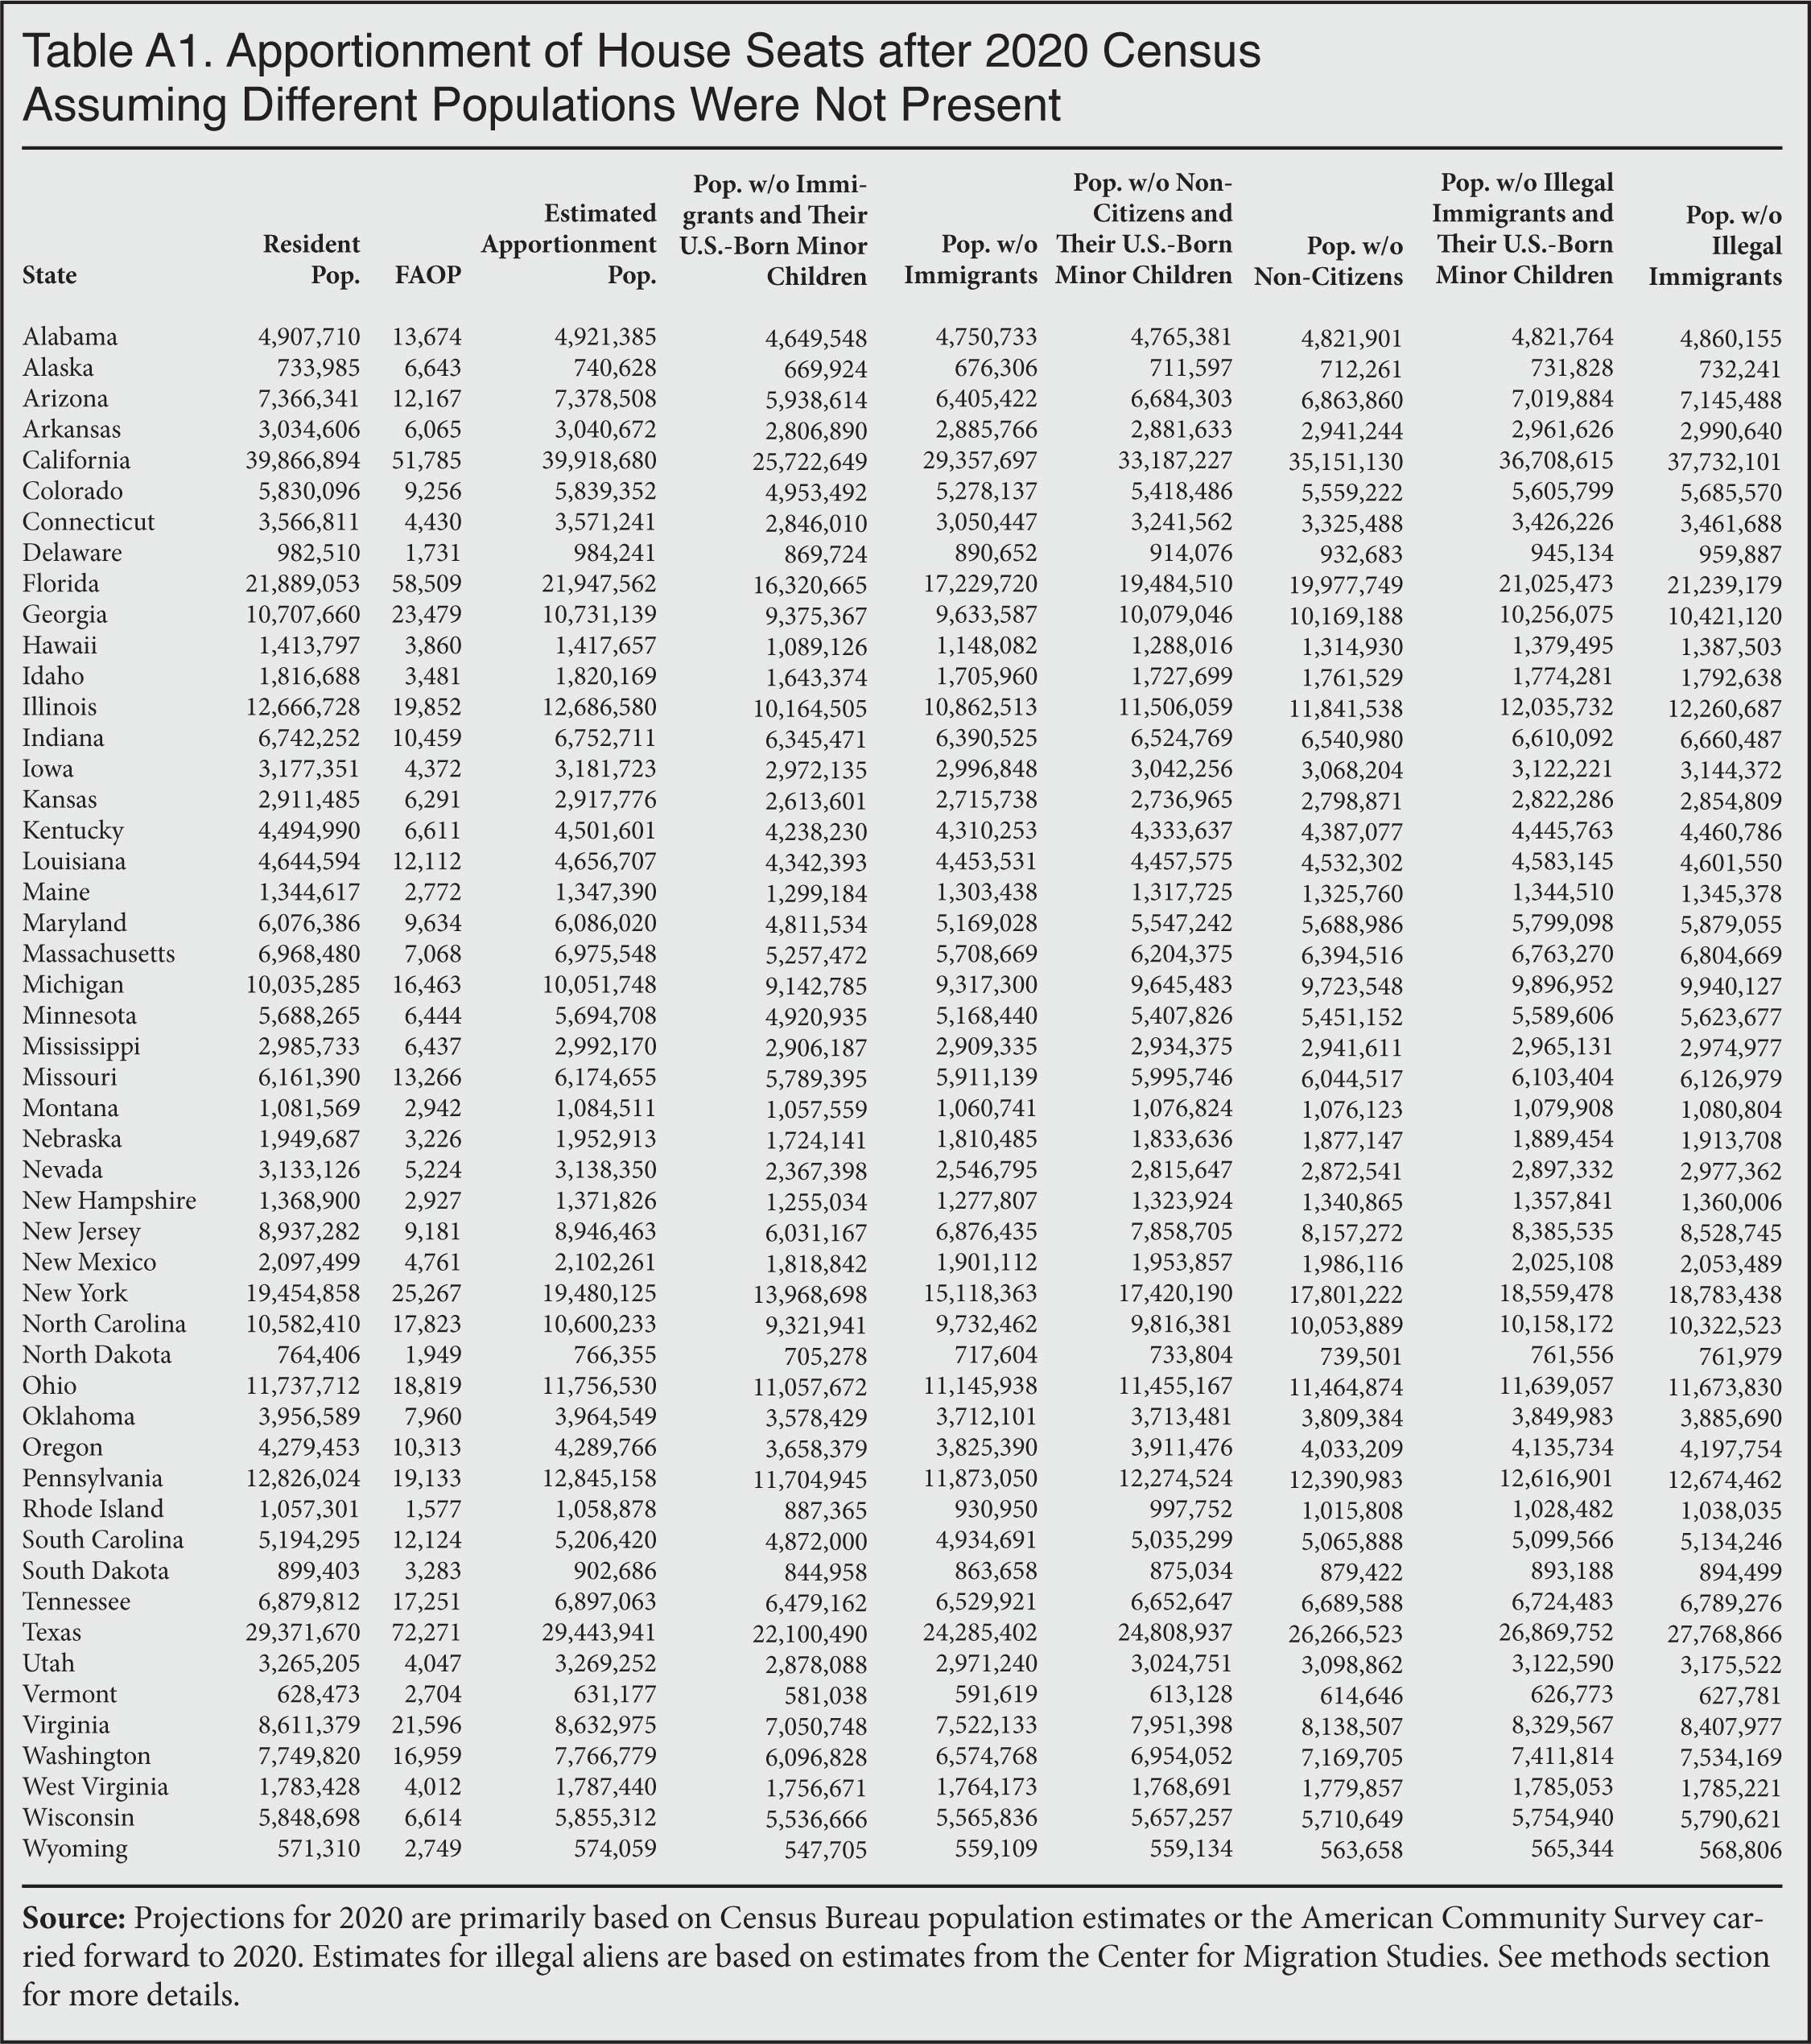
Projected Resident Population in 2020. While the U.S. Census Bureau no longer projects state populations, it does estimate each state's population every year. The state population projections for 2020 used in this report simply take each state's population as estimated by the Census Bureau in recent years and project the state's population to 2020 using a linear model.6 This is implemented by taking the Bureau's projections for each state from 2016 to 2018 (2018 is the most recent year available) and projecting the population to 2020.7 The projection has to be controlled back to April 1, since this is the date of the census, while the Bureau's population estimates are for each state as of July 1.8 The first column in Table A1 reports the projection of the resident population for April 1, 2020, in each state. The District of Columbia is excluded from the analysis as it is not part of the population used for apportioning House seats.
The Federally Affiliated Overseas Population. As already indicated, the apportionment population includes the resident population of each state and the Federally Affiliated Overseas Population (FAOP) of Americans: military personnel and their dependents, plus non-military federal employees and their dependents. The Census Bureau reports the number of military personnel overseas in its FactFinder data tool, but not the rest of the FAOP. The size of the FAOP is estimated for 2020 by taking the most recent estimate of military personnel overseas (236,475) from the Census Bureau's website as reported in FactFinder.9 The number of military dependents is estimated using the same ratio of military personnel to dependents as was the case in the 2010 census.10 This produces an estimate of 340,956 military dependents overseas, making for a total military and dependent population of 236,475 + 340,956 = 577,431.
As for federal employees overseas, the most up-to-date figure from the Office of Personnel Management is 21,393.11 Assuming the same ratio of federal employers overseas to dependents as in 2010 produces an estimated 35,833 federal employees and their dependents for 2020.12 Adding the estimated number of military personnel and their families calculated above to the estimated number of federal employees and their dependents creates an overall estimated FAOP of 613,265. Subtracting out those in the District of Columbia leaves an FAOP of 611,573.13 This FAOP can then be allocated across the states based on each state's share of the FAOP in the prior decennial census.14 Adding the state FAOP to the projected state population creates a projected apportionment population for 2020 for every state shown in the third column of Table A1.
Populations of Interest. The overall state population projections discussed above use the three most recent years of population estimates from the Census Bureau projected forward. For the foreign-born population, their U.S.-born children, and the non-citizen population and their children, we use a similar approach. Based on the public-use data from the American Community Survey for the three most recent years of data, we use a linear model to project these populations forward to 2020 for each state.15 Table A1 shows the projected foreign-born population in each state for 2020 using this approach. The table also shows the projected population of immigrants and their U.S.-born children and the non-citizen population and their children. We limit children to those with immigrant fathers. We then subtract these totals, depending on the population of interest from the total projected population (resident plus FAOP) and then recalculate the apportionment.
Likely Illegal Immigrants. There is no one definitive estimate of illegal immigrants. The Office of Immigration Statistics within the Department of Homeland Security estimates this population, but DHS has population estimates only for the 10 states with the largest illegal immigrant populations and their most recent estimates are only through January 2015.16 Although the Pew Research Center estimates the number of illegal immigrants, we use the Center for Migration Studies' (CMS) estimates of illegal aliens for 2017, as they provide estimates for every state.17 This analysis takes the CMS estimates at the state level and subtracts them from the projected apportionment populations generated above. For the U.S.-born children under age 18, we also use estimates provided by CMS. The apportionment of House seats absent illegal aliens and their U.S.-born minor children can then be compared to the apportionment of seats when the illegal population is included. The difference represents the impact of illegal immigration.
Appendix
 |
End Notes
1 The most recent data available from the Census Bureau is the 2019 Current Population Survey Annual Social and Economic Supplement, which shows 45.8 million legal and illegal immigrants in the country. The 1960 census showed 9.7 million immigrants and the 1970 census showed 9.6 million, so using either number shows a four-and-a-half fold increase.
2 Figures are based on an analysis of the 2019 public-use file of the Current Population Survey Annual Social and Economic Supplement, which is the most recent data available.
3 Table A1 in the appendix shows the populations used to create each scenario in Table 1.
4 The government estimated in 2016 that there were 2.3 million long term temporary visitors in the country, including guestworkers, foreign students, cultural exchange visitors, and foreign diplomats. This number is relatively stable, though it tends to rise over time. The vast majority will be counted in the census, though there will be some undercount. The Center for Migration Studies estimates that there were 9.84 million illegal aliens in Census Bureau data in 2017 and, given the recent influx at the southern border, it seems certain the number will be at least this large in 2020. Given current trends, we project 21.8 million non-citizens in the 2020 census. So it is almost certain there will be more than 12 million non-citizens who are either illegal immigrants or long-term temporary visitors counted in the 2020 census, accounting for more than half of the total non-citizen population. See Bryan Baker, "Nonimmigrants Residing in the United States: Fiscal Year 2016", Office of Immigration Statistics, Department of Homeland Security, March 2018.
5 The U.S. Census Bureau has a detailed explanation of how congressional apportionment works here.
6 The Census Bureau's population estimates by state can be found here.
7 We use ordinary least squares to linearly project the population based on the Bureau's estimates for 2016, 2017, and 2018 to create the resident population in 2020.
8 This is implemented by taking the growth in the last year of the projection (2019 to 2020) and reducing it to reflect an April 1 date rather than the Census Bureau's control date of July 1.
9 Table PEPMONTHN generated in American Factfinder at Census.gov, The military population can be calculated by subtracting the first column from the second column.
10 The total size of the FAOP and its components — including military personnel and their dependents, and civilian employees and their dependents — in 2010 can be found in Table A7 of Karen Crook and Shirley Druetto, "2010 Census Federally Affiliated Overseas Count Operation Assessment", U.S. Census Bureau, March 12, 2012. The table shows 410,696 military personnel and 592,153 dependents or a ratio of 1.44183 to 1 in 2010.
11 OPM employment figure for those overseas can be found here.
12 "2010 Census Federally Affiliated Overseas Count Operation Assessment Report", 2010 Census Panning Memoranda Series No. 181 March 20, 2012. The table on p. 2 shows 23,686 overseas federal employees in 2010 and 15,988 dependents for a ratio of 1 to .6749. Multiplying the most recent figure from OPM of 21,393 by 1.6749 produces an estimate of 35,833 federal overseas employers and their dependents for 2020.
13 Ibid. Table A1 shows the FAOP by state and the District of Columbia in 2010. In 2010, the District of Columbia's FAOP accounted for 0.00276 of the total FAOP at that time — 2,875 out of 1,042,523 FAOP residents. Assuming the same ratio for 2020 creates an estimated FAOP used for reapportionment of 611,573.
14 Ibid. Table A1 shows the FAOP by state and the District of Columbia in 2010.
15 The three most recent years of public-use ACS data currently available are 2016, 2017, and 2018. As is the case for total resident population, we use ordinary least squares to linearly project these populations.
16 Bryan Baker, "Population Estimates: Illegal Alien Population Residing in the United States: January 2015", Office of Immigration Statistics, Department of Homeland Security, December 2018.
17 The Center for Migration Studies' most recent state level estimates can be found in Robert Warren, "US Undocumented Population Continued to Fall from 2016 to 2017 and Visa Overstays Significantly Exceeded Illegal Crossings for the Seventh Consecutive Year", Center for Migration Studies, February 2019. In an earlier report for CMS, Warren estimated that 92.5 percent of illegal immigrants are counted in Census Bureau data. See Robert Warren, "Democratizing Data about Unauthorized Residents in the United States: Estimates and Public-Use Data, 2010 to 2013", Journal on Migration and Human Security, Vol. 2 No. 4, 2014. In an email to the authors on April 27, 2018, Warren suggested assuming that 93 percent of illegal immigrants will be included in Census data, and this analysis uses that percentage for CMS state estimates for 2020.