Download a PDF of this Backgrounder.
Steven A. Camarota is the director of research and Karen Zeigler is a demographer at the Center.
New "public charge" rules issued by the Trump administration expand the list of programs that are considered welfare, receipt of which may prevent a prospective immigrant from receiving lawful permanent residence (a green card). Analysis by the Center for Immigration Studies of the Census Bureau's Survey of Income and Program Participation (SIPP) shows welfare use by households headed by non-citizens is very high. The desire to reduce these rates among future immigrants is the primary justification for the rule change. Immigrant advocacy groups are right to worry that the high welfare use of non-citizens may impact the ability of some to receive green cards, though the actual impacts of the rules are unclear because they do not include all the benefits non-citizens receive on behalf of their children and many welfare programs are not included in the new rules. As welfare participation varies dramatically by education level, significantly reducing future welfare use rates would require public charge rules that take into consideration education levels and resulting income and likely welfare use.
Of non-citizens in Census Bureau data, roughly half are in the country illegally. Non-citizens also include long-term temporary visitors (e.g. guestworkers and foreign students) and permanent residents who have not naturalized (green card holders). Despite the fact that there are barriers designed to prevent welfare use for all of these non-citizen populations, the data shows that, overall, non-citizen households access the welfare system at high rates, often receiving benefits on behalf of U.S.-born children.
Among the findings:
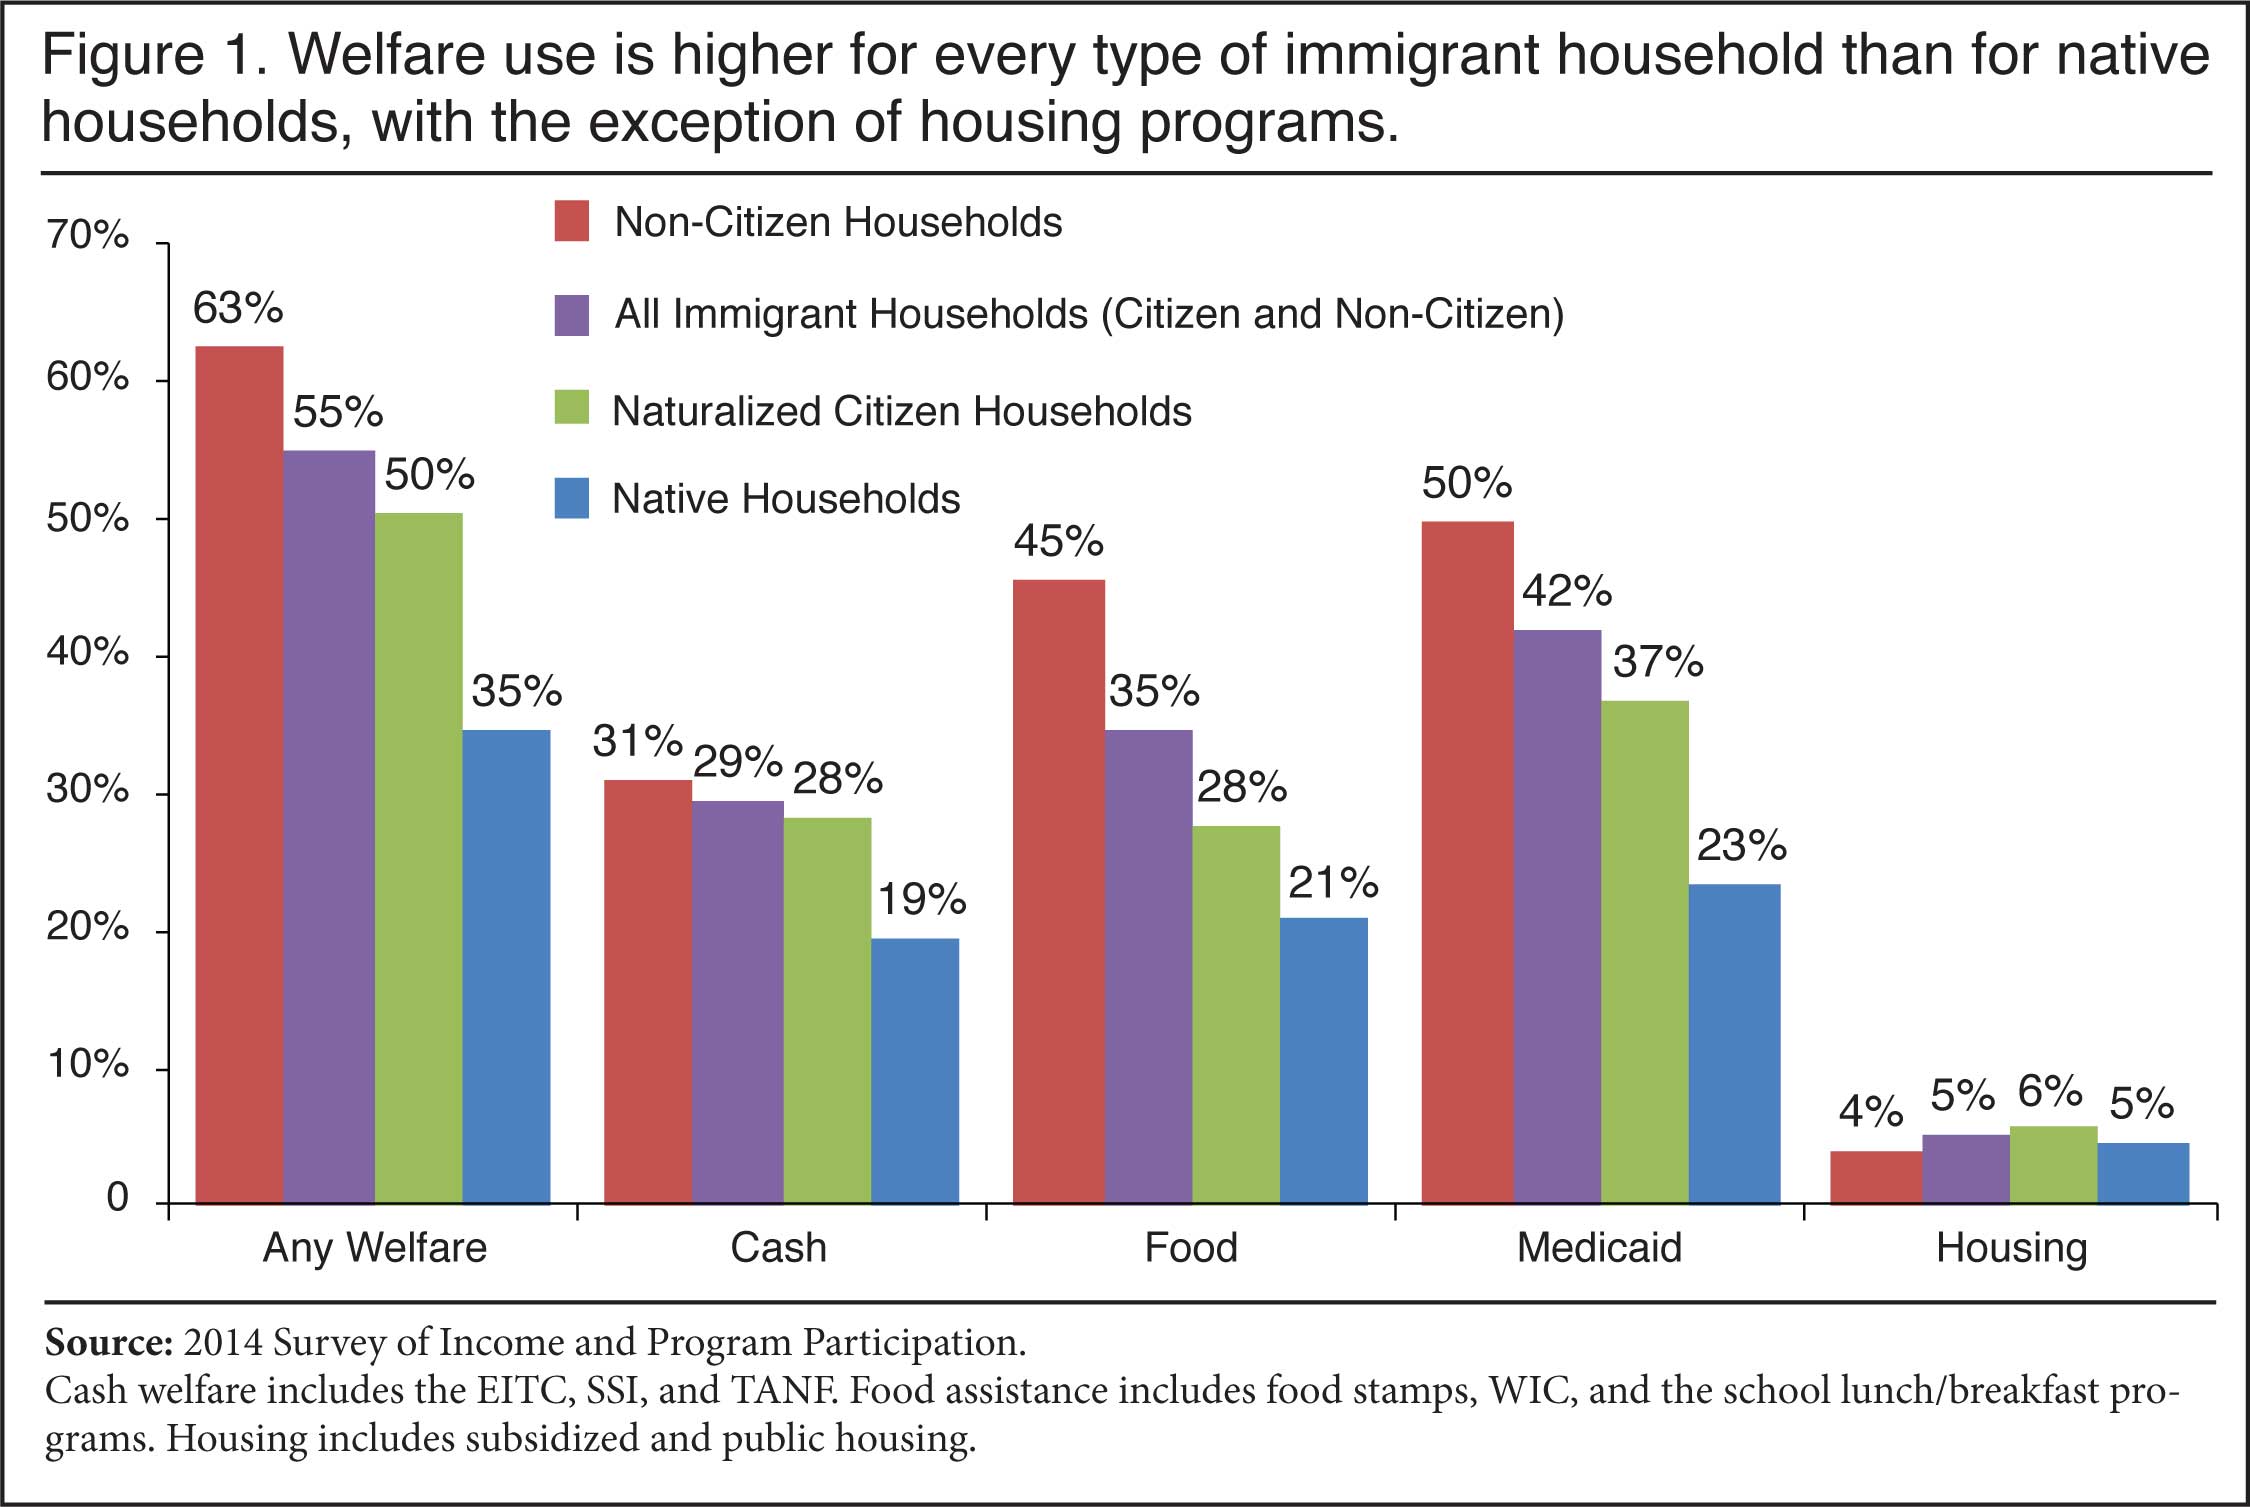
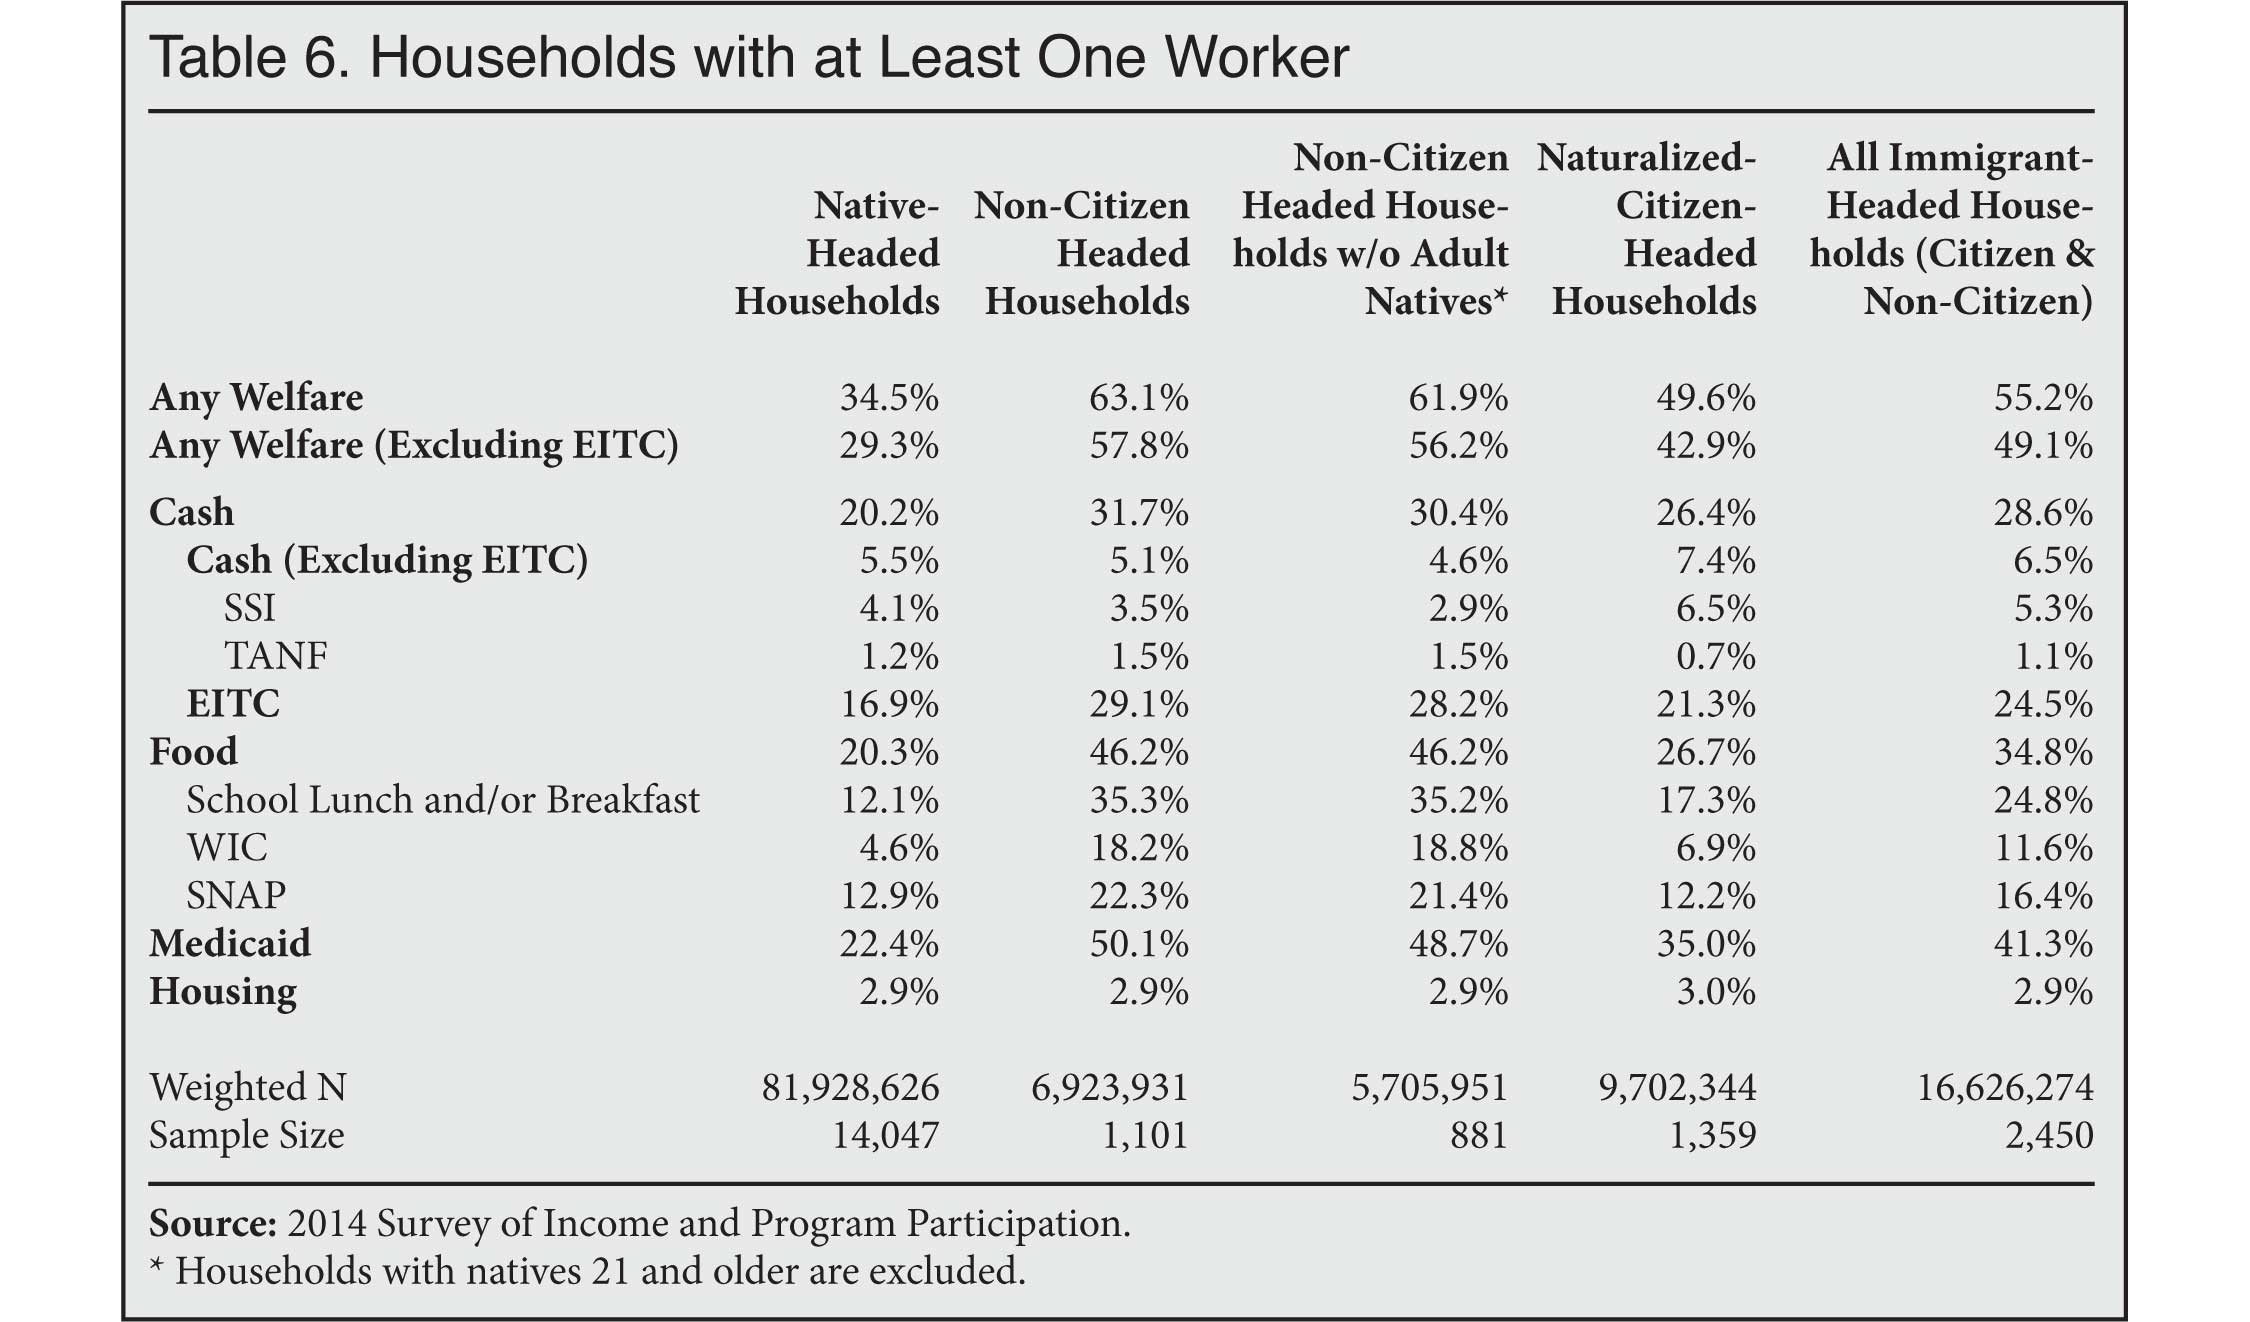
- In 2014, 63 percent of households headed by a non-citizen reported that they used at least one welfare program, compared to 35 percent of native-headed households.
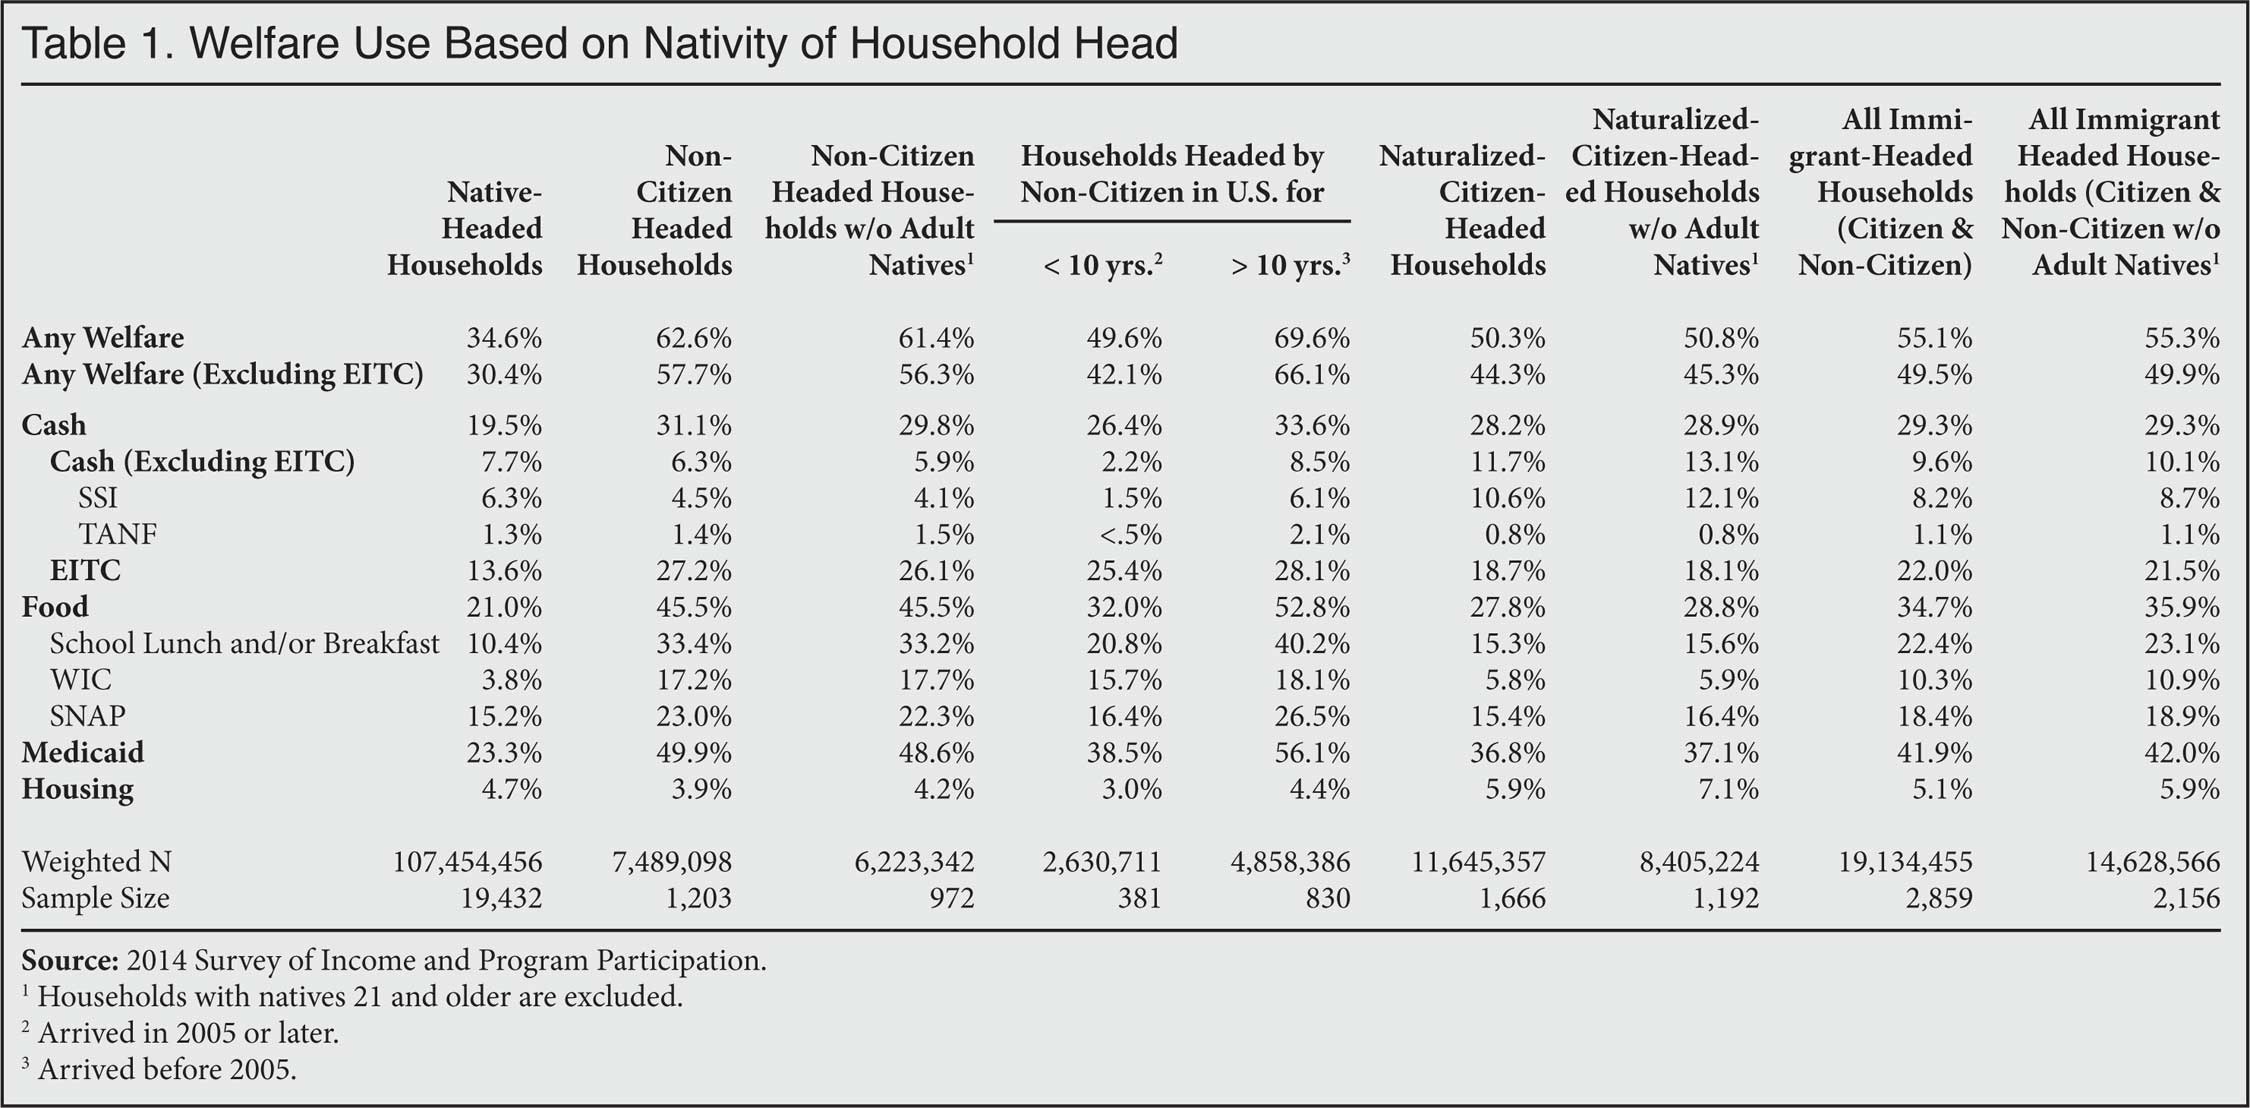
- Welfare use drops to 58 percent for non-citizen households and 30 percent for native households if cash payments from the Earned Income Tax Credit (EITC) are not counted as welfare. EITC recipients pay no federal income tax. Like other welfare, the EITC is a means-tested, anti-poverty program, but unlike other programs one has to work to receive it.
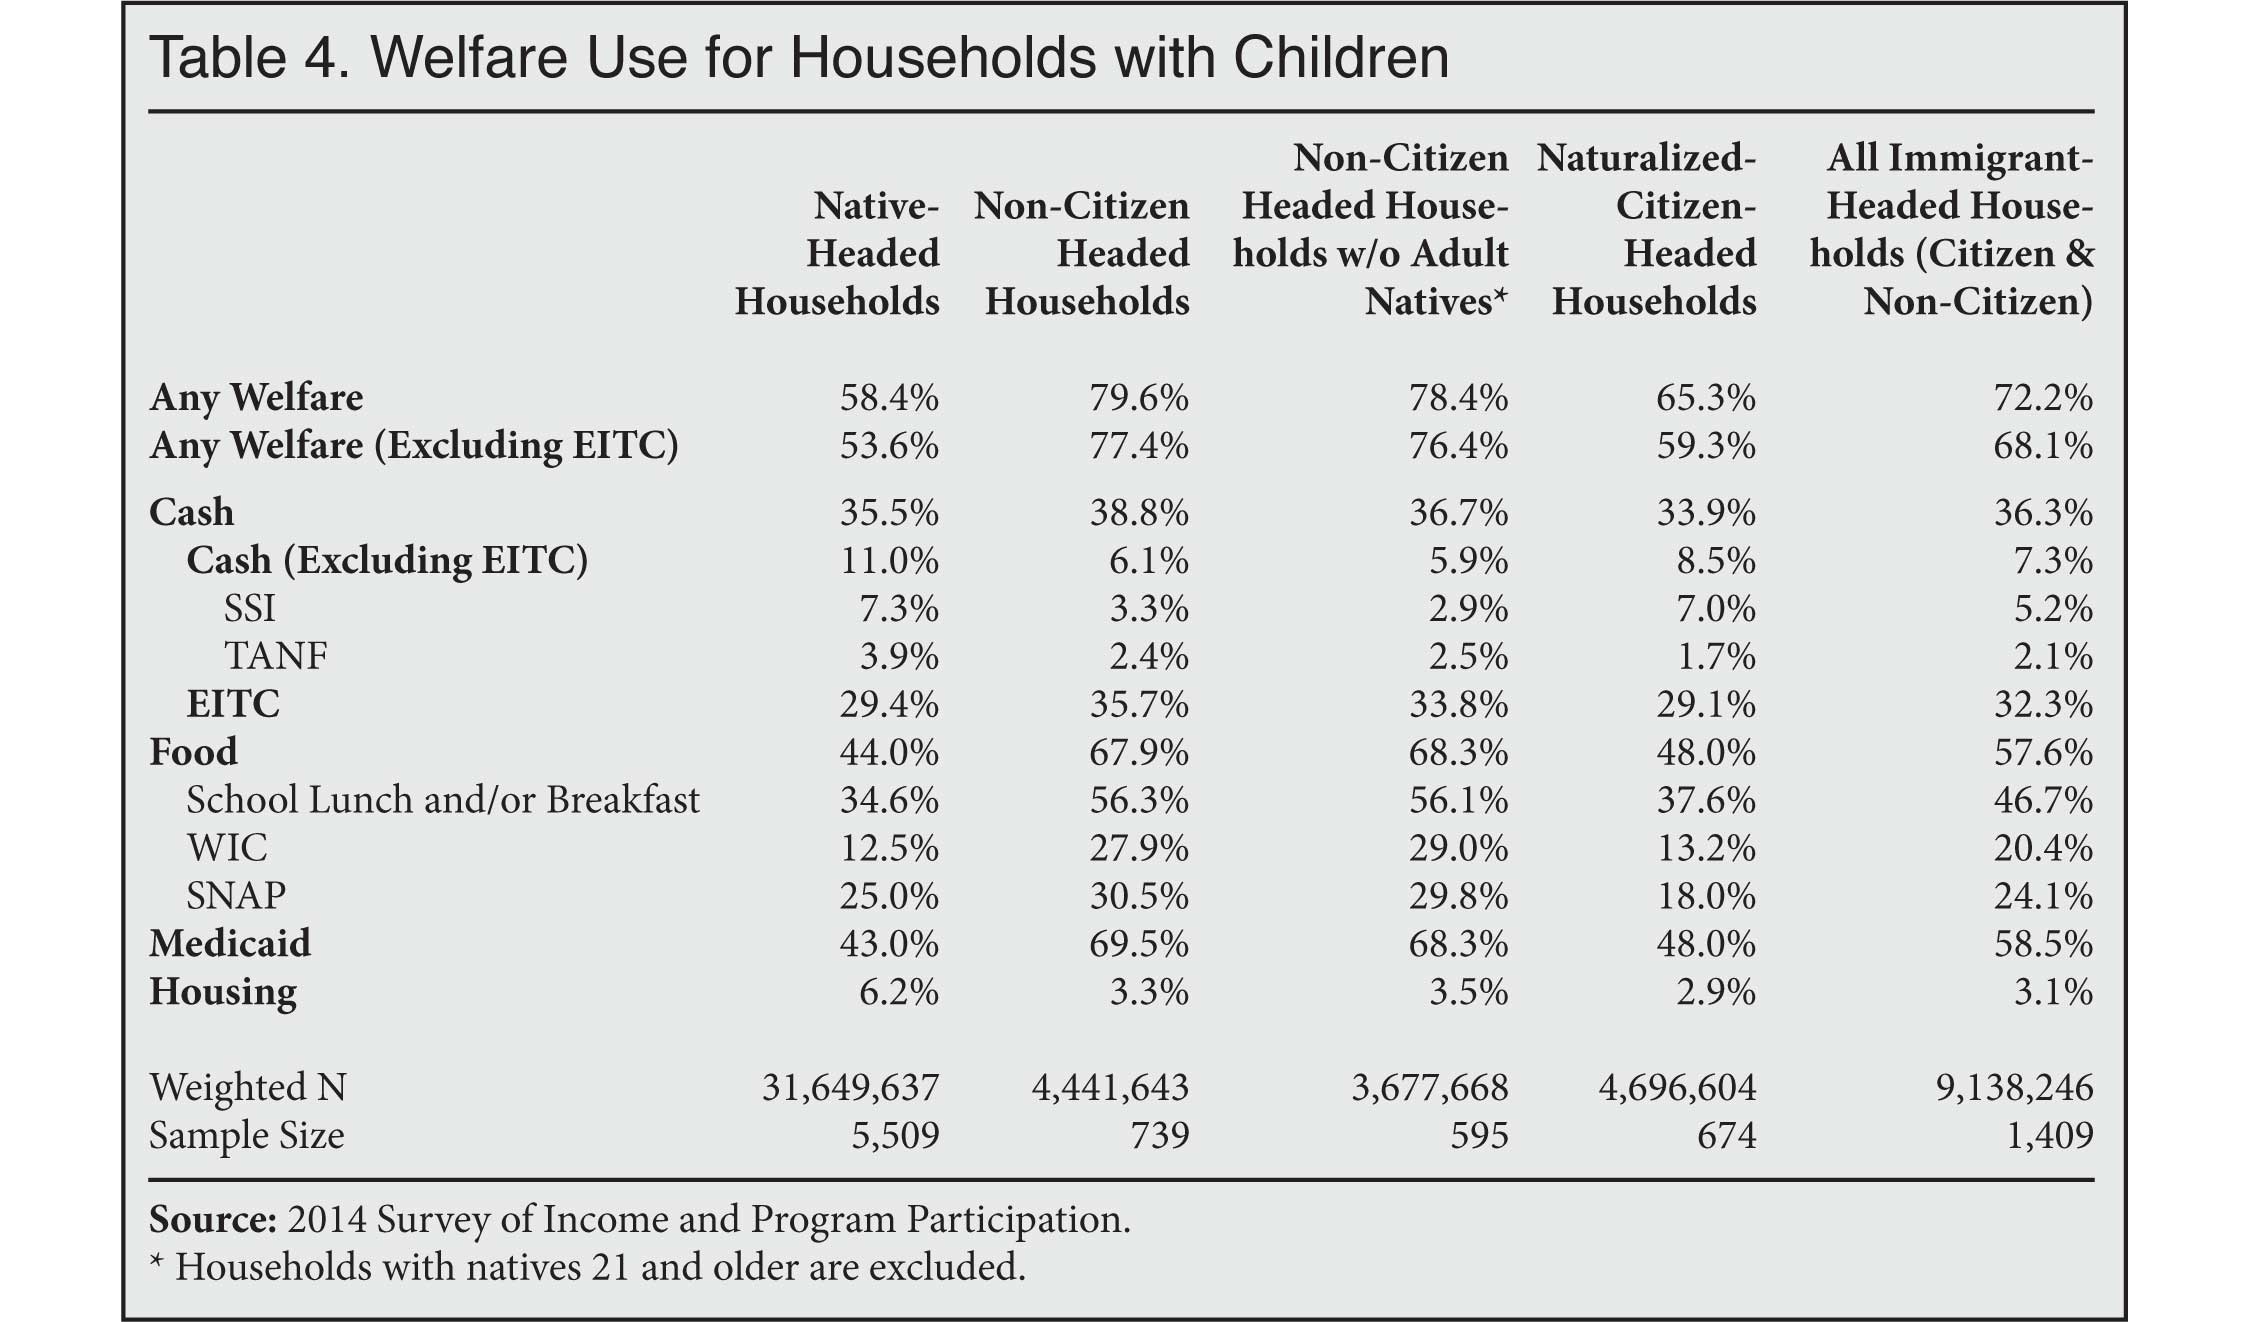
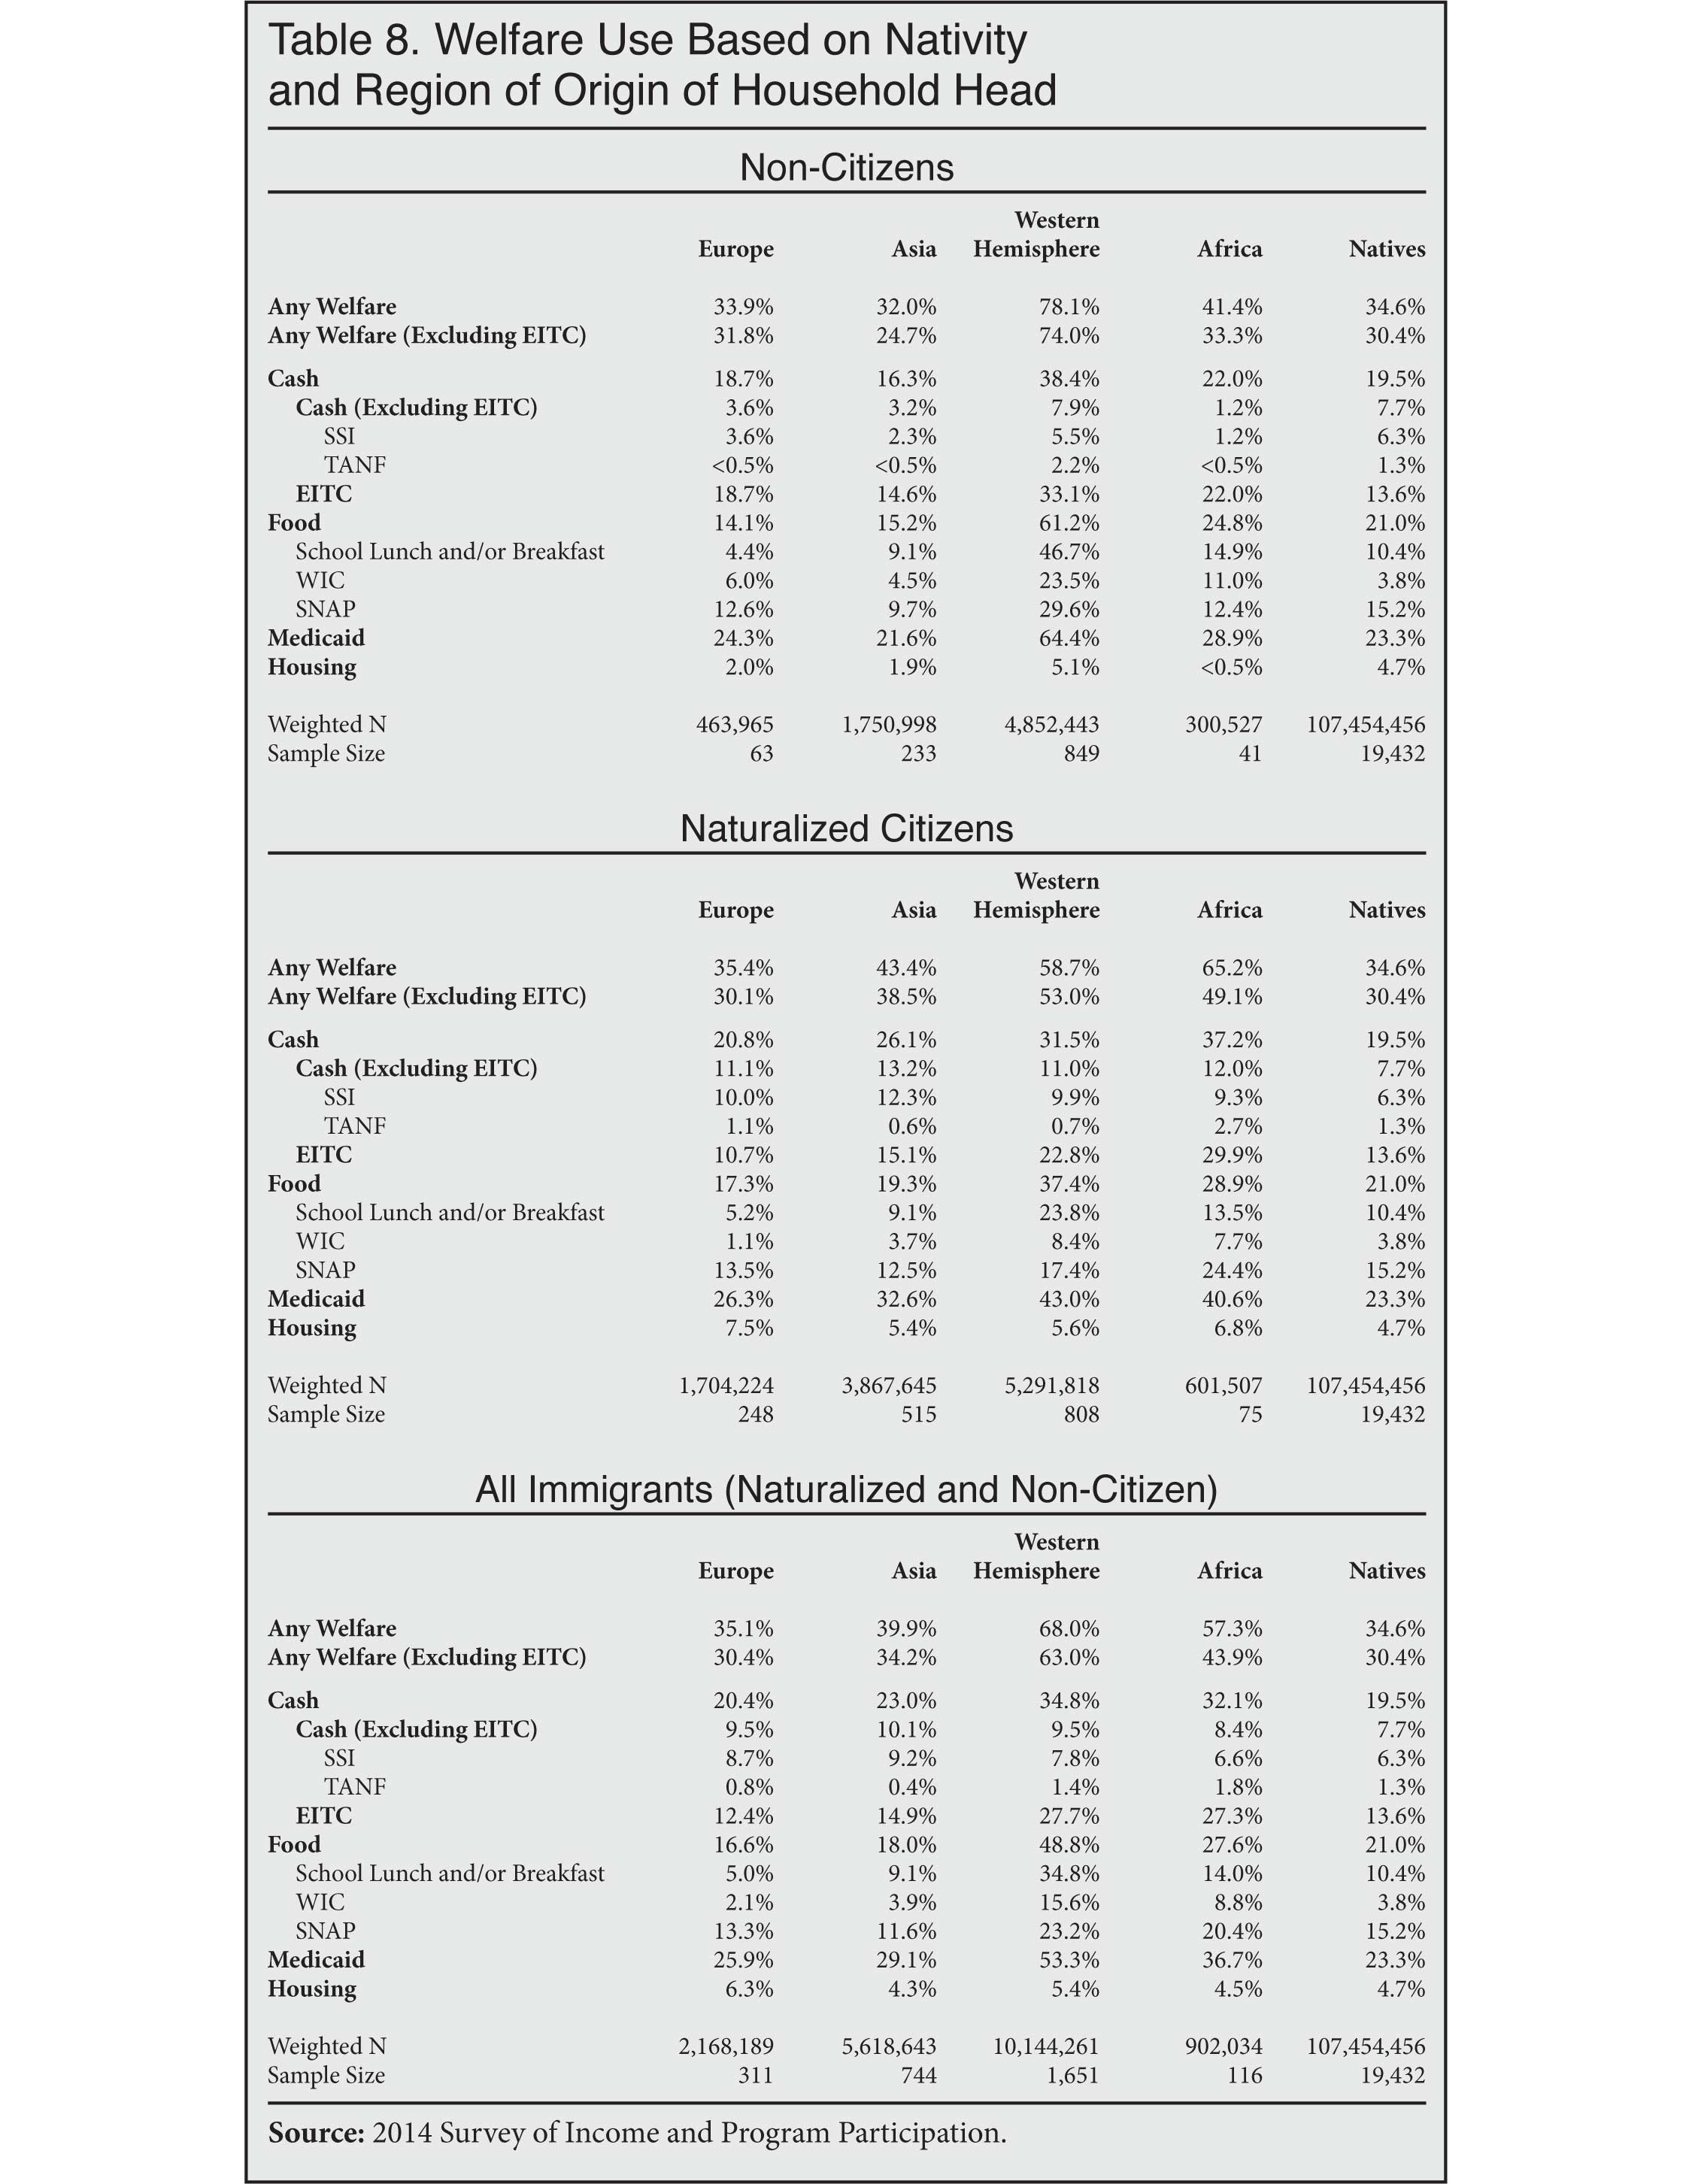
- Compared to native households, non-citizen households have much higher use of food programs (45 percent vs. 21 percent for natives) and Medicaid (50 percent vs. 23 percent for natives).
- Including the EITC, 31 percent of non-citizen-headed households receive cash welfare, compared to 19 percent of native households. If the EITC is not included, then cash receipt by non-citizen households is slightly lower than natives (6 percent vs. 8 percent).
- While most new legal immigrants (green card holders) are barred from most welfare programs, as are illegal immigrants and temporary visitors, these provisions have only a modest impact on non-citizen household use rates because: 1) most legal immigrants have been in the country long enough to qualify; 2) the bar does not apply to all programs, nor does it always apply to non-citizen children; 3) some states provide welfare to new immigrants on their own; and, most importantly, 4) non-citizens (including illegal immigrants) can receive benefits on behalf of their U.S.-born children who are awarded U.S. citizenship and full welfare eligibility at birth.
The following figures include EITC:
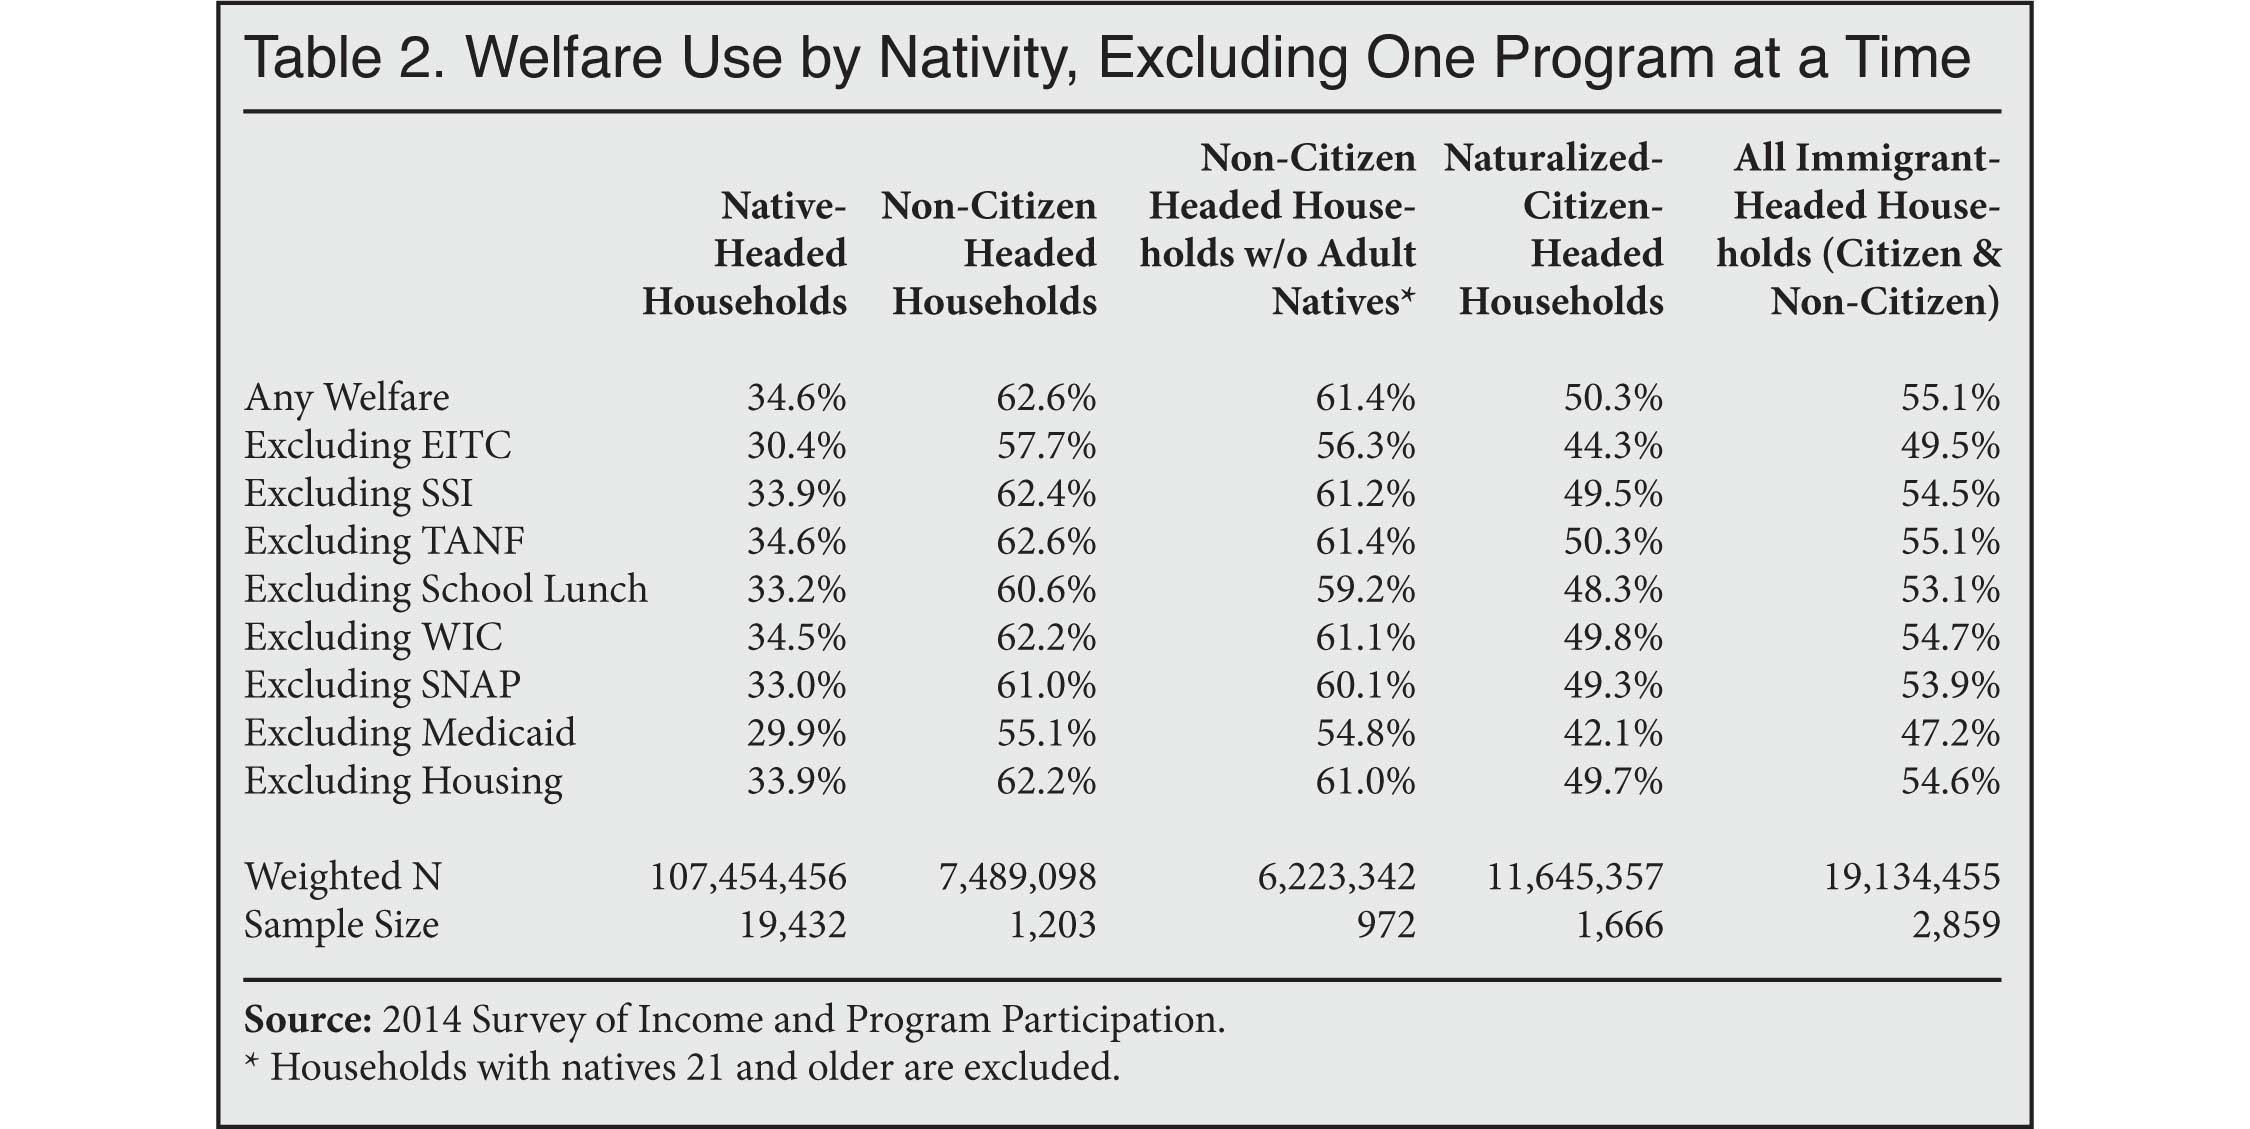
- No single program explains non-citizens' higher overall welfare use. For example, not counting school lunch and breakfast, welfare use is still 61 percent for non-citizen households compared to 33 percent for natives. Not counting Medicaid, welfare use is 55 percent for immigrants compared to 30 percent for natives.
- Welfare use tends to be high for both newer arrivals and long-time residents. Of households headed by non-citizens in the United States for fewer than 10 years, 50 percent use one or more welfare programs; for those here more than 10 years, the rate is 70 percent.
- Welfare receipt by working households is very common. Of non-citizen households receiving welfare, 93 percent have at least one worker, as do 76 percent of native households receiving welfare. In fact, non-citizen households are more likely overall to have a worker than are native households.1
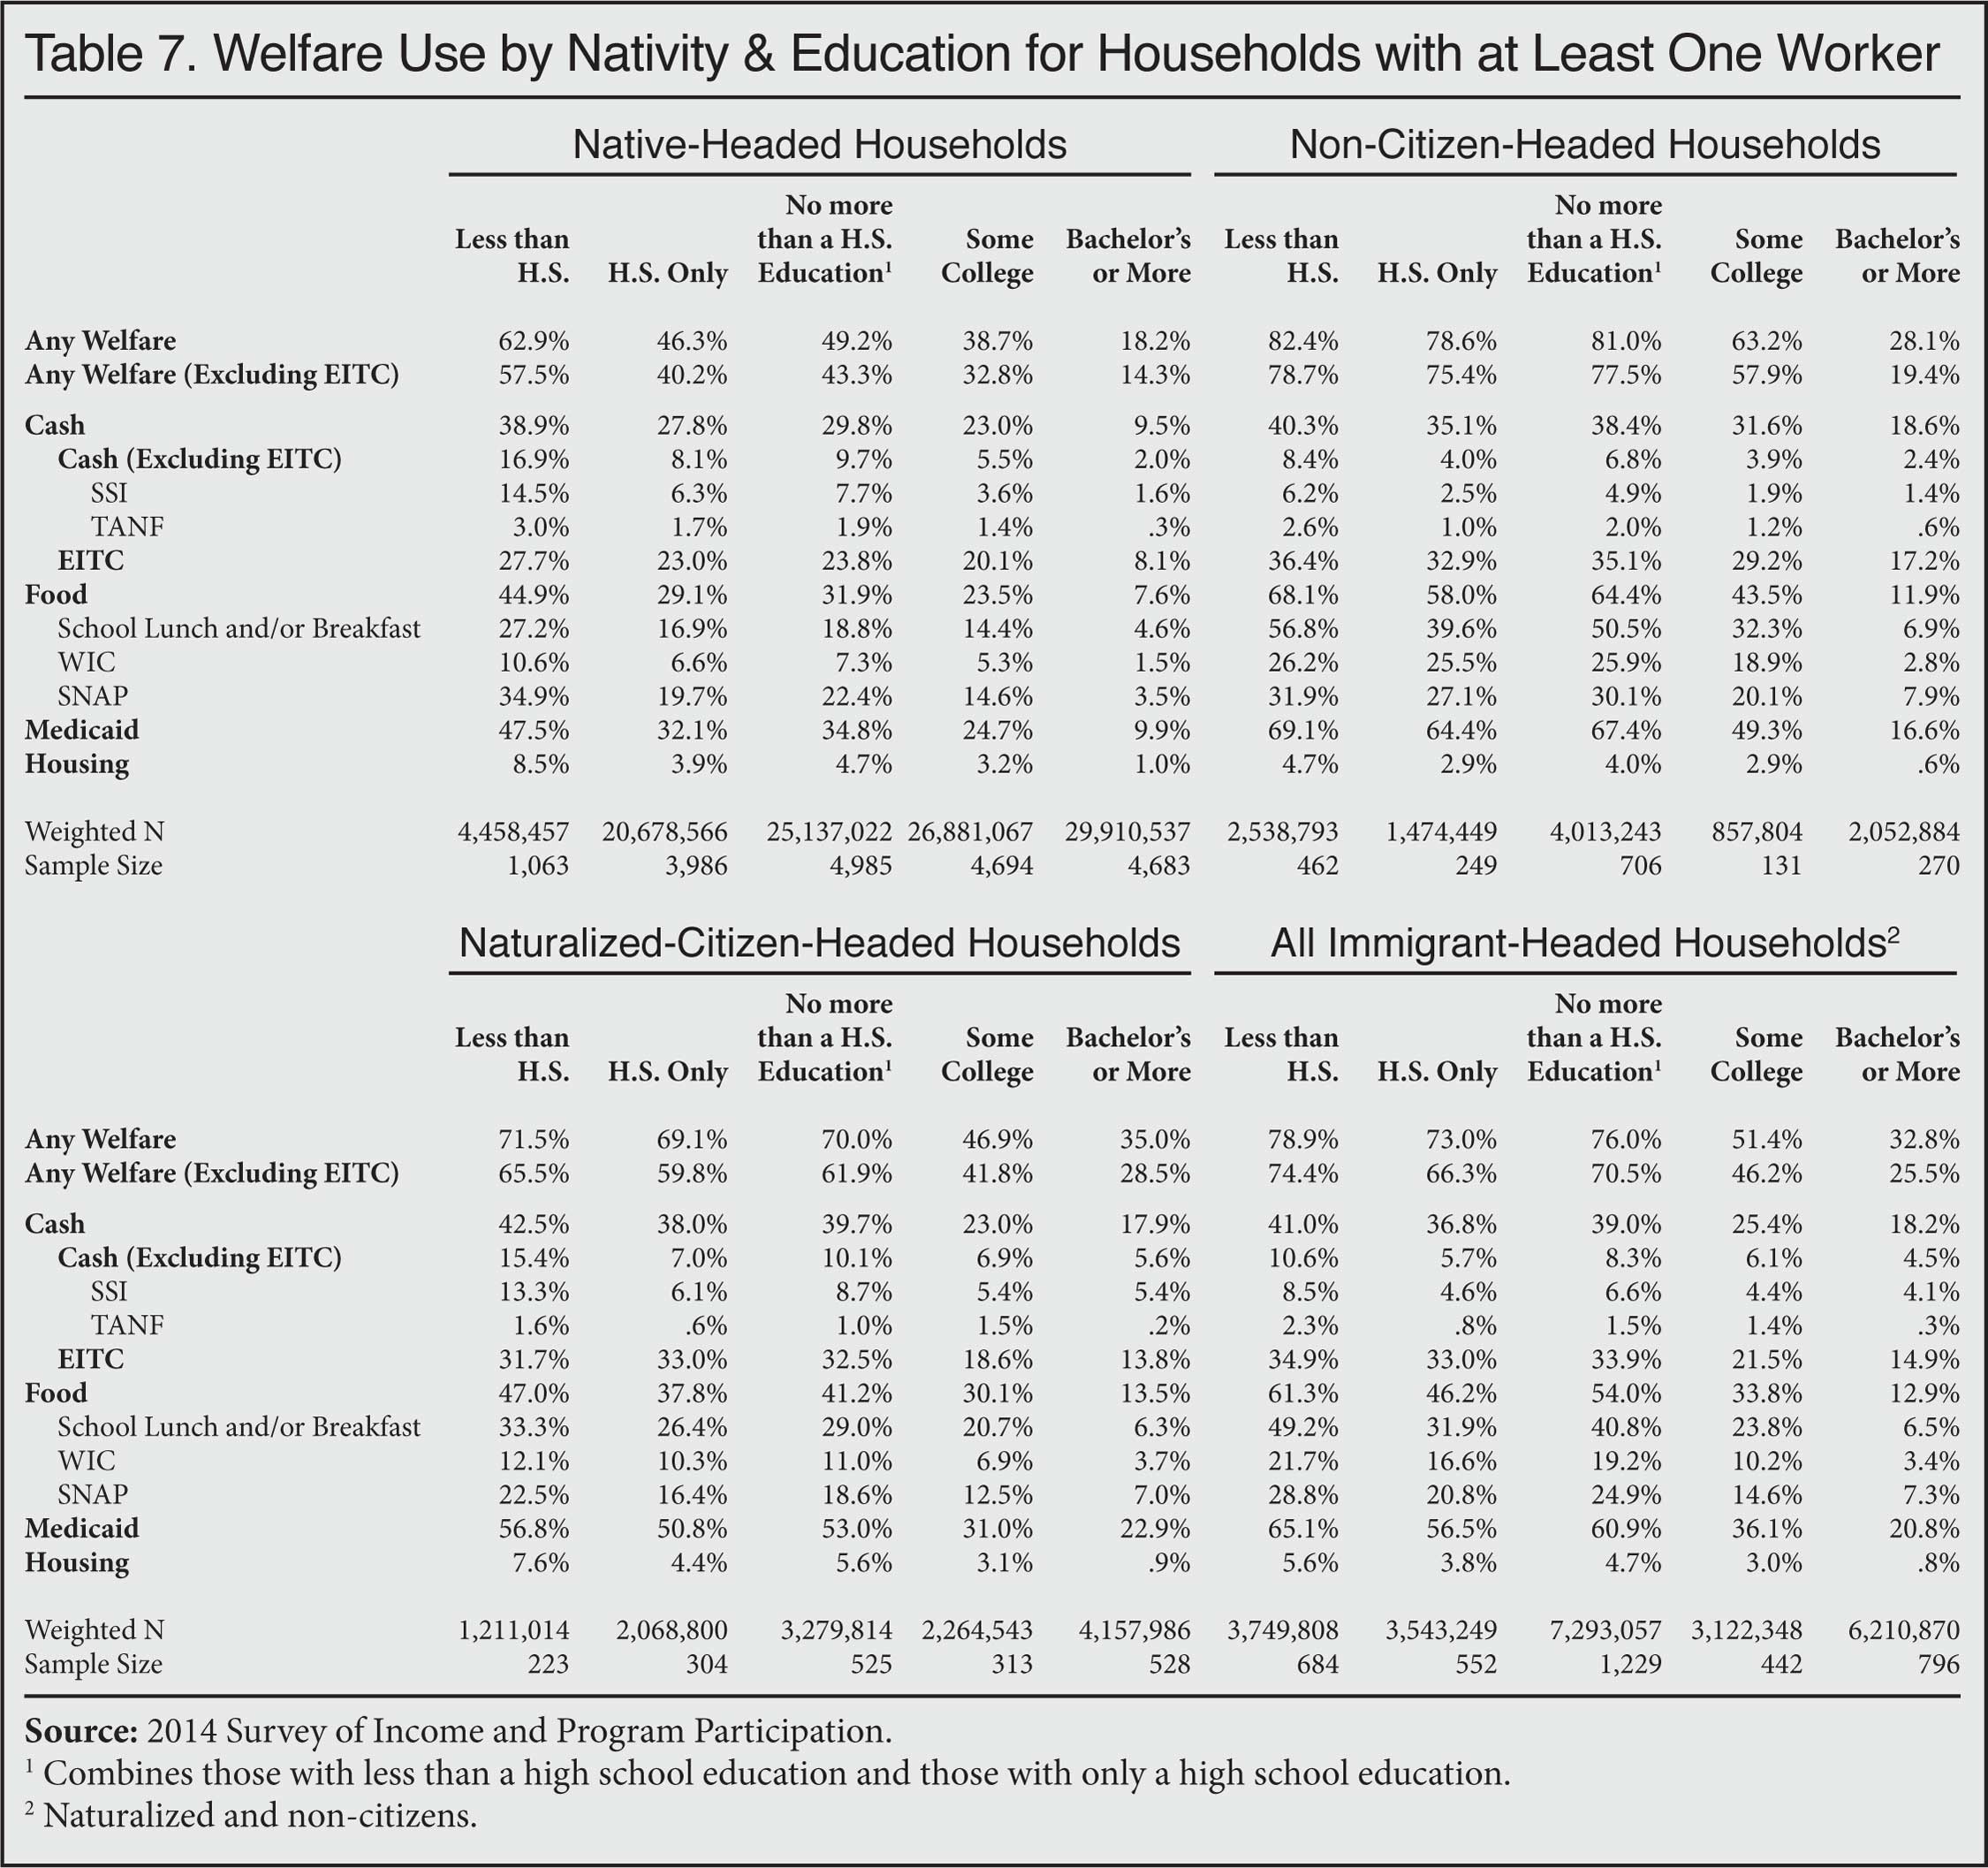
- The primary reason welfare use is so high among non-citizens is that a much larger share of non-citizens have modest levels of education and, as a result, they often earn low wages and qualify for welfare at higher rates than natives.
- Of all non-citizen households, 58 percent are headed by immigrants who have no more than a high school education, compared to 36 percent of native households.
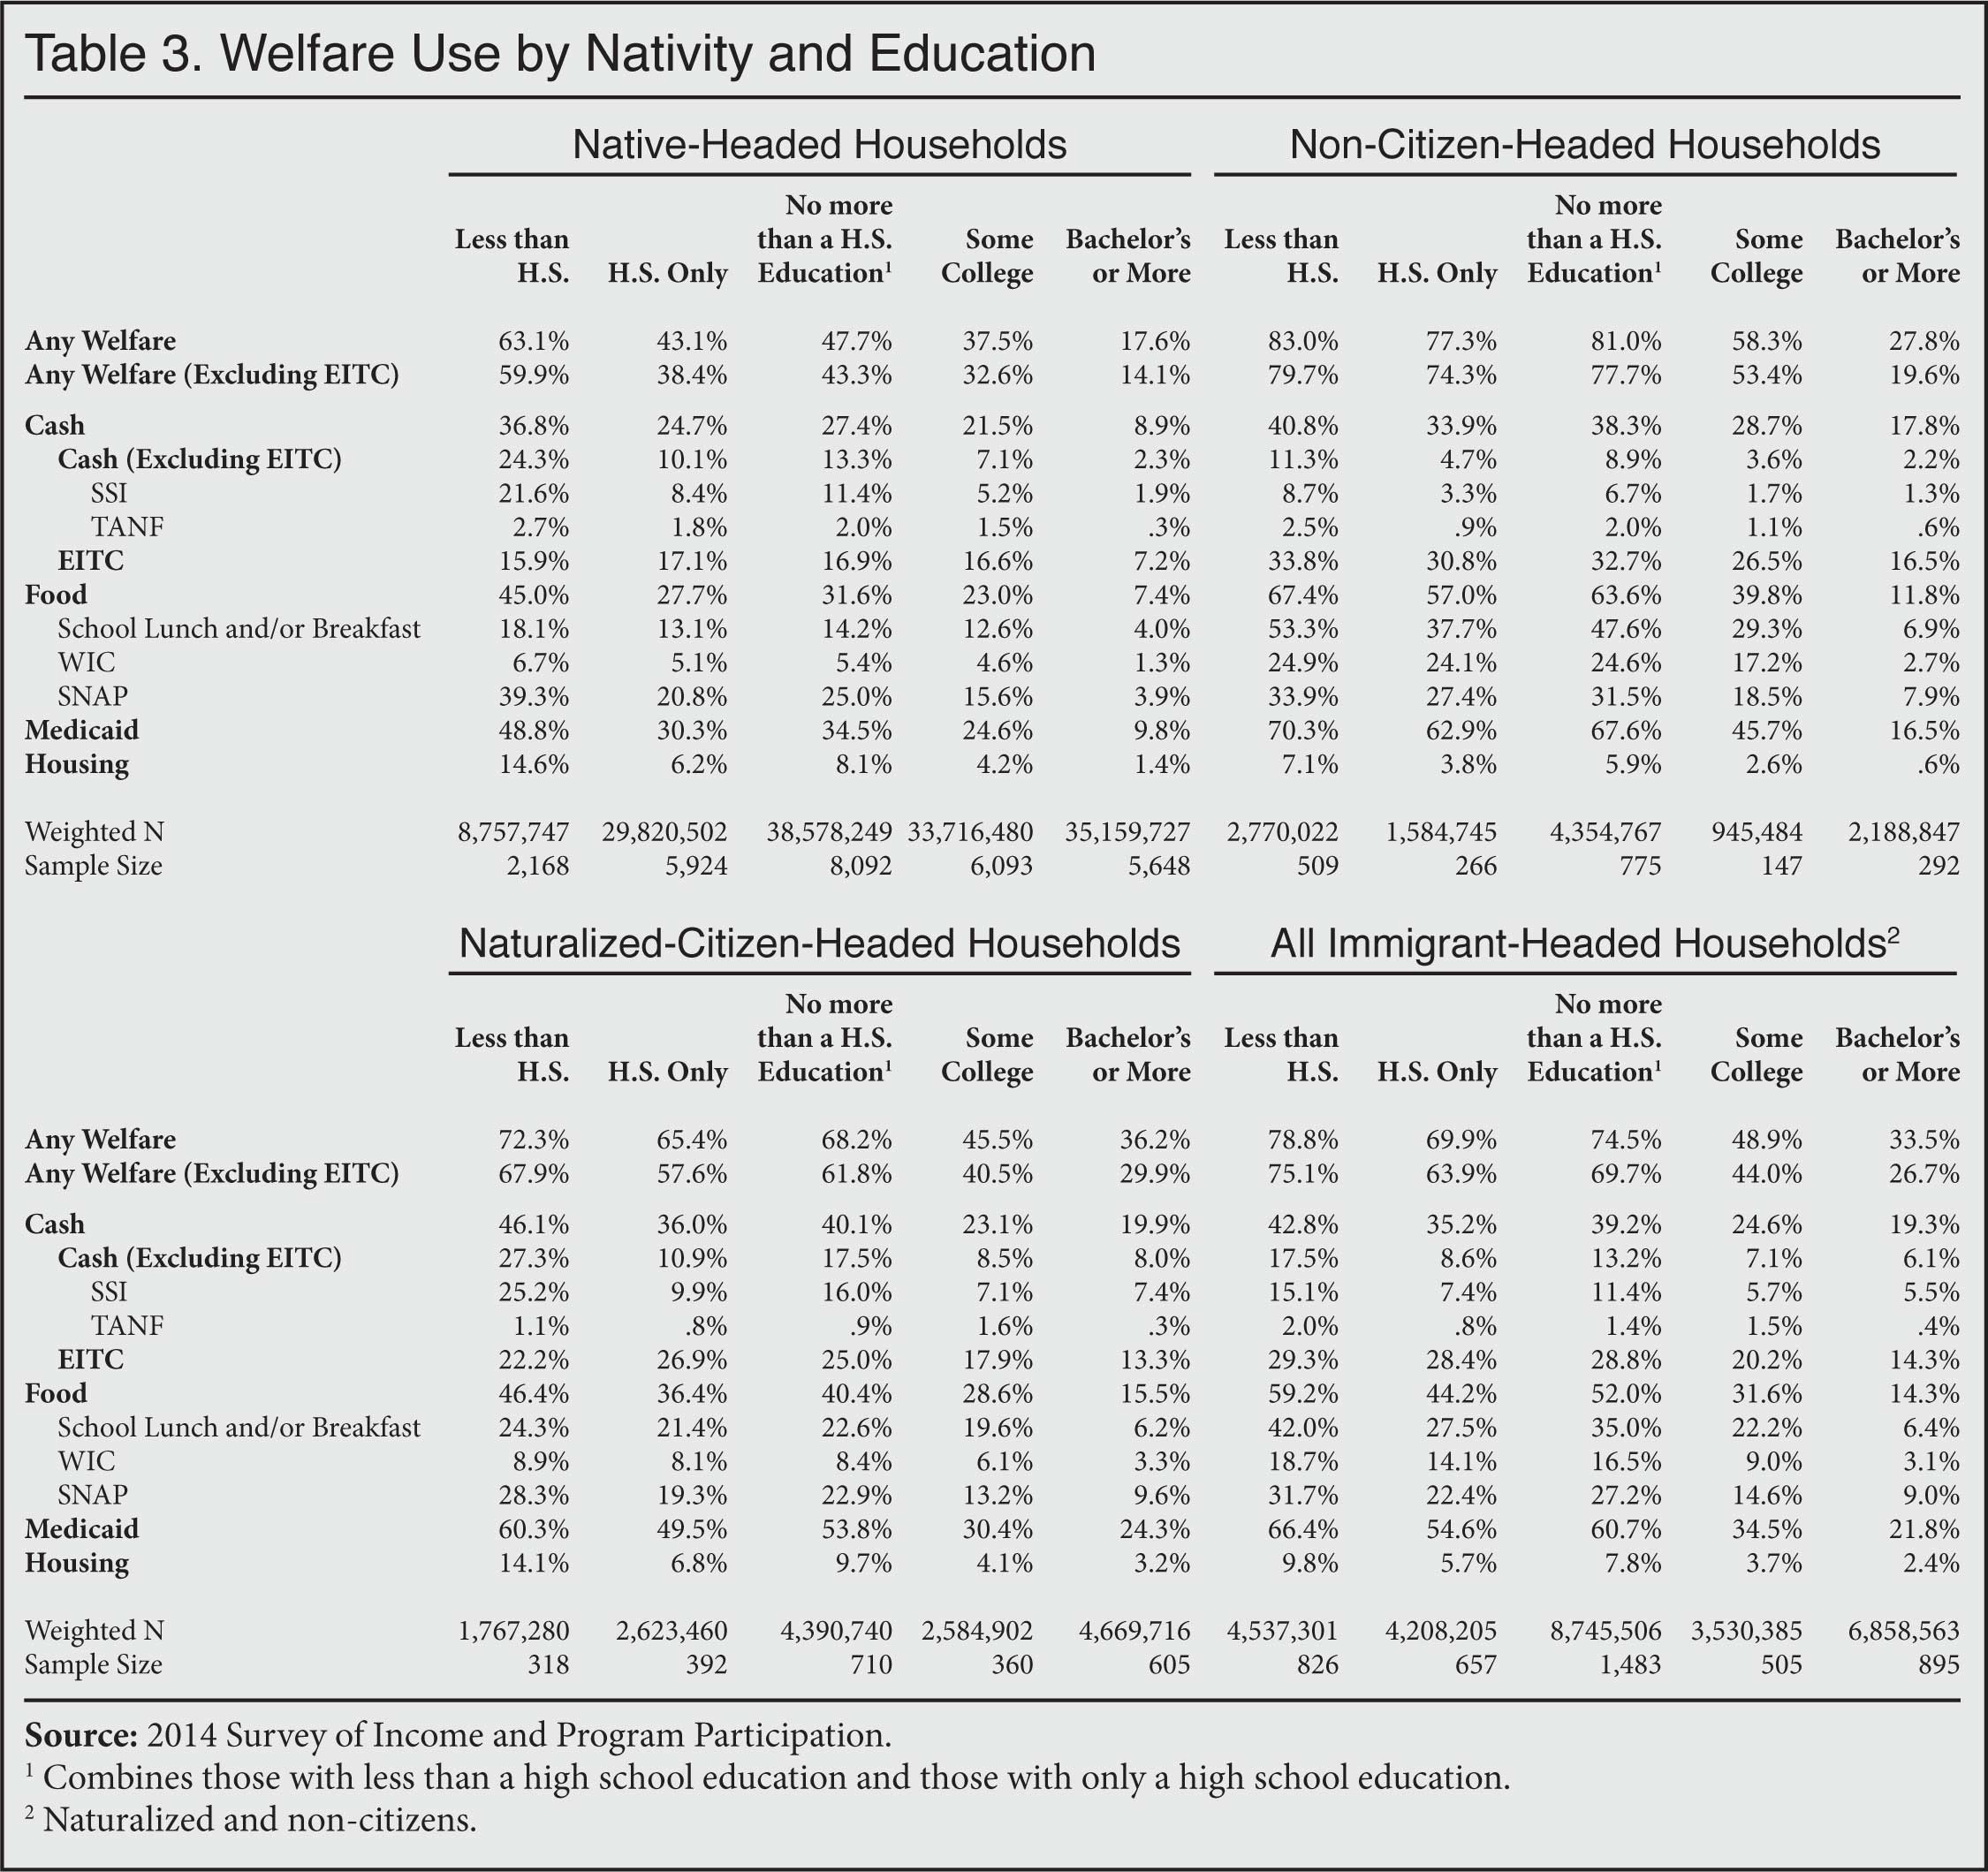
- Of households headed by non-citizens with no more than a high school education, 81 percent access one or more welfare programs. In contrast, 28 percent of non-citizen households headed by a college graduate use one or more welfare programs.
- Like non-citizens, welfare use also varies significantly for natives by educational attainment, with the least educated having much higher welfare use than the most educated.
- Using education levels and likely future income to determine the probability of welfare use among new green card applicants — and denying permanent residency to those likely to utilize such programs — would almost certainly reduce welfare use among future permanent residents.
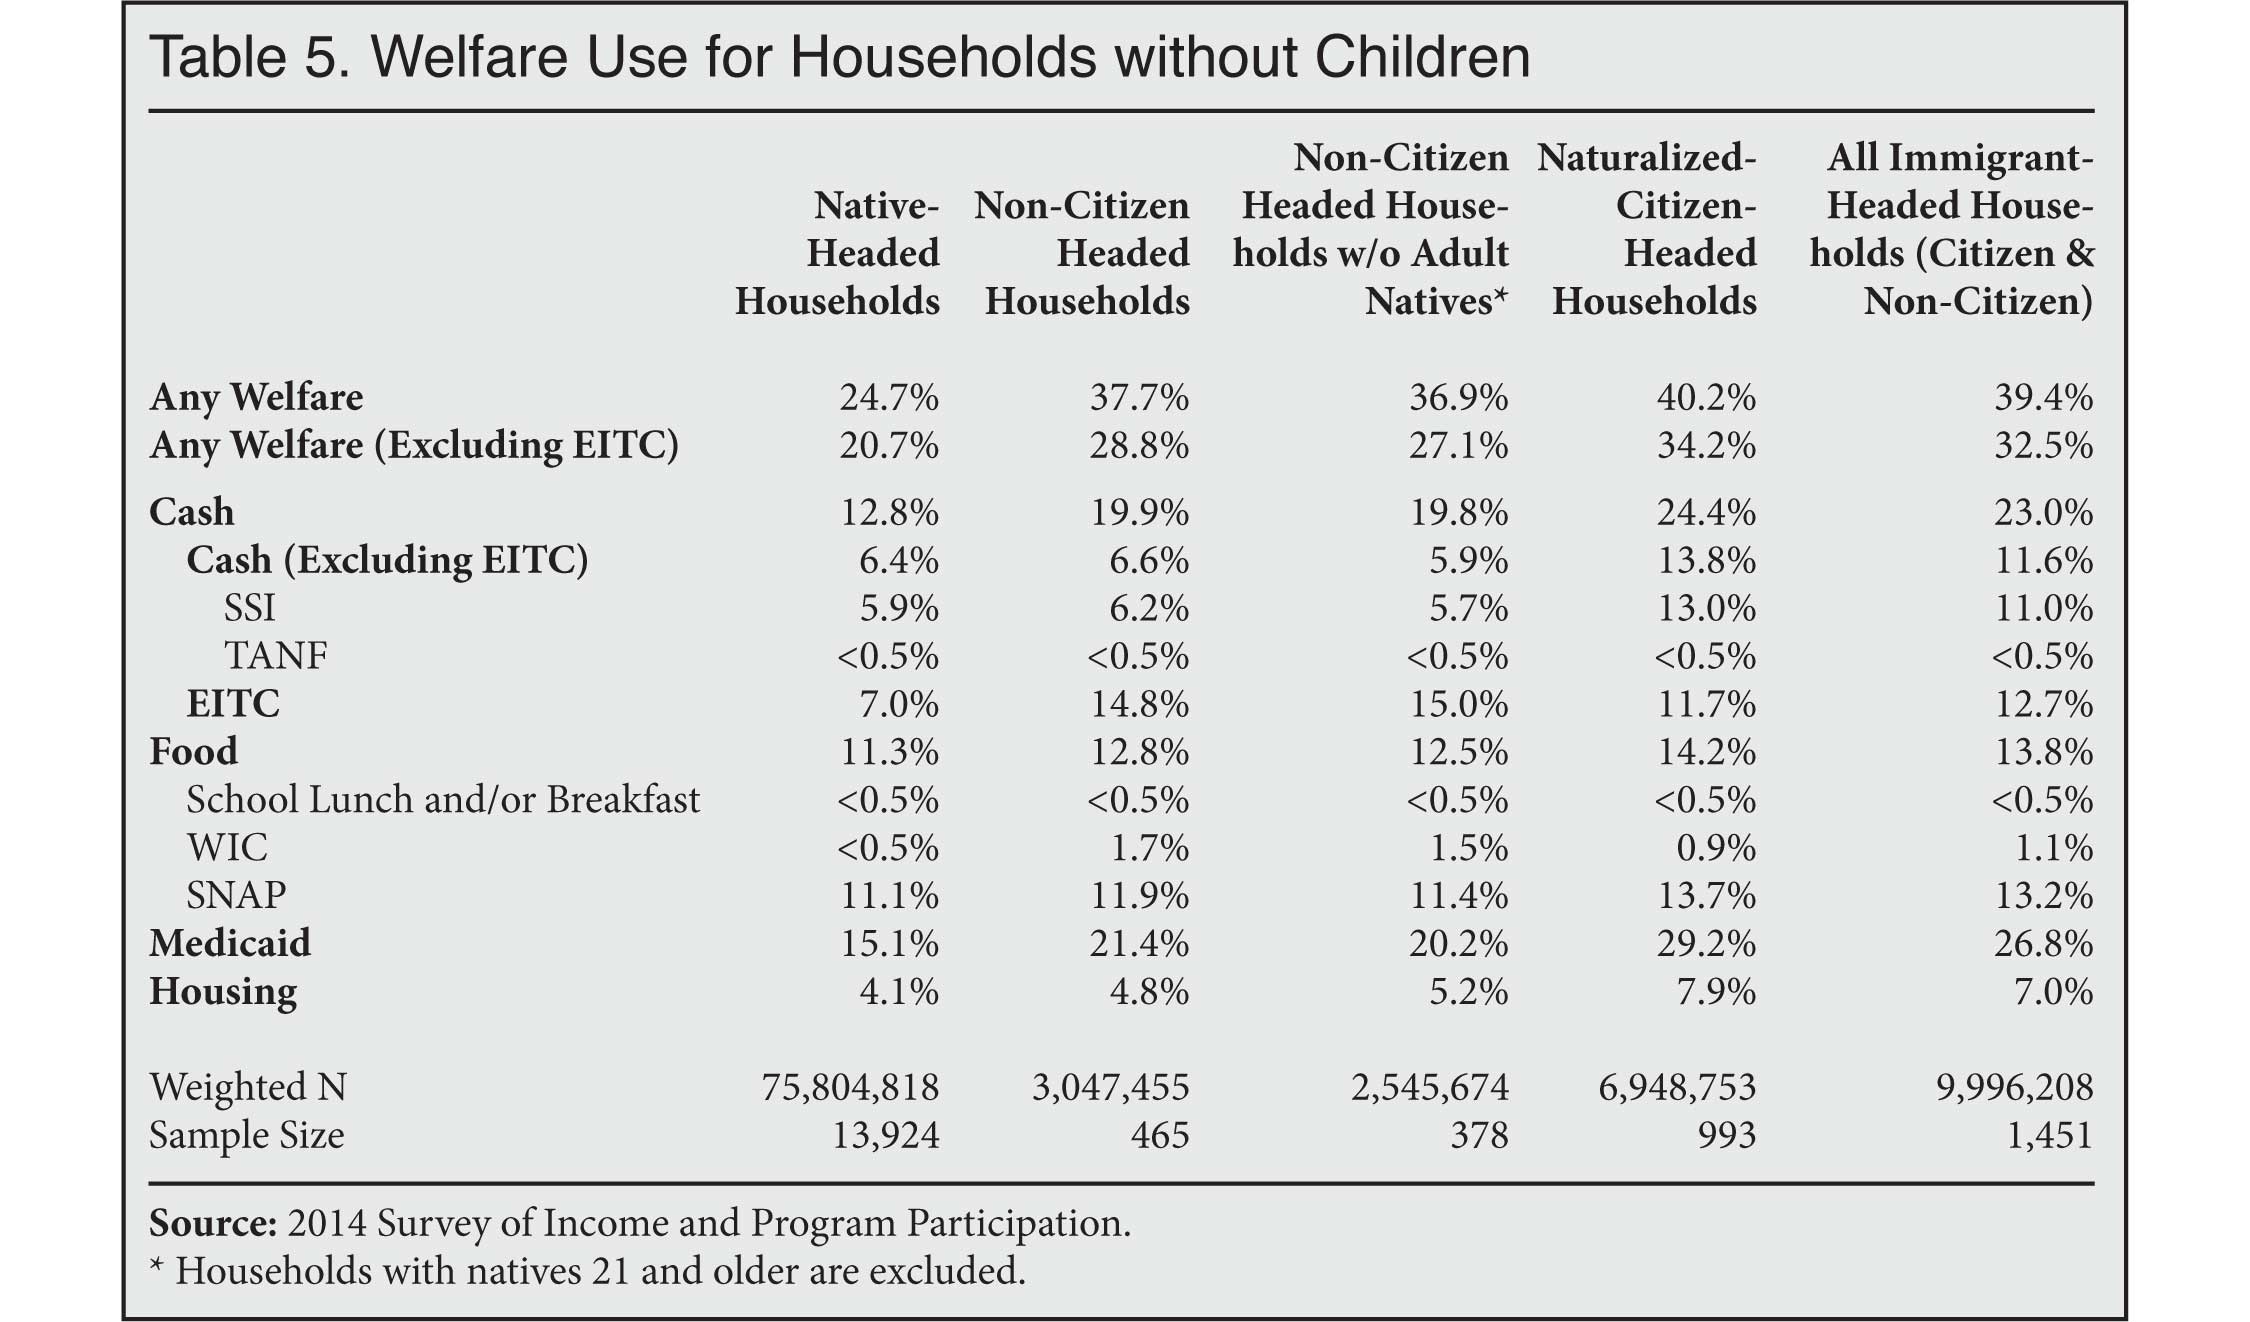
- Of households headed by naturalized immigrants (U.S. citizens), 50 percent used one or more welfare programs. Naturalized-citizen households tend to have lower welfare use than non-citizen households for most types of programs, but higher use rates than native households for virtually every major program.
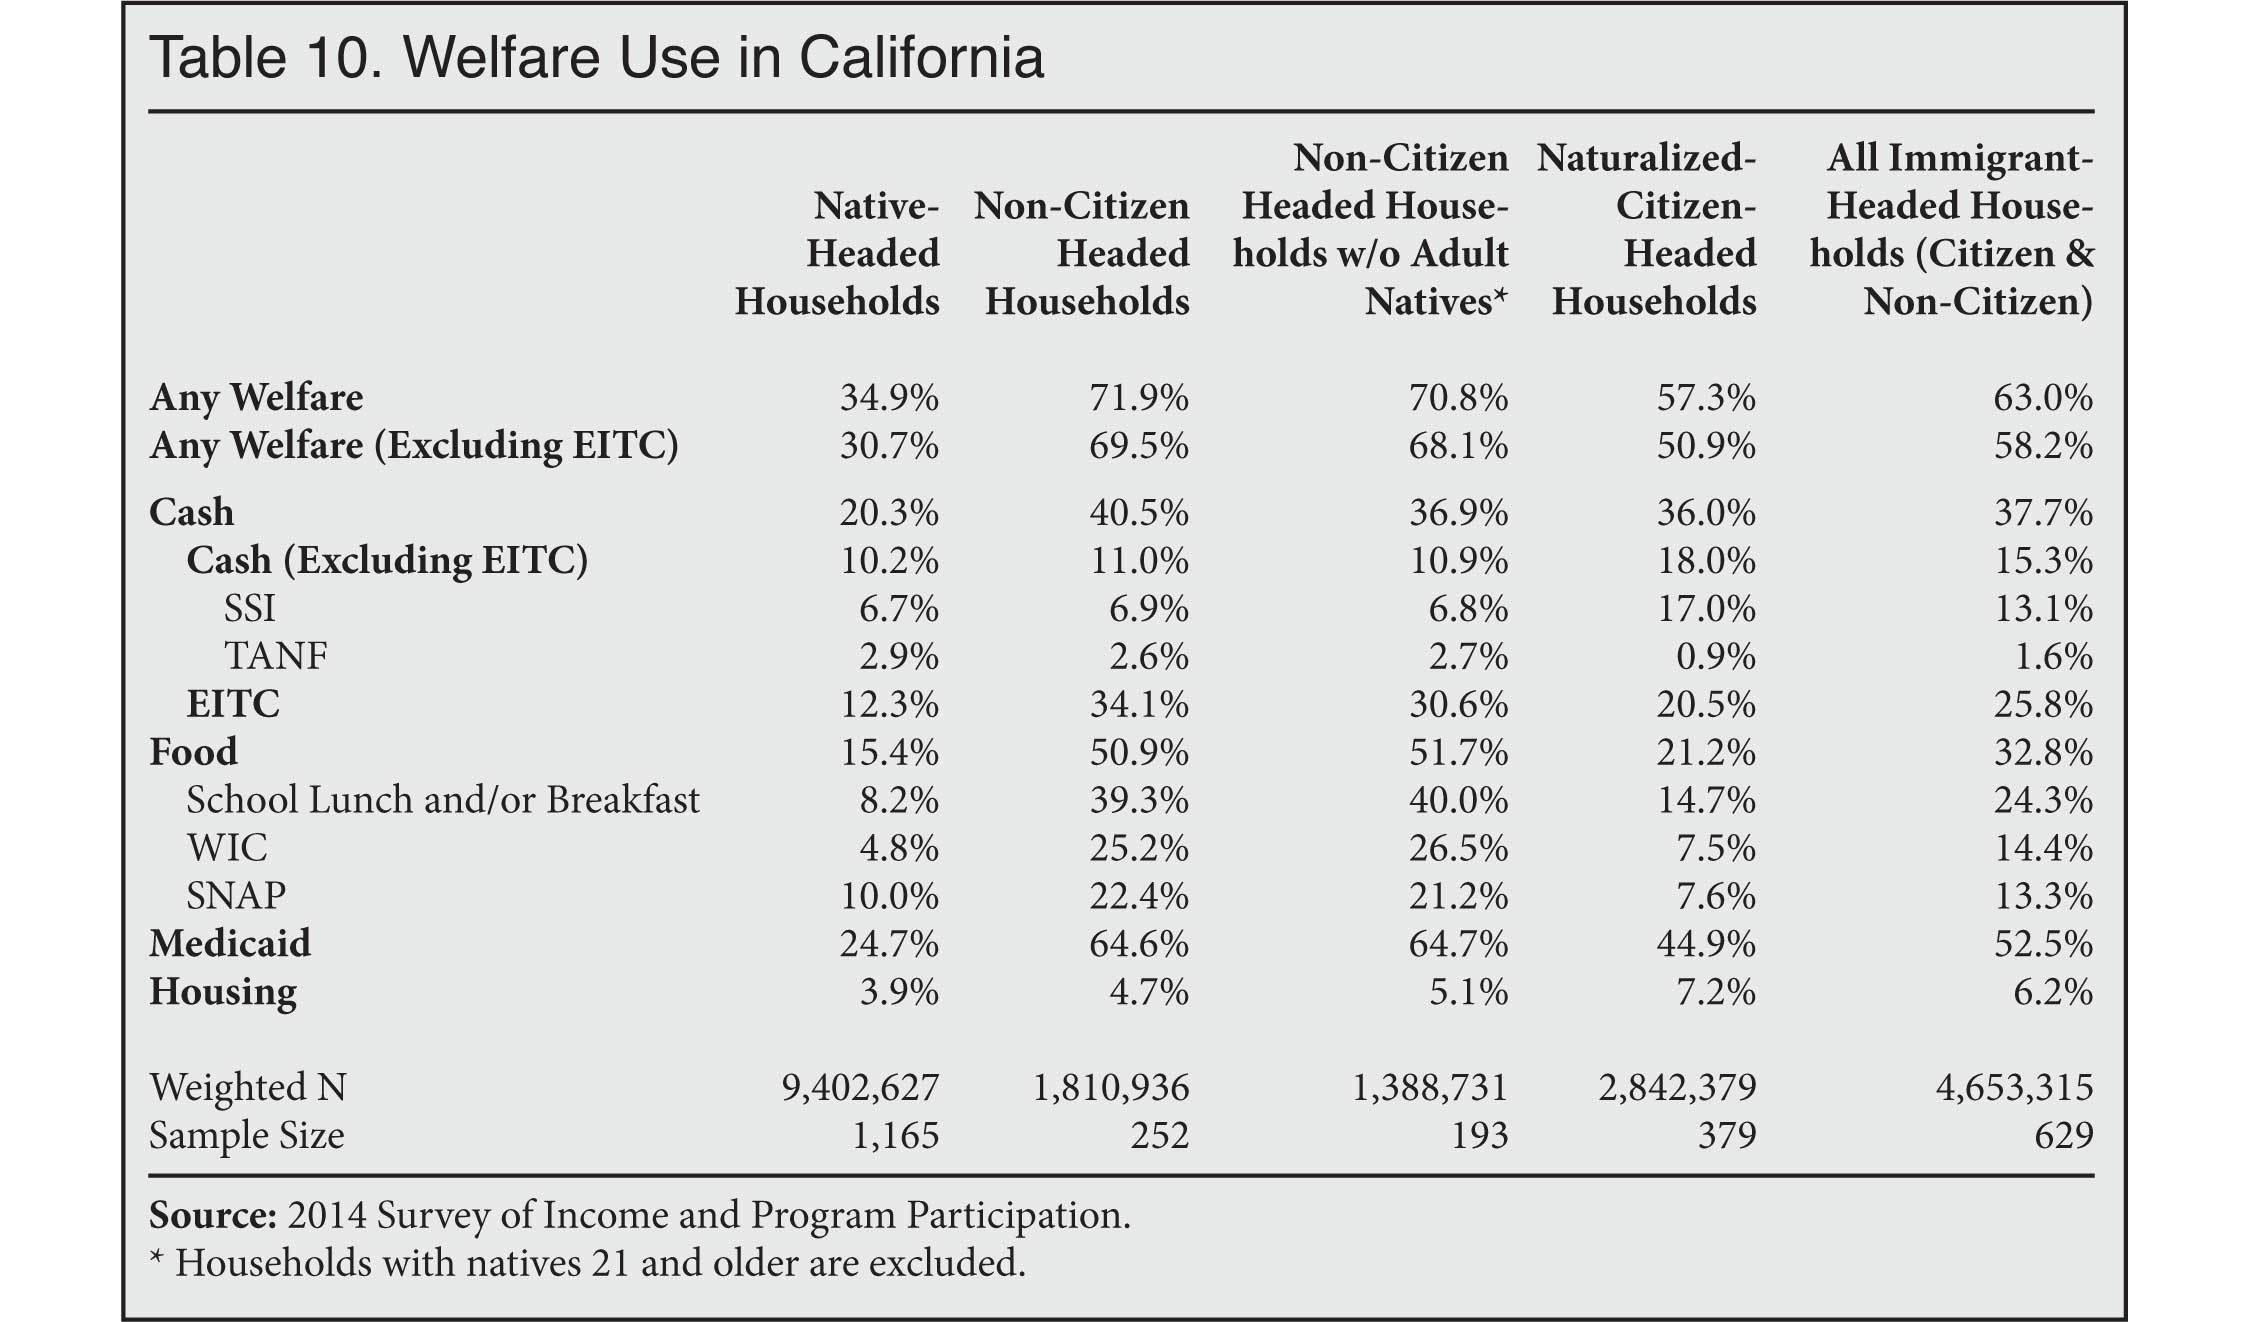
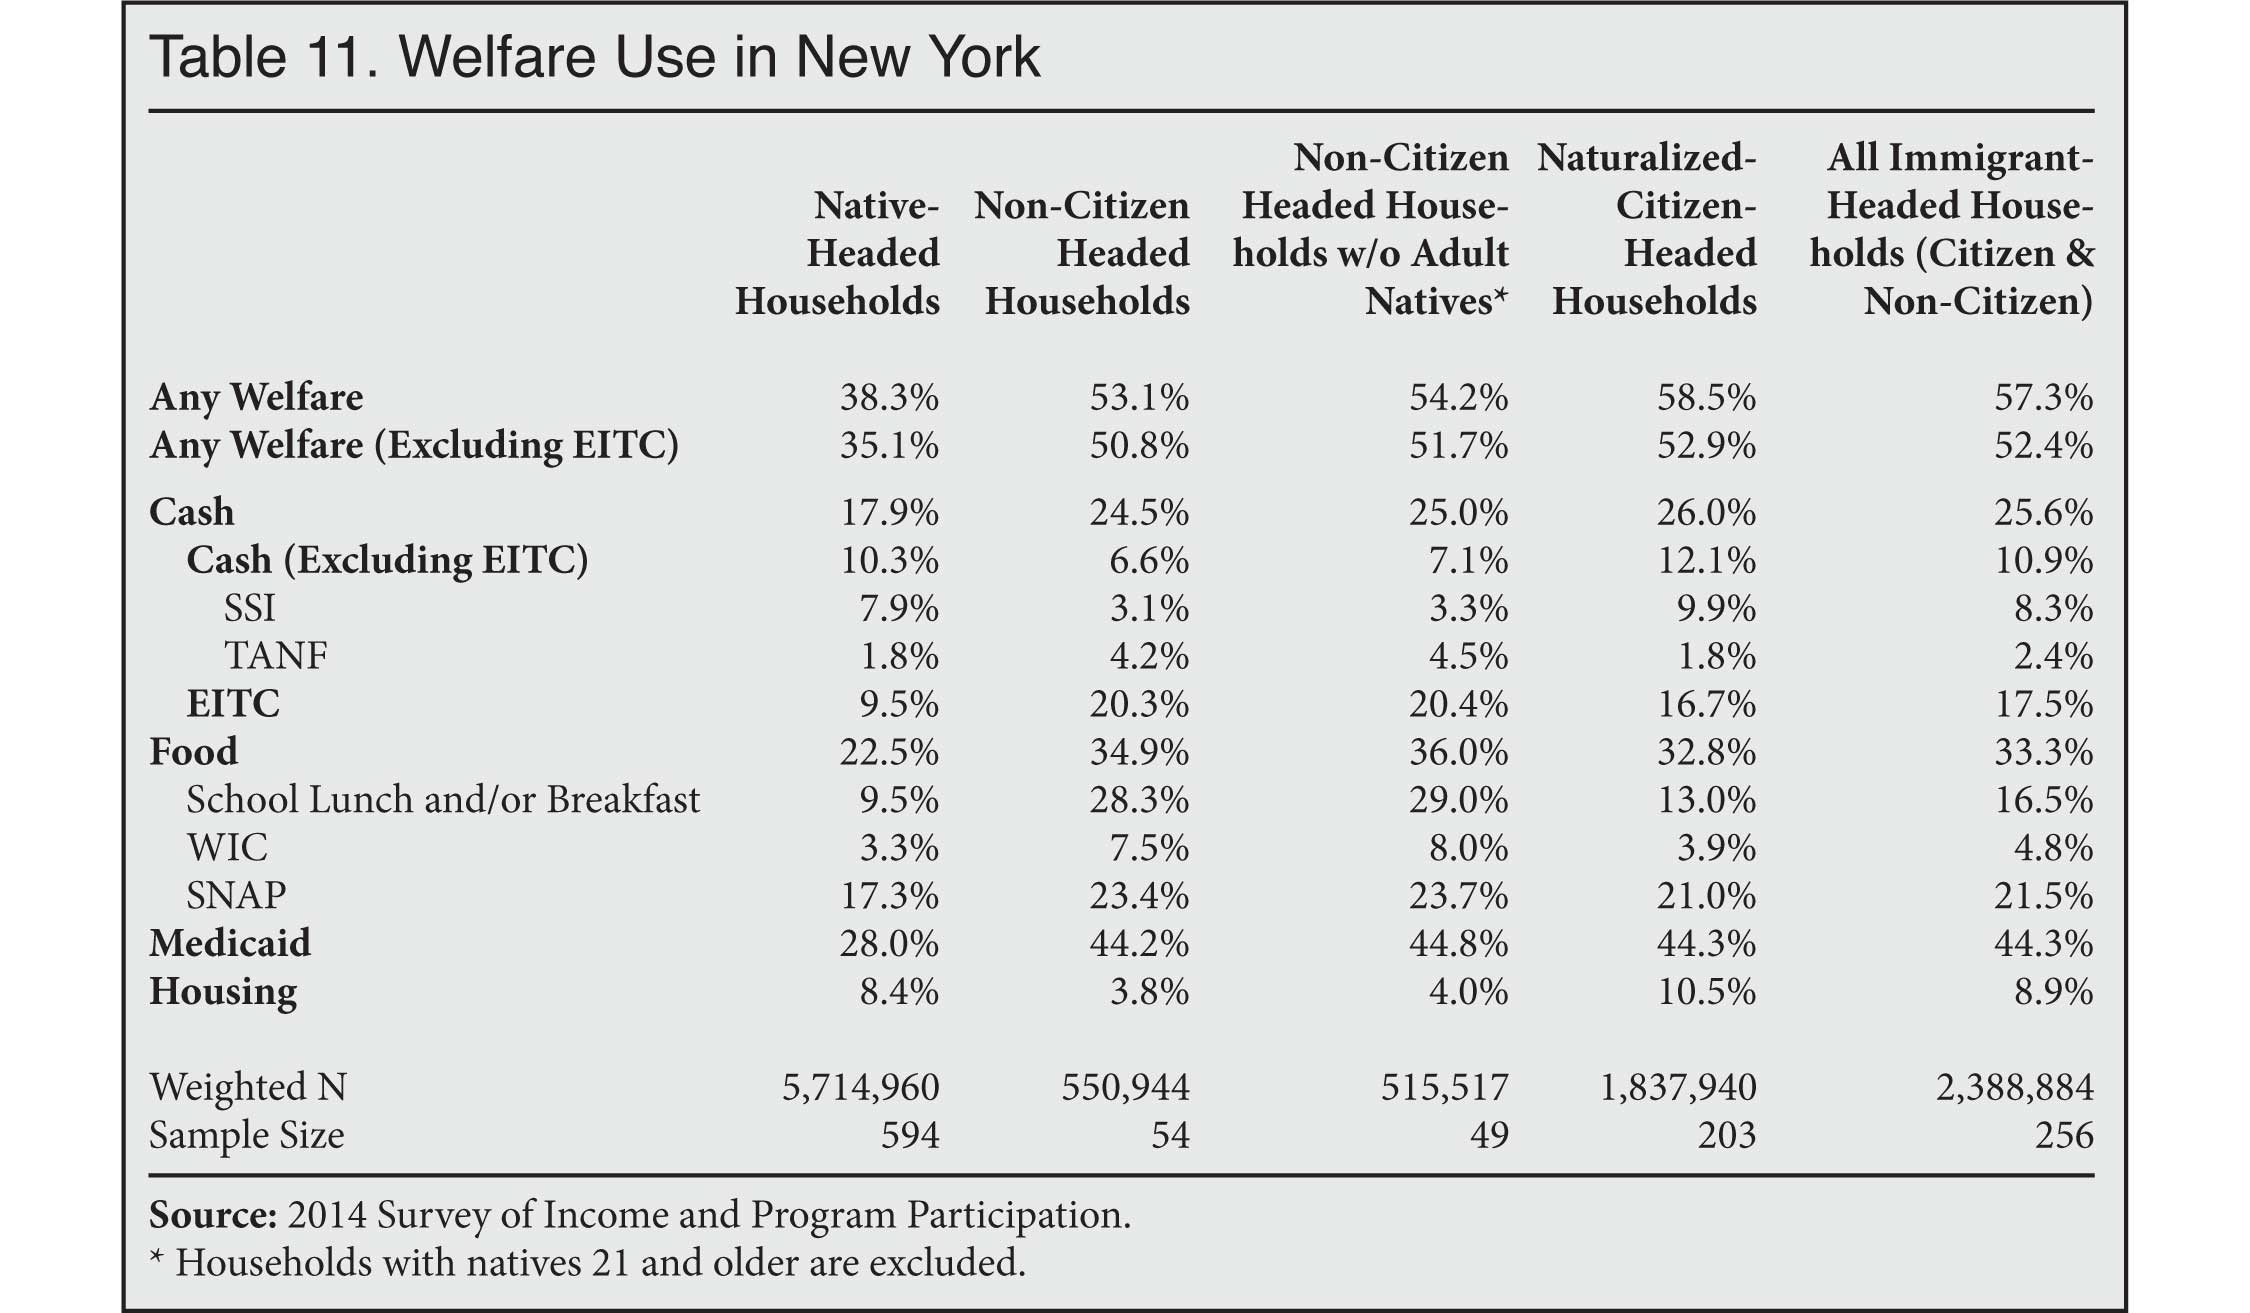
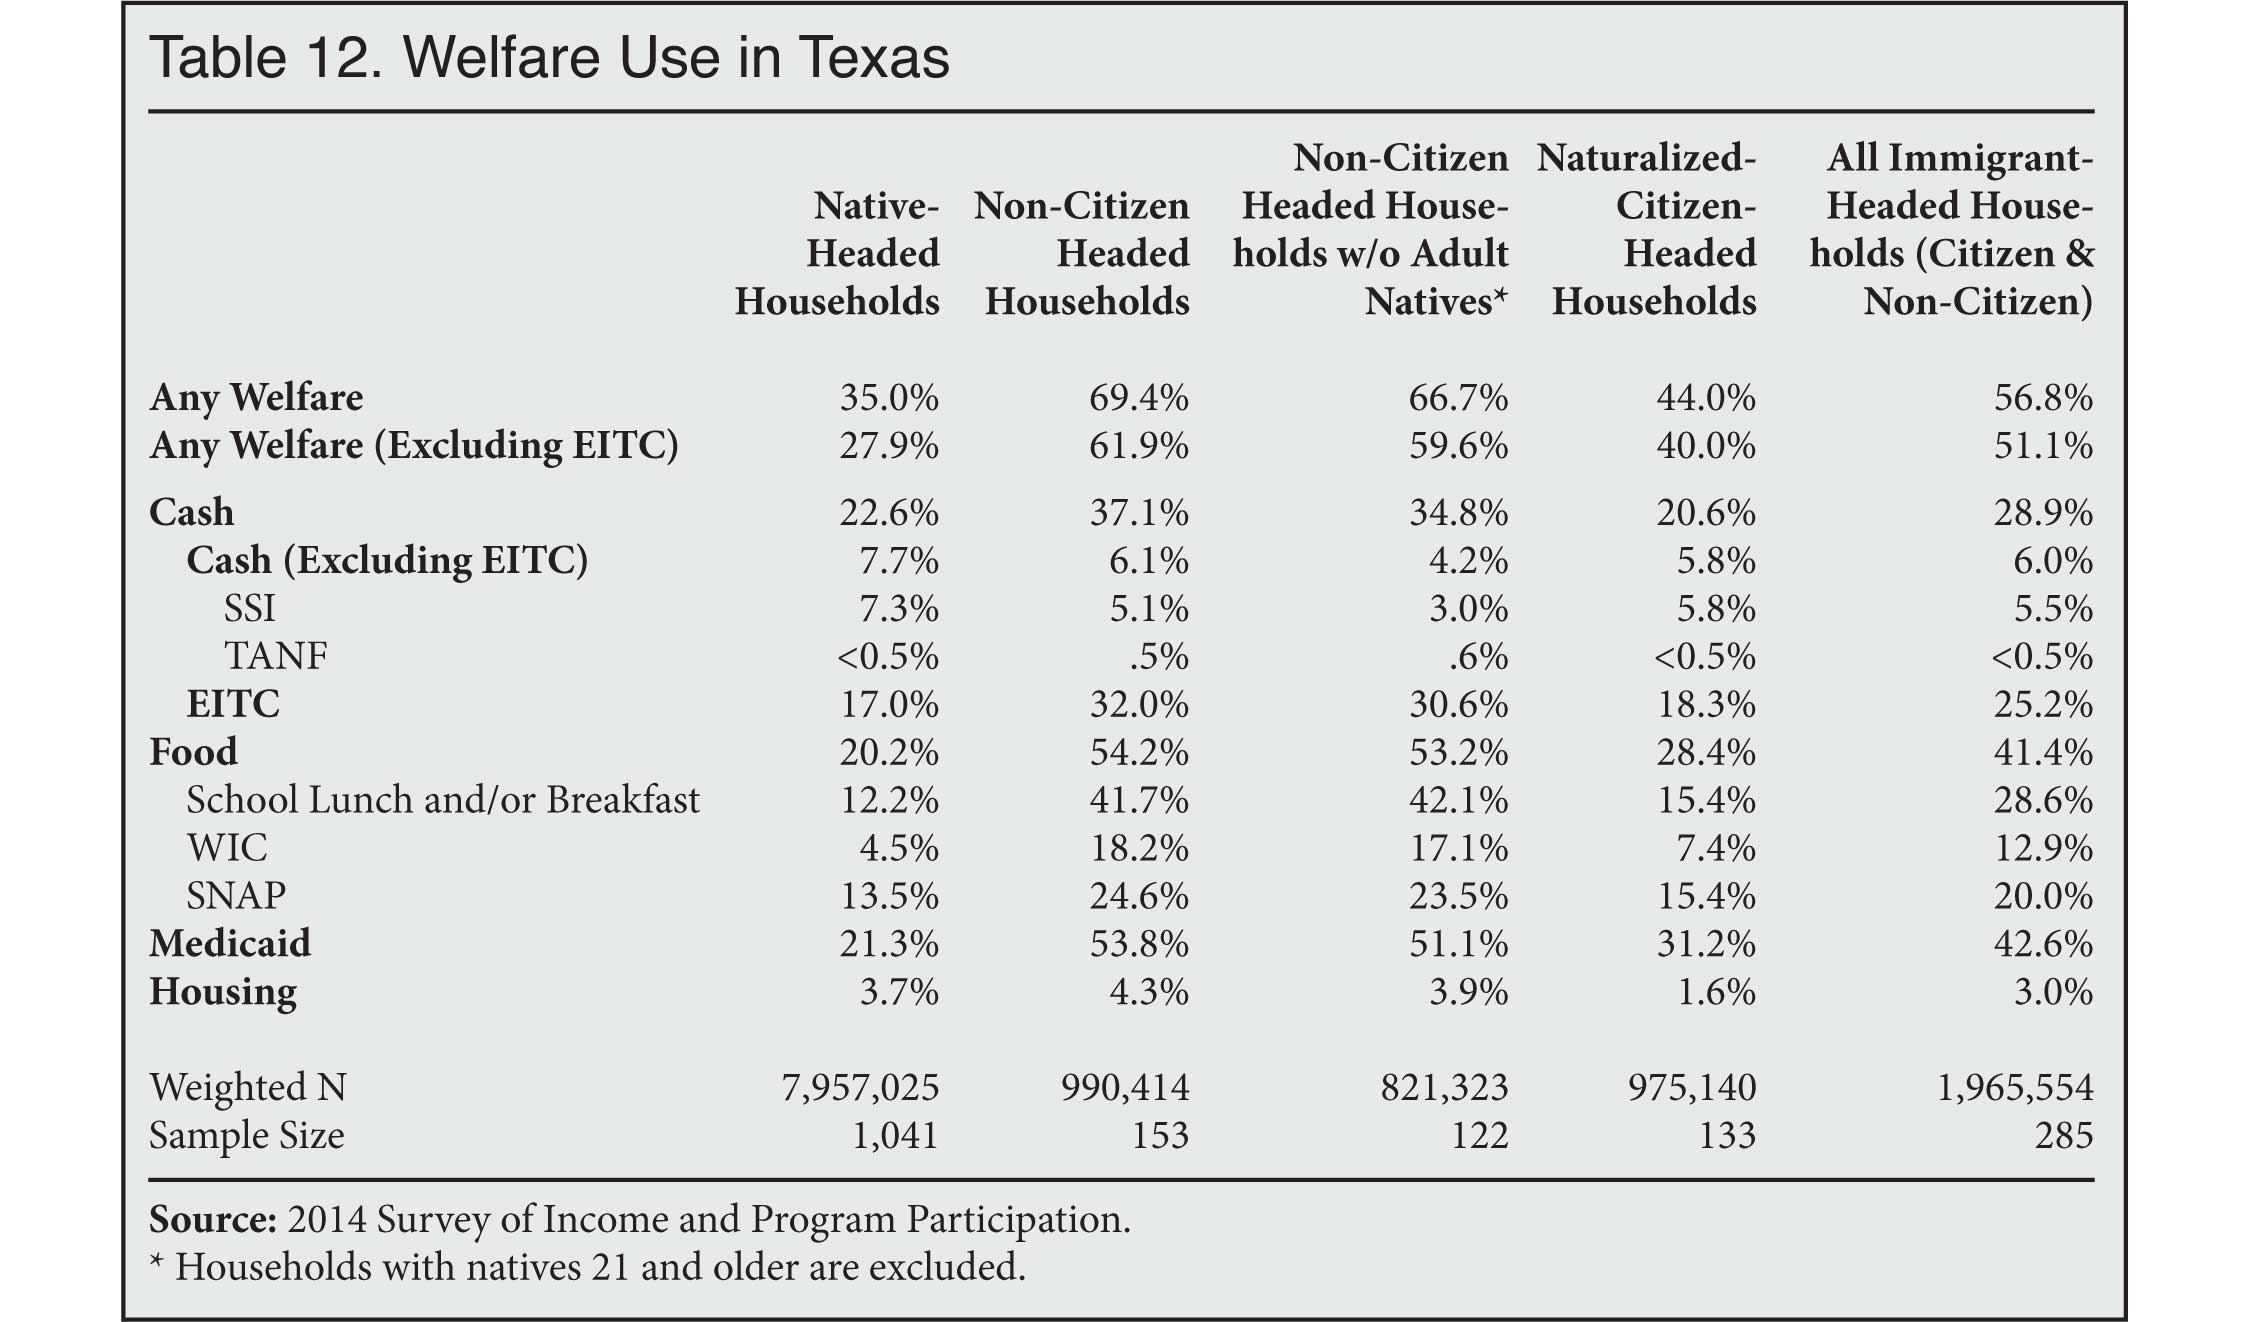
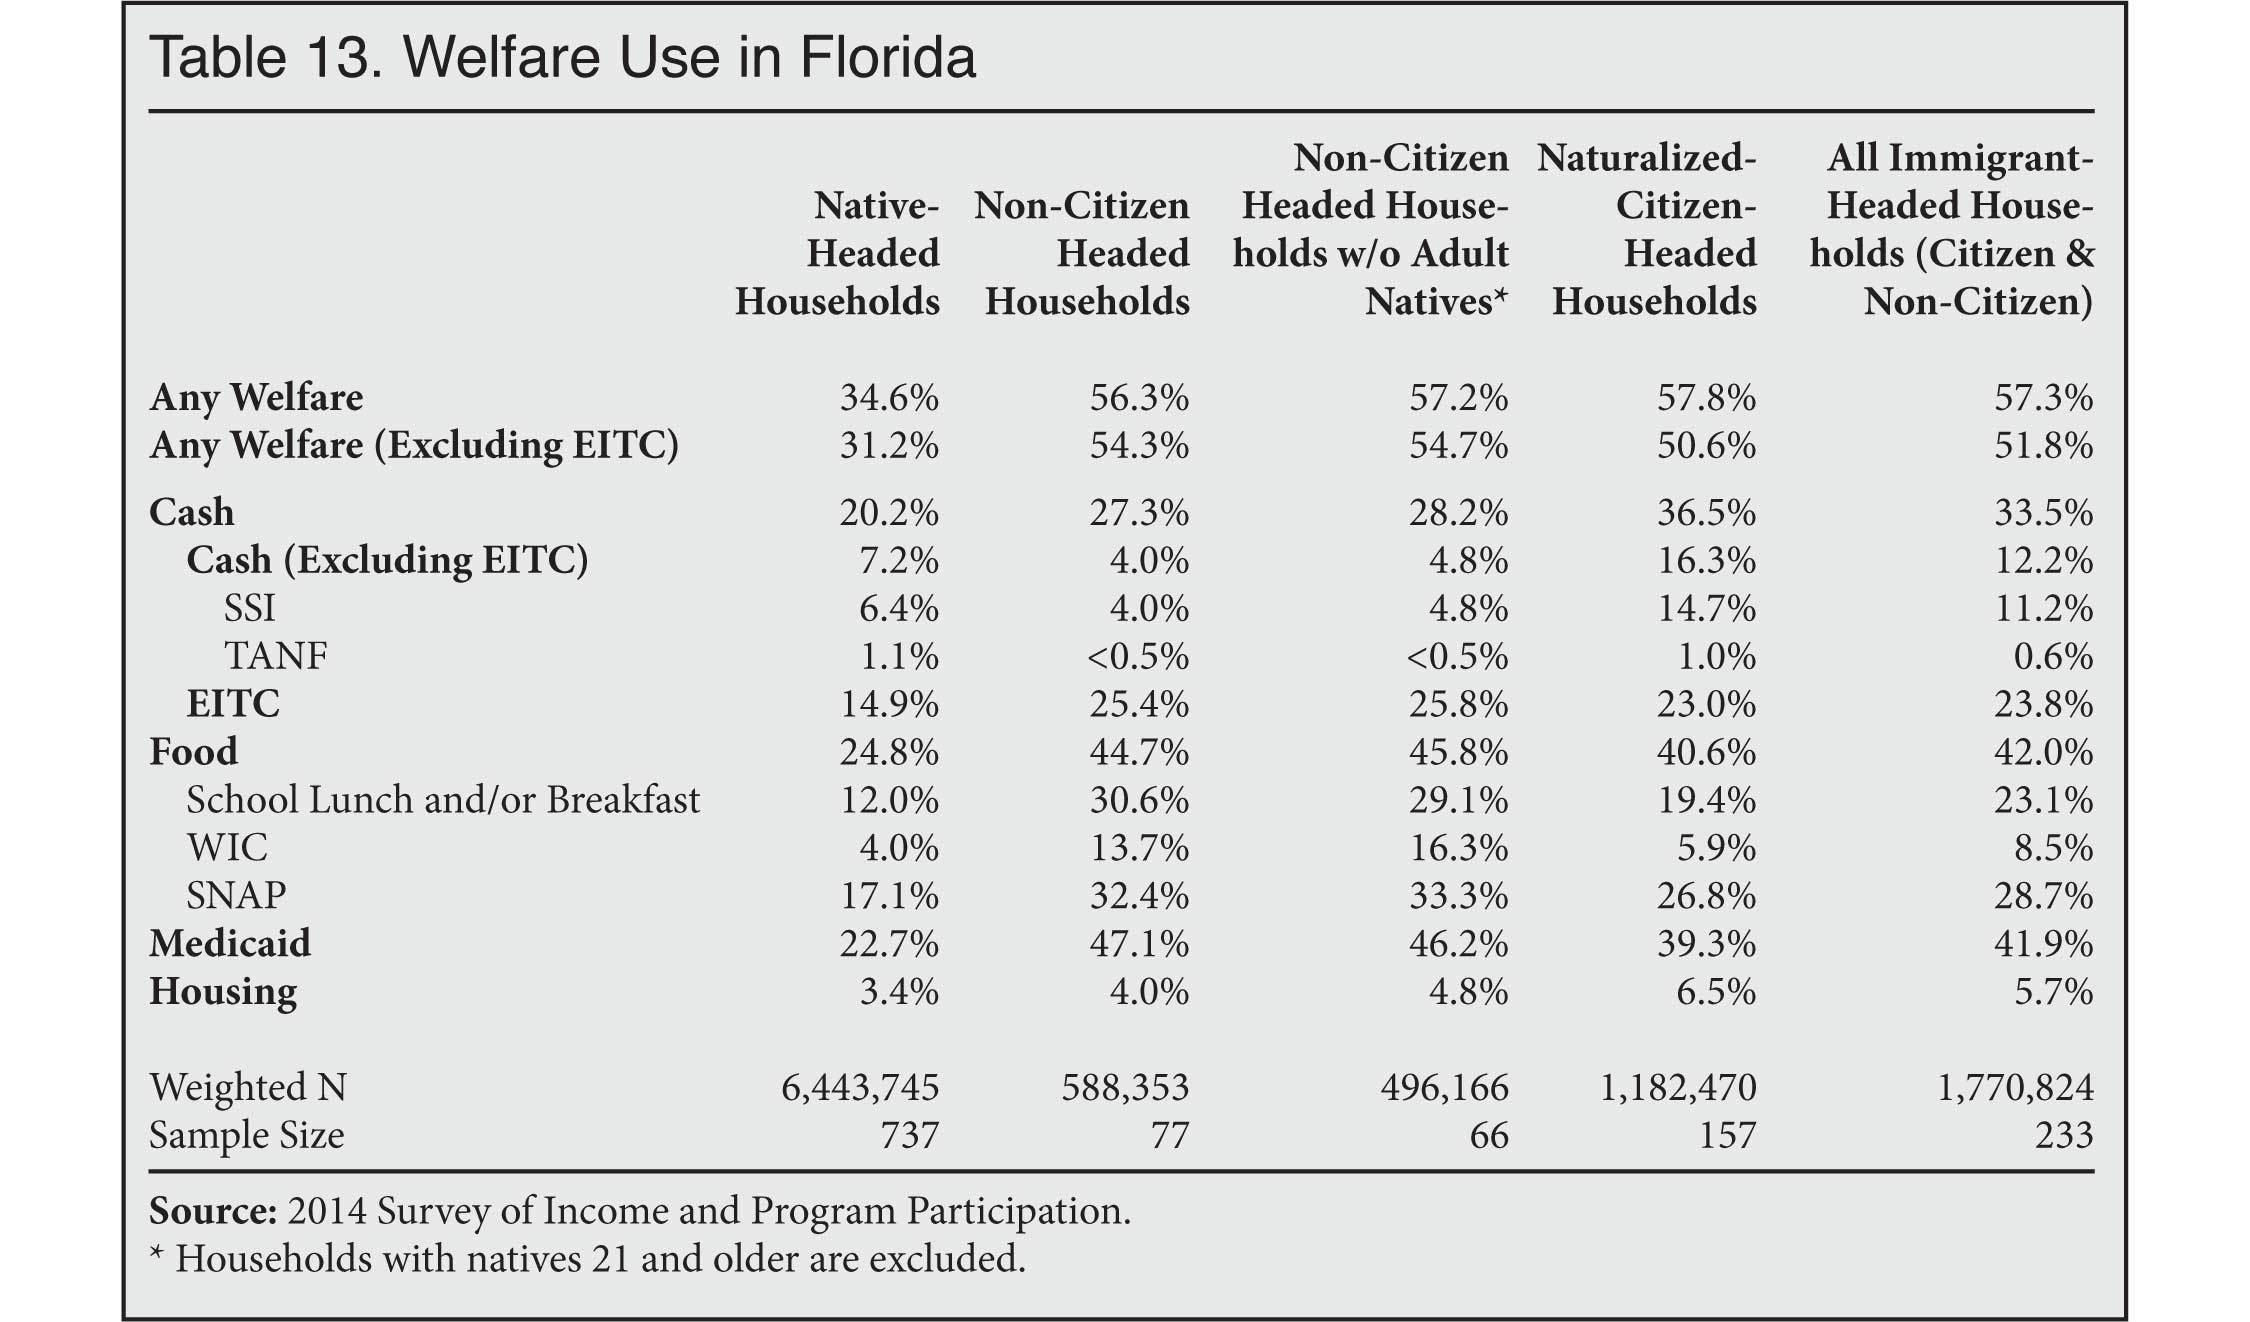
- Welfare use is significantly higher for non-citizens than for natives in all four top immigrant-receiving states. In California, 72 percent of non-citizen-headed households use one or more welfare programs, compared to 35 percent for native-headed households. In Texas, the figures are 69 percent vs. 35 percent; in New York they are 53 percent vs. 38 percent; and in Florida, 56 percent of non-citizen-headed households use at least welfare program, compared to 35 percent of native households.
Methods
Programs Examined. The major welfare programs examined in this report are Supplemental Security Income (SSI), Temporary Assistance to Needy Families (TANF), the Earned Income Tax Credit (EITC), the Women, Infants, and Children (WIC) food program, free or subsidized school lunch and breakfast, food stamps (officially called the Supplemental Nutrition Assistance Program or SNAP), Medicaid, public housing, and rent subsidies.
Data Source. Data for this analysis comes from the public-use file of the 2014 Survey of Income and Program Participation (SIPP), which is the newest SIPP data available.2 The SIPP is a longitudinal dataset consisting of a series of "panels". Each panel is a nationally representative sample of U.S. households that is followed over several years. The survey was redesigned for 2013 with 2014 as the second wave of the new panel. We use the 2014 SIPP for this analysis. Like all Census surveys of this kind, welfare use is based on self-reporting in the SIPP, and as such there is some misreporting in the survey. All means and percentages are calculated using weights provided by the Census Bureau.
Why Use the SIPP? The SIPP is ideally suited for studying welfare programs because, unlike other Census surveys that measure welfare, the SIPP was specifically designed for this purpose. As the Census Bureau states on its website, the purpose of the SIPP is to "provide accurate and comprehensive information about the income and program participation of individuals and households."3 In addition to the SIPP, the only other government surveys that identify immigrants and at the same time measure welfare use for the entire population are the American Community Survey (ACS) and the Current Population Survey's Annual Social and Economic Supplement, often abbreviated as CPS ASEC or just ASEC. The ACS is a very large survey, but only asks about a few programs. The ASEC is released on a more timely basis than the SIPP and asks about more programs than the ACS, but it does not include the EITC; the ASEC also is not specifically designed to capture receipt of welfare programs. As we discuss at length in a prior study published in 2015, based on 2012 SIPP data, there is general agreement among researchers that the SIPP does a better job of capturing welfare use than other Census Bureau surveys, including the ASEC and ACS.4 More recent analysis confirms this conclusion.5
One recent improvement in the SIPP that was not available when we conducted our 2015 study is the inclusion of a question on use of the EITC, making for even more complete coverage of the nation's welfare programs. The EITC is by far the nation's largest cash program to low-income workers, paying out nearly $60 billion in 2014.6 Unfortunately for immigration research, the SIPP survey for 2014 no longer asks respondents about their current immigration status.7 As other researchers have pointed out, individuals in prior SIPPs who are non-citizens and report that they are currently not permanent residents are almost entirely illegal immigrants, with a modest number of long-term temporary visitors (e.g., guestworkers and foreign students) also included.8
As we showed in our 2015 analysis using the 2012 SIPP, 66 percent of households headed by non-citizens who do not have a green card, and who are mostly illegal immigrants, have very high welfare use rates — excluding the EITC.9 With the new 2014 SIPP, we can no longer identify likely illegal immigrants with the same ease. However, we do know that about half of non-citizens in Census Bureau data are illegal immigrants, which we would expect to make welfare use for non-citizens in general low, as those in the country without authorization are barred from almost all federal welfare programs.10 But like our prior analysis using the 2012 SIPP, this report shows that welfare use by households headed by illegal immigrants must be significant for the overall rate of welfare use among non-citizens to look as it does in this report.
Examining Welfare Use by Household. A large body of prior research has examined welfare use and the fiscal impact of immigrants by looking at households because it makes the most sense. The National Research Council did so in its fiscal estimates in 1997 because it argued that "the household is the primary unit through which public services are consumed."11 In their fiscal study of New Jersey, Deborah Garvey and Thomas Espenshade also used households as the unit of analysis because "households come closer to approximating a functioning socioeconomic unit of mutual exchange and support."12 Other analyses of welfare use and programs, including by the U.S. Census Bureau, have also used the household as the basis for studying welfare use.13 The late Julian Simon of the Cato Institute, himself a strong immigration advocate, pointed out that, "One important reason for not focusing on individuals is that it is on the basis of family needs that public welfare, Aid to Families with Dependent Children (AFDC), and similar transfers are received."14
The primary reason researchers have not looked at individuals is that, as Simon pointed out, eligibility for welfare programs is typically based on the income of all family or household members. Moreover, welfare benefits can often be consumed by all members of the household, such as food purchased with food stamps. Also, if the government provides food or health insurance to children, it creates a clear benefit to adult members of the household who will not have to spend money on these things. In addition, some of the welfare use variables in the SIPP are reported at the household level, not the individual level.
Some advocates for expansive immigration argue that household comparisons are unfair or biased against immigrants because someday the children who receive welfare may possibly pay back the costs of these programs in taxes as adults. Of course, the same argument could be made for the children of natives to whom immigrants are compared in this analysis. Moreover, excluding children obscures the fundamental issue that a very large share of immigrants are unable to support their own children and turn to taxpayer-funded means-tested programs. In terms of the policy debate over immigration and the implications for public coffers, this is the central concern.
 |
 |
 |
 |
 |
 |
 |
 |
 |
 |
 |
 |
 |
 |
End Notes
1 Of the 4,684,784 million non-citizen households receiving welfare, 93 percent or 4,370,385 have at least one worker. Among the 37,195,644 million native-headed households receiving welfare, 76 percent or 28,238,540 have at least one worker. Of the total (7,489,098) non-citizen households in the country, 92 percent or 6,923,931 have at least one worker. Of all native households (107,454,456), 76 percent or 81,928,626 have at least one worker.
2 The SIPP does not cover the institutionalized population. It does include a small number of people living in group quarters. By focusing on households we are excluding those in group quarters.
3 "Survey of Income and Program Participation", U.S. Census Bureau, last revised February 29, 2016.
4 A detailed discussion and summary of the research showing that the SIPP is the most accurate survey of welfare use can be found in the Methodology section under subsections "Why Use the SIPP" and "The Superiority of SIPP Data" in our 2015 report on immigrant welfare use: Steven A. Camarota, "Welfare Use by Immigrant and Native Households: An Analysis of Medicaid, Cash, Food, and Housing Programs", Center for Immigration Studies, September 2015.
5 A recent National Bureau of Economic Research report examining food stamps finds better coverage from the SIPP than any other survey. See Bruce D. Meyer, Nikolas Mittag, and Robert M. Goerge, "Errors in Survey Reporting and Imputation and their Effects on Estimates of Food Stamp Program Participation", NBER Working Paper No. 2514, October 2018. The National Academies of Sciences, Engineering, and Medicine has conducted an evaluation of the SIPP, which was redesigned in 2013. The academies find that in general the survey produces estimates similar to prior versions of the survey. See National Academies of Sciences, Engineering, and Medicine, The 2014 Redesign of the Survey of Income and Program Participation: An Assessment, Washington, D.C.: National Academies Press, 2018.
6 An additional $9.7 billion was received from the credit in the form of a refund to low-income taxpayers as EITC recipients do not pay federal income tax. The remaining roughly $60 billion received annually by recipients is not a refund of their income tax, but is simply a cash payment from the government. See Gene Falk and Margot L. Crandall-Hollick, "The Earned Income Tax Credit (EITC): An Overview", Congressional Research Service, April 18, 2018.
7 In earlier versions of the survey, respondents were first asked if they entered as a permanent resident and second if their status had changed. Now the survey only asks respondents if they entered as a permanent resident.
8 See James D. Bachmeier, Jennifer Van Hook, and Frank D. Bean, "Can We Measure Immigrants' Legal Status? Lessons from Two U.S. Surveys", International Migration Review, Summer 2014; Jeanne Batalova, Sarah Hooker, and Randy Capps, "DACA at the Two-Year Mark: A National and State Profile of Youth Eligible and Applying for Deferred Action", Migration Policy Institute, August 2014.
9 See Table 1 in Steven A. Camarota, "Welfare Use by Immigrant and Native Households: An Analysis of Medicaid, Cash, Food, and Housing Programs", Center for Immigration Studies, September 2015.
10 In its 2014 estimate of the illegal immigrant population, the most recent available, the government estimated that there were 12.1 million illegal immigrants in the country, about 11 million of whom were in the American Community Survey (ACS). See Table 2, in Bryan Baker, "Estimates of the Unauthorized Immigrant Population Residing in the United States: January 2014", DHS Office of Immigration Statistics, July 2017. The total number of non-citizens in the 2014 ACS, on which the DHS estimates are based, was 22.3 million. So about half of the non-citizens in the survey are illegal immigrants. The 2014 SIPP shows slightly fewer non-citizens (20 million) than the ACS. The primary reason the SIPP does not show as large a non-citizen population as the ACS is that the SIPP does not include those in institutions, as does the ACS. Also the non-citizen population grows slightly each year, and the first panel of the SIPP was in 2013, making for a slightly smaller non-citizen population in the 2014 SIPP. But overall it is still the case that roughly half the non-citizens in the SIPP used for this analysis are in the country illegally.
11 James P. Smith and Barry Edmonston, eds., The New Americans: Economic, Demographic, and Fiscal Effects of Immigration, Washington, DC: National Academies Press, 1997. See pp. 255-256.
12 Deborah Garvey and Thomas J. Espenshade, "State and Local Fiscal Impacts of New Jersey's Immigrant and Native Households", in Keys to Successful Immigration: Implications of the New Jersey Experience, Thomas J. Espenshade, ed., Washington, DC: Urban Institute Press, 1997.
13 See Kanin L. Reese, "An Analysis of the Characteristics of Multiple Program Participation Using the Survey of Income and Program Participation (SIPP)" , Census Bureau Working Paper 244, (undated); "Profile of the Foreign-Born Population in the United States: 2000", Census Bureau, December 2001, pp. 23-206; and Robert Rector and Jason Richwine, "The Fiscal Cost of Unlawful Immigrants and Amnesty to the U.S. Taxpayer", Heritage Foundation, 2013.
14 For this reason, Simon examined families, not individuals. While not exactly the same as households, as Simon also observed, the household "in most cases" is "identical with the family." See Julian L. Simon, "Immigrants, Taxes, and Welfare in the United States 1984", Population and Development Review, Vol. 10, No. 1, March, 1984, pp. 55-69.