Reports released today by the Census Bureau show a dramatic rebound in the nation’s foreign-born or immigrant population (legal and illegal together) to 46.8 million, as of March of this year — up two million since last year. The dramatic growth in the number reflects, at least in part, the surge of illegal immigration at the southern border.
The new health insurance, poverty, and income reports are not primarily focused on immigration, but they include information on the size of the foreign-born population and some limited socio-economic information on them. The reports are based on the Current Population Survey’s 2022 Annual Social and Economic Supplement (CPS ASEC), collected in March. ("Immigrants" or the “foreign-born" include all persons who were not U.S. citizens at birth: naturalized citizens, legal permanent residents, long-term temporary visitors, and illegal immigrants.)
Reports by the Center for Immigration Studies in recent months have examined growth in the foreign-born population based on the monthly CPS without the annual supplement. The new information from the CPS ASEC includes the supplement, which over-samples minorities and should provide a somewhat more accurate count of the foreign-born.
The falloff in the size of the foreign-born population during Covid was clearly just a blip. The dramatic growth we are seeing almost certainly reflects the ongoing border crisis and the enormous numbers of new illegal immigrants settling in the country.
Among the information released today:
- The CPS ASEC found that the nation’s foreign-born population (legal and illegal together) reached 46.8 million in March 2022 — the highest number this survey has ever shown (Table A-1 in the health insurance report).
- The 46.8 million in March 2022 represents a two million increase over the CPS ASEC collected last year1 (Table A-1 in the health insurance report).
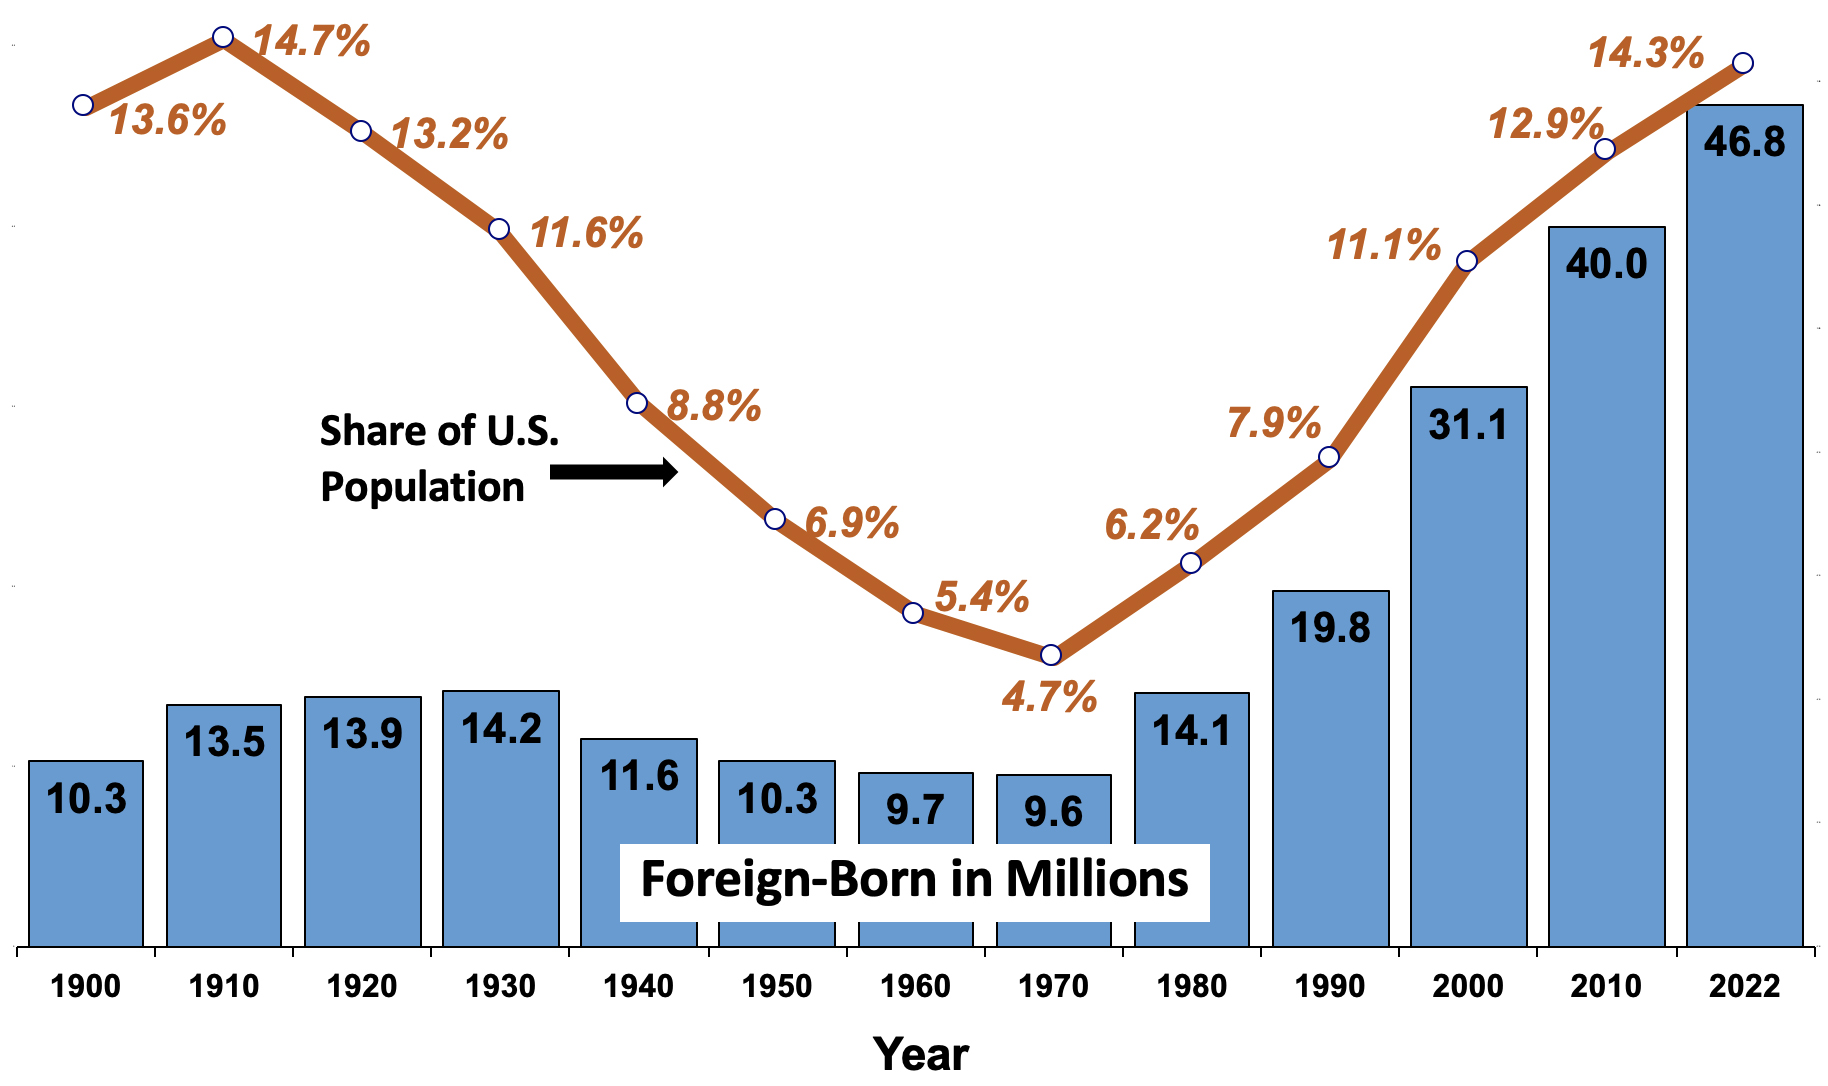
- Long-term, the growth in the foreign-born population has been extraordinary, doubling since 1990, tripling since 1980, and quintupling since 1970.
- The foreign-born now account for 14.3 percent of the population, or one in seven U.S. residents2 (Table A-1 in the health insurance report). As recently as 1990, they were one in 13 U.S. residents.
- The foreign-born share of the U.S. population is approaching the record highs reached in 1910 (14.7 percent) and 1890 (14.8 percent).
- Later this week (Thursday), the Census Bureau will release data from the American Community Survey (ACS), which will likely show a smaller foreign-born population, in part because it only reflects the population through July of last year, and so will not fully reflect the ongoing border surge.
- In terms of health insurance coverage, the new reports show that 19.5 percent of the foreign-born did not have insurance in 2021, compared to 6.4 percent of the native-born3 (Table A-1 in the health insurance report).
- The foreign-born were about 33.7 percent of all persons in the United States without health insurance, compared to their 14.3 percent of the total population (Table A-1 in the health insurance report).
- The government reports that 31.7 percent of the foreign-born and 36.4 percent of the native-born are on “public health insurance” — Medicaid, Medicare, and care provided by the VA and the military combined. Data from last year shows that VA and military insurance account for 1.6 percent of insurance coverage among the foreign-born and 4 percent among the native-born4 (Table A-1 in the health insurance report).
- The median income for households with a foreign-born “householder” (head) was $66,043 before taxes and $64,081 after taxes — indicating a median household tax contribution of $1,962. Taxes include federal and state income tax and payroll taxes (FICA)5 (Table C-2 in the income report).
- The median income of households with a native-born householder (head) was $71,522 before taxes and $65,630 after taxes — indicating a tax contribution of $5,8926 (Table C-1 in the income report).
- Data from last year shows that foreign-born households are 26 percent larger on average (three people) than native-born households (2.3 people). This fact, along with somewhat lower incomes helps explain why the foreign-born make lower tax contributions.7
- The poverty rate for the foreign-born was 14.6 percent, compared to 11 percent for the native-born. Because the nearly 17 million U.S.-born (<18) children of the foreign-born are included with the native-born, the new poverty figures tend to understate the poverty rate of foreign-born families8 (Table B-1 in the poverty and income report).
Figure 1. Foreign-Born Population in the United States, Number and Percent, 1900-2022 |
 |
|
Source: Decennial censuses for 1900 to 2000, American Community Survey 2010, Table A-1 in "Health Insurance Coverage in the United States: 2021", U.S. Census Bureau, September 2022. |
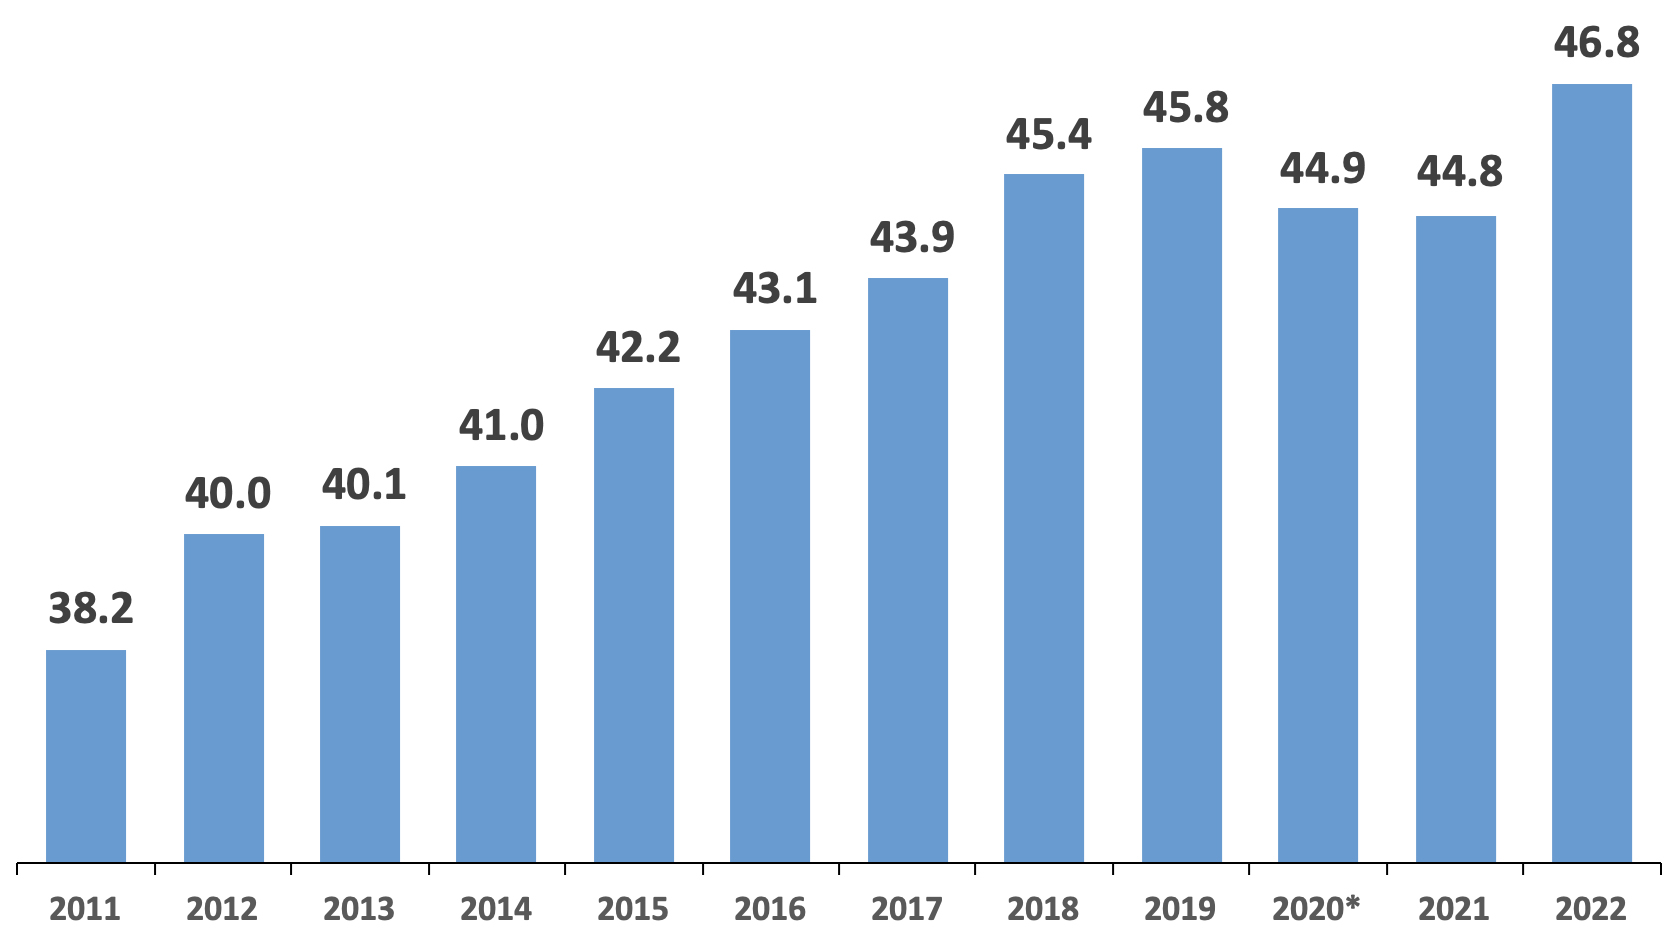
Figure 2. The foreign-born population fell in 2020 and 2021 due to Covid-19, but rebounded dramatically in 2022 (in millions) |
 |
|
Source: Table A-1 in "Health Insurance Coverage in the United States: 2021", U.S. Census Bureau, September 2022. The data comes from the Current Population Survey Annual Social and Economic Supplement (CPS ASEC) collected each March. * Questions remain about the 2020 and perhaps the 2021 CPS ASEC due to challenges associated with data collection during Covid-19. |
End Notes
1 Questions remain about the 2020 data. Presumably, the 2021 data did not suffer from the same problems as the Census Bureau has not provided a detailed description of potential issues with the CPS ASEC in that year. The health insurance coverage report released by the Census Bureau (see p. 2) in September 2020 observed that the 2020 CPS ASEC sample differed from prior years in the characteristics of the population captured by the survey. The 2020 CPS ASEC sample was older, had higher levels of educational attainment, and was more likely to report they were disabled than was the case in the 2019 sample. This likely had some impact on health insurance coverage rates. (It should be pointed out that the CPS ASEC collected in March 2020 provides health insurance coverage for 2019 as per the title of the September 2020 report.) In a detailed report on how Covid-19 impacted data quality, Census Bureau employees Rothbaum and Bee report how various weighting procedures impacted the data, including a limited discussion of the foreign-born. But the bureau has not issued new weights or other corrections for the 2020 data. As a result, the total foreign-born population shown in Figure 1 simply reflects population totals as published by the Census Bureau in its annual health insurance reports.
It may be worth mentioning that the Bureau of Labor Statistics reports that response rates to the monthly CPS were lower in 2020 starting in March of that year than prior to Covid-19. The Census Bureau collects the monthly CPS for the BLS. Rates improved after hitting a low in June 2020, but at least through December 2021 they were still lower than they were before Covid-19 hit. These lower rates increased the sampling error of the survey. However, in June 2020, when the problem was most pronounced, BLS stated that, “Although the response rate was adversely affected by pandemic-related issues, BLS was still able to obtain estimates that met our standards for accuracy and reliability.”
2 The CPS ASEC does not include the institutionalized population, primarily those in nursing homes and prisons. We can gauge the impact of including the institutionalized when calculating the foreign-born percentage by looking at the public-use annual American Community Survey (ACS), which does include the institutionalized. In 2019, immigrants (legal and illegal) were 13.64 percent of the total population in the ACS if the institutionalized were included and 13.72 percent when they were not included — less than one-tenth of a percentage-point difference. The distribution of immigrants across the institutionalized and non-institutionalized populations changes very little from year to year, so the foreign-born share of the population based on the CPS ASEC in 2022 might have been about a one-tenth of 1 percent lower if the institutionalized were included.
3 The survey asks respondents about health insurance in the year prior to the calendar year in which the survey was collected.
4 The share of native-born and foreign-born residents on VA and military-provided insurance is based on an analysis of the public-use files of the 2021 CPS ASEC, which asked about insurance coverage in 2020. The public-use 2022 CPS ASEC data, on which the new report published today is based, is not yet available to outside researchers for analysis.
5 The survey asks respondents about income in the calendar year prior to when the survey was collected. In addition to income and payroll taxes, the Census Bureau’s estimate of tax contributions includes “credits and economic impact payments”.
6 The survey asks respondents about income in the year prior to when the survey was collected. In addition to income and payroll taxes, the Census Bureau’s estimate of tax contributions includes "credits and economic impact payments".
7 Household sizes are based on an analysis of the public-use files of the 2021 CPS ASEC. The public-use 2022 CPS ASEC file on which the new report published today is based has not yet been released to the public. The bureau’s tax estimates are based on tax obligations and not actual tax compliance.
8 The vast majority of children in immigrant families were born in the United States, so in the Census Bureau's poverty report they are included with the native-born even though their poverty status reflects the income of their immigrant parents. Generally, poverty is much higher among children than adults so putting the U.S.-born minor children of the foreign-born with their parents makes the difference in poverty rates much larger than when all foreign-born people are compared with all native-born people.