Many immigration advocates have recently called for increasing the number of immigrants allowed into the country to fill lower-wage jobs in order to decrease wages by increasing the supply of workers, thereby lessening inflation. In this post, we attempt to roughly estimate the possible impact of immigration-induced reductions in wages on consumer prices. We focus our analysis on the lower-wage sectors of the economy that primarily employ workers without a bachelor’s degree (the less-educated) because many of those advocating for more immigration have specifically called for more workers in these sectors. Our analysis shows that reducing wages for the less-educated is not an effective means of controlling inflation because such workers earn relatively little and as a result account for only a modest share of economic output. There is also the equally important question of whether reducing the wages of workers who are the lowest-paid is sound public policy.
Among our findings:
- Reflecting their relatively modest average compensation, workers without a bachelor’s degree account for an estimated 25 percent of GDP. This means that even a substantial reduction of 10 percent in their wages could likely reduce consumer prices by only an estimated 2.5 percent. More educated workers and capital account for most of the economy.
- If we look at just lower-wage occupations done primarily by those without a bachelor’s degree, we find that they account for only 22 percent of GDP. As a result, a 10 percent reduction in wages in these occupations could reduce prices by only an estimated 2.2 percent.1
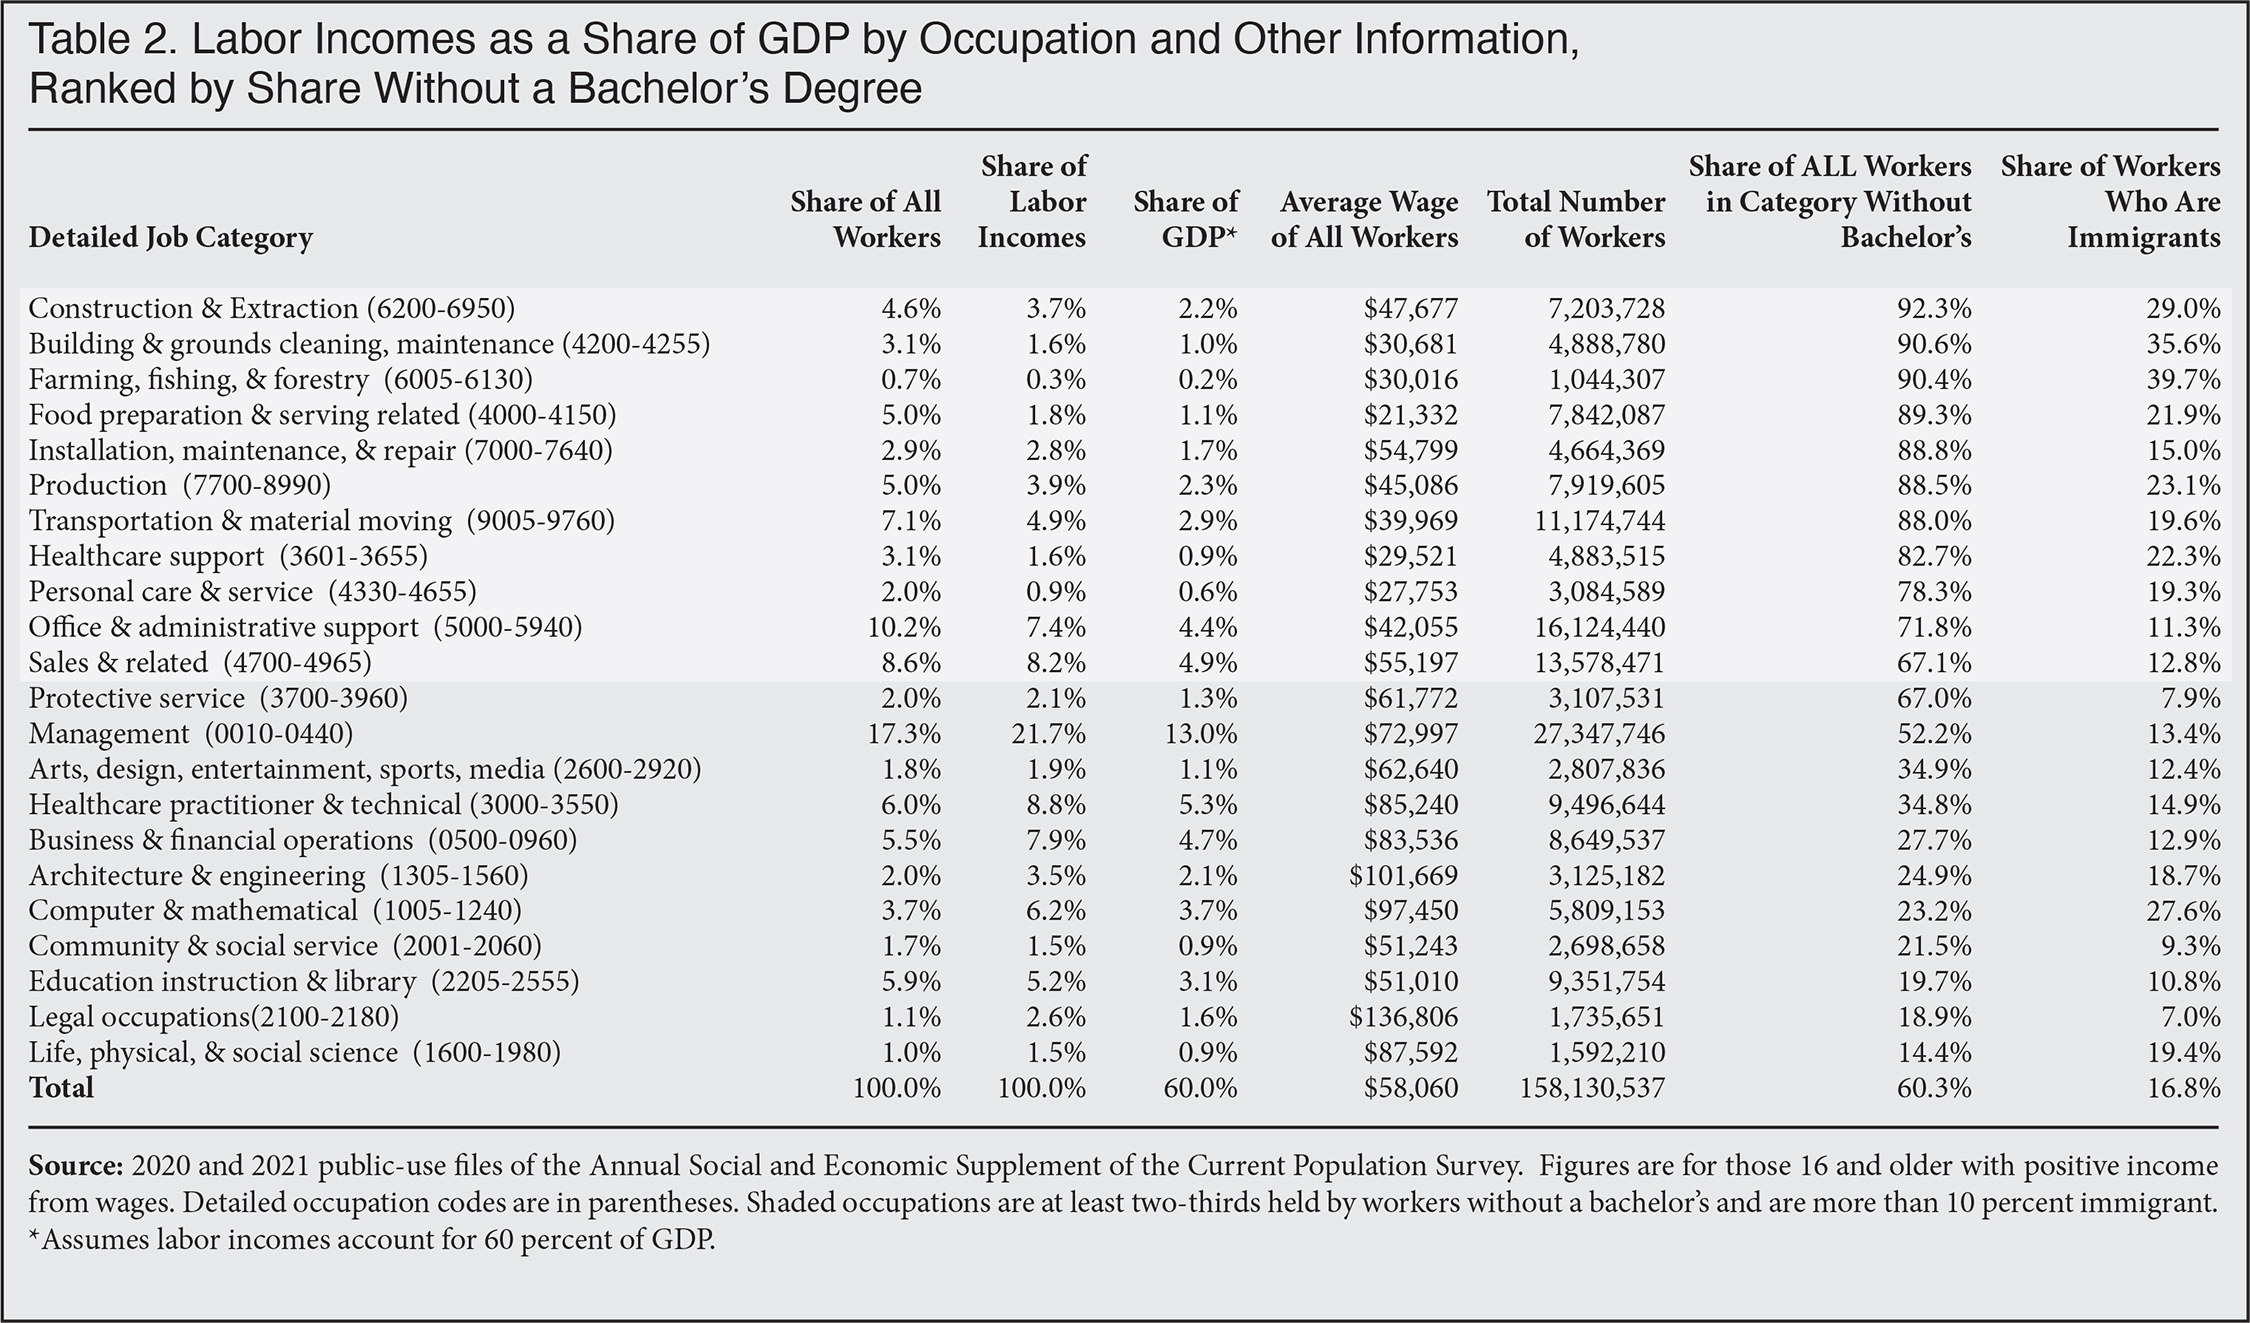
- It might be possible to reduce wages in specific occupations by dramatically increasing the number of workers in relatively few occupations. But since individual lower-paid occupations account for only a tiny share of the economy, the impact on overall consumer prices would be correspondently tiny. For example, the compensation earned by construction and extraction workers is only 2.2 percent of GDP, for cleaning and maintenance it is 1 percent, for food preparation and serving it is 1.1 percent, and for healthcare support it is 0.9 percent.
- Prior to Covid, workers, including those without a bachelor’s degree, have generally seen their wages decline or grow very little for more than two decades, so reducing their wages by admitting more immigrants can be seen as unfair and unwise.
- More than one in seven of these less-educated workers are currently eligible to receive cash payments from the Earned Income Tax Credit and Additional Child tax Credit — the nation’s largest cash assistance programs for low-wage workers. Reducing the wages of such workers could undo some of these important efforts to help low-income workers.
- Nearly two-thirds of all children in poverty in America are dependent on a worker who does not have a bachelor’s degree. Using immigration to reduce wages for less-educated workers has significant negative implications for American’s low-income children.
Introduction. The head of the U.S. Chamber of Commerce and others have called for more immigration to increase the supply of workers in order to drive down wages and slow inflation. Many of the loudest voices calling for more foreign workers to “curb inflation” have emphasized the need for admitting more immigrants to take lower-paying jobs that require modest levels of education. Of course, the current rapid increase in prices has many causes, including government spending, growth in the money supply, unusually low interest rates, pent-up consumer demand due to Covid-19, and supply chain disruptions and bottlenecks. None of this is directly attributable to rapidly rising wages.2 Moreover, it is highly questionable whether reducing wages for less-educated, lower-paid workers is desirable, not to mention the near record 60 million working-age people not working. This analysis puts all these issues aside and estimates the share of GDP attributable to labor and the likely impact of wage reductions on consumer prices.
It is worth noting that for years the U.S. Chamber of Commerce and other advocates for increased immigration have argued that immigration “doesn’t hurt wages”, including for the less-educated — the opposite of its current position. Of course, some businesses may argue that they do not want to lower wages, but rather that they simply wish to use new immigrants to fill open positions. But this argument ignores basic economics. First, if wages remain unchanged in any given sector, then there would be no impact on the cost of doing business and thus no effect on inflation, which is the chief justification for allowing in more immigrant workers. Second, in a market economy, filling positions in a tight labor market typically requires increases in compensation. So if businesses do not have access to more foreign workers, then they will increase wages and benefits if they wish to attract workers. Arguing that admitting more immigrants would not make wages lower than they otherwise would be ignores this basic insight.
Estimating Labor’s Share of GDP. To estimate the impact of reducing wages on prices, we first start with the standard assumption that the economy is comprised of labor and capital. While it used to be higher, labor is currently thought to account for 60 percent of GDP with capital representing the other 40 percent. To estimate the share of GDP that labor accounts for, we use a combined sample of the public-use files of the 2020 and 2021 Current Population Survey Annual Social and Economic Supplement (CPS ASEC) collected by the Census Bureau each March. Based on the wage data from the CPS ASEC, we first calculate labor incomes of all workers. We take the labor income of all workers and divide it by .60 to estimate the aggregate size of the total U.S. economy.3 Again, this is based on the assumption of a 60-40 percent split between labor and capital discussed above. With this total we can then divide the labor incomes of any group of workers by the total size of the economy to get their share of GDP.
Limitations of This Approach. It must be noted that we can only produce rough estimates of the share of GDP that workers represent, partly because the CPS ASEC tends to under-report some forms of compensation. Moreover, the survey is not designed to capture non-wage compensation. However, to simplify, we assume that underreporting of wage and non-wage compensation is distributed in the same proportion as reported wages in the survey.4 A larger area of uncertainty about our estimated impact of immigration on consumer prices stems from unforeseen feedback effects that changes in wages may create. For example, a decline in compensation could impact the supply of Americans seeking employment and this, too, will impact wages. Another area of uncertainty is the share of lower wages businesses would pass on to consumers compared to the share retained as higher profits. The goal of this analysis is not to fully model the U.S. economy, which would be impossible. Rather we employ a straightforward approach that produces reasonable estimates of the share that workers represent of GDP. This approach provides policy-makers and other interested parties with plausible estimates of how much wage reductions caused by immigration could possibly impact consumer prices.
How Much Does Immigration Impact Wages? There is a longstanding debate over the wage impact of immigration, which we cannot summarize here. However, the National Academies of Sciences, Engineering, and Medicine’s massive 2016 report on immigration does include “simulated wage impacts” from immigration. Based on research on how wages respond generally to supply shocks, the Academies' most basic assumption is that the elasticity of wages is .3. That is, each 1 percent increase in the supply of workers reduces wages by .3.5 So if we use this assumption to create our estimates, then it means that a reduction in wages of 10 percent, would require increasing the supply of workers by one third — 33.3 percent times .3 is 10 percent. If larger reductions in wages are desired, then the increase in the supply of workers would have to be correspondingly larger. Of course, it is possible that the impact of immigration is larger than .3. If so, then the negative impact on wages would be correspondingly larger.
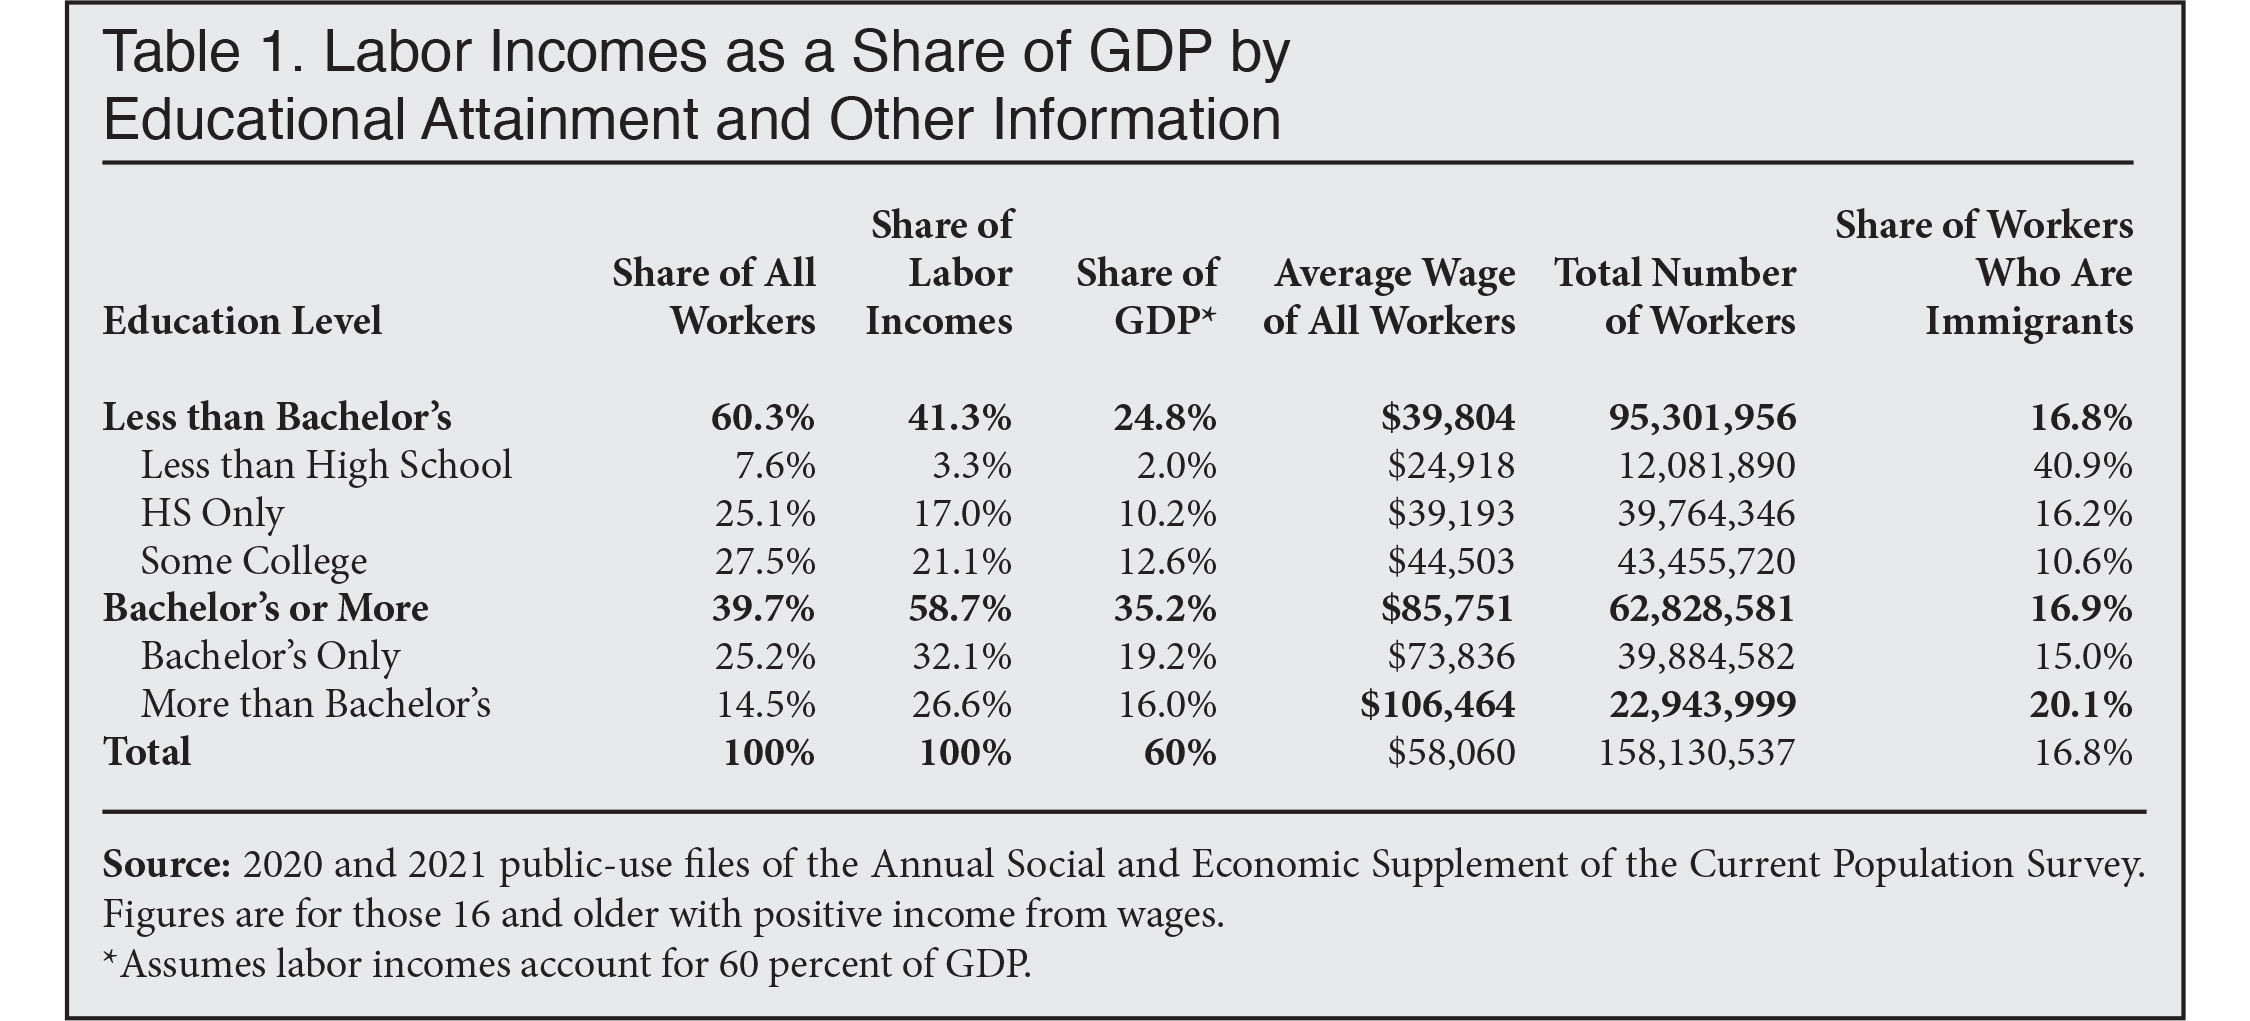
On its face, increasing the supply of workers by one-third is highly impractical because it would require a level of immigration over a short period of time that is without any precedent. For example, Table 1 shows that there are nearly 39.8 million workers with only a high school education, so increasing the supply of just these workers by one-third would require admitting 13.1 million immigrant workers. Increasing the supply of all workers without a bachelor’s degree (dropouts, high school only, and some college), would require admitting nearly 32 million immigrant workers. This compares to the total of 26.6 million immigrant workers of all education levels currently in the country. As we will see, workers without a college education account for only a modest share of GDP, so even a 10 percent reduction in their wages would not have a large impact on consumer prices. But putting that question aside, it is still the case that the level of new immigration necessary to lower wages by 10 percent for the less-educated would need to be truly enormous and without any precedent. In the rest of this analysis we ignore this and simply calculate the impact on prices by reducing wages by 10 percent.
 |
Price Impact of Reducing Wages for the Less-Educated. Table 1 provides information necessary for estimating how much a decline in wages would reduce prices based on labor’s share of GDP. The table shows that workers without a bachelor’s degree, who can be described as the “less-educated”, account for 60.3 percent of all workers, 41.3 percent of labor incomes, and 24.8 percent of GDP. The reason they are a much smaller share of labor incomes than they are of all workers is that these workers earn much less than more educated workers on average and so account for a smaller share of labor incomes than their more educated counterparts. Using the numbers for those without a bachelor’s degree, we can estimate that if the wages of these workers were 10 percent lower, then it could possibly reduce prices by 2.5 percent.6 That is, a 10 percent fall in wages would translate into a potential 2.5 percent reduction in consumer prices. This would seem to be a very small impact, even though a 10 percent reduction in wages would be nearly $4,000 annually given the average wage income of these workers.
Placing the Impact on Prices in Context. To place this potential impact on prices in context, it should be pointed out that prices in just the last year increased by 8.5 percent. So even a relatively large immigration-induced reduction in wages for the less-educated of 10 percent could offset only a modest share of inflation in the last year. Although our estimate is based on a simplistic model, the results provide an important insight as less-educated workers account for a tiny share of GDP — capital and more educated workers account for the vast majority of the economy — so reducing their wages, even substantially, simply cannot have a large impact on prices.
Price Impact of Reducing Wages for Workers with Only a High School Degree. Turning to sub-categories of the less-educated, we see the potential impact on prices would be even smaller for those without a high school education and those with only a high school education. For example, we estimate that workers with only a high school education are 25.1 percent of all workers, 17 percent of labor incomes, and 10.2 percent of GDP. This means that if their wages were 10 percent lower it could potentially reduce prices by only 1.02 percent. Even though they account for one out of four workers, the labor incomes of those with only a high school education and their resulting small share of GDP means using immigration to reduce their wages can have only a tiny impact on prices.
Workers by Occupation. Table 2 reports the same information as Table 1, except that labor incomes and the shares of GDP are divided by major occupational categories, rather than education. Tables 2 shows that the compensation earned by workers in many sectors of the economy accounts for only a tiny share of the nation’s total GDP. Workers in construction account for just 2.2 percent of GDP; in building cleaning and maintenance it is 1 percent; in farming, fishing and forestry it is 0.2 percent; in food preparation and serving it is 1.1 percent; in installation and repair it is 1.7 percent; in production it is 2.3 percent; in transportation and moving it is 2.9 percent; in healthcare support it is 0.9 percent; in personal care it is 0.6 percent; in administrative support it is 4.4 percent; and in sales it is 4.9 percent. These 11 occupations, in which at least two-thirds of workers lack a bachelor’s, account for more than half of all workers in the United States but only 22.3 percent of GDP. (These occupations are also at least 10 percent immigrant.) If wages decline in every one of these occupations by 10 percent, the potential impact on consumer prices would still just be 2.2 percent. If one tried to increase the supply of workers in only a few of these occupations, then it might be easier to reduce wages without having to let in enormous numbers of workers. But it would also mean the impact on overall prices would be correspondingly much smaller. Reducing wages in construction, building cleaning, food services, farming, or any group of lower-paying jobs can only have a trivial impact on overall prices given that wages in these sectors are such a tiny share of GDP.
 |
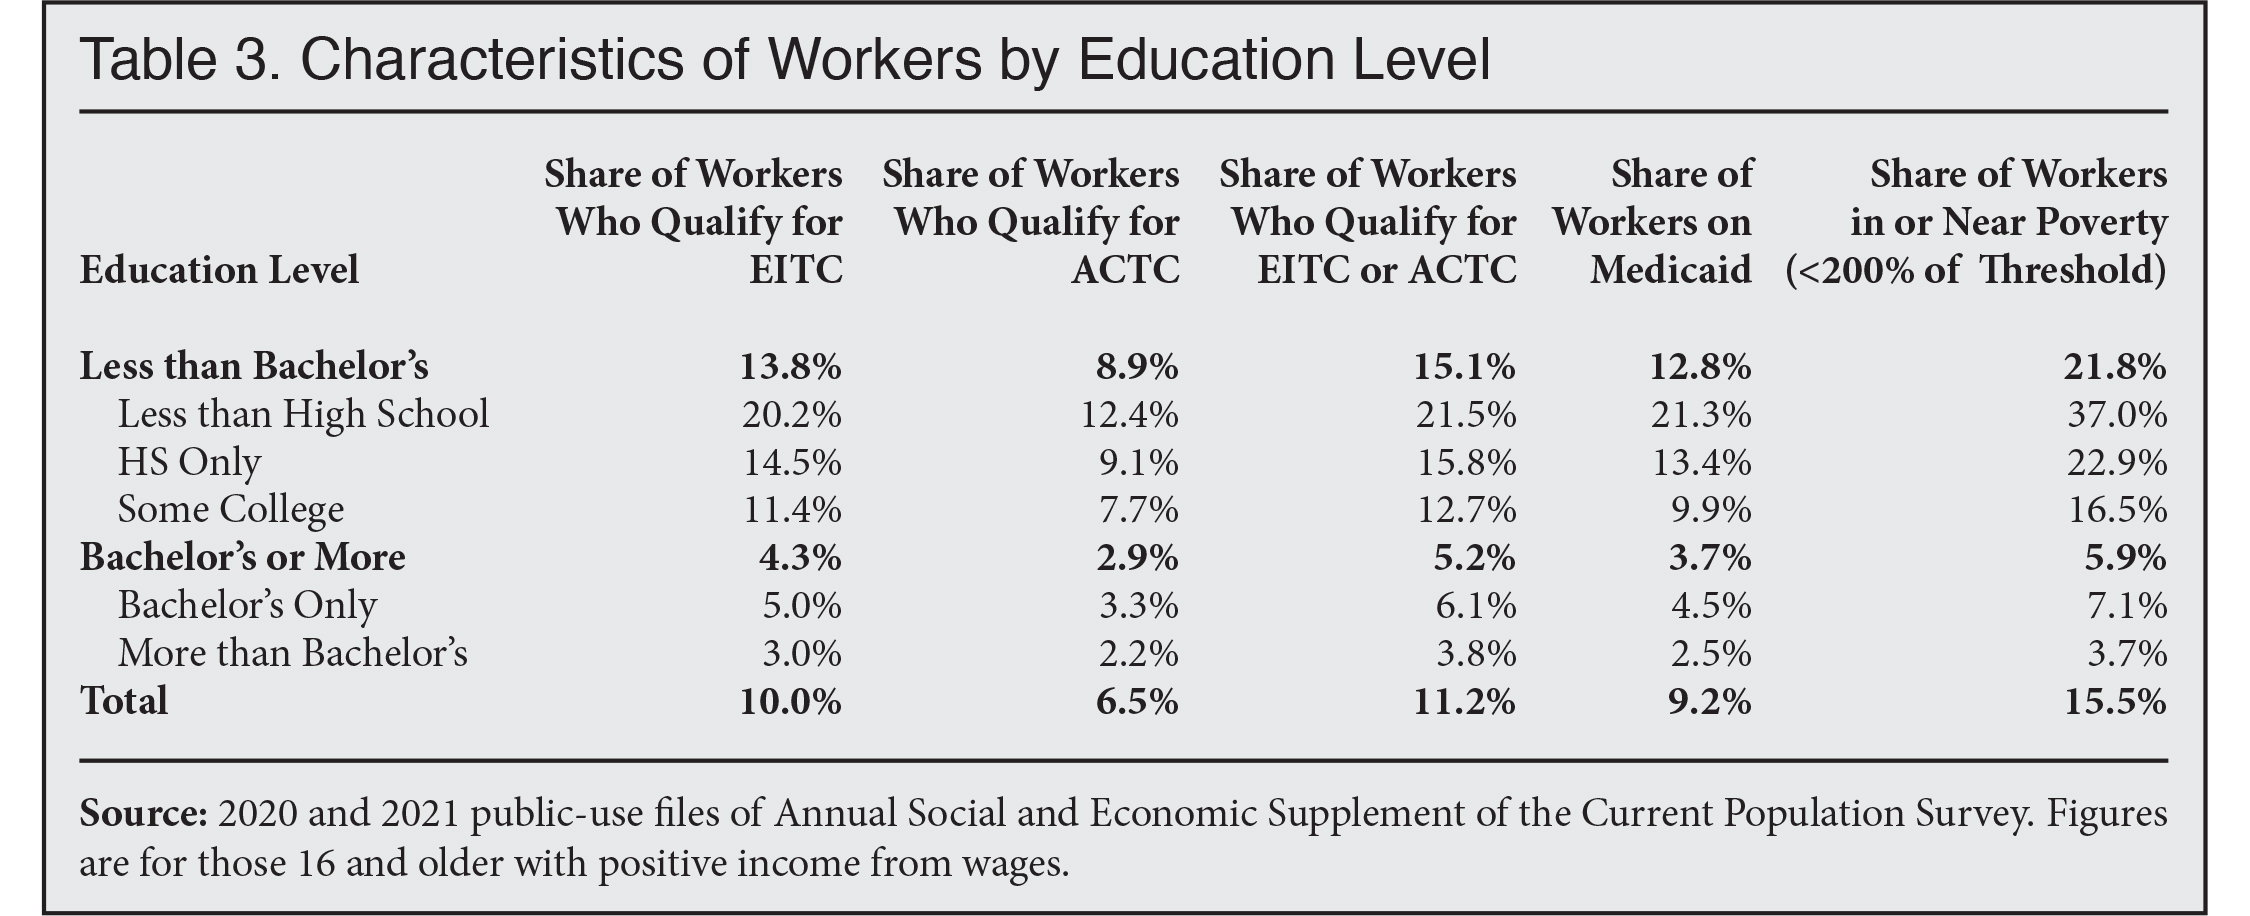
Undoing Efforts to Assist Lower-Income Workers. Table 3 provides more information about workers by education. It shows that a significant share of workers with modest levels of education are eligible to receive the Earned Income Tax Credit (EITC) and ACTC (Additional Child Tax Credit) — the nation’s largest cash assistance programs for lower-income workers.7 These programs pay out about $95 billion annually. Among workers without a bachelor’s, more than one in seven is eligible for one or both programs. Combined, those without a bachelor’s degree account for three-quarters of all those receiving the EITC and ACTC. A 10 percent decline in wages for such workers would be about $4,000 annually. If immigration reduced wages by this amount, it would be enough to entirely erase the $2,411 average payment from the EITC in 2020, at least for some workers. Moreover, if wages declined then payments from the EITC and ACTC would likely go up, offsetting some of the decline in wages, but such an increase would create more costs for taxpayers. The costs for other programs that assist the working poor, like Medicaid and food stamps, which are also used by lower-wage workers, would almost certainly rise as well.
 |
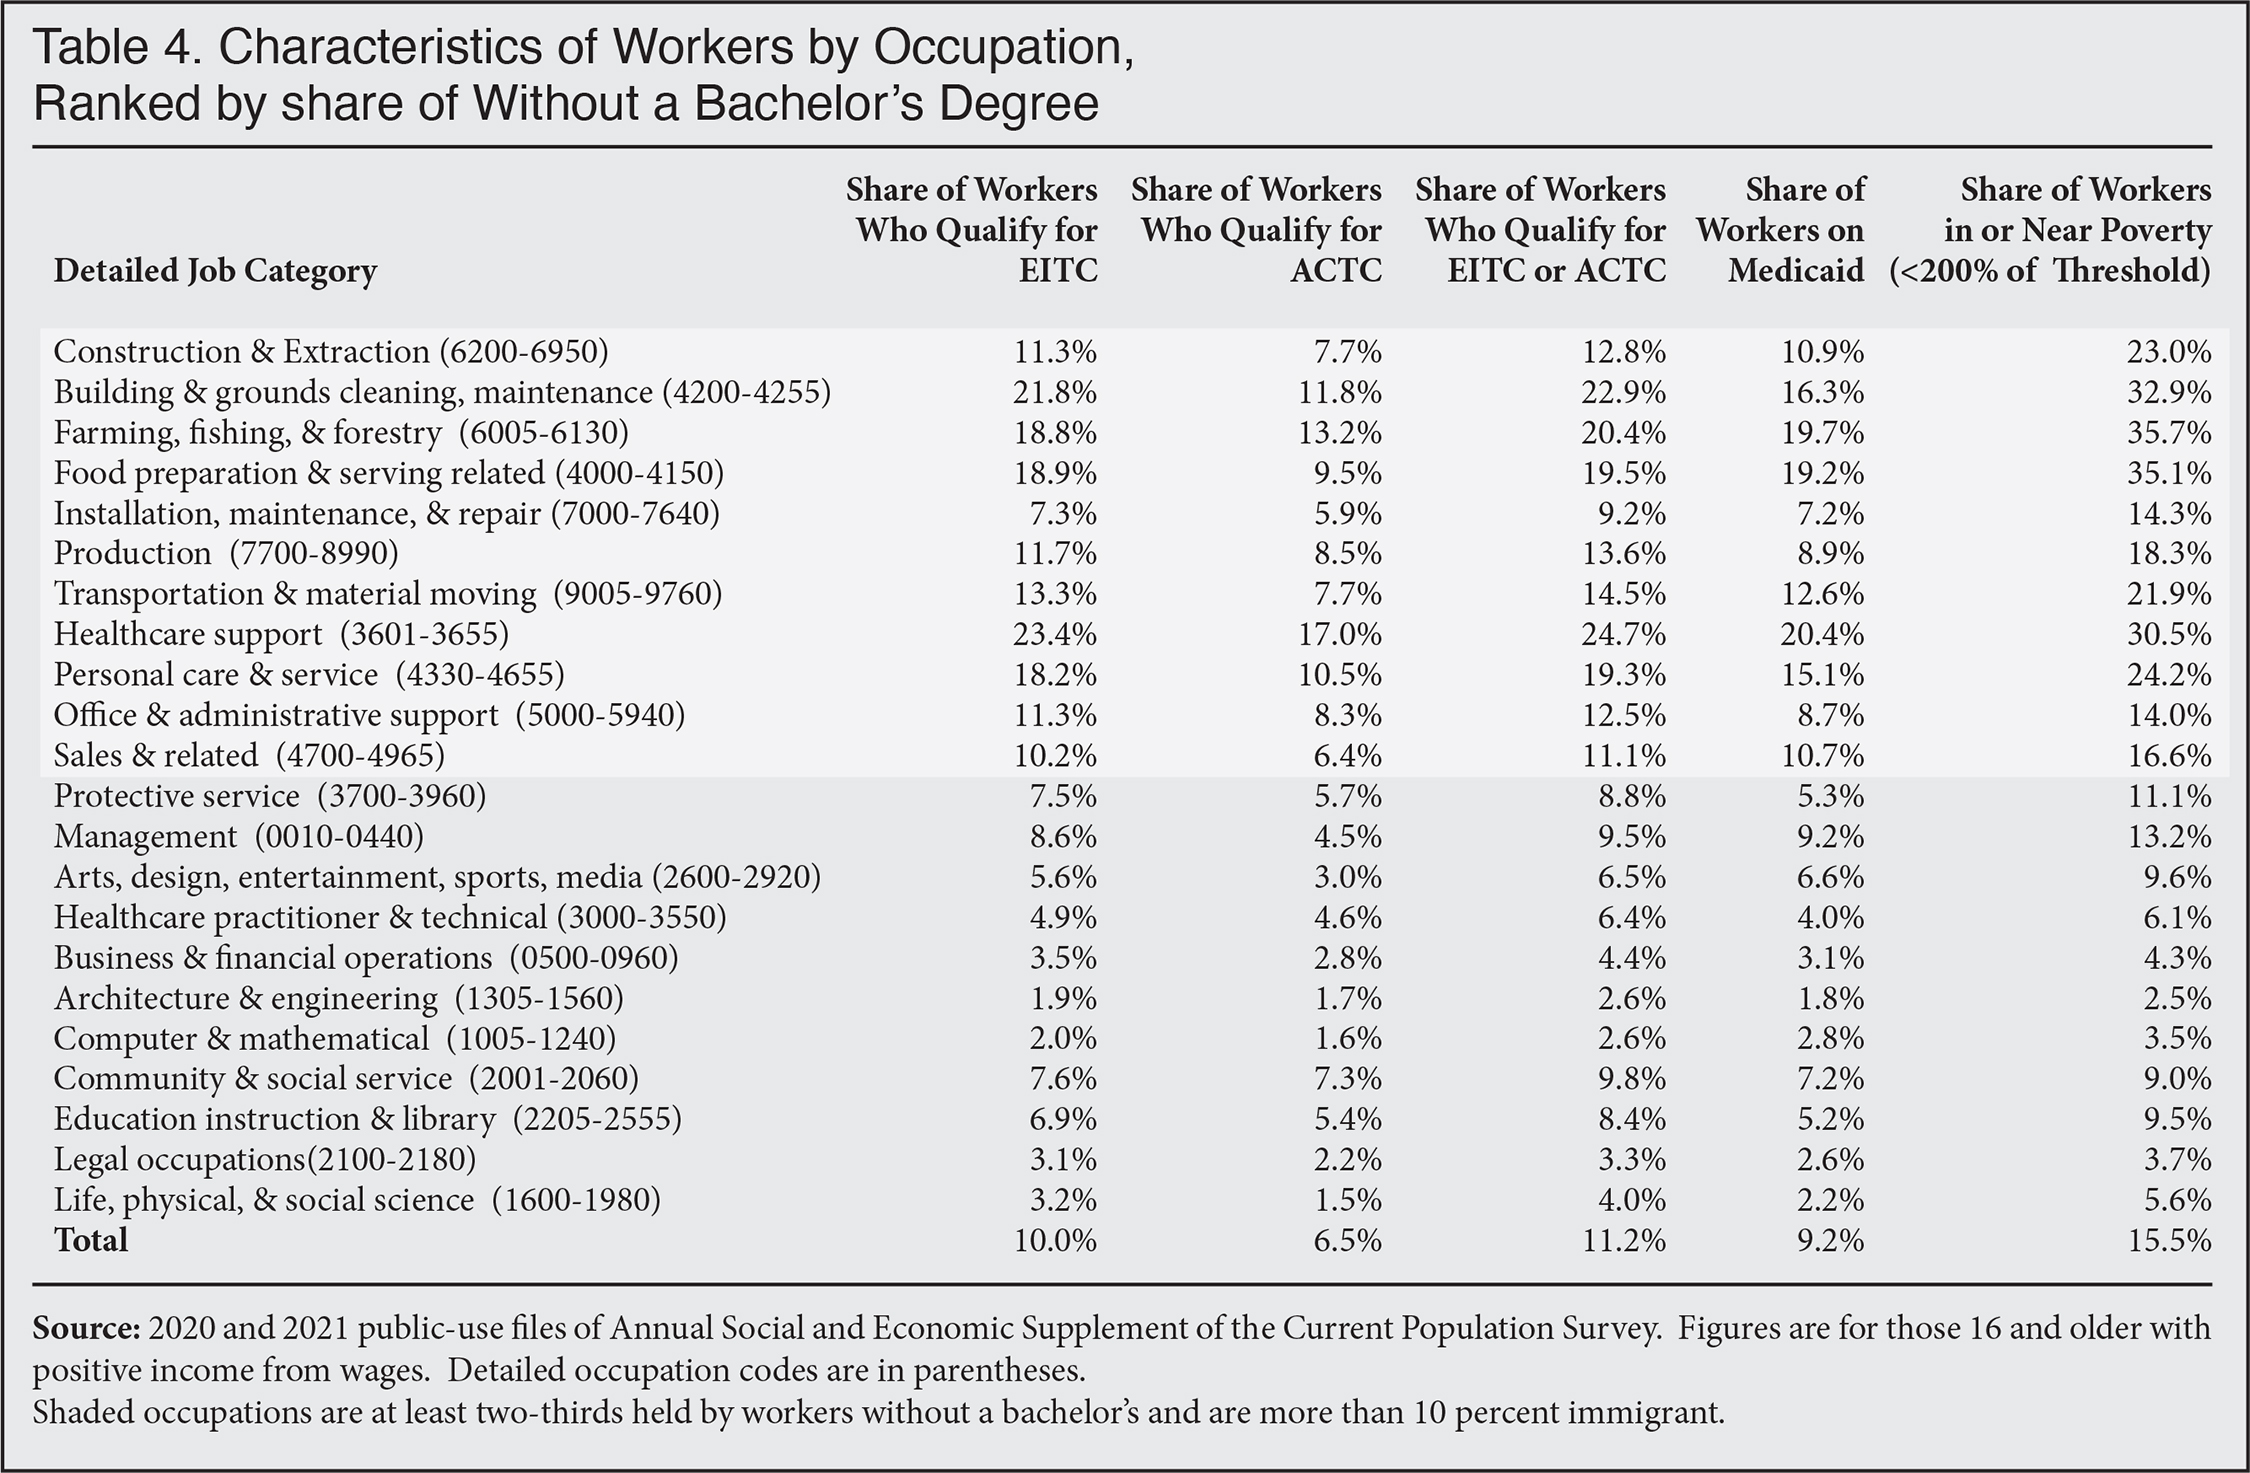
Table 4 shows the same information as Table 3 except by occupation. As shown in Table 2, workers in many sectors of the economy earn modest wages. As a result, nearly one out of four workers employed in building cleaning and maintenance as well as healthcare support are eligible for the EITC or ACTC, as are one out of five workers in farming, fishing, and forestry; food preparation and serving; and personal care. Reducing wages in these and other lower-wage occupations would almost certainly undermine our anti-poverty efforts and may result in higher EITC and ACTC payments, with negative implications for taxpayers.
 |
The Working Poor. The working poor can be defined as those workers with incomes below the poverty line. Based on the 2020/2021 data, 86.3 percent of the working poor do not have a four-year college degree. Children of the working poor are those in poverty who are dependent on someone who works. About 68.8 percent of all children in poverty live in a household with at least one worker. Of all children of the working poor, 92.8 percent live in a household with a worker who does not have a bachelor’s degree. This means that of all children in poverty, 63.8 percent are dependent of a worker without a four-year college degree. Even focusing on the smaller population of workers who have only a high school education or less shows that 49.2 percent of all poor children in America live with such workers. Reducing wages for the less educated, even if it did reduce consumer prices, clearly has significant negative implications for Americans' poorest children.
Conclusion. The highly simplified model of the economy presented here makes clear that it is simply not possible to have a large impact on consumer prices by using immigration to increase the supply of labor and reduce the wages of workers without a bachelor’s degree. The labor incomes of these workers account for only about 25 percent of GDP, so even a very substantial decline in their labor incomes of, say, 10 percent, can only reduce prices by an estimated 2.5 percent. More skilled, higher-paid workers and capital account for the overwhelming majority of economic activity. Further, making reasonable assumptions about the wage response to increased immigration shows that the level of new immigration that would be necessary to reduce wages by 10 percent would have to be completely unprecedented. Finally, reducing wages for the less-educated would have negative implications for America’s poorest children as 64 percent of children in poverty are dependent on the income of a worker without a four-year college education.
When we look at the economy by occupations, instead of workers by education levels, we come to the same conclusion. The labor incomes of workers in lower-paying occupations typically done by the less-educated account for too small a share of GDP for a decline in their wages to make much difference in overall consumer prices. Employers in some sectors of the economy and their lobbyists may call for more immigration and use combatting inflation as a justification. But the evidence is clear that given the pay structure in America, even a significant reduction in wages in lower-wage sectors of the economy brought about through immigration cannot substantially reduce overall consumer prices.
End Notes
1 The occupations are highlighted in Table 2 and include: construction and extraction; building and grounds cleaning; maintenance; farming, fishing, and forestry; food preparation and serving; installation, maintenance, and repair; production; transportation and material moving; healthcare support; personal care; service, office, and administrative support; and sales. To be sure, these are broad occupational categories, but they are among the lowest paid and more than two-thirds of workers in every one of these occupations lacks a four-year college degree. Table 2 also includes the detailed occupational codes used to create these occupations.
2 As prices have spiked in recent months, wage increases for most workers have not kept pace with inflation. To be sure, increased government spending has stimulated consumer demand, which has increased demand for workers and driven up wages to some extent. But as Ramesh Ponnuru points out in the Washington Post, “to the extent wage gains have been unsustainably rapid, it’s a byproduct of that increase — not the cause of it.”
3 The mathematics behind this assumption is very simple. Assume that total labor incomes are equal to $100. If this represents 60 percent of GDP, then total GDP must be and $166.70 as this is 100 divided by .60 or 60 percent.
4 Further, by dividing wages in the CPS by .6 to get overall GDP, we are scaling the total size of the economy to the wage data from the survey.
5 Table 5-1 on pages 236-237 shows the various simulated wage impacts of immigration-induced increases in the supply of workers by education and nativity.
6 It is possible to do this same calculation assuming labor is not 40 percent of GDP, as is currently estimated, but is instead the historical average of one-third. But using this assumption makes little difference. Such an assumption would raise labor income for all those without a bachelor’s degree to 27.6 percent of GDP, from the 24.8 percent shown in Table 1. While this somewhat larger, it would still mean that a 10 percent decline in wages for all such workers would reduce consumer prices by about 2.8 percent instead of 2.5 percent, which is not really a meaningful difference.
7 These figures come directly from the combined sample of the 2020 and 2021 CPS ASEC. That survey reports eligibility for these programs based on income, number of dependents, and other factors. Not all those eligible receive payments from the program.
