On his “Noahpinion” blog, Noah Smith writes that we should not worry that Hispanic immigrants will insufficiently assimilate because, come to think of it, people once had the same fears about the Irish, and they turned out just fine. Hispanics, he says, are probably on the same upward path.
This casual dismissal of assimilation concerns is so common that I’ve taken to calling it the “Irish Retort”. It has some superficial appeal, but it breaks down when we consider not only how persistent cultural differences tend to be among all immigrant groups, but also how challenging the socioeconomic circumstances are for Hispanics in particular.
Culture Transplant Is Universal
For an example of cultural persistence, consider Figure 1. It shows a surprising correlation between the level of social trust among American ethnic groups on the vertical axis and the level of social trust in their ancestral countries on the horizontal axis.
Figure 1. Percentage Who Believe That “Most People Can Be Trusted” |
 |
|
Source: General Social Survey and World Values Survey. |
For example, in Europe Swedes are more trusting than the Irish, who are themselves more trusting than the Italians. Remarkably, despite their peak immigration occurring at least 100 years ago, those three ethnic groups order themselves the same way in the United States: Swedish Americans are more trusting than Irish Americans, who in turn are more trusting than Italian Americans.
This result is not just anthropological trivia, as trust is a key component of “social capital” that shapes people’s quality of life. “Where levels of social capital are higher, children grow up healthier, safer and better educated; people live longer, happier lives; and democracy and the economy work better,” the political scientist Robert Putnam has observed.
Researchers have demonstrated similar ethno-cultural correlations across a wide range of important traits, such as civic engagement, frugality, and social mobility. Therefore, to say that Hispanics or any other groups are “the new Irish” does not prove assimilation, for the simple reason that no immigrant group fully assimilates. Instead, as the economist Garett Jones has detailed, immigrants transplant certain values from their home countries into the U.S. Whether those values are desirable is something that Americans need to decide as they set immigration policy.
Hispanics Face Additional Challenges
To be fair, Smith acknowledges at the end of his piece that immigration involves long-term cultural interchange. His more limited claim is that, like the Irish before them, Hispanics are on their way to becoming “highly integrated middle-class Americans”. Even that is an overly optimistic take. In reality, Hispanic immigrants and their descendants have struggled to reach the same level of socioeconomic status that European groups have achieved in the U.S.
This struggle occurs largely because of the degree of cultural and economic difference between the U.S. and Latin America. An example of that difference can be seen in Figure 1 above. Social trust among both Mexicans and Mexican-Americans falls well below the trust levels of the European groups.
Economically, Hispanics certainly have made progress in the U.S., but most of that progress occurs when the children of the immigrant generation have the opportunity to grow up here. Progress slows after that. Figure 2 illustrates the slowdown using data on men ages 25 to 54 in the 2023 Current Population Survey.
Figure 2. Hispanic Intergenerational Progress |
 |
|
Source: 2023 Current Population Survey. Analysis limited to men ages 25-54. Gen1 = foreign-born. Gen2 = U.S.-born and at least one foreign-born parent. Gen3+ = U.S.-born and two U.S.-born parents. Puerto Ricans are excluded from the generational categories because they are U.S. citizens at birth. |
Among first-generation (foreign-born) Hispanics, just 16 percent have a bachelor’s degree. That figure rises to 24 percent in the second generation (U.S.-born with at least one foreign-born parent), but it inches upward to just 26 percent in the third-plus generation (U.S.-born with two U.S.-born parents), which is well below the 42 percent rate among non-Hispanic whites in the third-plus generation. Income follows a similar pattern. Meanwhile, the impressive labor force attachment exhibited by Hispanic male immigrants weakens in subsequent generations.
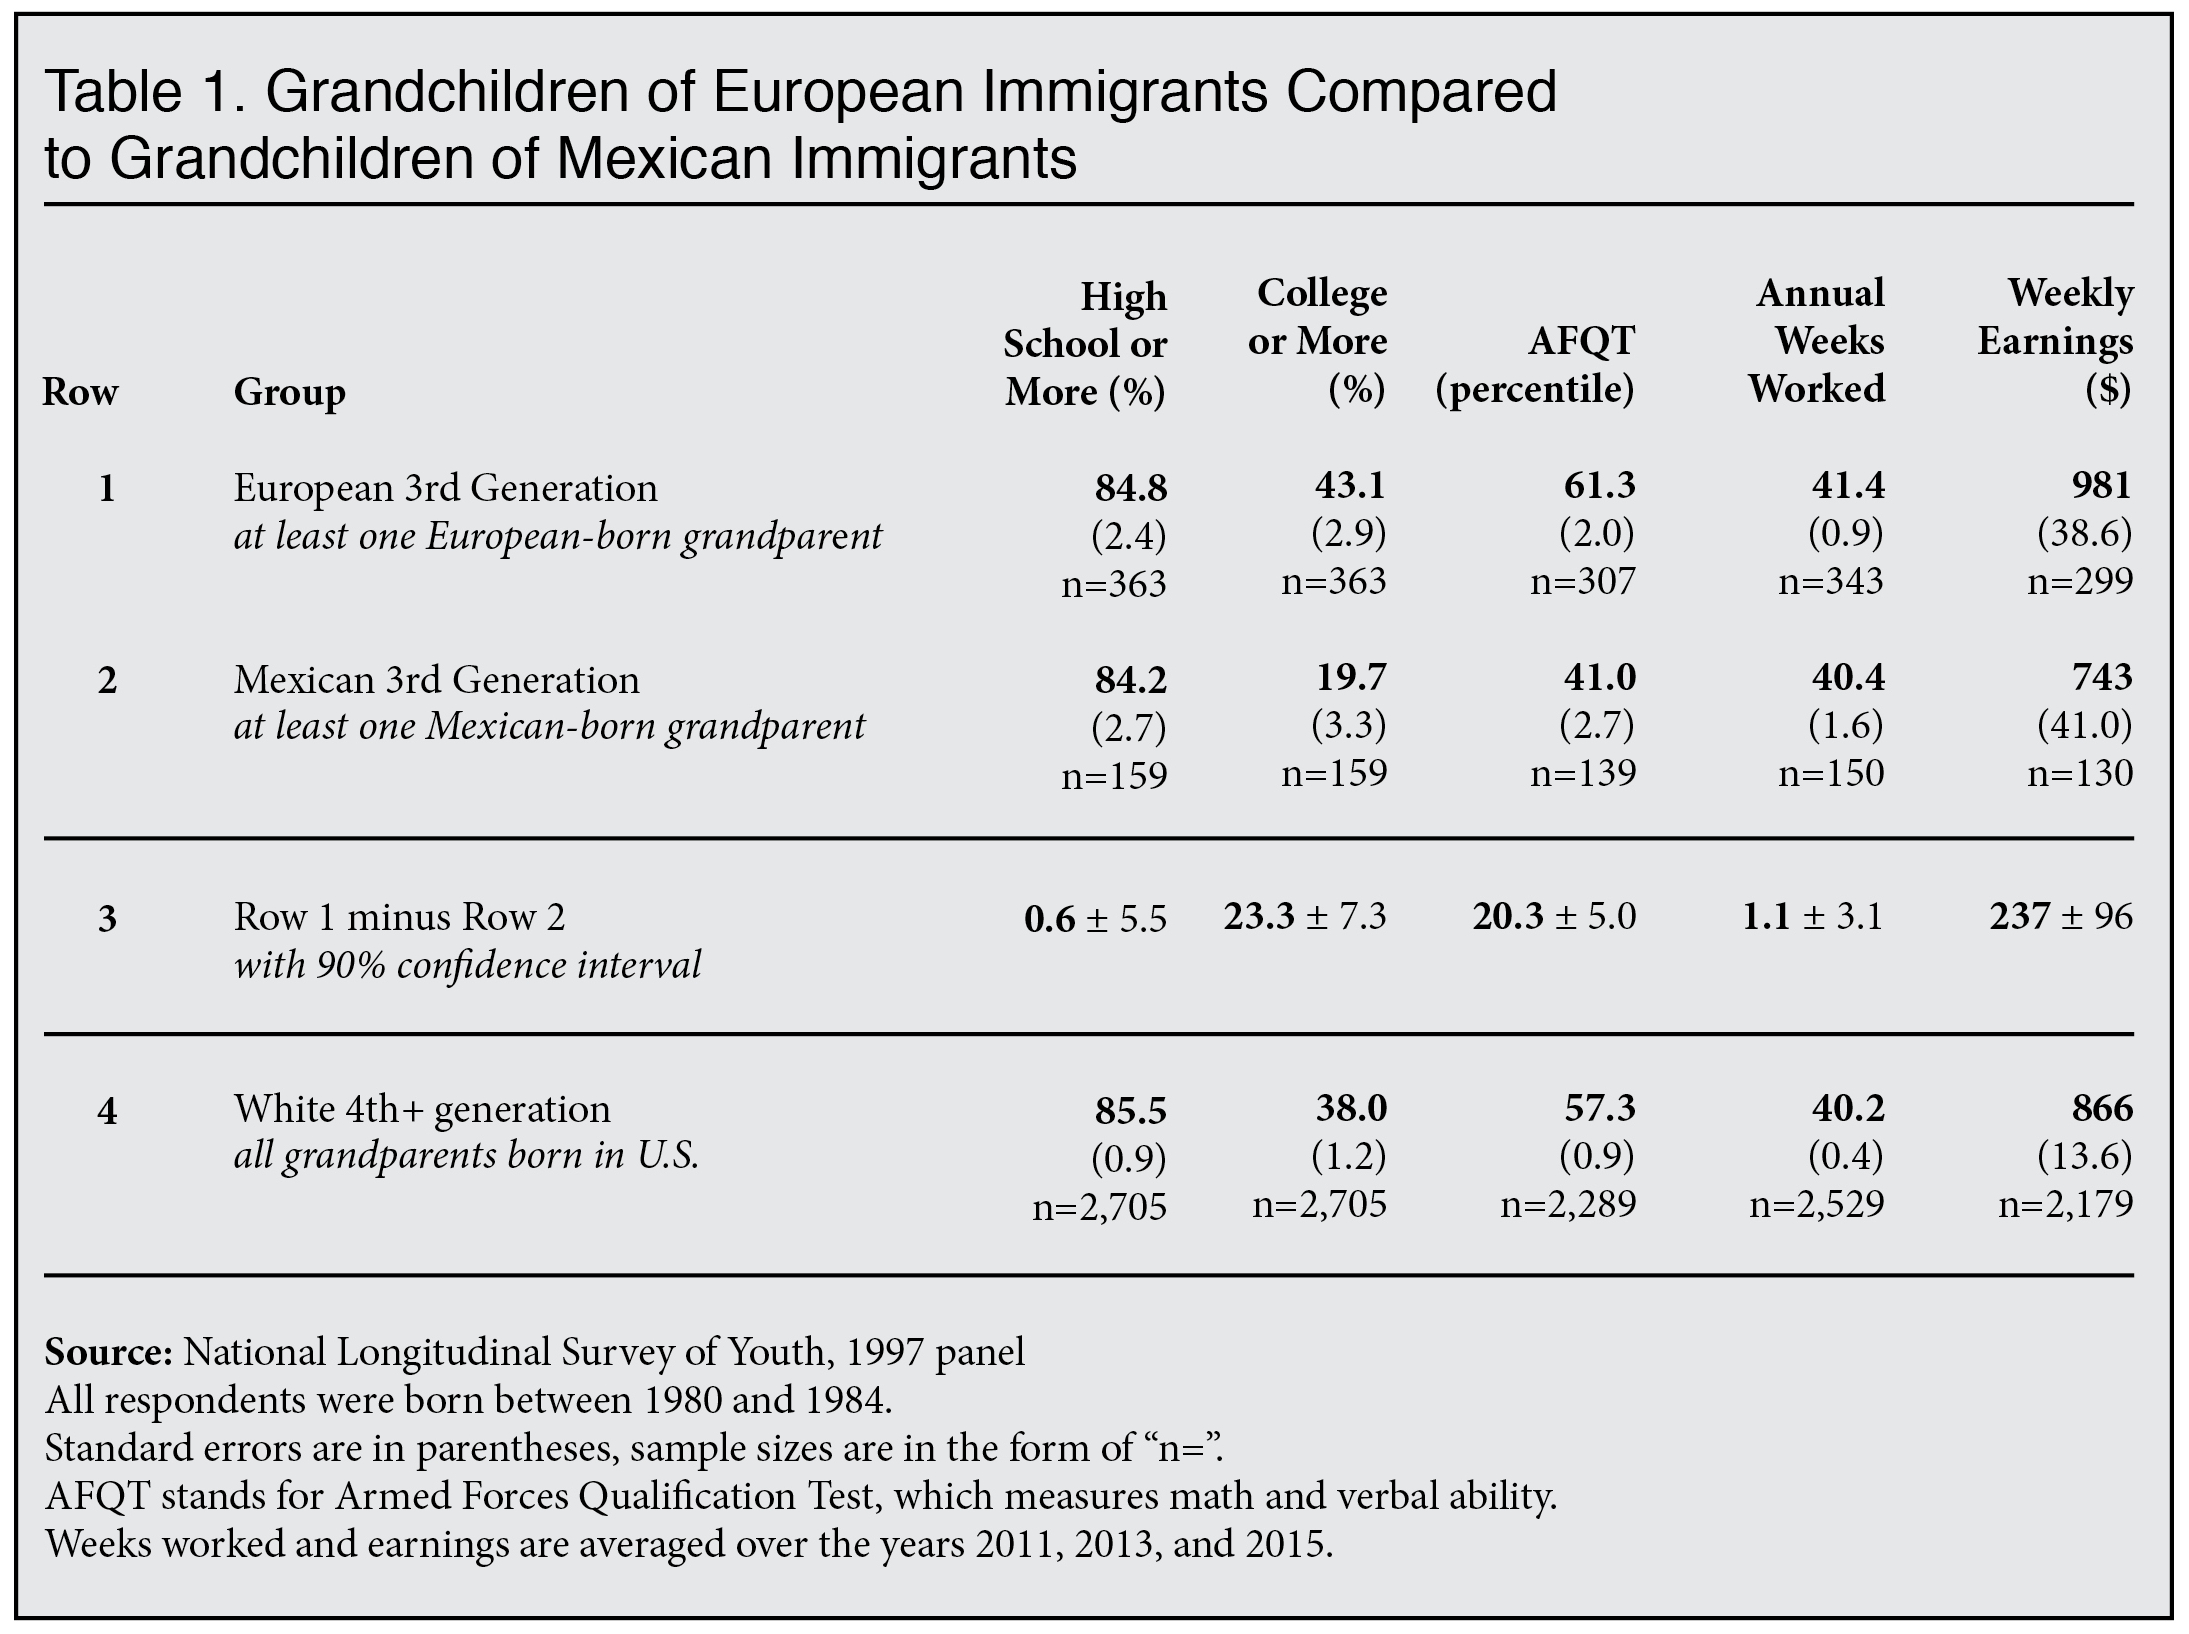
The third-plus generation includes people whose nearest immigrant ancestor varies widely in time. Some are the grandchildren of four immigrants, while others might have 16 U.S.-born great-great grandparents. For a more apples-to-apples comparison, CIS has used the National Longitudinal Survey of Youth to compare the grandchildren of immigrants who arrived from Mexico around 1910-1950 to the grandchildren of immigrants who arrived from Europe during the same time period.
Table 1 shows that the grandchildren of European immigrants have more than double the rate of college completion compared to the grandchildren of Mexican immigrants. The European-descended grandchildren also scored much higher than the Mexican-descended grandchildren on the AFQT, which the military uses to assess math and verbal skills, and they have significantly greater earnings today.
 |
As for crime, a recent CIS report shows that the Hispanic incarceration rate has declined relative to non-Hispanic whites, but it remains notably higher. Table 2 contains the more recent data from the report. Each cell in Table 2 displays a ratio — the Hispanic institutionalization rate divided by the non-Hispanic white rate — and each ratio is statistically adjusted to account for differences in age, sex, and region of residence. For example, U.S.-born Hispanics with Mexican ancestry had an institutionalization rate that was 1.9 times as high as non-Hispanic whites of the same, age, sex, and region in 2019. (Institutionalization is not the same as incarceration, but among the non-elderly it’s a decent approximation.)
Table 2. Hispanic Institutionalization Rate Divided by the Non-Hispanic White Rate, 2019 |
|||
| Ancestry | Foreign-Born | U.S.-Born | Overall |
| Mexican | 0.9 | 1.9 | 1.4 |
| Puerto Rican* | 2.4 | 2.1 | 2.2 |
| Cuban | 0.9 | 1.1 | 1.0 |
| Dominican | 1.1 | 1.8 | 1.3 |
| Central American | 1.0 | 1.2 | 1.0 |
| Overall Hispanic | 1.0 | 2.0 | 1.5 |
|
Source: American Community Survey, 2019. Figures are adjusted for age, sex, and region of residence. * Puerto Ricans are U.S. citizens but are considered "foreign-born" in this analysis if they were born outside of the 50 states. |
|||
Conclusion
Based on the intergenerational analyses presented above, the U.S. Hispanic population is clearly struggling to rise to the same socioeconomic level as non-Hispanic white Americans. By contrast, Noah Smith’s patchwork case for optimism is not compelling. He draws an historical analogy to a different ethnic group (the Irish) arriving in a very different time, conflates improvement in the Hispanic second generation with overall improvement, examines college attendance rather than completion of a four-year degree, and presents statistics on jail rather than overall incarceration.
As important as economic outcomes are, however, it would be a mistake to reduce the entire immigration issue to an earnings contest. As discussed above, immigrants transplant fundamental cultural values such as trust and civic engagement, and those values persist over multiple generations. Even groups that seem relatively homogeneous today, such as white Americans, still exhibit different values reminiscent of their ancestral countries.
Therefore, although it is valuable to assess trends in income and education, the question of whether Hispanics or any other recent immigrant group will fully assimilate “just like the Irish” is based on a false premise. Today’s immigrants will change the culture of the U.S. over the long term just as all immigrant groups have, including the Irish. Those changes may or may not be desirable, which is why Americans must carefully consider the long-term repercussions of mass immigration.