Download a PDF of this Backgrounder.
Jason Richwine, PhD, is a public policy analyst based in Washington, D.C., and a contributing writer at National Review.

When the results of international achievement tests periodically hit the news in the United States, the country-by-country rankings receive most of the attention. However, the scores of demographic subgroups within the United States should be just as interesting, since achievement is hardly uniform throughout the nation. In fact, if treated as separate "countries" for the sake of analysis, various U.S. subgroups would span the international rankings from top to bottom.
This report examines how immigrants in the United States perform on international tests, with comparisons both to native-born Americans and to the broader Organization for Economic Cooperation and Development (OECD). The results indicate that the United States has failed to bring the achievement level of low-skill immigrants and their children up to parity with other Americans. Continued low-skill immigration is likely to exacerbate the challenges already faced by the U.S. school system.
In this report, "first-generation" refers to people who are foreign-born; "second generation" means U.S.-born with at least one foreign-born parent; and "third-plus generation" means U.S.-born with two U.S.-born parents.
- First-generation immigrants score consistently lower than the native-born in the United States. For example, on the PISA science test, Americans who are foreign-born would rank 33rd among the 36 participating OECD countries, while native-born Americans would rank 16th.
- Second-generation immigrants score generally around the same level as the native-born as a whole. However, the average hides a disparity between immigrant groups. The scores of Asian Americans (a rough proxy for higher-skill immigrants and their children) are usually among the best in the OECD, but the scores of second-generation Hispanics (a rough proxy for the children of lower-skill immigrants) still lag behind.
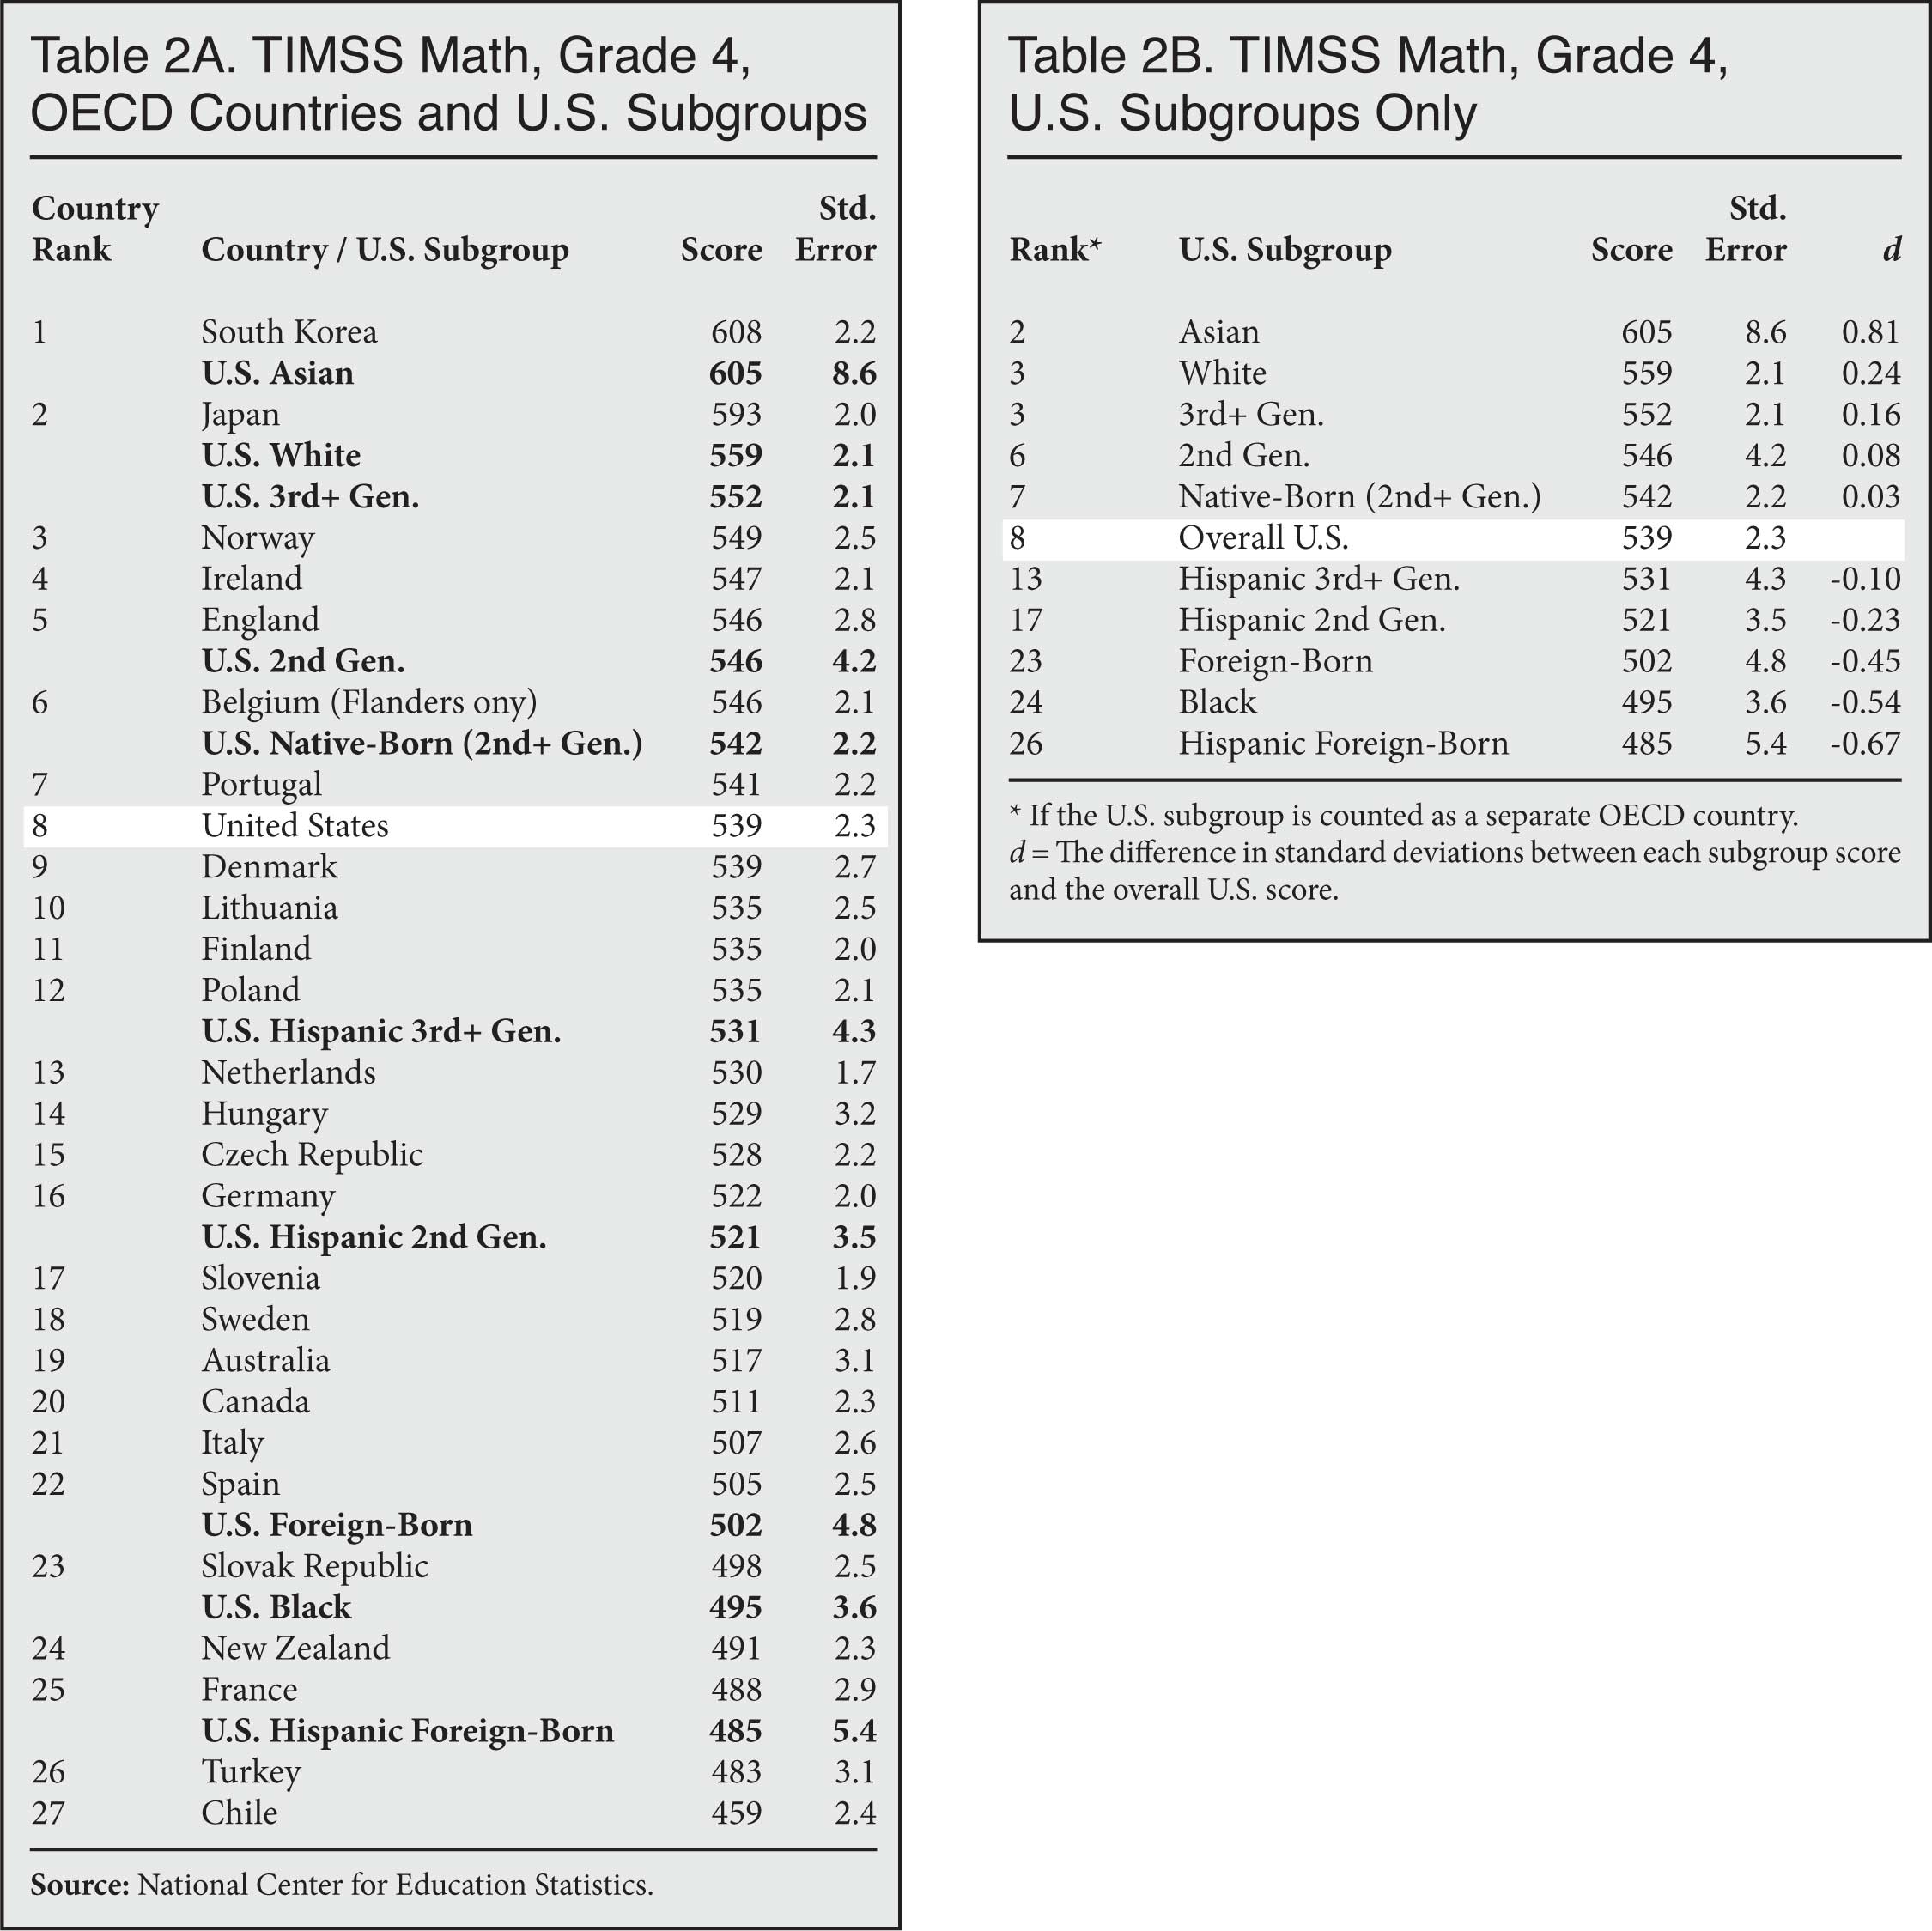
- To illustrate that disparity, the United States as a whole ranks eighth among 27 participating OECD countries on the TIMSS math test for fourth-graders. But U.S. Asians would have the second-highest score in the OECD, while the children of Hispanic immigrants would rank 17th.
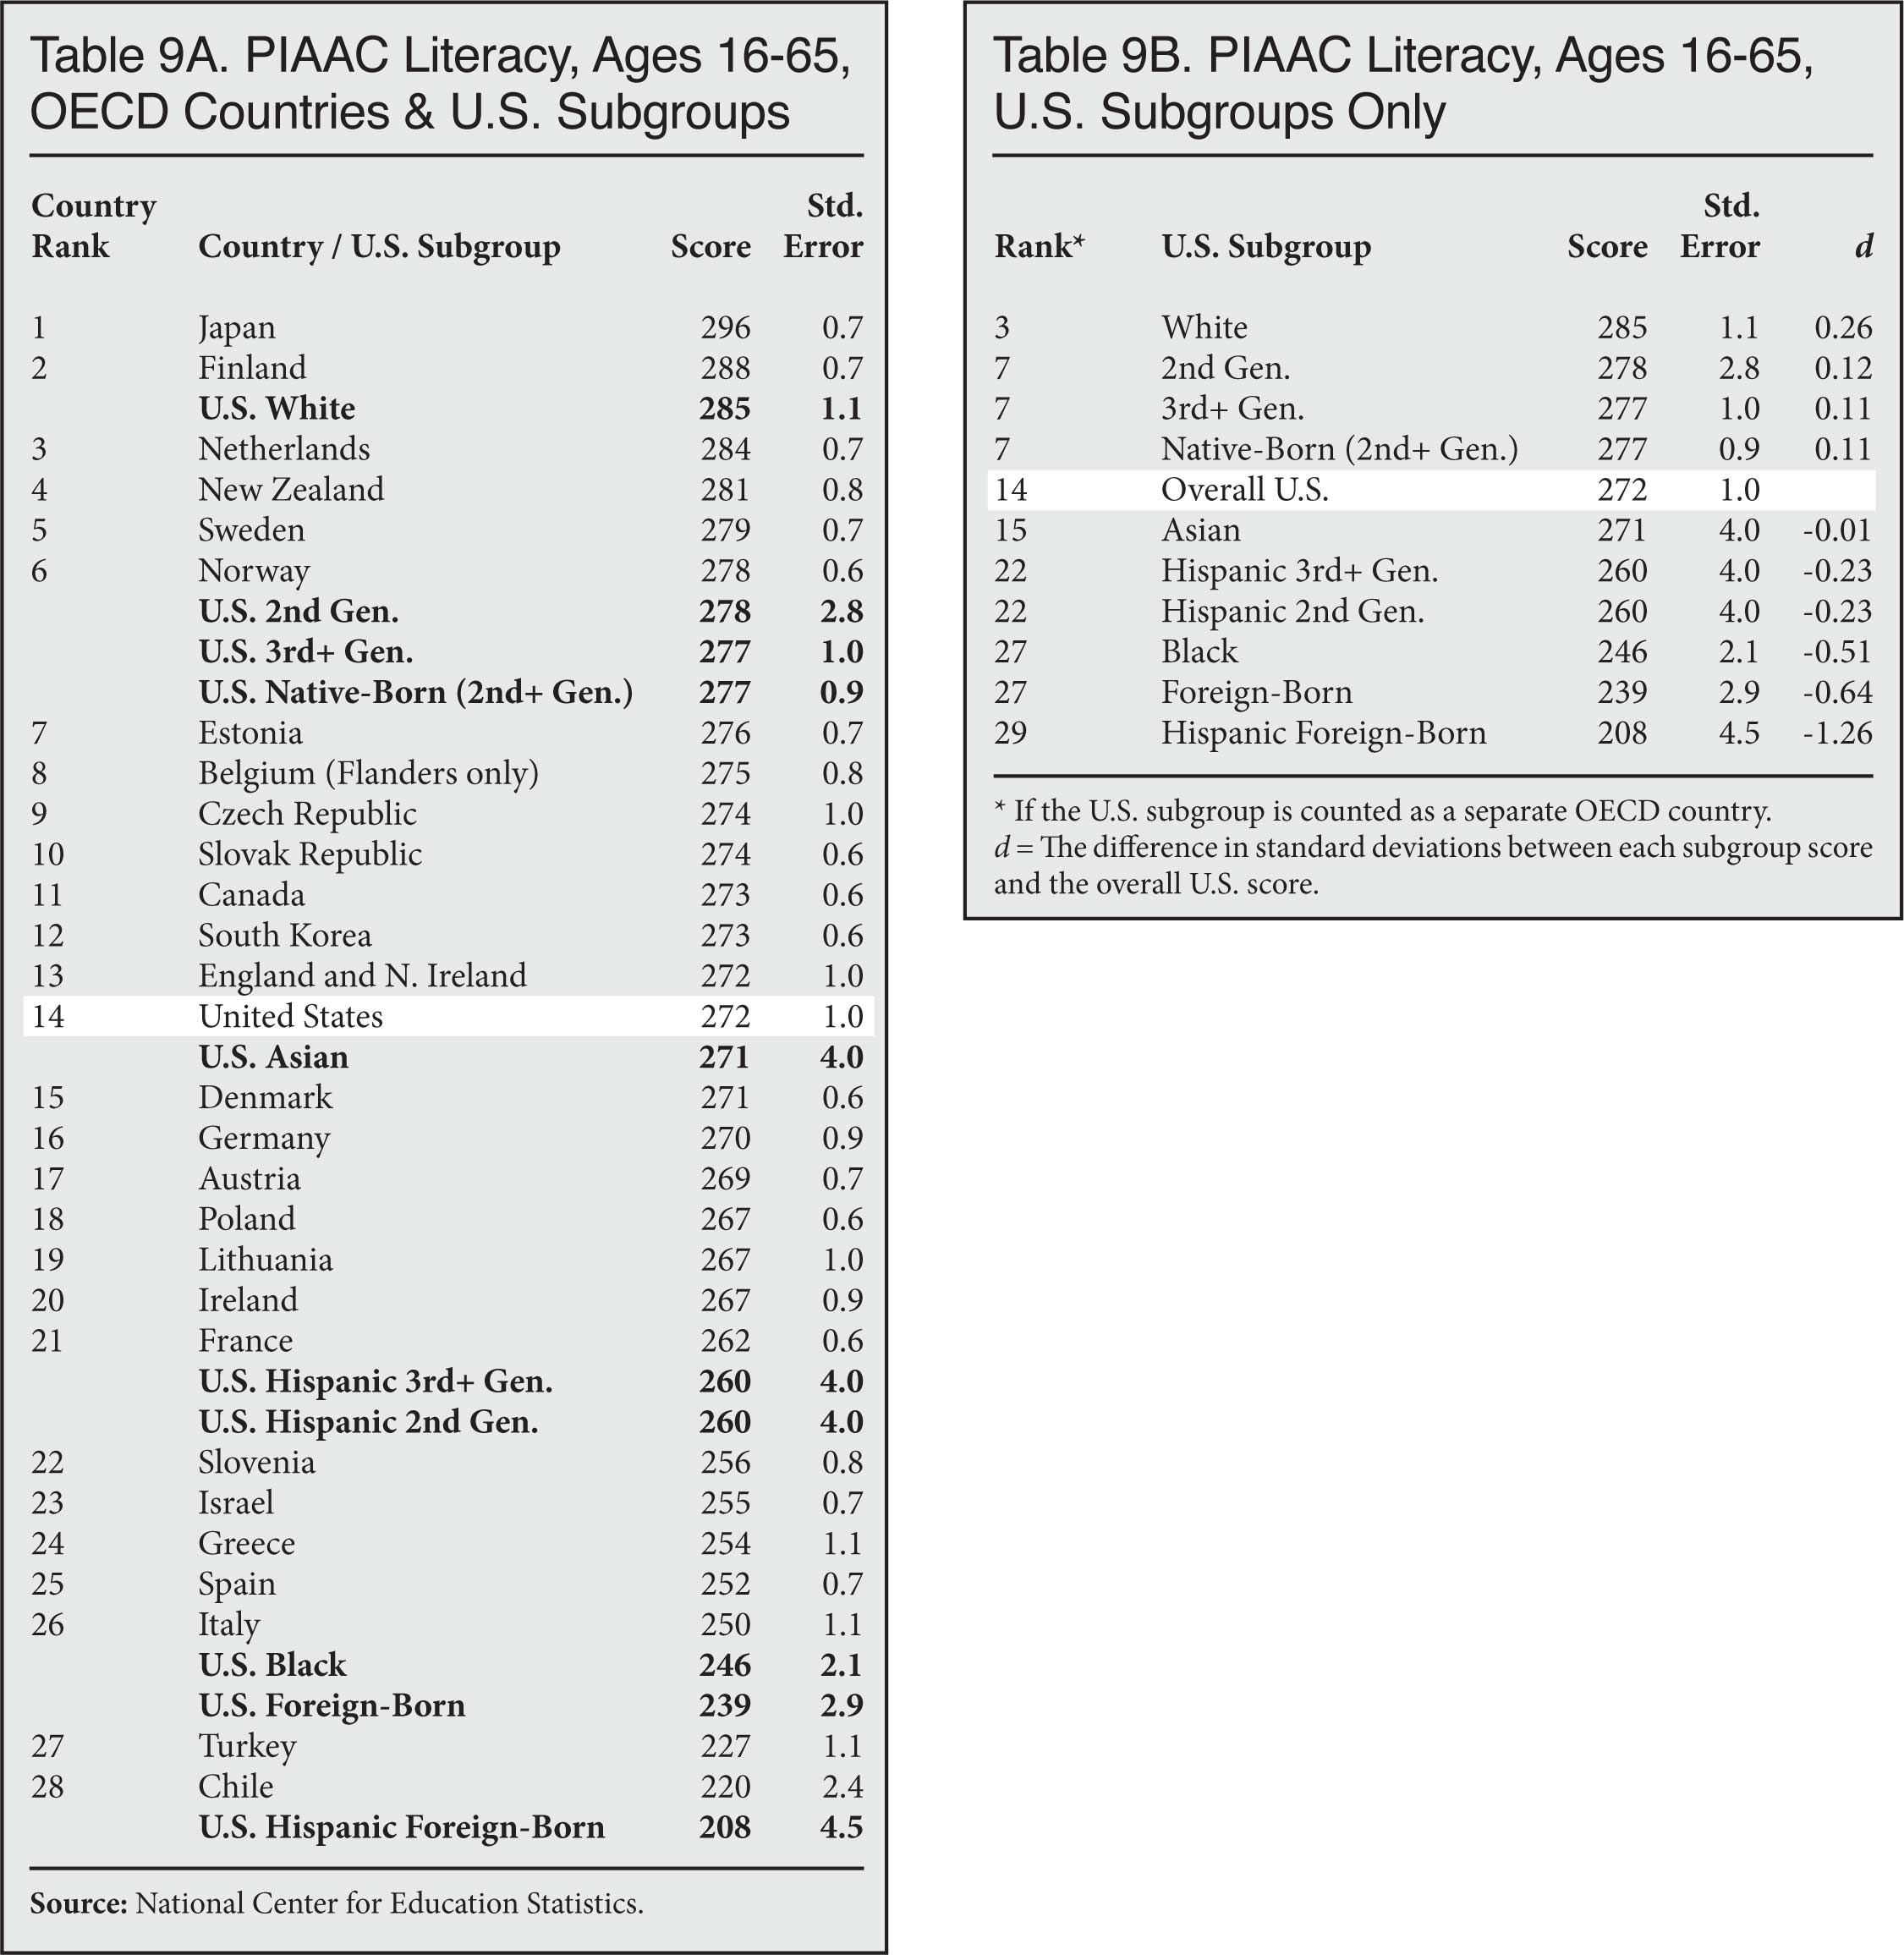
- Hispanic-Americans who are in the third-plus generation continue to score below average. For example, they would rank 22nd among OECD countries on the PIAAC literacy test — essentially the same score as second-generation Hispanics, and 15 places below the U.S.-born as a whole.
- These results are a reminder that skills differ among immigrants, and that the differences persist to some degree over multiple generations. Continuing our current immigration policy, which accepts a large share of adults with low levels of education, is likely to further strain the U.S. school system and add to the challenge of educating children from disadvantaged backgrounds.
Understanding the Tables
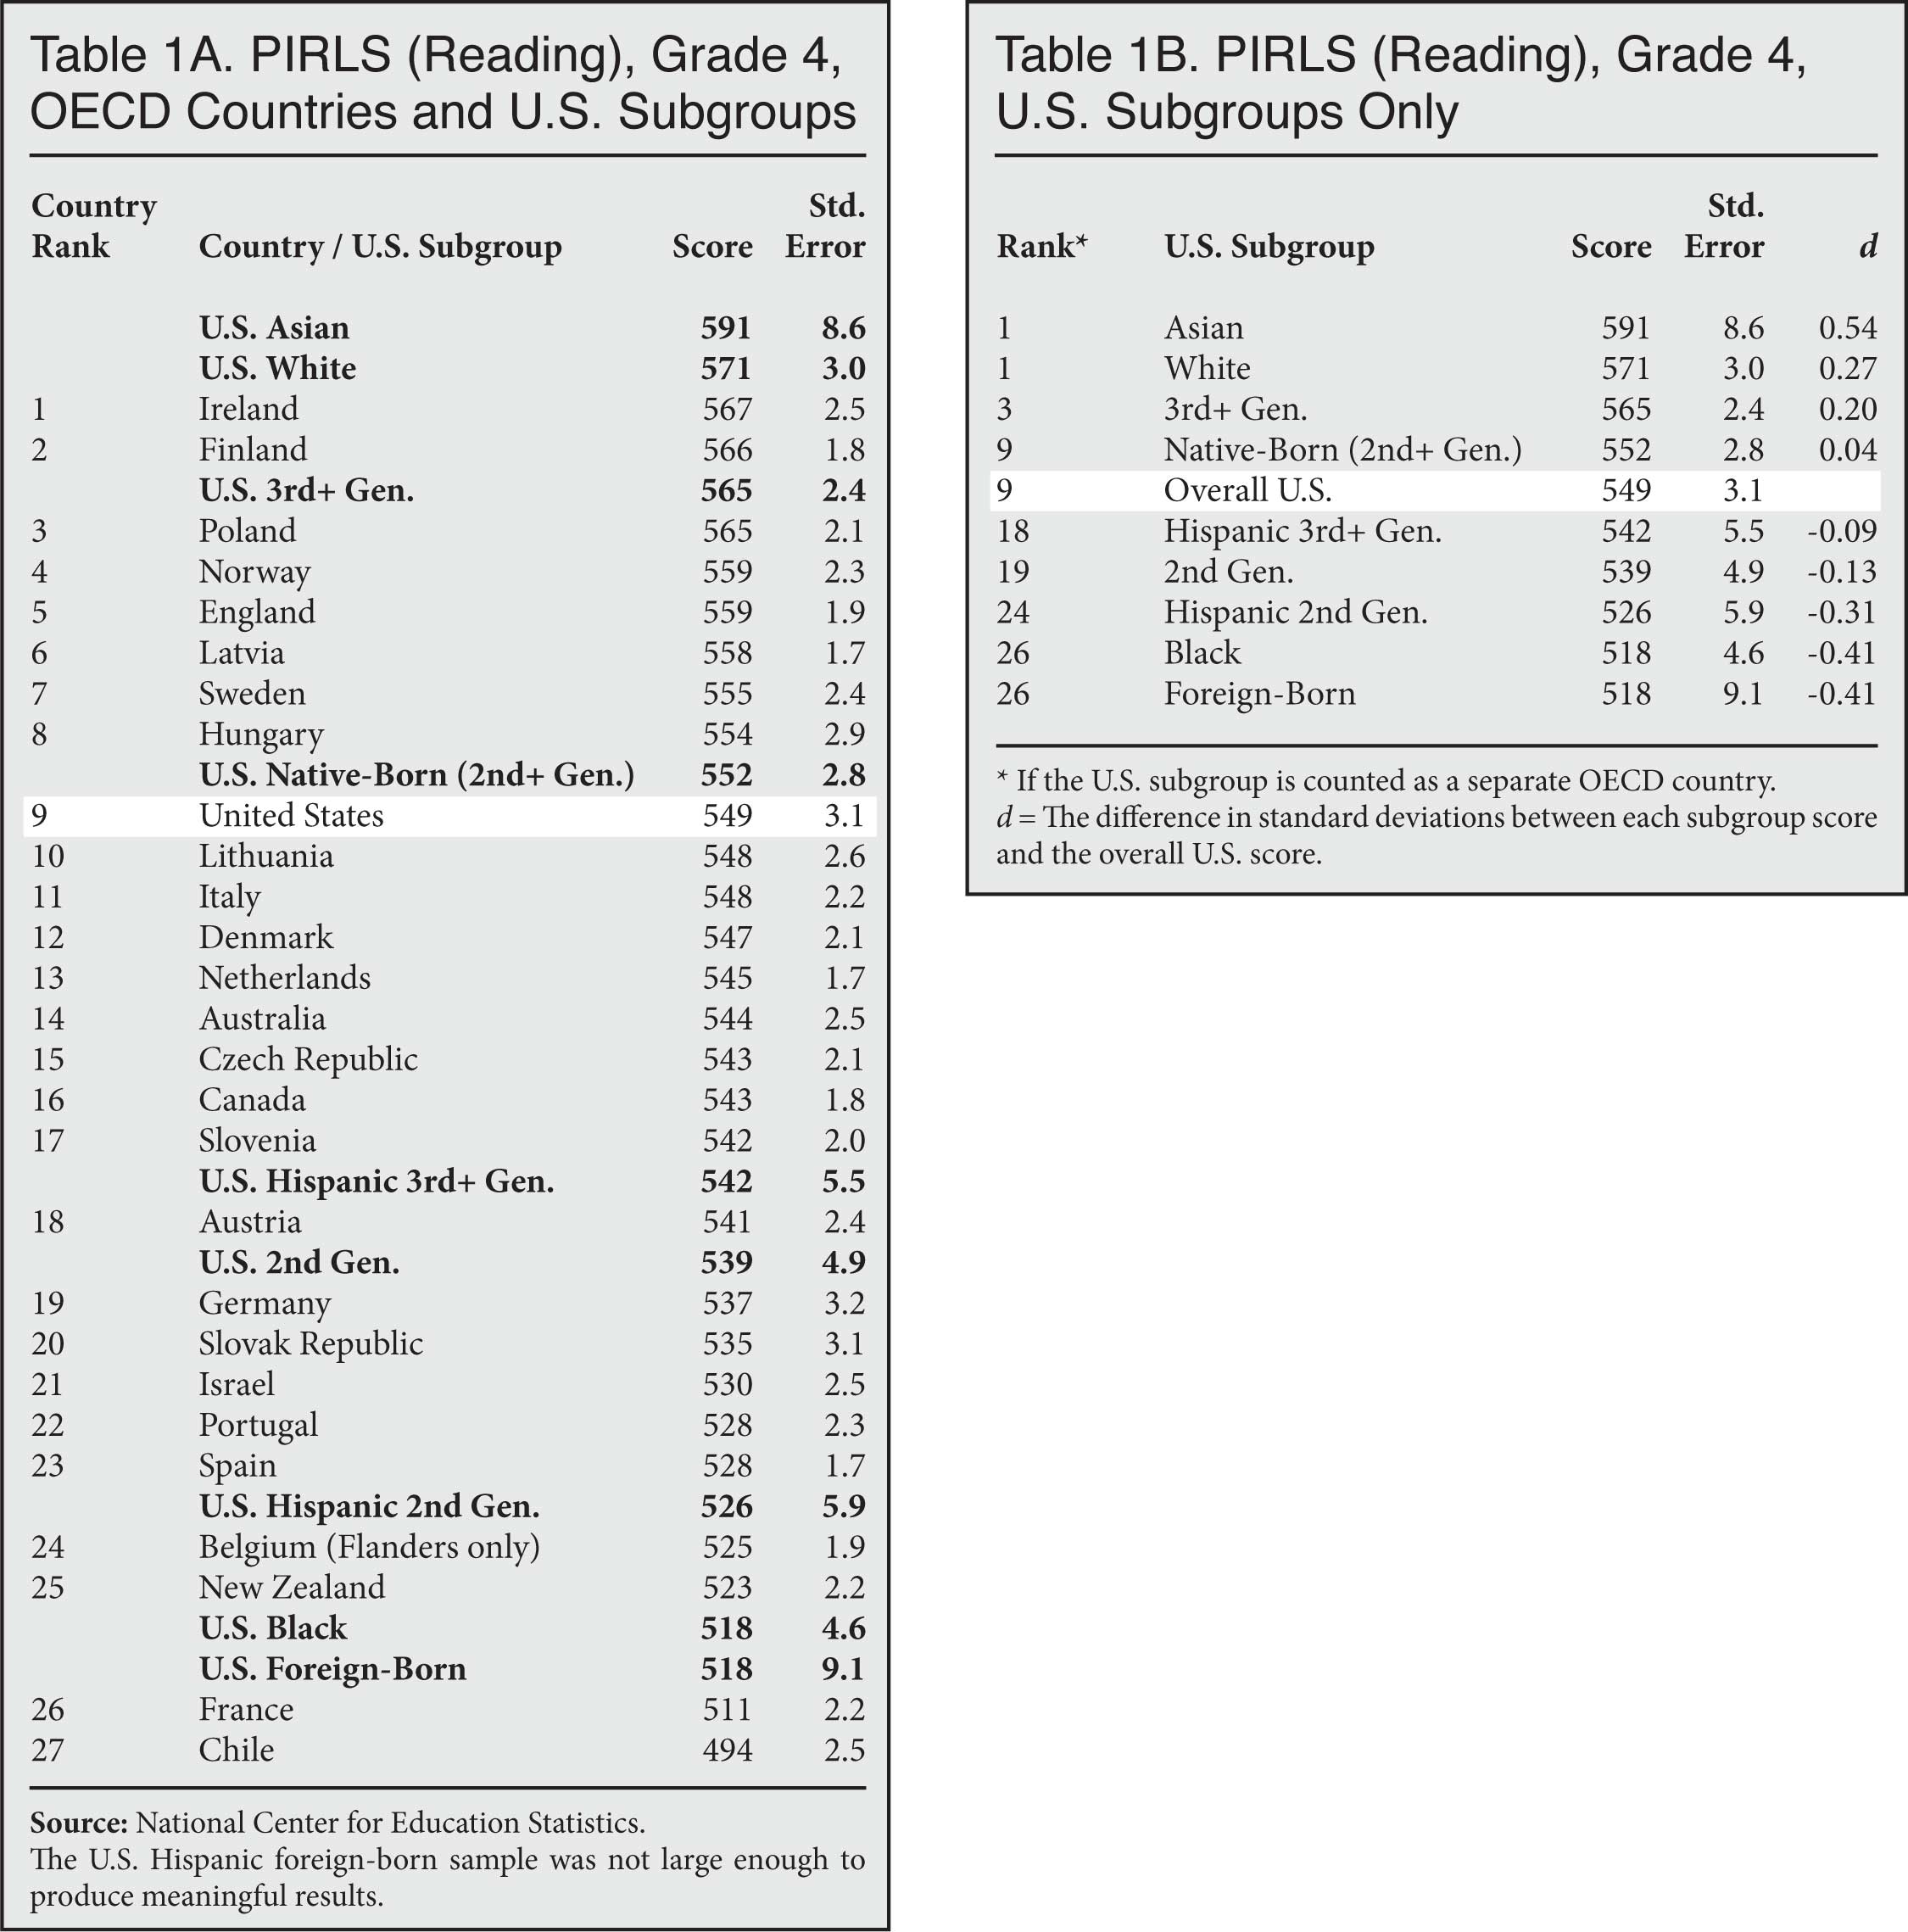
This report shows how U.S. subgroups perform on international test batteries known as PIRLS, TIMSS, PISA, and PIAAC. Two tables are provided for each test. The "A" table intersperses the scores of U.S. subgroups on a ranked list of OECD countries. For example, Table 1A shows that second-generation immigrants in the United States score between Austria (18th overall) and Germany (19th overall) on the PIRLS. The "B" table is a consolidated version of the "A" table. It shows only U.S. subgroups and gives each an OECD rank as if it were its own country. For example, Table 1B shows that the foreign-born population in the United States would rank 26th in the OECD if treated as a separate country when taking the PIRLS.
The subgroup ranks in the "B" table are calculated as if each subgroup were added to the country list by itself, not together with other subgroups. For example, Table 1B shows that both Asian-Americans and white Americans would rank first among OECD countries on the PIRLS. This means that if Asian-Americans are the only subgroup that counts as its own OECD country, they would rank first. If instead white Americans were the only subgroup treated as a country, they would also rank first.
The "B" table adds additional information about score differences in the d column, which will be of interest primarily to researchers with some background in educational measurement. It refers to the difference in standard deviations between each subgroup score and the overall U.S. score.1
U.S. subgroups are identified to the extent that the sample size allows. Hispanic-Americans are a large enough group that their scores can be separated by generation on most of the tests. Asian-Americans, however, are not numerous enough to separate by nativity. In fact, in the case of the PISA tests, scores for Asians are not reported at all due to low precision — in this case, a standard error above 10.
All scores are sourced from the National Center for Education Statistics, using the most recent test administrations for which full data is available.2 The tests were administered in English in the United States and translated as needed in foreign countries. Finally, although some non-OECD countries participated in each test, this report is limited to OECD countries to ensure quality in test administration and greater consistency in the rankings.3
Discussion
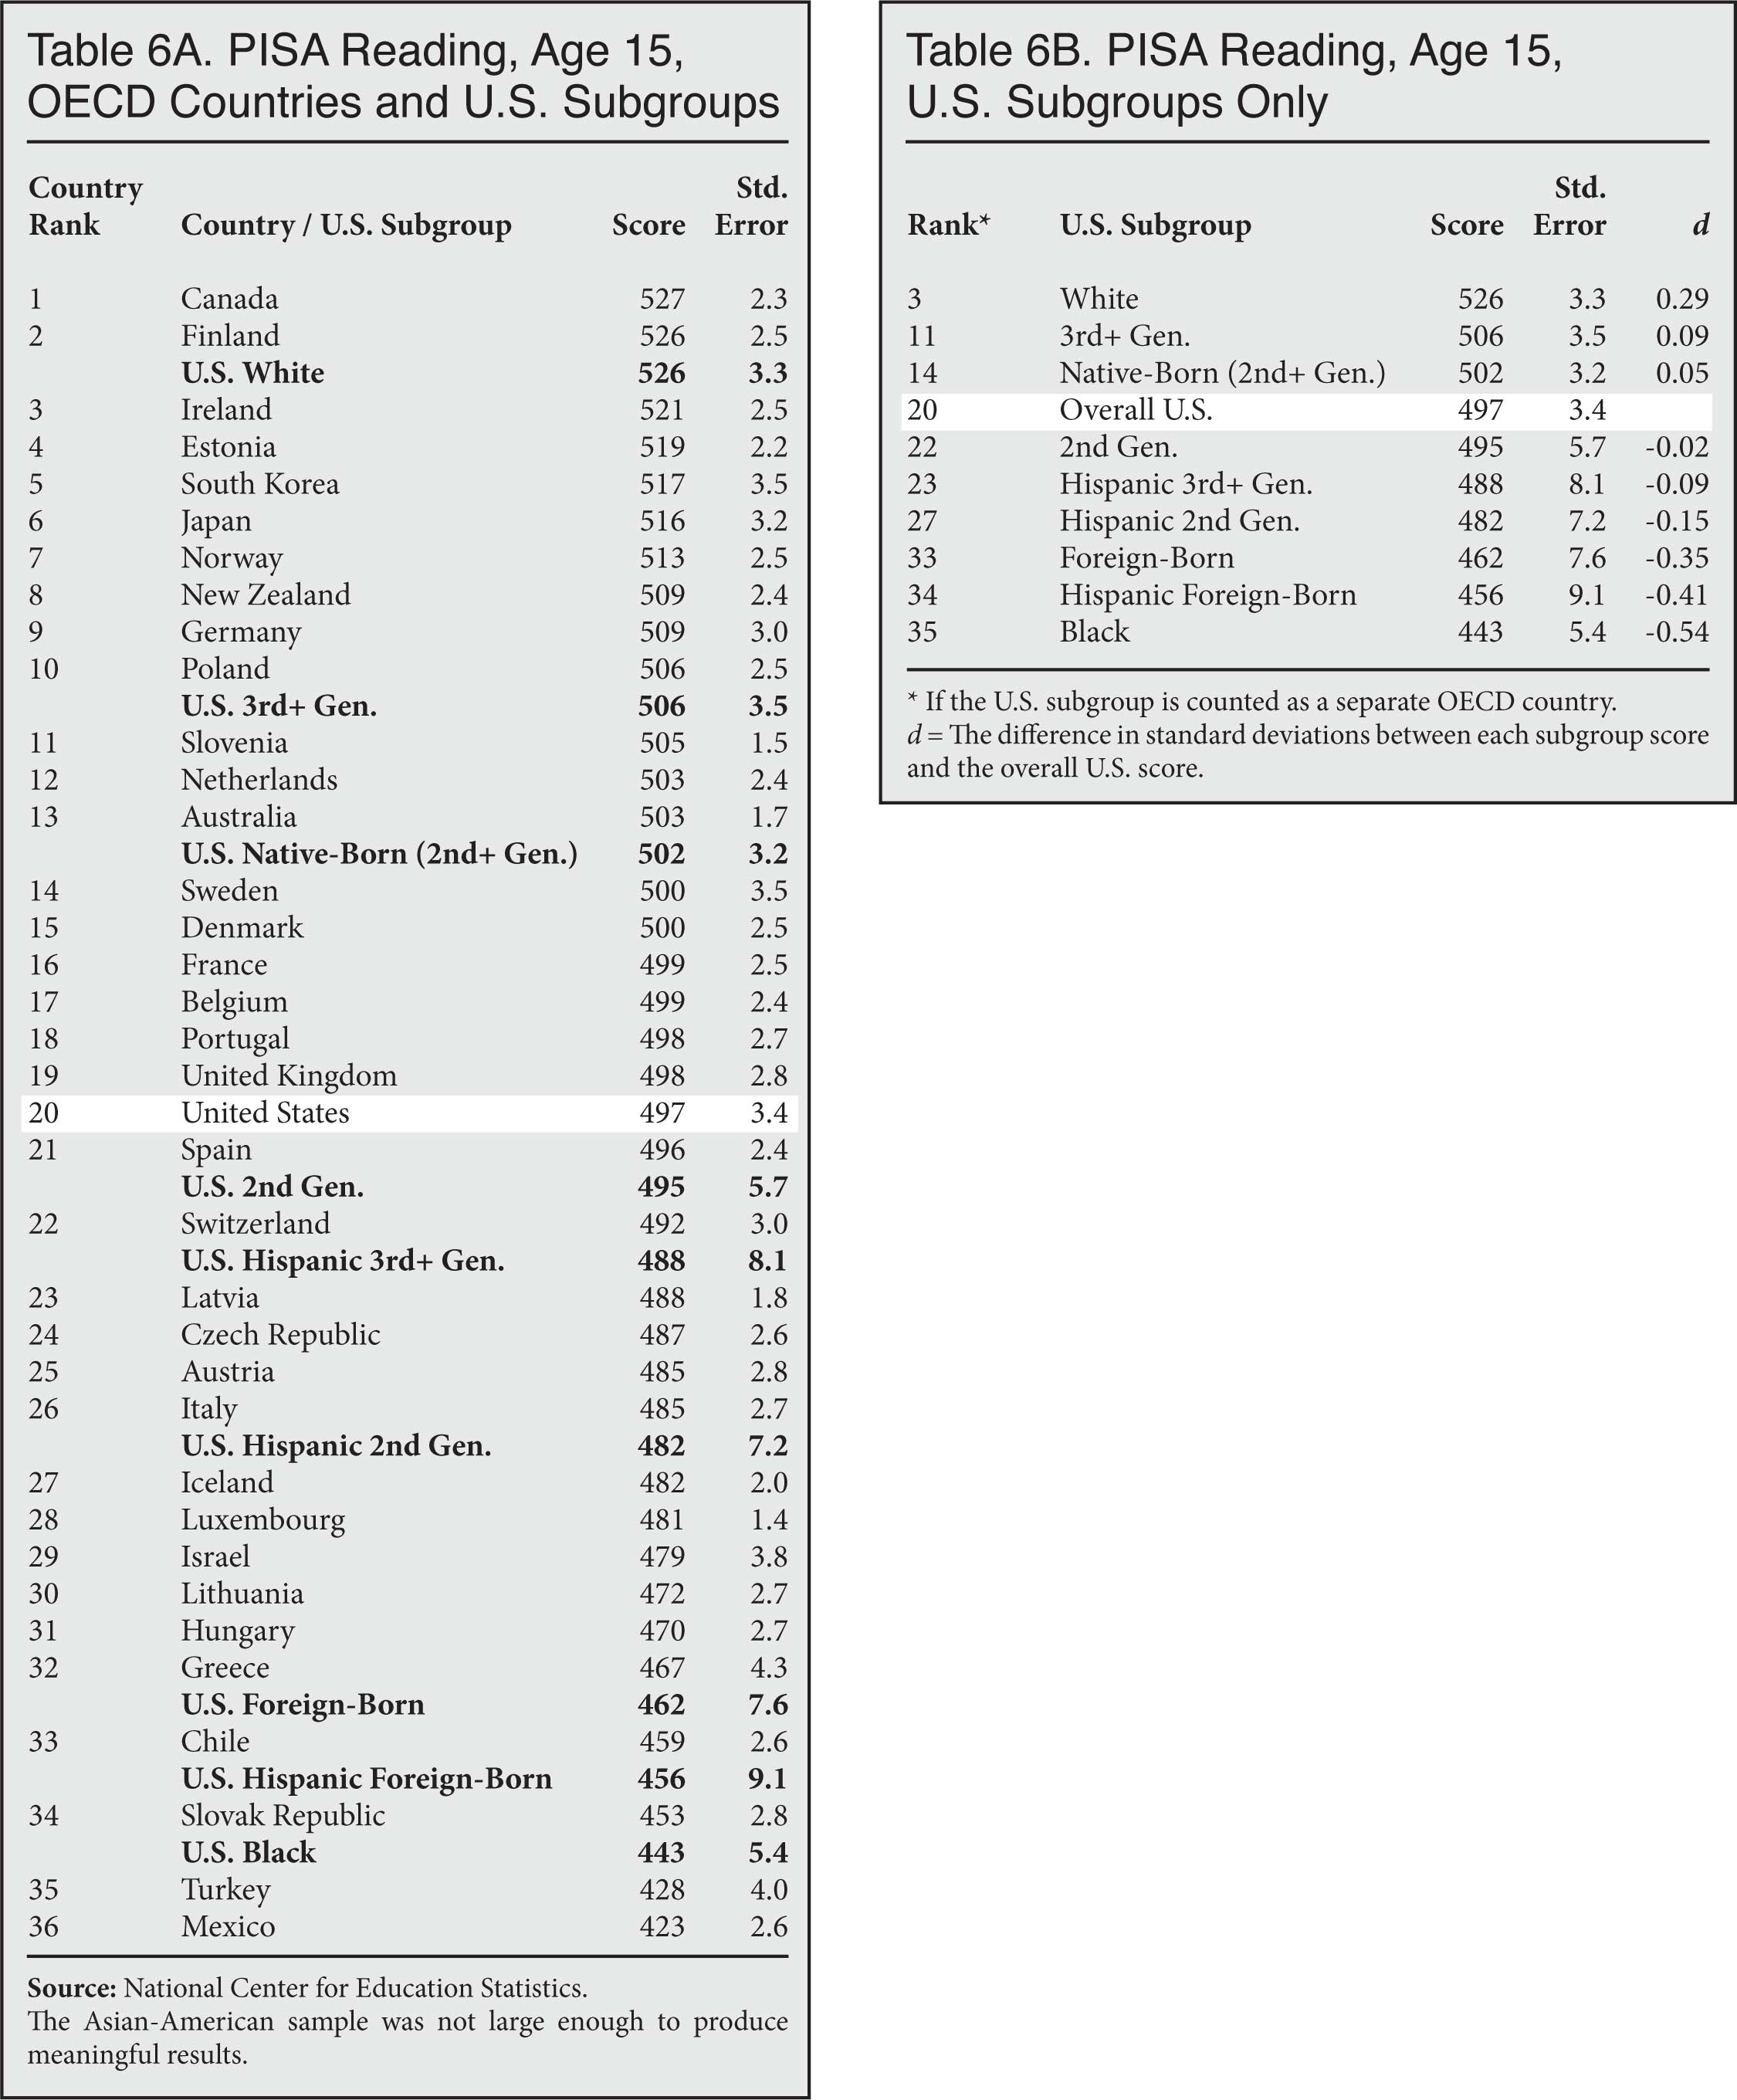
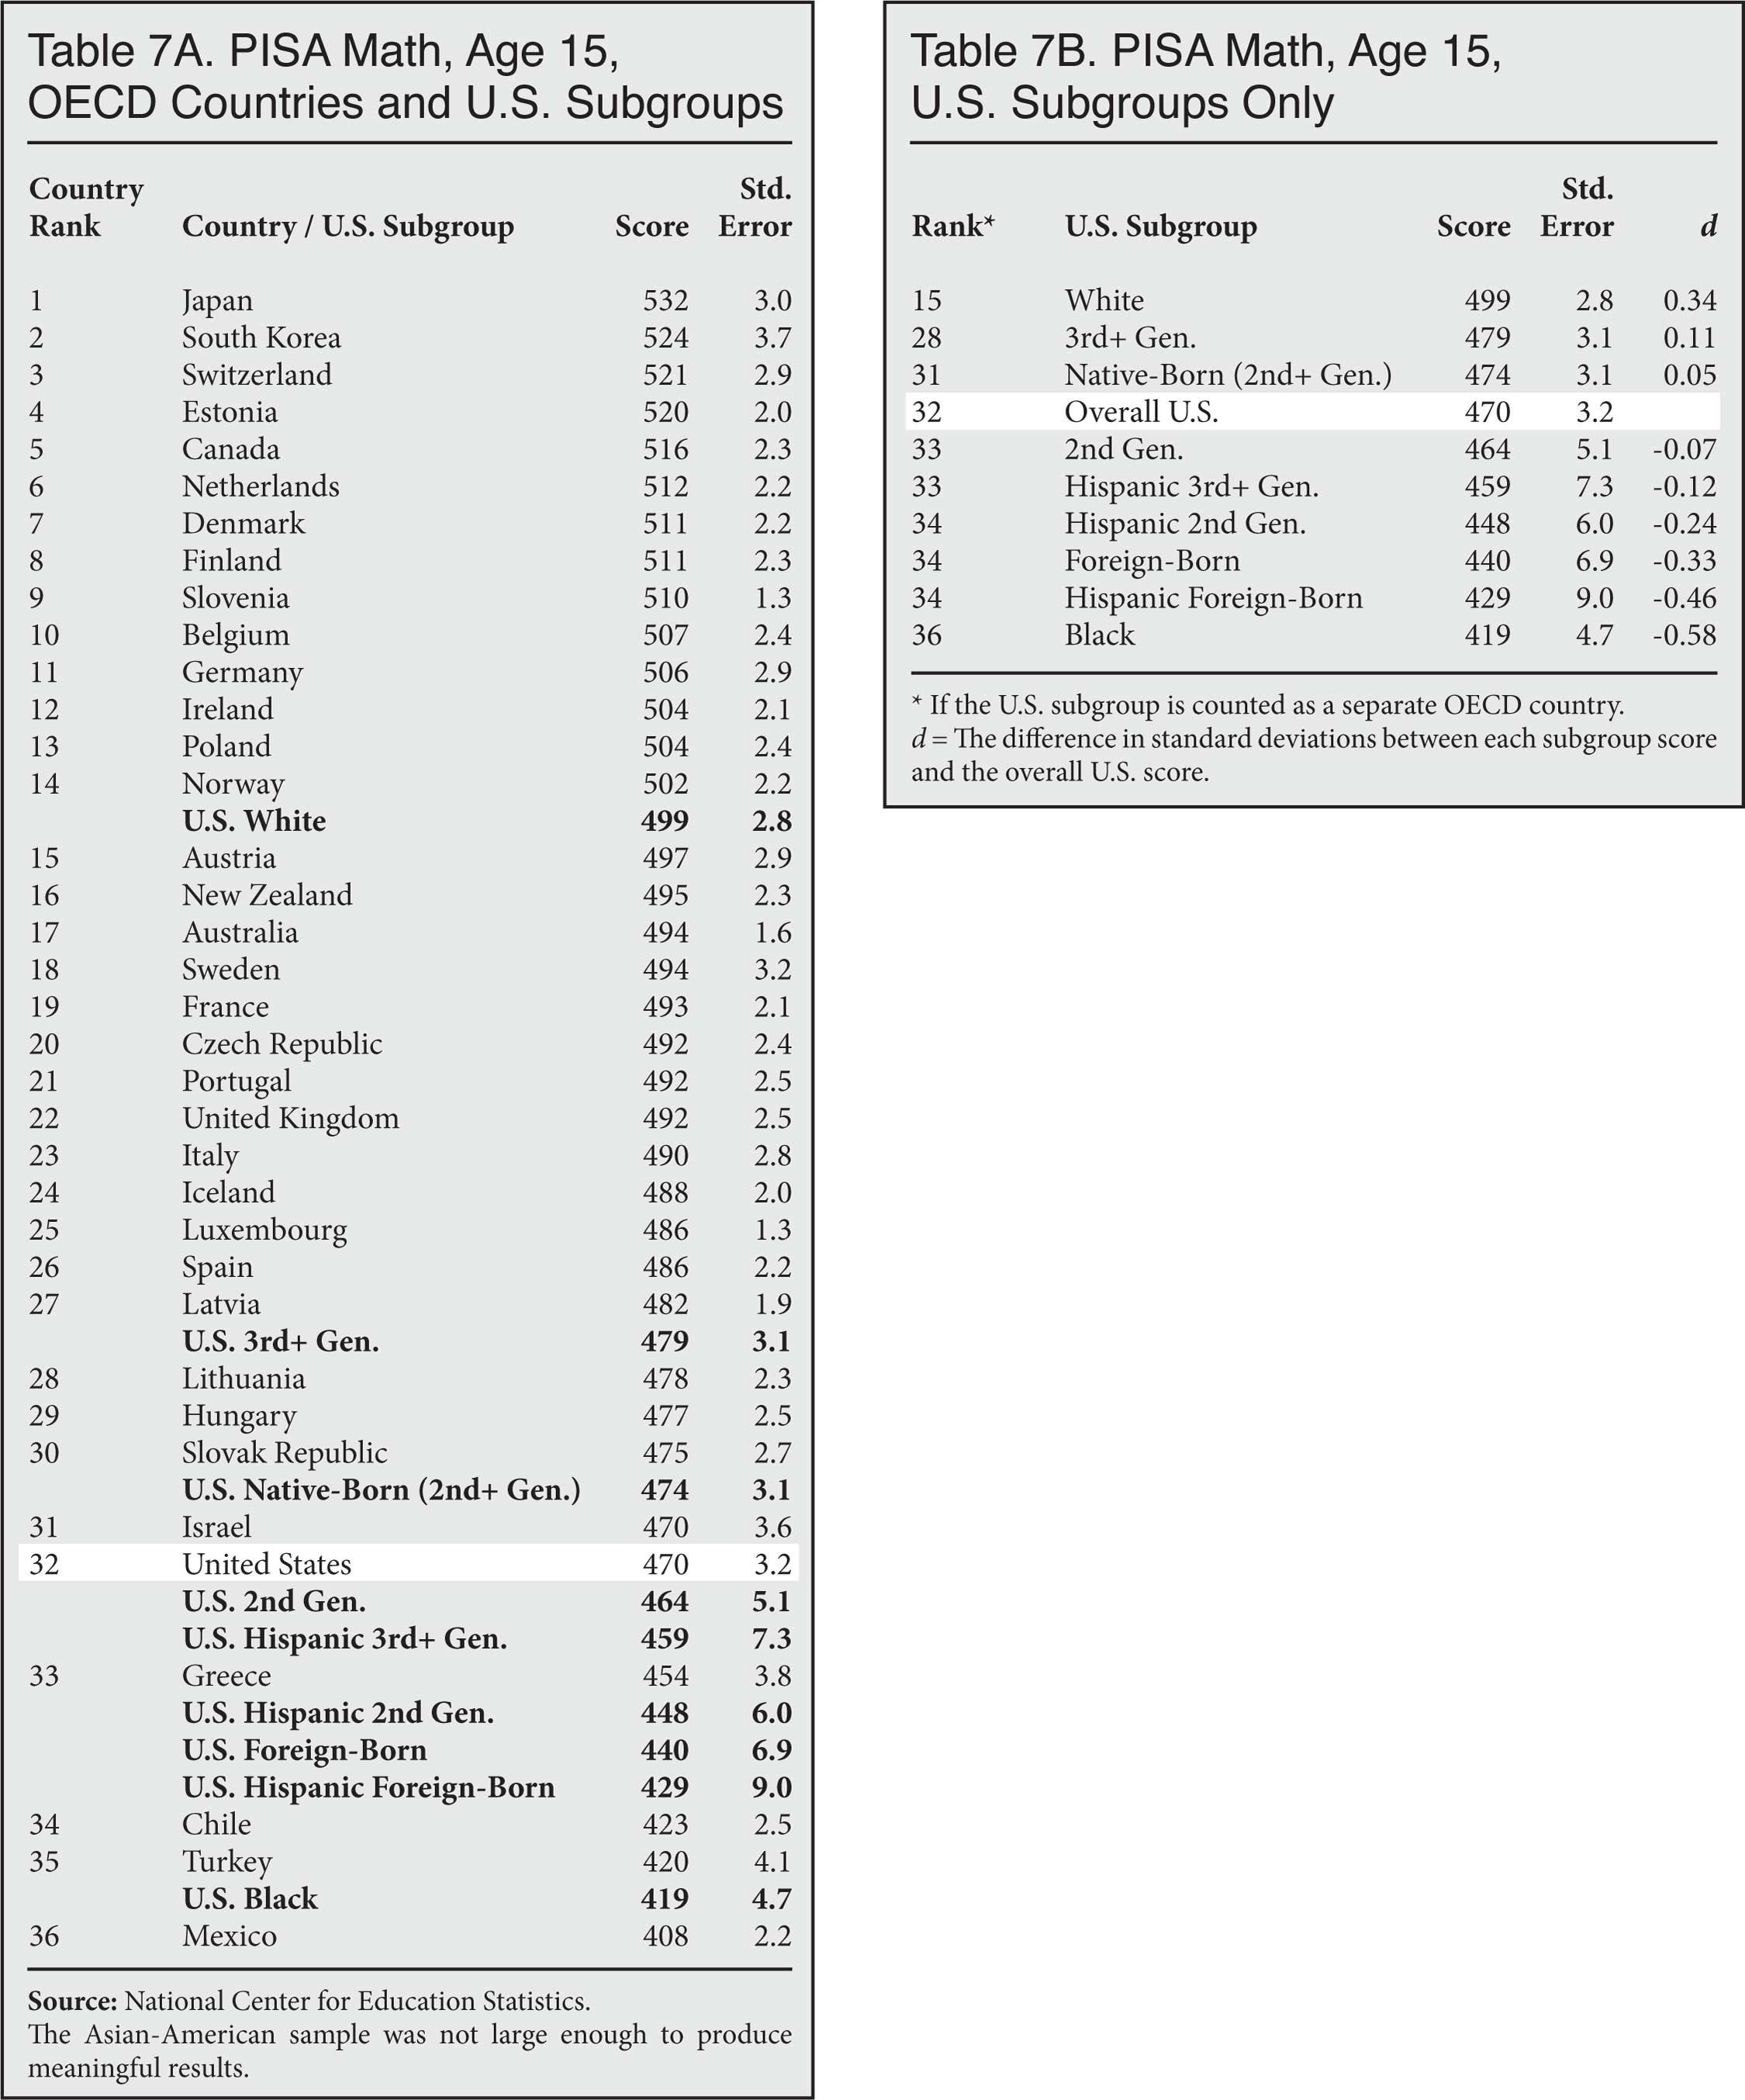
As the tables below indicate, U.S. performance varies depending on the subject matter and the age of the test-takers. Generally speaking, U.S. students tend to perform better in reading than in math, and their scores slip relative to the rest of the OECD as they age. Despite the variance across tests, however, a clear pattern emerges in the performance of immigrants vs. the native-born: Immigrants as a group always score lower. For example, on the PISA reading test, Americans who are native-born would rank 14th among the 36 participating OECD countries, while foreign-born Americans would rank 33rd.
Due to learning English and attending U.S. schools from a young age, second-generation immigrants generally catch up to the rest of the native-born. However, the catch-up disguises a score gap between immigrant groups. Asian-Americans (mostly higher-skill immigrants and their children) score well above U.S. natives as a whole. In contrast, second-generation Hispanics (the children of mostly lower-skill immigrants) continue to score below average, as do third-plus generation Hispanics.4
Immigrants and native-born Americans clearly do not have identical skill sets, and they do not become identical simply by virtue of acculturation. The U.S. educational system has struggled with persistent achievement gaps among subgroups, and continuing to accept a large share of adults with low levels of education is likely to make that challenge even more difficult. If the United States wants to improve the achievement level of future immigrants and their children, it should implement a selection system that better emphasizes skills.
PIRLS
The Progress in International Reading Literacy Study (PIRLS) was administered to fourth-graders in 2016.
 |
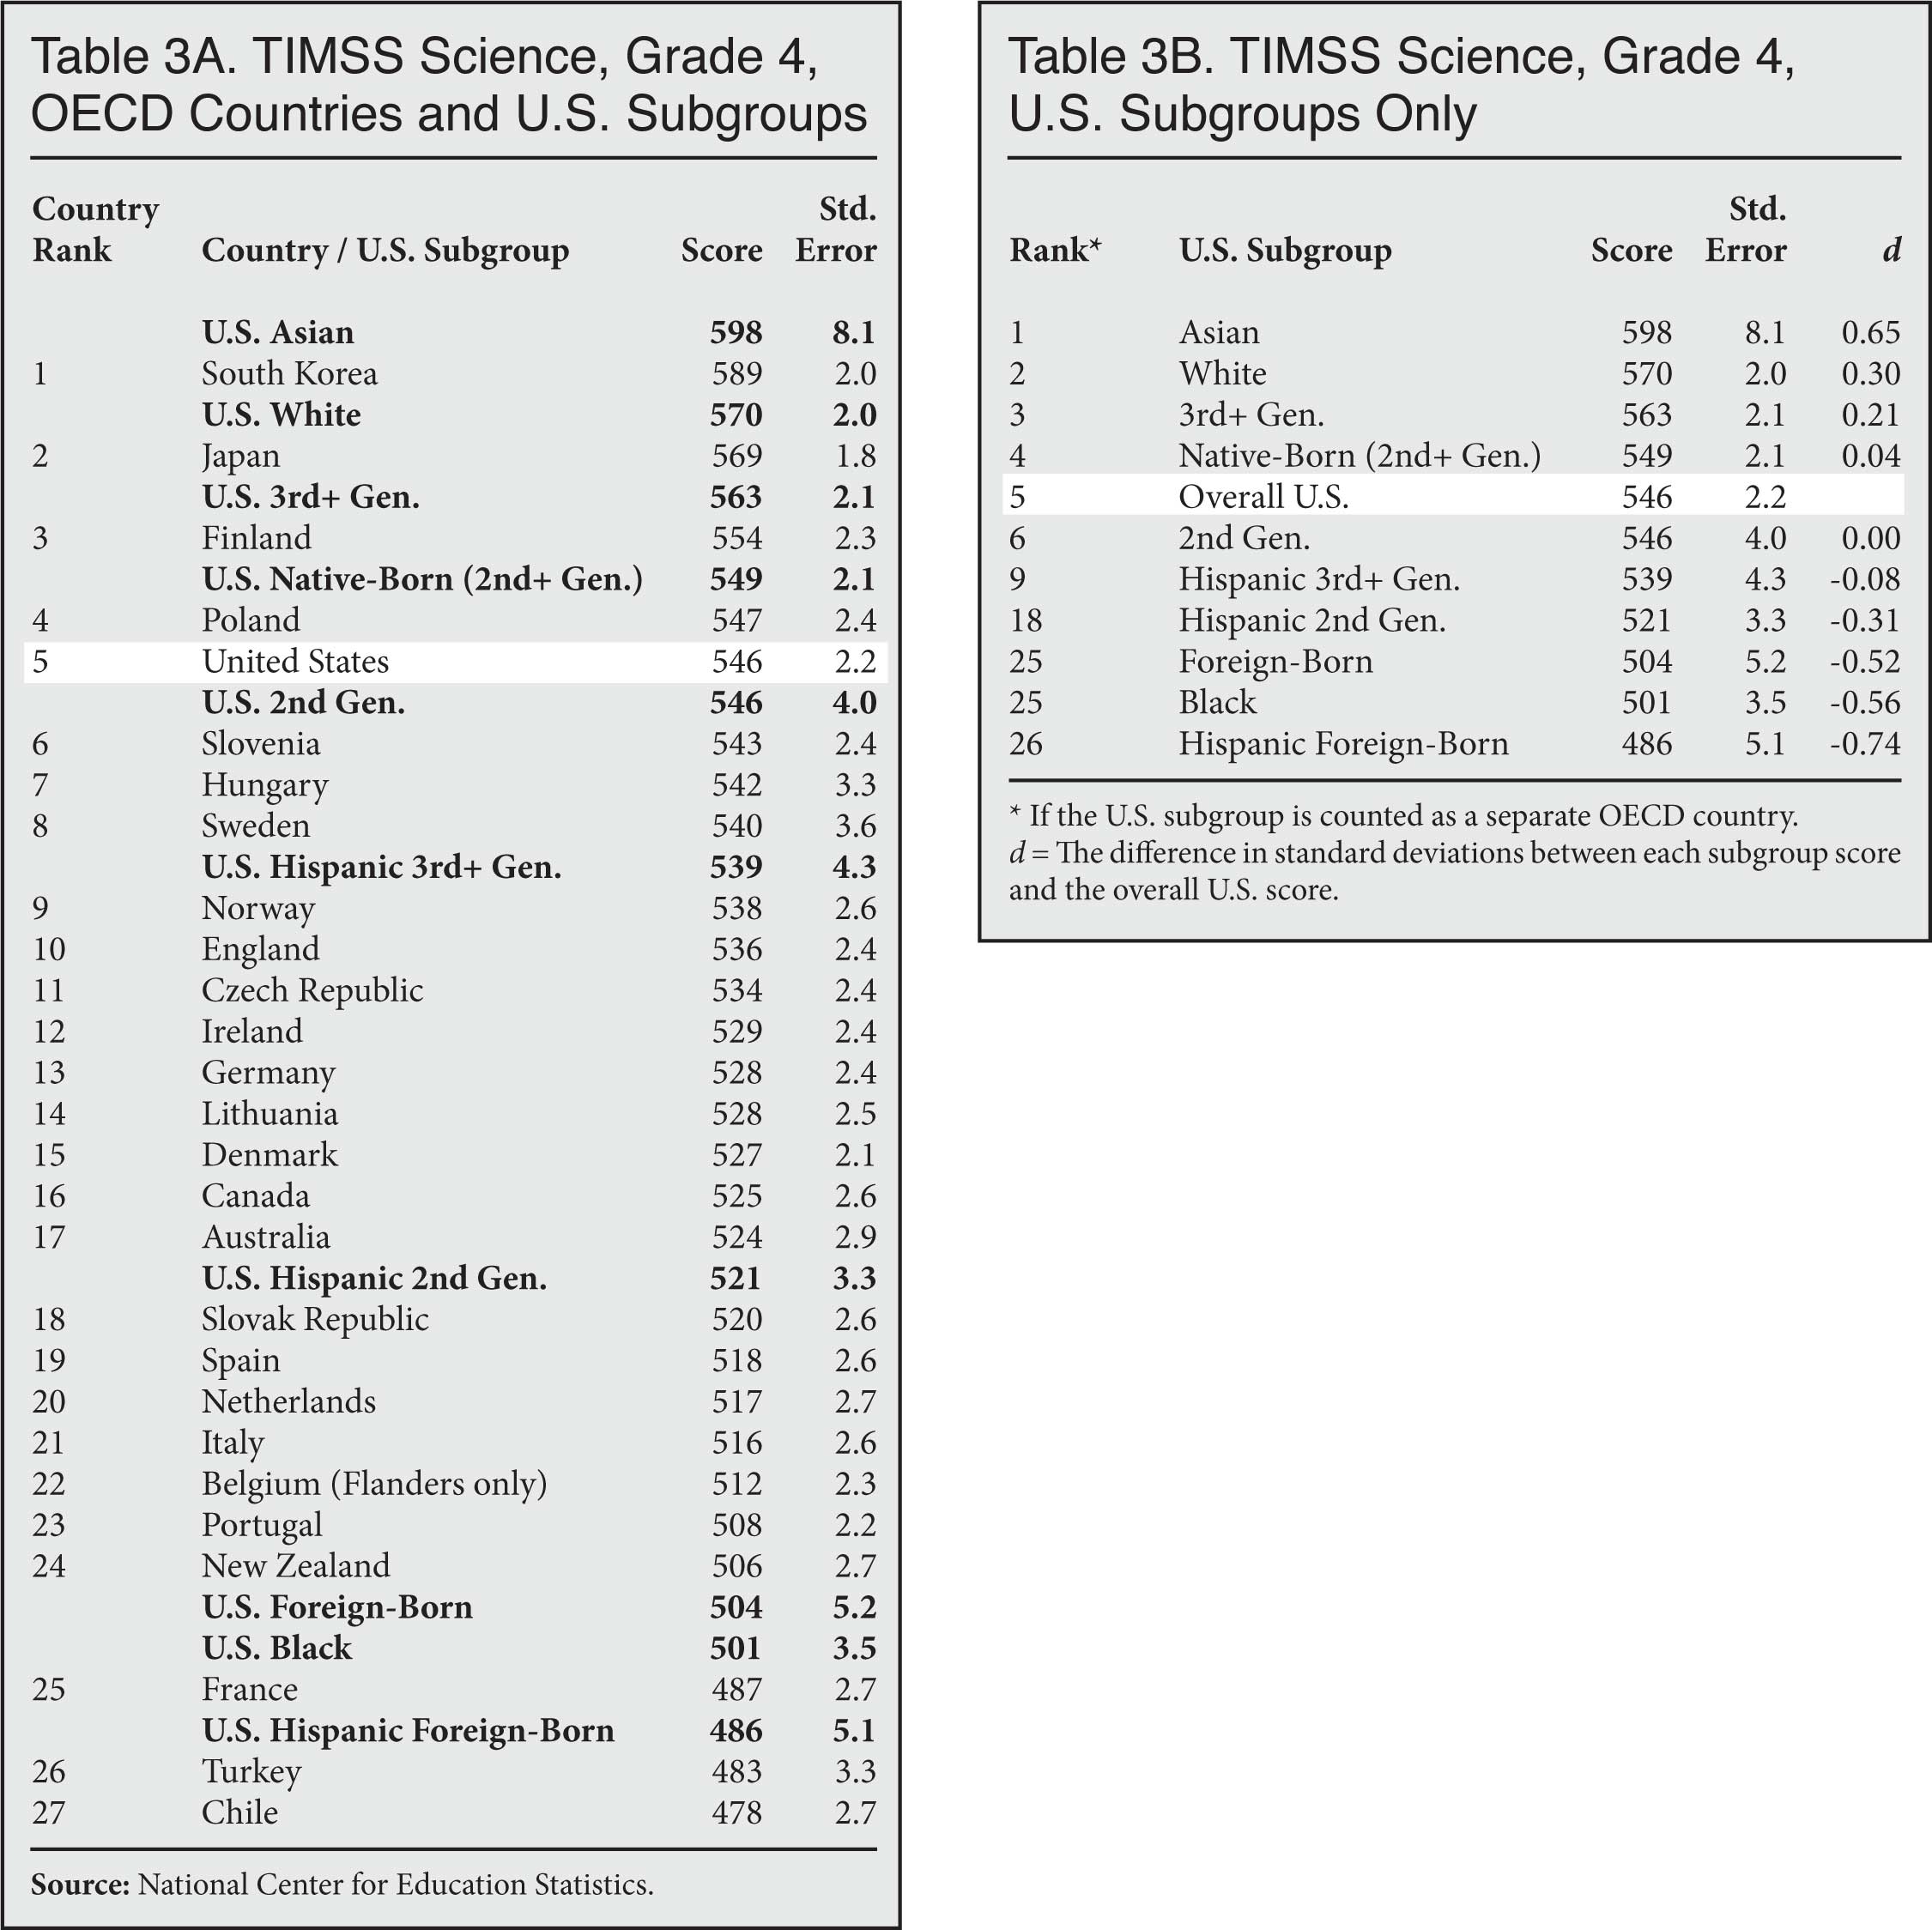
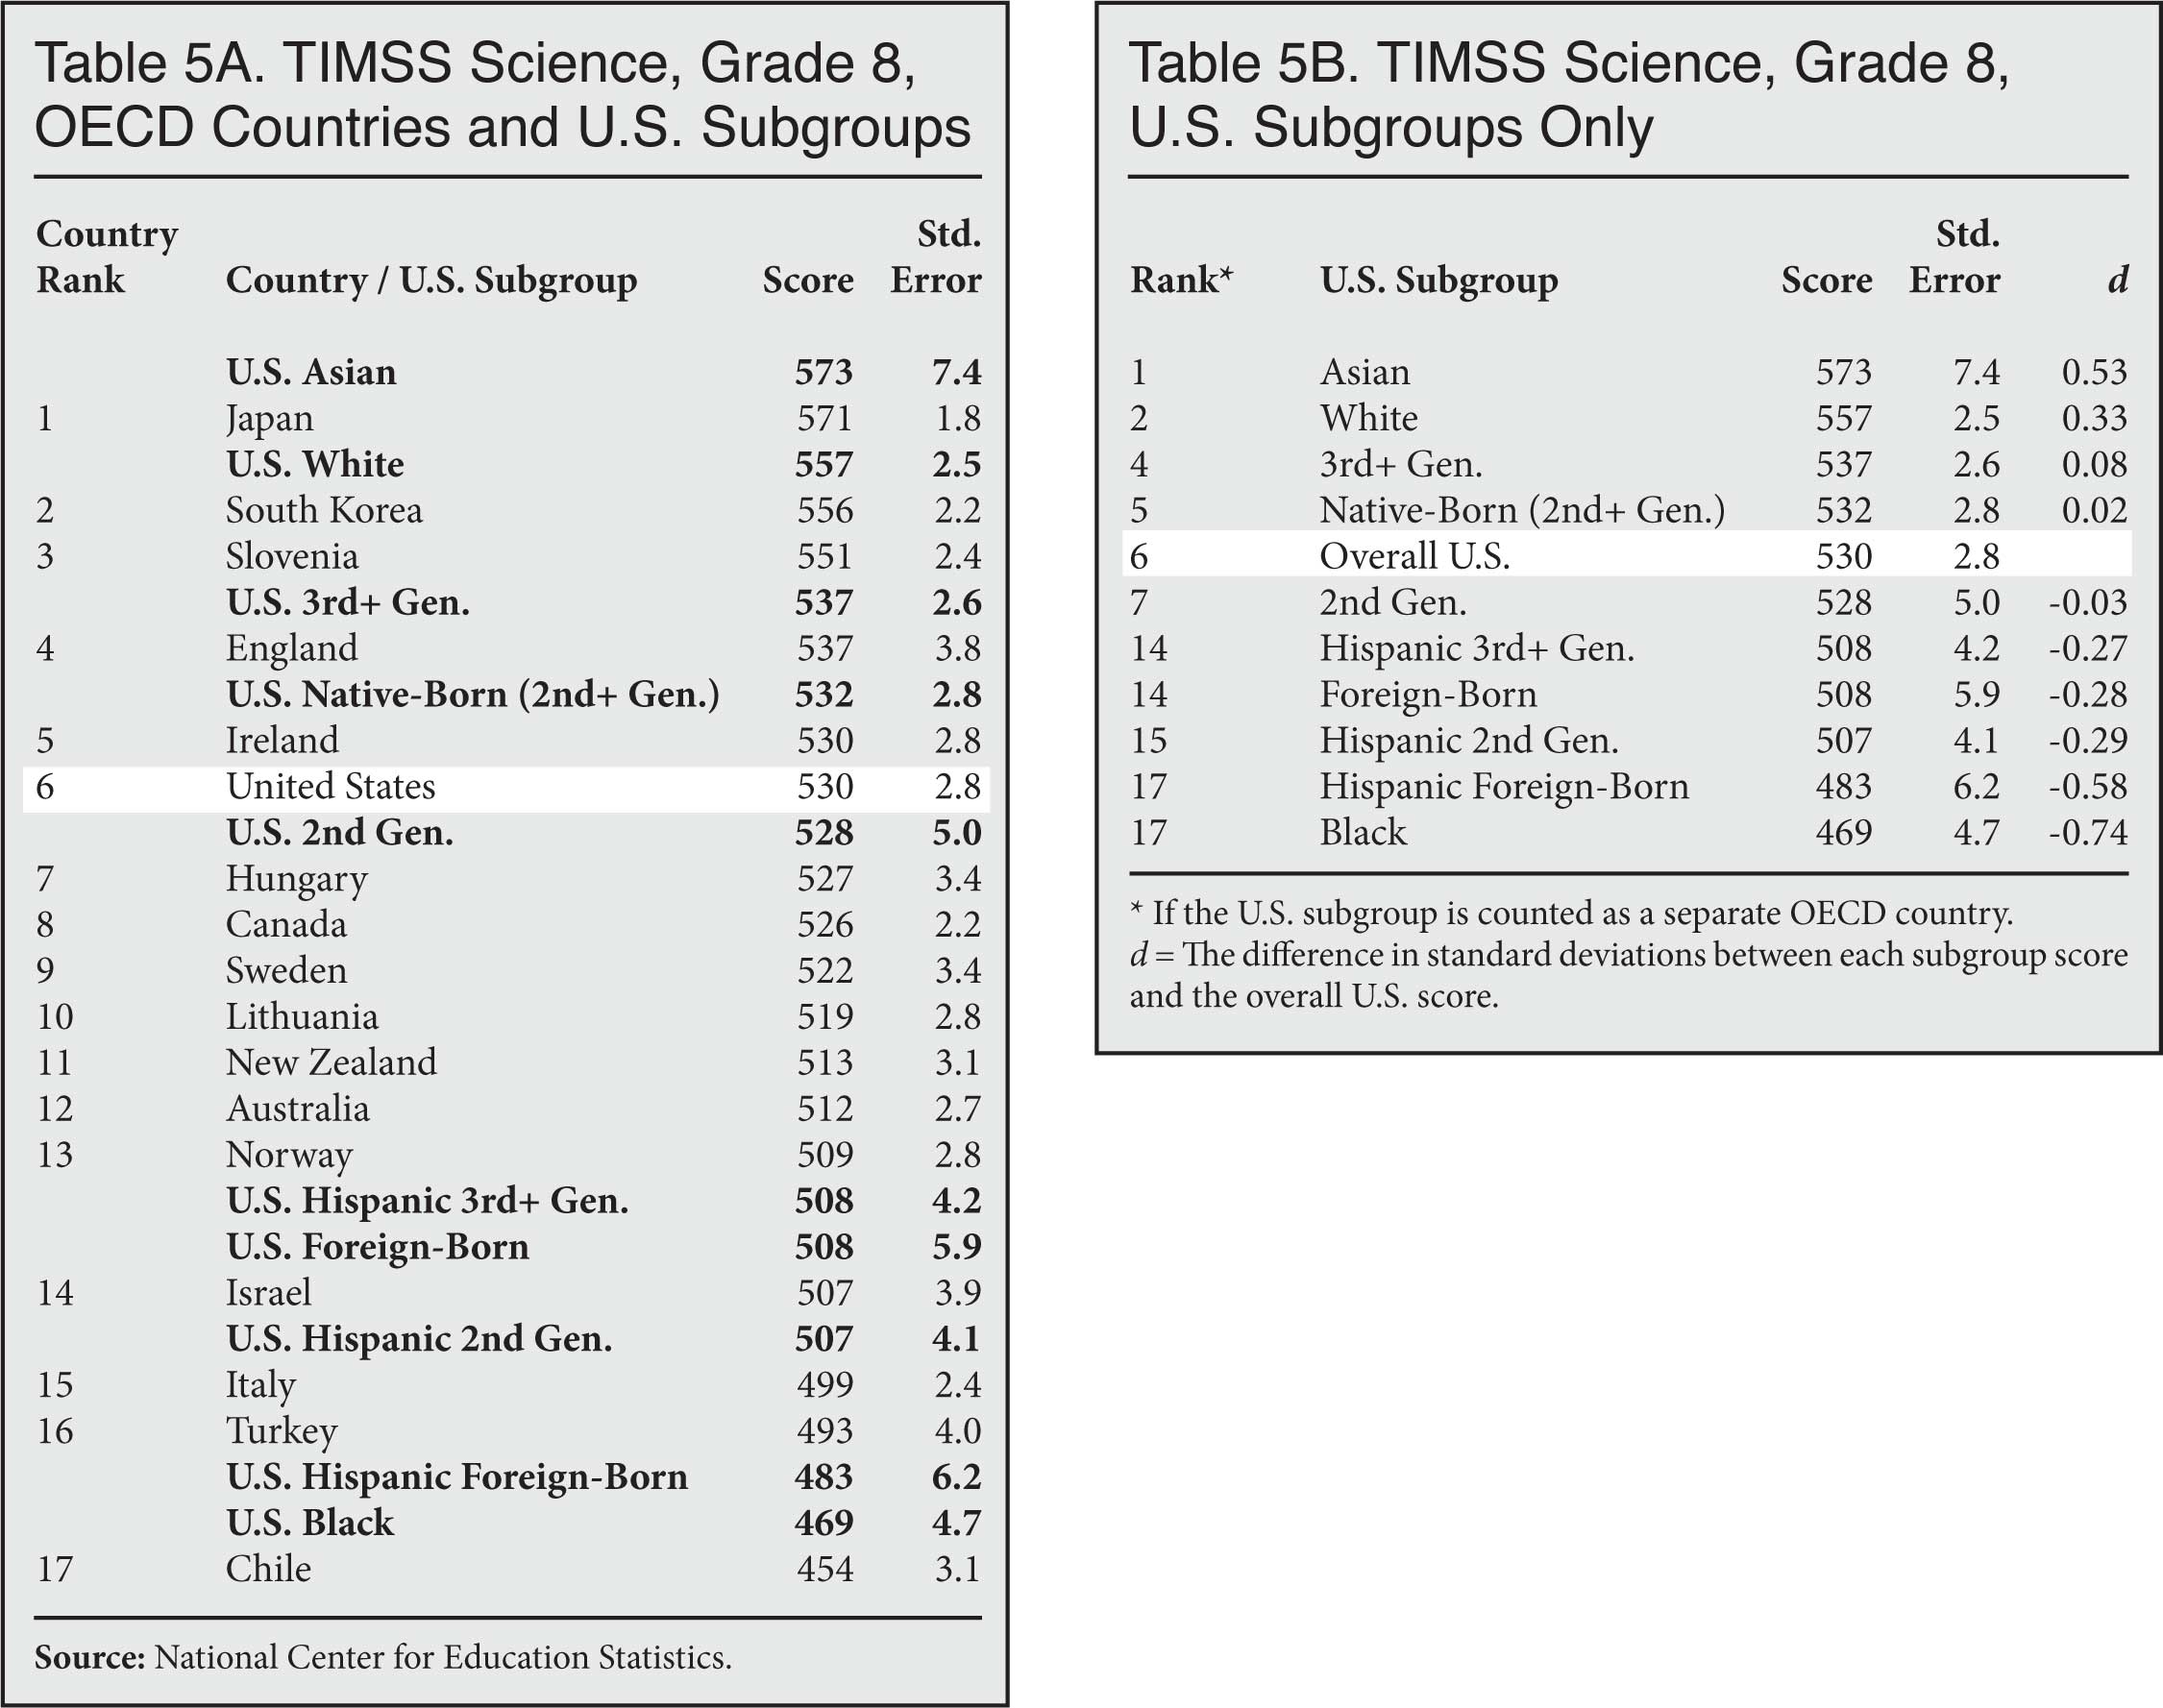
TIMSS
The Trends in International Mathematics and Science Study (TIMSS) was administered to fourth- and eighth-graders in 2015.
 |
 |
 |
 |
PISA
The Program for International Student Assessment (PISA) tested 15-year-olds on reading, math, and science in 2015.
 |
 |
 |
PIAAC
The Program for the International Assessment of Adult Competencies (PIAAC) tested people ages 16 to 65 on literacy and numeracy in 2012, with supplemental U.S. testing in 2014.
 |
 |
End Notes
1 Briefly, the standard deviation (SD) is a measure of spread. For example, on a test with a mean score of 100 and a standard deviation of 15, a score of 103 would be (103 – 100)/15 = 0.2 SDs above the mean. On a different test that has a mean score of 2,000 and a standard deviation of 100, a score of 2,020 would be (2,020 – 2000)/100 = 0.2 SDs above the mean. By using the standard deviation to adjust for the spread of each distribution, we see that different-looking scores on different tests actually have the same effect size.
In this report, the effect size is the difference between the subgroup and overall U.S. scores divided by the standard deviation of the overall U.S. distribution, not by a pooled standard deviation. This effect size calculation is sometimes referred to as Glass's delta, and it is useful when the population standard deviations of the two groups appear to be substantially different.
2 The International Data Explorer maintained by NCES provides most of the relevant scores for countries and U.S. subgroups. Public-use microdata (available at the NCES site) supplemented the analysis.
3 The OECD keeps a list of its member countries on its website.
4 Because the surveys do not contain information on grandparents' countries of birth, defining the Hispanic third-plus generation relies on respondents volunteering their Hispanic ethnicity. If the most assimilated third-generation Hispanic-Americans no longer identify as Hispanic, the people designated as the third-plus generation may actually be a lower-achieving subset of the real third generation. However, other datasets that do contain grandparent birthplace information also show the third-generation lagging behind. See Jason Richwine, "Grandchildren of Low-Skill Immigrants Have Lagging Education and Earnings", Center for Immigration Studies, November 13, 2018.