
Summary
The migration of Somalis to Minnesota has created stark socioeconomic disparities in a region once known for its egalitarianism. This report documents the struggles of the Minnesota Somali population, now numbering over 75,000, in an otherwise high-achieving state. Among the findings:
- More than half (52 percent) of children in Somali immigrant homes in Minnesota live in poverty, while only 8 percent of children in native-headed homes are in poverty.
- One in eight children in poverty in Minnesota lives in a Somali immigrant home.
- About 39 percent of working-age Somalis have no high school diploma, compared to just 5 percent of natives.
- Among working-age adult Somalis who have lived in the U.S. for more than 10 years, half still cannot speak English “very well”.
- About 54 percent of Somali-headed households in Minnesota receive food stamps, and 73 percent of Somali households have at least one member on Medicaid. The comparable figures for native households are 7 percent and 18 percent.
- Nearly every Somali household with children (89 percent) receives some form of welfare.
- Although Somalis have recently been implicated in welfare fraud, any population with poverty rates as high as theirs will qualify for extensive means-tested aid. The best way to reduce immigrant consumption of welfare is not simply to crack down on fraud, but to reduce the number of new arrivals who have low earning power.
Detailed Results
One of the main critiques of post-1965 immigration to the U.S. is that it has worsened the problems of poverty, school dropout, and welfare dependency. Allowing in immigrants who struggle with these problems adds to the social burden and makes helping impoverished Americans more difficult.
The burden added by immigration varies widely across the U.S., but there is perhaps no starker case than that of Somalis in Minnesota. As Figure 1 indicates, there were virtually no Somalis in Minnesota in 1990, but over 10,000 appeared over the following decade, largely as refugees from Somalia’s clan wars.1 The Somali-ancestry population in Minnesota would triple by 2010 and continue to grow. In 2024, in the wake of the immigration surge of the preceding four years, people of Somali ancestry in Minnesota numbered over 75,000. The population has become especially visible because of its concentration in Minneapolis, where tension between rival Somali clans is rumored to have influenced the city’s recent mayoral election.2
Figure 1. Growth in Somali Population in Minnesota, 1990-2024 |
 |
Source: Public-use census microdata (1990-2010); data.census.gov (2020 and 2024). |
The contrast between Somalis and native Minnesotans could hardly be greater. The human development index — a composite indicator of health, income, and education — routinely ranks Minnesota among the top states in the U.S., comparable to the Scandinavian countries from which a large share of Minnesotans derive their ancestry.3 Consequently, the arrival of impoverished Somalis has created large disparities. Based on 10 years of data from the Census Bureau’s American Community Survey (ACS), the analysis below details those disparities.
Poverty. Table 1 shows that 37.5 percent of adult Somali immigrants in Minnesota live below the Census Bureau’s official poverty line, compared to just 6.9 percent of adult natives. Even more concerning is the status of Somali children. More than half (52.3 percent) of children in Somali immigrant homes live in poverty, while only 7.6 percent of children in native-headed homes are in poverty.4
Table 1: Rates of Poverty-Related Problems in Minnesota Among Natives and Somali Immigrants | ||||
| Category | Problem | Rate Among Natives | Rate Among Somali Immigrants | Rate Among Somali Immigrants, > 10 Years in U.S. |
| Adults | In Poverty | 6.9% | 37.5% | 32.9% |
| Adults | In or Near Poverty | 18.2% | 66.1% | 61.9% |
| Children1 | In Poverty | 7.6% | 52.3% | 46.6% |
| Children1 | In or Near Poverty | 22.5% | 81.4% | 76.9% |
| Working-Age Adults | No High School Diploma | 5.0% | 39.0% | 28.4% |
| Working-Age Adults | Speaks English Less Than Very Well | 0.7% | 58.2% | 49.0% |
| Working-Age Men | Without a Job2 | 17.6% | 21.6% | 22.5% |
| Young Men | Institutionalized (Likely Prison) | 1.3% | 1.5% | 1.9% |
| Households1 | Overcrowded Conditions | 1.2% | 28.9% | 26.3% |
| Households1 | No One Age 14+ Speaks English Very Well | 0.2% | 36.4% | 32.5% |
Source: 2014-2023 ACS. | ||||
Among the strongest predictors of poverty are low education and lack of English-language ability. Table 1 shows that Somali immigrants experience both of these problems at dramatically higher rates than native Minnesotans. Virtually all native Minnesotans speak English very well, for example, but 58.2 percent of working-age Somalis do not. Meanwhile, 39 percent of working-age Somalis have no high school diploma, compared to just 5 percent of natives.
Table 1 also shows that 21.6 percent of working-age Somali men are without a job. (That is the combined figure of men who are classified as “unemployed” (i.e., looking for work) plus men who are out of the labor force altogether (i.e., not looking for work). Although greater than the native jobless rate of 17.6 percent, Somali joblessness is not as common as one would predict based on their population’s low education level. Employment is therefore a bright spot in the data for Somalis, relatively speaking.
As for criminality, the census data provides limited insight, for a few reasons. First, the public-use microdata reveals whether respondents are “institutionalized” but does not distinguish among the types of institutions they could be in. Young men who are institutionalized are probably in a prison — rather than, say, a mental health facility or hospice — but not always. Second, lengthy stays in prison are often due to the accumulation of a long criminal record, including probation violations. Immigrants have had less time than natives to develop a rap sheet sufficient for prison, which limits the usefulness of institutionalization as a measure of criminality. Finally, the available sample of institutionalized men is small, leading to low-precision rate calculations. With all of that said, Table 1 suggests that about 15 in 1,000 young Somali men in Minnesota are institutionalized, compared to 13 in 1,000 young native men.
The last column of Table 1 shows that Somalis who are long-term U.S. residents continue to struggle. In fact, the institutionalization rate for young Somali men who have lived in the U.S. for more than 10 years is higher, at 19 in 1,000, than in the population of all young Somali men.
The long-term Somali population does show improvement on other measures, but the differences are small. For example, 49 percent of working-age Somalis with more than 10 years of residency still speak English less than “very well” — only a small improvement over the 58.2 percent among the full Somali population. Similarly, 46.6 percent of children in long-term Somali households are still living in poverty, compared to 52.3 percent in all Somali households. Even these marginal improvements in the long-term data should be interpreted cautiously, since adaptation is not the only possible explanation for them; it’s also possible that newer waves of Somali immigration have lower initial skill levels than the older waves.
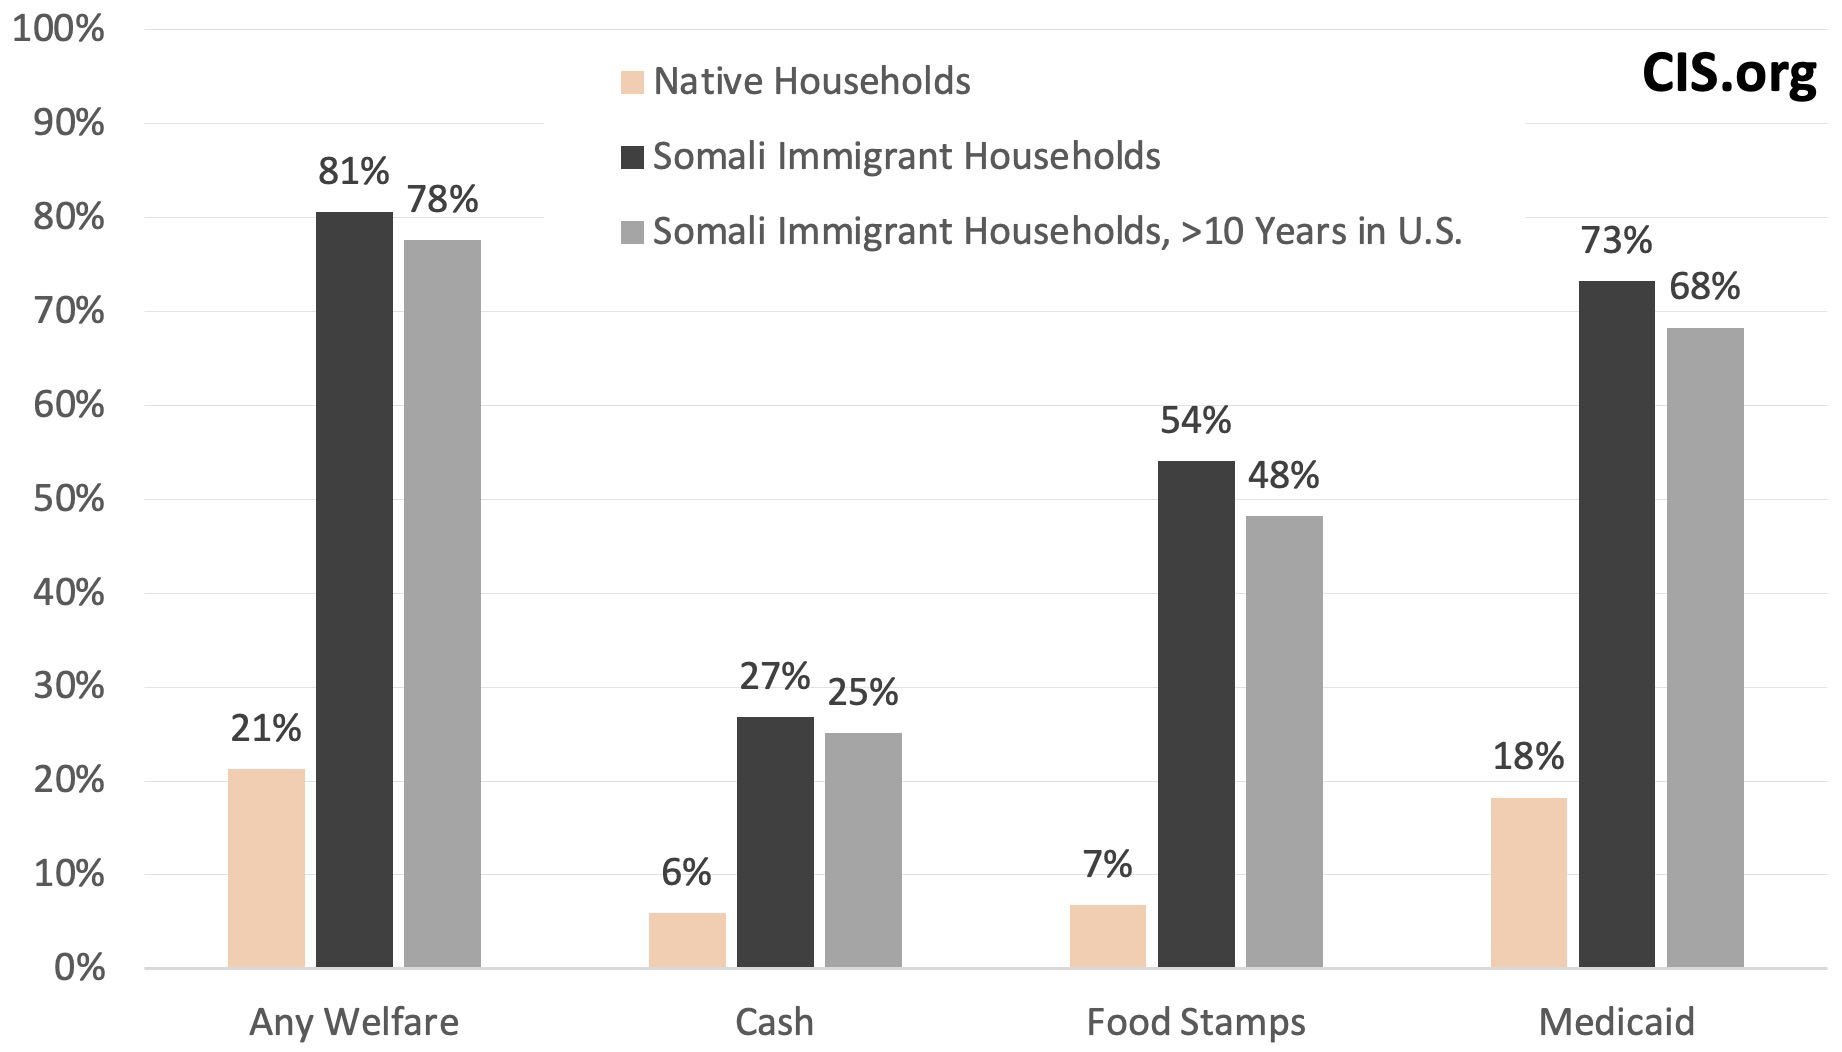
Welfare. The U.S. has an extensive welfare system targeted at low-income families. Somalis in Minnesota are therefore likely to be major consumers of means-tested anti-poverty benefits, which Figure 2 confirms. While just 6 percent of native households in Minnesota receive cash welfare — including Temporary Assistance for Needy Families, Supplement Security Income, and general assistance — 27 percent of Somali households do. The disparities are even greater for food and medical care, with over half of Somali households receiving food stamps and nearly three-quarters using Medicaid. Altogether, 81 percent of Somali households consume some form of welfare, compared to 21 percent of native households.5 Somalis with 10 years of residency have welfare consumption rates that are only marginally lower than the Somali population as a whole.
Figure 2. Welfare Use Rates in Minnesota, by Household |
 |
Source: 2014-2023 ACS. |
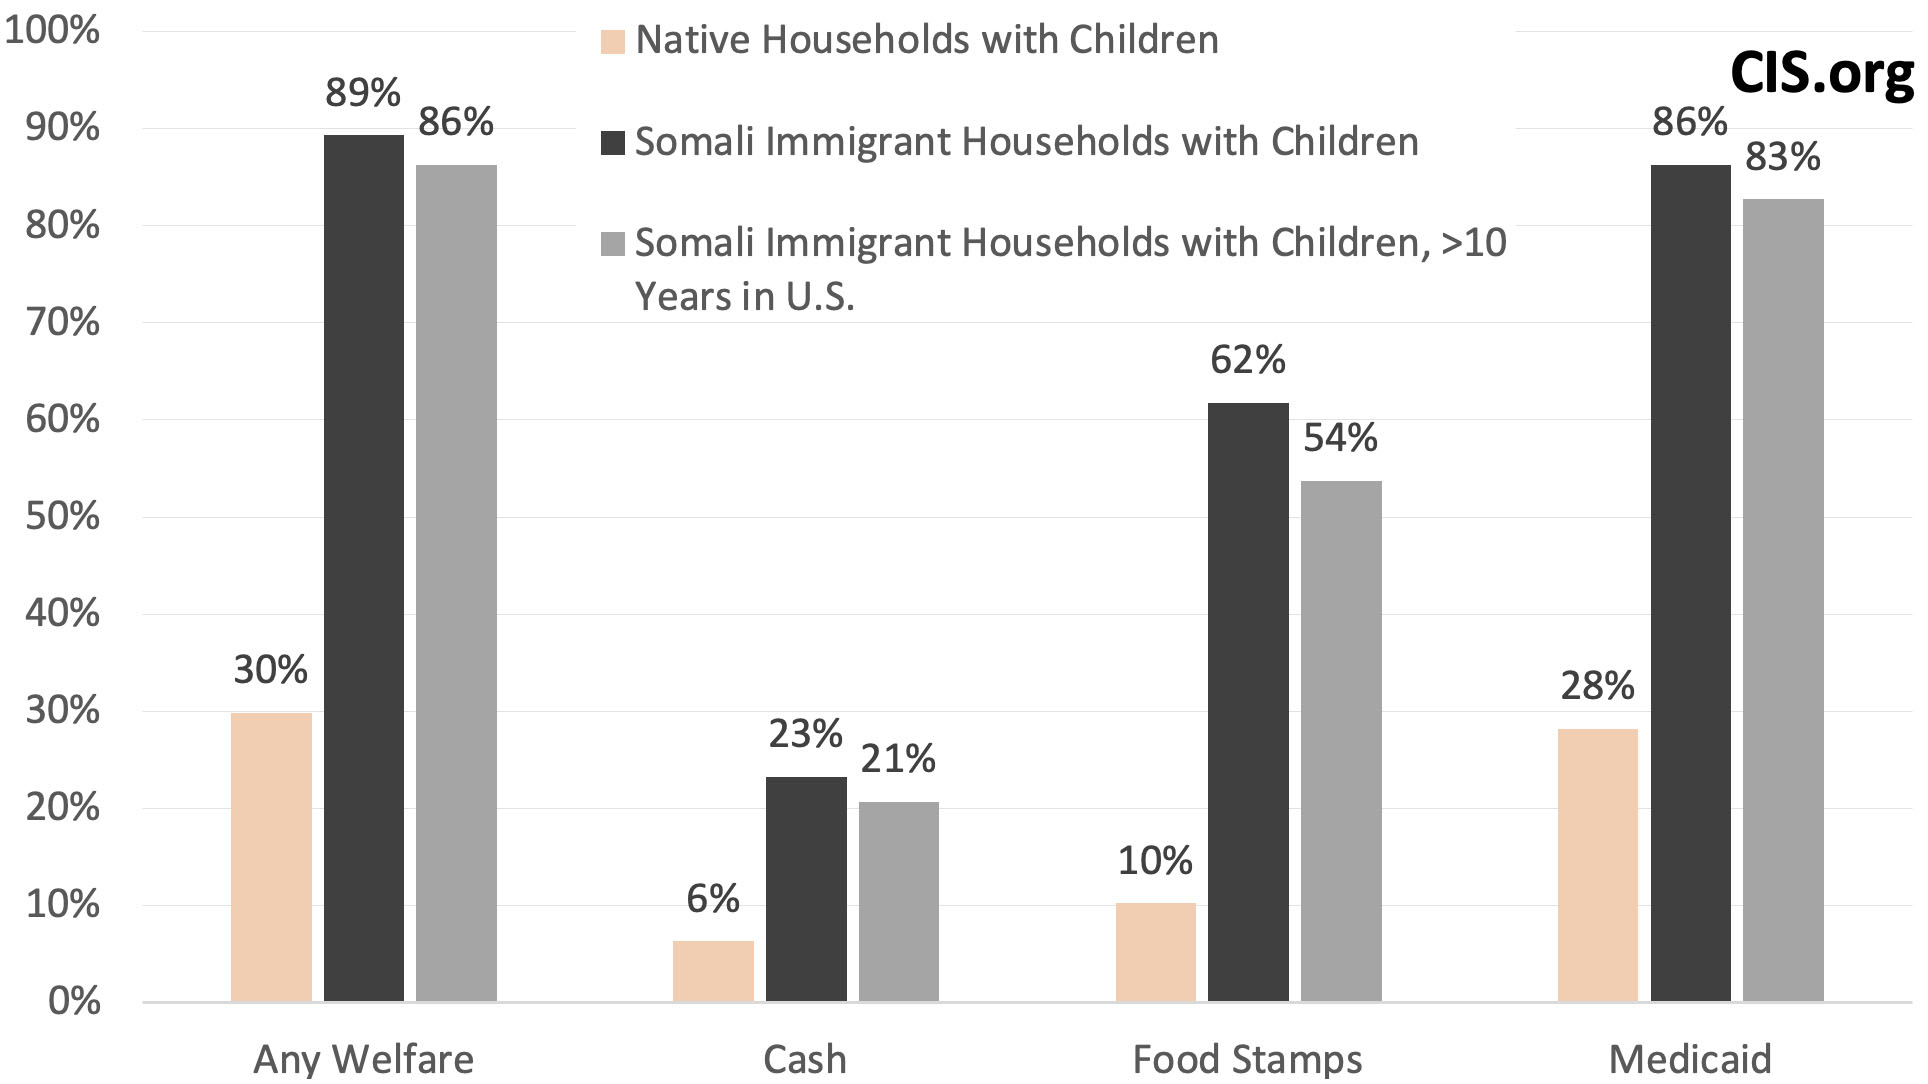
Households with children are especially likely to use welfare. Figure 3 shows that even Minnesota’s native-headed households with children consume Medicaid at a high rate of 28 percent. The contrast with Somalis is still clear, however, as nearly all (86 percent) of the Somali households with children are on Medicaid.
Figure 3. Welfare Use Rates in Minnesota, by Households with Children |
 |
Source: 2014-2023 ACS. |
Recently, some Somalis in Minnesota have been implicated in welfare fraud. The New York Times described one scheme involving the theft of children’s food aid during the pandemic as “staggering in its scale and brazenness”.6 Over $1 billion has been reported stolen so far, but the scandal goes beyond money. Minnesota’s social services have roots in the Scandinavian model, which assumes that civic-minded residents will treat aid as a safety net, not as money free for the taking.7 With fraud cases like these, it cannot be surprising when researchers find that culture clashes tend to degrade social trust.8
That said, Somali welfare use would still be high even without fraud. Any population with poverty rates as high as theirs will legally qualify for extensive means-tested aid, either directly for themselves or indirectly through their U.S.-born dependents. The way to reduce immigrant consumption of welfare is not simply to crack down on fraud, but to reduce the number of new arrivals who have the low earnings power characteristic of Somalis.
Burden on the State. The Somali community in Minnesota is small relative to the state’s total population. Nevertheless, because the disparities shown in Table 1 are so large, some of the state’s poverty-related problems still have a pronounced Somali component. For example, Table 2 shows that Somali households account for 2.5 percent of children in Minnesota but 12.8 percent of the state’s child poverty. In fractional terms, one out of every eight children in poverty in the state comes from a Somali household.
Table 2: Somali Immigrant Contribution to Poverty-Related Problems in Minnesota | ||||
| Category | Problem | Somali Immigrant Share of Category with Problem | Somali Immigrant Share of Category Overall | Ratio |
| Adults | In Poverty | 3.7% | 0.7% | 5.0 |
| Adults | In or Near Poverty | 2.5% | 0.7% | 3.4 |
| Children1 | In Poverty | 12.8% | 2.5% | 5.2 |
| Children1 | In or Near Poverty | 7.4% | 2.5% | 3.0 |
| Working-Age Adults | No High School Diploma | 4.8% | 0.9% | 5.7 |
| Working-Age Adults | Speaks English Less Than Very Well | 9.4% | 0.9% | 11.0 |
| Working-Age Men | Without a Job2 | 1.0% | 0.8% | 1.2 |
| Young Men | Institutionalized (Likely Prison) | 1.1% | 0.9% | 1.2 |
| Households1 | Receiving Any Welfare | 2.8% | 0.8% | 3.5 |
| Households1 | Receiving Cash Welfare | 3.4% | 0.8% | 4.2 |
| Households1 | Receiving Food Stamps | 5.6% | 0.8% | 7.0 |
| Households1 | Receiving Medicaid | 3.0% | 0.8% | 3.6 |
| Households1 | Overcrowded Conditions | 10.4% | 0.8% | 12.8 |
| Households1 | No One Age 14+ Speaks English Very Well | 13.0% | 0.8% | 16.0 |
Source: 2014-2023 ACS. | ||||
Health authorities have identified overcrowding as a major contributor to the spread of communicable diseases, including Covid-19.9 As Table 2 shows, one in 10 overcrowded households in Minnesota is headed by a Somali immigrant, even though fewer than 1 percent of the state’s households overall are Somali. These disproportionate burdens imposed by immigration have upended a state once lauded for its low rate of social problems.
Methodological Notes
This report combines the most recent 10 years of data from the American Community Survey, 2014-2023. A full decade of data ensures an adequate sample size and keeps major events such as the pandemic from unduly influencing the results. Table 3 lists the sample sizes, and Table 4 provides standard errors. The standard errors are calculated from the Census Bureau’s replicate weights, which adjust for the survey’s complex design.
Table 3. Sample Sizes | |||
| Category | Natives | Somali Immigrants | Somali Immigrants, > 10 Years in U.S. |
| Adults (Age 18+) | 395,929 | 952 | 594 |
| Children* (Age<18) | 107,371 | 1,071 | 715 |
| Working-Age Adults (Ages 18-64) | 305,092 | 913 | 560 |
| Working-Age Men (Ages 18-64) | 155,386 | 445 | 282 |
| Young Men (Ages 18-39) | 64,728 | 250 | 137 |
| Households* | 213,667 | 535 | 377 |
| Households* with Children | 54,206 | 334 | 231 |
Source: 2014-2023 ACS. | |||
Table 4. Standard Errors of Rates | ||||
| Category | Problem | Natives | Somali Immigrants | Somali Immigrants, > 10 Years in U.S. |
| Adults | In Poverty | 0.07% | 2.07% | 2.65% |
| Adults | In or Near Poverty | 0.13% | 2.40% | 2.80% |
| Children* | In Poverty | 0.18% | 2.83% | 3.76% |
| Children* | In or Near Poverty | 0.30% | 2.05% | 2.86% |
| Working-Age Adults | No High School Diploma | 0.07% | 2.05% | 2.32% |
| Working-Age Adults | Speaks English Less Than Very Well | 0.02% | 2.18% | 2.63% |
| Working-Age Men | Without a Job | 0.14% | 2.15% | 2.68% |
| Young Men | Institutionalized (Likely Prison) | 0.02% | 0.41% | 0.72% |
| Households* | Receiving Any Welfare | 0.13% | 1.90% | 2.46% |
| Households* | Receiving Cash Welfare | 0.08% | 2.23% | 2.62% |
| Households* | Receiving Food Stamps | 0.08% | 2.43% | 3.07% |
| Households* | Receiving Medicaid | 0.11% | 1.91% | 2.55% |
| Households* | Overcrowded Conditions | 0.03% | 2.50% | 3.07% |
| Households* | No One 14+ Speaks English Very Well | 0.02% | 2.66% | 3.01% |
Source: 2014-2023 ACS. | ||||
End Notes
1 Nayla Rush, “Resettlement Agencies Decide Where Refugees Are Initially Placed in the United States”, Center for Immigration Studies, July 16, 2020.
2 Dahir Alasow, “Somali Clan Divisions Surface as Jacob Frey Wins Third Term in Minneapolis Mayoral Race”, Suna Times, November 6, 2025.
3 Subnational HDI v8.4, Global Data Lab. The similarity between Americans and their countries of ancestry is not a coincidence. See Jason Richwine, “More Evidence for Cultural Persistence”, Center for Immigration Studies, January 17, 2023.
4 A Somali immigrant household is one in which the “head” (or reference person) was born in Somalia. The head also determines the years of U.S. residency for the household-level analyses. When measuring child poverty, the “Somali immigrant” columns include all the minors who live in a household headed by a Somali immigrant, regardless of whether the children are themselves foreign-born.
5 In its welfare reports, CIS traditionally includes additional programs, such as subsidized housing, the WIC nutritional program, and the refundable portion of the Earned Income Tax Credit, but they are not available in the ACS.
6 Ernesto Londoño, “How Fraud Swamped Minnesota’s Social Services System on Tim Walz’s Watch”, New York Times, November 29, 2025.
7 Rochelle Olson, “U.S. Attorney Joe Thompson: Fraud Is Stealing Minnesota’s Way of Life”, Minneapolis Star Tribune, September 13, 2025.
8 Robert D. Putnam, "E Pluribus Unum: Diversity and Community in the Twenty-First Century", Scandinavian Political Studies, Vol. 30 (2007), pp. 137-174.
9 A household is overcrowded according to the Census Bureau if, roughly speaking, it has more people than rooms. See Jason Richwine, Steven A. Camarota, and Karen Zeigler, “Household Overcrowding Facilitates the Spread of Covid-19”, Center for Immigration Studies, October 8, 2020.