Summary
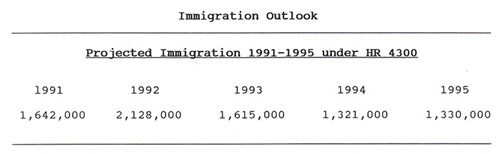
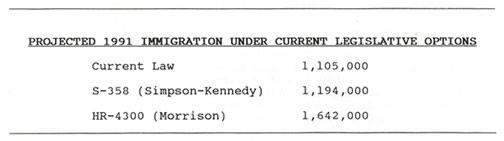
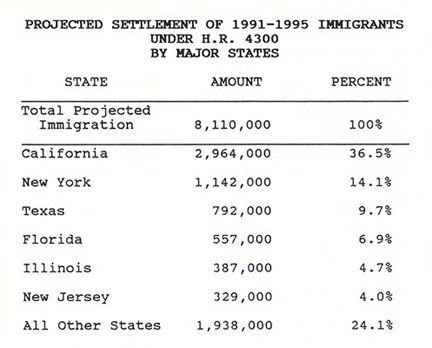
HR 4300, a major legal immigration reform bill now awaiting floor action in the House of Representatives, would result in the projected settlement of 1,642,000 immigrants, refugees, asylees and parolees in its first year in effect, 1991, and an estimated 8.1 new settlers by 1995.
The Center has estimated the additional direct public assistance and education costs under 24 federal and state programs that would be be attributable to 1991 immigrants, refugees and other entrants receiving permanent residence or the equivalent under HR 4300. These estimates show additional direct costs in the first full year of $3.05 billion, and $3.82 billion if refugee programs are included.
Public primary and secondary education would be by far the largest cost, totaling $1.5 billion for an estimated immigrant public school population of 289,000 in the 1991 cohort of new entrants. The average total expenditure for each individual 1991 immigrant/refugee is $2243. No estimates were made of costs attributable to illegal immigrants settling in 1991, estimated at 250,000, or to long-term temporary "non-immigrant" workers and their dependents, whose admissions would expand under HR 4300.
Estimating the Numbers of 1991 Immigrants and Other Settlers
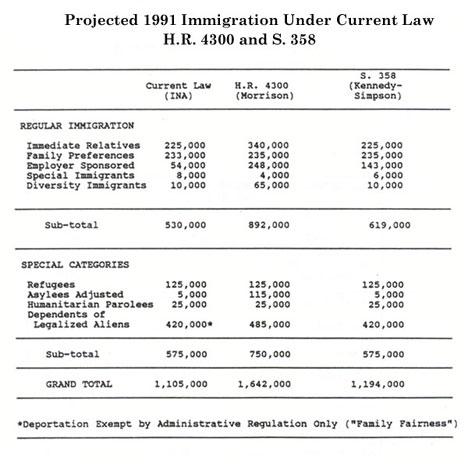
The Center's estimates of total legal immigration count all immigrants, refugees, asylees, parolees and other approved entrants who will receive permanent residence in the U.S. or equivalent status in 1991 even if they arrived in an earlier year. Using this approach, immediate relatives of amnestied aliens who would be granted stays of deportation under HR-4300 are considered as equivalents of permanent residents and are counted. However, aliens formally receiving permanent residence under the 1986 amnesty, projected by INS to be 1,155,000 in 1991, are not included in the estimates.
Assumptions
For categories subject to a ceiling, such as family preferences, it was assumed that the amount of immigration would reach the ceiling in every case.
For major categories not subject to ceiling, the following assumptions were applied:
- Immediate relatives of citizens (225,000) were estimated to increase at 3.5 percent yearly, lower than the 5 percent annual growth rate projected by INS in 1989 because of eased admissions of immediate families of permanent residents under HR 4300 and the deterrent effect on fraudulent admissions of the 1986 Marriage Fraud Act.
- Refugee (125,000) and parolee (25,000) admissions were assumed to continue current trend lines.
- Asylee adjustments (115,000): HR 4300 removes the existing annual ceiling of 5,000 on the number of asylees who can receive permanent residence. The Center assumes the current backlog of 240,000 asylees and dependents will be adjusted at the rate of 80,000 persons yearly starting in 1991, plus 35,000 new asylees and dependents each year.
- Stay of deportation for dependents of legalized aliens (485,000): From studies of legalized alien family and residence patterns, the Center estimated in 1989 (CIS Backgrounder: Five-Year Estimates of Immigration; October 1989) that in 1987 there were about 2.6 million unreunited spouses and children under 21 of legalization applicants who would be candidates for settlement in the U.S. While HR 4300's extension of the eligibility date to 1990 would expand this pool, that increase would be largely offset by the numbers "graduating" from the eligible age bracket, dying, or making alternative arrangements. The estimate of 485,000 recipients in 1991 represents 20 percent of the total pool of candidates minus those estimated as likely to be admitted as immediate relatives of permanent relatives under another provision of law.
The following is the immigration outlook based on these estimates:
Methods for Estimating Public Assistance and Education Costs
The following methods were used in estimating costs: Total costs and per capita user costs of each of the 24 assistance programs were calculated using aggregate government data for the most recent year available, usually 1988. A national recipiency rate was determined as a ratio of the number of recipients to the total number in the target client population. Thus the national recipiency rate was most often expressed as a percentage of the special sub-population that each particular program served, such as school age children, the labor force, the college age population, or "limited English proficiency" students. In a few cases, the national recipiency rate was calculated as a percentage of the entire population or the total number of households in the country.
The probability of alien recipiency, unless specified elsewhere in other government data, was computed as the national rate adjusted by a multiplier based on the incidence of alien poverty, unemployment and welfare recipiency identified in two studies:
- George Borjas: Friends or Strangers: The Impact of Immigrants on the U. S. Economy, New York: Basic Books, 1990
- Lief Jensen: "Patterns of Immigration and Public Assistance Utilization," International Migration Review. Vol. 22, Spring 1988, pp.51-83
Using 1980 census data on the foreign born, Borjas found immigrants 15.2 percent more likely to be in poverty, 6.1 percent more likely to suffer unemployment, and 13.8 percent more likely to be on welfare.
Jensen's data shows immigrants in 1980 to be 56 percent more likely than natives to be in poverty, and 25 percent more likely to receive public assistance, and to have an average per capita income from public assistance 13.6 percent higher than natives.
Before a final 1991 public service cost imputable to immigrants could be determined, the estimates based on data from 1988 or earlier were multiplied by an inflation factor to adjust for estimated annual growth of spending in each program since that time. This multiplier was derived from the average annual rate of increase in outlays for each program for the three years ending in 1988. Programs that showed no growth in that period were not adjusted.
Participatory programs funded by employee contributions such as social security (OASDI) and Medicare are not included in the estimates, nor or any 1991 settlers likely to be eligible for them in their first full year in the country. Estimates of age and sex distribution and family size of immigrants were based on those of legal immigration cohorts for 1985-1988.
More detailed comments on cost estimate methods for individual programs are provided in the notes accompanying the tables.
While immigrants and refugees also entail added costs for other government services, such as police and courts, public facilities, fire protection, general government and environmental protection, data and reliable methods are not available for apportioning those costs.
Other sources used in preparing these estimates are:
- Bureau of the Census: Statistical Abstract of the United States. 1990.
- General Accounting Office: Grant Formulas: A Catalogue of Federal Aid to States and Localities, 1987.
- General Accounting Office: Immigration to the U.S. — Federal Budget Impacts 1984-1995, 1986.
- The President's Triennial Comprehensive Report on Immigration, January 1989.
- Immigration and Naturalization Service: Statistical Yearbook — 1985-1988.
- Internal Revenue Service: Statistics of Income 1986: Individual Income Tax Returns, Washington, 1989.
- Service Employees International Union, AFL-CIO: The Hidden Story of Taxpayer Subsidies for Low Wage Employers, 1988.
- Massachusetts Office for Refugees and Immigrants: Through the Golden Door: Impacts of Non-citizen Residents on the Commonwealth, preliminary report, 1990.
- Julian Simon: The Economic Consequences of Immigration. New York: Basil Blackwell, 1990
- A variety of other studies and articles on immigrant poverty rates and public assistance use by such authors as David North, Barry Chiswick, Sydney Weintraub, Thomas Muller and Thomas Espenshade, George Borjas and Marta Tienda, and Roger Conner.
Additional Notes on Method 1991 Immigrant/Refugee Costs Under H.R. 4300
1. Medicaid — Recipients represent 9.5 percent of the 1988 population. The alien recipiency rate is estimated to be .25 higher or 11.9 percent because of greater alien propensity to seek such assistance (Jensen). Population base is 1,492,000, or the total estimated 1991 immigration cohort under H.R. 4300 minus 150,000 refugees and parolees whose medical care is paid under alternative programs. Inflation adjustment for Medicaid since 1988 is 7 percent yearly. (Note: No inflation adjustments will be indicated for programs that have shown no growth during most recent 3-year period.)
2. AFDC — The national recipiency rate is 4.5 percent. According to HHS data in the President's Triennial Report, the alien recipiency rate is 3.5 percent (inclusion of foreign-born citizen clients would make the foreign born use rate somewhat higher than the rate for aliens alone. The population base excludes 150,000 refugees and parolees in the 1991 cohort, and 485,000 dependents of legalized aliens, whose eligibility would be restricted by H.R. 4300.
3. SSI — The national recipiency rate is 1.8 percent of the total population, according to HHS data in the President's Comprehensive Triennial Report. The alien recipiency rate is 2.6 percent (presumably somewhat higher if foreign born citizen claimants are included). Population base again excludes refugees and asylees.
4. Food Stamps — The national recipiency rate is 8.4 percent of the population. The population base excludes refugees and parolees.
5. School Lunches — 28.8 percent of the school age population receives subsidized lunches. The national recipiency rate is augmented by .56, to adjust for the higher poverty rate among aliens. The recipiency rate of 39.3 percent is applied to 289,800 school age immigrants in the 1991 cohort. Inflation adjustment since 1988 is .33.
6. Housing Assistance — 4.6 percent of all households nationally receive housing assistance. That rate is augmented by .25 for the greater alien propensity to use public assistance. The base population is the 373,000 immigrant households in the 19'91 cohort.
7. Public Education — It is estimated 90 percent of all school age immigrants in the 1991 cohort (289,000) will receive public education at an average cost of 4,602 dollars per year/person. Inflation adjustment for 1988-90 is .13.
8. Student Aid — The national recipiency rate is 14.5 percent of college age population. The alien recipiency rate according to Department of Education data is 7.3. (Foreign-born U.S. citizen clients not included.) No inflation adjustment.
9. Unemployment Compensation — The national rate is 5.6 percent of the labor force. For aliens, the national rate is augmented by .06 because of increased propensity of aliens to be unemployed (Borjas). The base population is 666,400, the estimated 1991 immigrants that will be in the labor force.
10. Refugee Assistance — The amount is based on an assumption of 7,000 dollars per refugee for 3 major service programs for 110,000 funded refugees in 1991, as currently proposed by the administration.
11. Earned Income Tax Credit — The national rate is 11.1 percent of the total population filing 1040s. For aliens, the national recipiency rate is augmented by .56 for greater incidence of poverty. The base population is 451,500 alien 1040 filers in 1991 cohort. Growth projection for 1988-1990 is .12. Cost does not include tax expenditures in the form of tax offsets.
12. Low-Income Energy Assistance — The national recipiency rate is 7.0 percent by 1988 households. The alien recipiency rate is augmented by .25 for increased propensity to seek assistance. The base population is 552,600 alien households in the 1991 cohort. Inflatin adjustment for 1988-1990 is .12.
13. Public Higher Education — The national recipiency rate is 21.5 percent of the college age population. The national rate of 21.5 is applied to 179,000 immigrants in 1991 cohort in the 19-25 age group. Inflation adjustment for 1988-1990 is .12.
14. Bilingual Education — The national recipiency rate is 15.3 percent of the total limited English proficiency (LEP) population. The national rate of 15.3 percent is applied to a base of 230,000 1991 school-age immigrants in the LEP category. Inflation adjustment for 1988-1990 is .12.
15. Compensatory Education — The national recipiency rate is 36.2 percent of the LEP population. The national rate is applied to a base of 178,250 1991 immigrants of school-age in LEP category. Inflation adjustment for 1988-1990 is .12.
16. Adult Education — The national recipiency rate is 8.4 percent of the non-naturalized adult foreign-born population. The national rate is applied to the base of the entire 1991 immigrant and refugee cohort.
17. Vocational Training — The national recipiency rate is 14.5 percent of the national LEP student population. The national rate is applied to the estimated LEP population of 1991 immigrant cohort.
18. JTPA — The national recipiency rate is 3.3 percent of the total population below the poverty line. An estimated 21 percent of the immigrant cohort will be in poverty (based on .56 multiplier applied to national poverty rate of 13.5 percent). Inflation adjustment for 1988-1990 is .12.
19. WIC — The national recipiency rate is 3.6 percent of the population of child-bearing woman and eligible infants and children. The alien recipiency rate is augmented by .25 to compensate for greater propensity to seek assistance. The population base is 602,000 alien women, infants and children in the 1991 cohort. Inflation adjustment for 1988-1990 is .09.
20. Elderly Nutrition — The national recipiency rate is 29 percent of the population over 65. The national rate is augmented by .25 percent for the greater propensity of immigrants to seek assistance. The base population of 36,240 is an estimate of aliens in 1991 cohort over 65. Inflation adjustment for 1988-1990 is .06.
21. General Assistance — The national recipiency rate is 3.7 percent of the 1988 poverty population. National rate is augmented by .25 because of greater propensity of aliens. Population base is 313,300 1991 aliens (excluding refugees) below the poverty line. Inflation adjustment for 1988-1990 is .06.
22. Head Start — The national recipiency rate is 6.3 percent of the population 0-5 years. The national rate is augmented by .25 for alien recipiency. The base population is 79,000 immigrants in the 1991 cohort in 0-5 bracket. Inflation adjustment for 1988-1990 is .06.
23. Criminal Justice/Corrections — The national recipiency rate is the white incarceration rate of 11 per 10,000 population. Inflation adjustment for 1988-1990 is .12.
24. Block Grants — The national recipiency rate is 13.5 percent of the 1988 population. The national rate is augmented by .56 for greater alien incidence of poverty. Base population is entire 1991 immigrant/refugee cohort.