Acknowledgments
We had the expert assistance of many persons in preparing this report. First and foremost, we thank Stephen Tordella, president of Decision Demographics of Arlington, Va., for the computer sampling and weighting and for serving as an excellent sounding board for the technical problems associated with the project. The staff of the Center for Immigration Studies, particularly Robert Malloy, was encouraging throughout and made many useful suggestions that improved the final product. Finally, we thank the Cowell, Munson, and Weeden foundations not only for financing this project, but for the patience exhibited as we proceeded through this study. Thank you all. Our conclusions, of course, are our own and do not necessarily reflect those of our colleagues.
About the Authors
Leon Bouvier is an adjunct professor of demography at Tulane University. He served as a demographic consultant to the Select Commission on Immigration and Refugee Policy and vice president of the Pupulation Reference Bureau. Previous publications include How Many Americans (with Lindsey Grant) and Peaceful Invasions. Rosemary Jenks is an independent immigration consultant.
Table of Contents
List of Tables
Executive Summary
Introduction
Sampling Methods
Changes Between 1980 and 1990
Physicians in the United States in 1990
Registered Nurses in the United States in 1990
Immigration Policy and the Supply of Doctors and Nurses
The Health Care Labor Market in the 1990s and Beyond
Options for the Future
End Notes
List of Tables
2.1 Growth in the Number of Physicians: 1980-1990
2.2 Distribution of Physicians by Race and Gender: 1980-1990 (percentages)
2.3 Growth in the Number of Registered Nurses: 1980-1990
2.4 Distribution of Registered Nurses by Race and Gender: 1980-1990 (percentages)
3.1 Physicians by Age and Gender: 1990
3.2 Distribution of Physicians by Age, Gender, and Race: 1990
3.3 Nativity of Physicians by Race and Gender: 1990
3.4 Percent Foreign-born and Female Physicians by Race and Age: 1990
3.5 Foreign-born Physicians by Gender and Ethnicity
3.6 Date of Entry of Foreign-born Physicians by Ethnicity (percentages)
3.7 Native-born Physicians by Ethnicity, Gender, and Percent Female
3.8 Total Physicians by Ethnicity, Gender, Percent Female: 1990
3.9 Income Distribution of Physicians by Race and Nativity
3.10 Median Income and Percent Earning $100,00 or more by Ethnicity
3.11 Number of Persons in Work Force and Number of Physicians per 100,000 in Work Force by Race and Ethnicity: 1990
4.1 Registered Nurses by Age and Sex: 1990
4.2 Distribution of Registered Nurses by Age, Gender, and Race: 1990
4.3 Nativity of Registered Nurses by Race and Gender
4.4 Percent Foreign-born and Male Registered Nurses by Race and Age: 1990
4.5 Foreign-born Registered Nurses by Gender and Ethnicity
4.6 Date of Entry of Foreign-born Registered Nurses by Ethnicity (percentages)
4.7 Native-born Registered Nurses by Ethnicity, Gender, and Percent Male
4.8 All Registered Nurses by Gender and Percent Male: 1990
4.9 Educational Attainment of Native-born Registered Nurses by Race: 1990
4.10 Educational Attainment of Foreign-born Registered Nurses by Race: 1990
4.11 Educational Attainment of Registered Nurses by Nativity and Ethnicity: 1990(percentages)
4.12 Income Distribution of Registered Nurses by Race and Nativity
4.13 Median Incomes of Registered Nurses by Nativity and Selected Ethnicity: 1990
4.14 Total Number of Persons in Work Force and Number of Registered Nurses per 100,000 in Work Force by Race, Ethnicity: 1990
5.1 Immigration of Doctors and Nurses: 1990-1996
Executive Summary
There are four important questions to ask when evaluating any skill-based visa program:
- Is the current supply of people with that skill sufficient?
- Will the supply be sufficient in the future?
- Is the visa program responsive to the labor market?
- Does this flow of professionals benefit the United States and the sending countries?
This study answers these questions for the two leading health professions — doctors and nurses — and also provides a detailed demographic picture of doctors and nurses in the United States.
The answer to the first two questions is that there are more than enough doctors and nurses currently practicing in the United States and that, even if no more of these professionals were allowed into the United States, there will continue to be a surplus for the foreseeable future. In fact, The Pew Health Professions Commission, The National Academy of Sciences' Institute of Medicine, and others have recommended reducing the number of native-born medical school graduates in the United States as a way of correcting this oversupply. That being the case, it makes no sense to continue admitting (and in some cases even subsidizing) foreign-born medical professionals to the United States.
Clearly, then, current immigration policies are not responsive to the labor market. If they were, the number of doctors and nurses allowed to immigrate to the United States already would have been sharply reduced if not eliminated altogether. Without reductions, this continuous flow of health professionals into an already bloated system will continue to harm native-born doctors and nurses as well as the general public. In addition, allowing large numbers of doctors and nurses to immigrate to the United States has a negative effect on the sending countries. Ireland and England in particular are both suffering from a severe shortages of nurses, yet a significant proportion of foreign-born nurses who come to the United States are from these two countries.
Current immigration policies for foreign-born doctors and nurses are not in the best interest of the United States. While the immigration-induced wage reductions that so profoundly affect less well paid professions are perhaps not as pressing for doctors and nurses, we cannot ignore the impact mass immigration has on the health care systems in sending countries. Congress and the INS would do well to take a closer look at these programs and make changes to reflect the fact that there are more than enough native-born doctors and nurses without encouraging immigrants to further swell the ranks of these professions.
Introduction
The purpose of this study is to develop a detailed demographic picture of physicians and registered nurses, the two leading health care professions, in order to answer the following questions:
- Is the current supply of such professionals adequate?
- Is future demand for physicians and registered nurses likely to outpace supply?
- Are the various immigration policies that allow foreign-born physicians and registered nurses to practice in the United States responsive to the labor market?
- Does the continuous flow of these foreign-born health care professionals into the United States serve the interests of this country and those countries from which they hail?
The first part of this study uses 1990 census data to develop a demographic profile of physicians and registered nurses who were in the United States in 1990. It includes all persons age 18 and over who fell into these two professions. Looking at physicians first, we determine how many there were, along with their age and sex. We look at nativity, race, and ethnicity to determine how many were foreign born and whence they came. We also look at how long the foreign born have been in the United States. We then make comparisons by age, sex, nativity, and other relevant factors, including income. Registered nurses are studied in the same manner, but educational attainment is also considered since a bachelor's degree is not a prerequisite for becoming a nurse.
The second part of the study examines the broader labor issues. We examine the immigration policies that allow foreign-born physicians and registered nurses to practice, either permanently or temporarily, in the United States, and we use data from the Immigration and Naturalization Service (INS) and other government agencies to determine how many of these professionals have entered the country since 1990. Finally, we look at data gathered by medical associations and other independent organizations to determine the impact of such immigration policies on current and prospective native-born physicians and registered nurses and to speculate on the future demand for physicians and nurses.
Sampling Methods
Our data are drawn from the 1990 Census PUMS File A, the 5 percent national sample. Sub-samples of the PUMS were drawn in order to:
- include only people 18 and over who are in the labor force;
- provide, where possible, statistically significant samples of the foreign born;
- furnish adequate samples of racial and ethnic minorities; and
- ensure adequate representation of each of the groups being studied, while allowing for efficient processing on a personal computer-based platform.
Changes Between 1980 and 1990
Physicians
According to the Census Bureau counts for 1980 and 1990 (rather than our own estimates for 1990 based on our sampling procedure), the number of physicians in the United States rose from 431,418 in 1980 to 586,715 in 1990 — representing a decennial increase of 36 percent. This compares to an increase of less than 10 percent in the overall U.S. population during the same time.
The increase among female physicians was significantly greater than among males. Indeed, the number of female physicians more than doubled over the decade, while the male increase was less than 25 percent. In all racial categories, the rate of growth among female physicians — whose numbers more than doubled, except among Asian women — was far greater than that among males. Yet, there were still far fewer female than male physicians.
Table 2.1 shows that among the four racial groups, the rate of growth was highest for Blacks and Hispanics — 55.9 percent and 53.4 percent, respectively. However, their numbers were small in the first place. Among Asians, the rate of growth over the decade was 38.1 percent, and for non-Hispanic Whites, it was 34.1 percent.
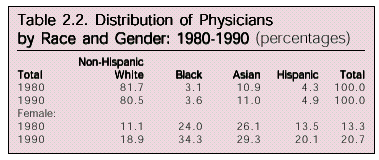
These variations in the rate of growth by both race and gender resulted in changes in demographic distribution over the 10-year period. Looking first at racial distribution, the non-Hispanic-White share fell slightly over the decade, from 81.7 percent to 80.5 percent. In turn, the share for the three minority groups rose slightly. Nevertheless, non-Hispanic Whites remain over-represented in this medical profession in that their share of the total population is less than 75 percent.
As Table 2.2. shows, the proportion of female physicians has risen substantially in all groups. Overall, one in five physicians were women by 1990. This is a marked increase from 13.3 percent in 1980. Among Black physicians, over one-third were women, compared to one-quarter just 10 years earlier.
Registered Nurses
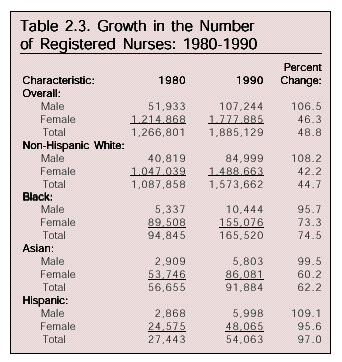
The decennial growth rate among registered nurses was even higher than that noted for physicians — 48.8 percent overall. The number of registered nurses rose from 1,266,801in 1980 to 1,885,129 in 1990. Thus, as with physicians, the rate of growth far exceeded that for the population as a whole. Increases were noted for all gender and race groups, as Table 2.3 indicates.
Though starting from a much smaller base number, the percentage increase among male registered nurses was far greater than among females. Over the decade, the number of male nurses more than doubled while the number of females grew by 46.3 percent. This predominantly male growth was noted among all four racial categories but was especially high for non-Hispanic Whites and Hispanics. Even among Blacks and Asians, though, the number of male registered nurses almost doubled over the 10-year period.
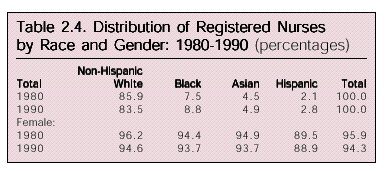
As with physicians, non-Hispanic-White registered nurses dominated the profession out of proportion to their share of the total population (see Table 2.4). However, their share fell to 83.5 percent in 1990 from 85.9 percent in 1980. The other groups all grew slightly over the decade. Especially notable is the share of Asians whether in 1980 or 1990 as compared to their small share of the total population. Indeed, there were almost twice as many Asian nurses as there were Hispanics, although the latter's total population far exceeds that of Asians.
Despite the inroads made by men in the nursing profession, it remains an overwhelmingly female occupation. The female share in 1980 was 95.9 percent and it fell just to 94.6 percent in 1990. Only among Hispanics was the female share under 90 percent.
In sum, the 1980s witnessed tremendous growth in both health professions at rates well above those recorded for the population at large. Women made significant inroads among physicians and, by 1990, represented just over 20 percent of the occupation. The share of males among registered nurses doubled over the period, but their numbers were so small to begin with that the profession remained predominantly female in composition.
Non-Hispanic Whites dominated both medical professions in proportions higher than their share of the overall population. While these shares have dropped since 1980, they still remained high in 1990. Asians' representation in both professions was also considerably greater than in the overall U.S. population, but all minority groups saw their numbers and proportion increase between 1980 and 1990.

Physicians in the United States in 1990
According to our sampling estimates of the 1990 census, there were 582,573 physicians in the United States at that time. This total differs only slightly (-0.7 percent) from the official census count of 586,715. The validity of our sampling procedure is further reinforced by the share of physicians who were female. We estimate it to have been 20.2 percent, compared to 20.7 percent for the overall census count. Table 3.1 summarizes these data by age and sex.
Age and Gender
The typical U.S. physician was about 42 years of age in 1990. On the whole, male physicians were somewhat older than their female counterparts. The growing number of women in the profession is demonstrated clearly in Table 3.1. Only about 11 percent of physicians aged 55 and over were women; on the other hand, about one-third of those under 35 were women. Among those under 25, presumably interns and residents, close to half were women. A gender revolution is definitely taking place in this profession. As we move toward the next century, we can reasonably expect to find as many female as male physicians.

Racial Composition
Of the almost 600,000 physicians in the United States in 1990, over 80 percent were non-Hispanic White and almost 11 percent were Asian. Both Blacks and Hispanics were significantly under-represented in this profession.
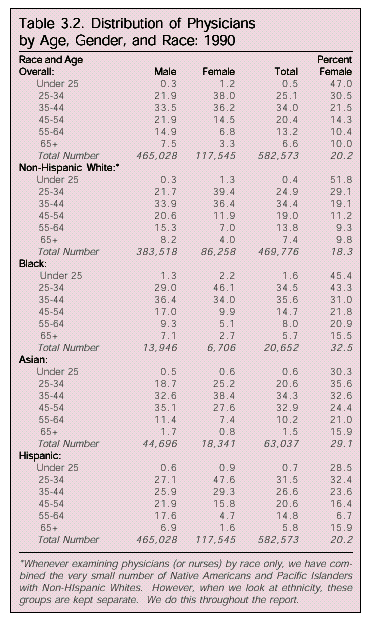
As Table 3.2 (page 12) shows, Black physicians were considerably younger, on average, than other groups. Almost 72 percent of Blacks were under age 45, compared to less than 60 percent for non-Hispanic Whites and Hispanics, and 55 percent for Asians. This suggests that Blacks, like women, are late entries into the profession.
We have noted that, overall, about one in five physicians were female. That share was lowest among non-Hispanic Whites (18.3 percent) and highest among Blacks (32.5 percent).
Female participation in the profession also varied by age, as well as by racial background. There was an inverse relation between age and the share of female physicians in all four racial groups. Over half of all the non-Hispanic Whites under age 25 (again, undoubtedly still in medical school) were women. Almost 30 percent of those age 25 to 34 were women. Among Blacks, close to 43 percent of all physicians were women under 35. At the other extreme, non-Hispanic-White women represented less than one in ten of those 65 and over.
Nativity
Up to this point, we have looked at physicians in general — how many there were and their age, gender, and racial background. However, it has been widely reported in recent years that one in five physicians in the United States are immigrants. In fact, an earlier study of 1990 census data concluded that physicians had by far the highest foreign-born proportion of any profession in the nation.1 Our analysis of the 1990 census data confirms that 20.2 percent were born outside the United States.
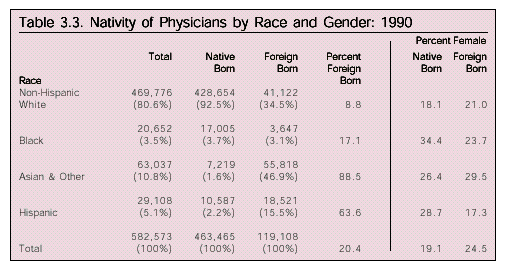
While one in five physicians were foreign born, substantial variations exist among the racial groups. For example, only 8.8 percent of non-Hispanic-White physicians and 17.7 percent of Blacks were foreign born, but that share rises to 63.6 percent among Hispanics and 88.5 percent among Asians. Table 3.3 (page 13) looks at these variations by race and gender.
While non-Hispanic Whites dominated numerically among native-born physicians, this was not the case among those born elsewhere. Close to half of all foreign-born physicians practicing in the United States in 1990 were born in Asia, compared to just over one-third of non-Hispanic Whites who were born elsewhere.
We also compared females in the profession by nativity and race. For the total physician population, almost one-quarter of those born elsewhere were women, compared to 19.1 percent of those born in the United States. A higher proportion of non-Hispanic-White and Asian female physicians were foreign born than native born. On the other hand, the share of female physicians was higher among native-born Blacks and Hispanics than it was among foreign-born Blacks and Hispanics.
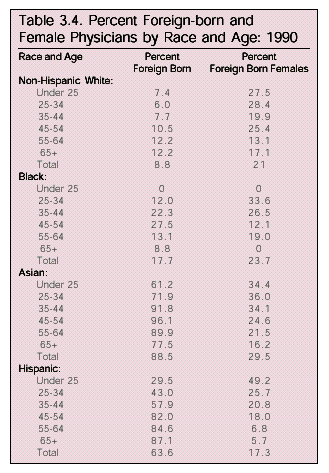
In looking at possible age variations by racial group, we concentrated on the foreign-born proportion and the share of female physicians at different ages (see Table 3.4 on page 14). Among non-Hispanic Whites and Hispanics, the foreign-born proportion rose with age. However, among Blacks and Asians, the foreign-born proportion peaked at middle age — between ages 45 and 54. Among Asians, for example, over 96 percent of physicians aged 45 to 54 were foreign born.
Ethnicity of the Foreign Born
The surprisingly large share of physicians born outside the United States suggests a more detailed analysis of this group. Who are they? Where did they come from? Are there differences in characteristics by place of origin? How long have they been here? How do they compare to native-born physicians on relevant variables?
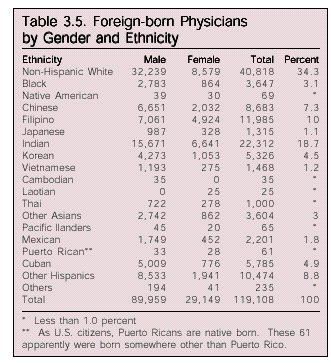
We relied on the census question on race rather than country of birth to develop our profile of foreign-born physicians, since country of birth can be misleading. In Table 3.5 (page 15) we include all racial/ethnic groups with physicians in our census sample. Further discussions will be limited to the top twelve source countries — those with over 1,000 physicians — since smaller sampling numbers would be unreliable.
Over one-third of foreign-born physicians were non-Hispanic White, and probably European, Canadian or Australian by birth.2 Almost 19 percent were Indian and 10 percent were Filipino. We also noted a few unexpected results: There were more foreign-born Vietnamese than Japanese physicians in the United States and the Mexican total of 2,201 physicians is surprisingly small given the large Mexican population (there were 6.6 million foreign-born Mexicans in the United States). It should also be pointed out that about 80 percent of all foreign-born Blacks come from Caribbean countries.
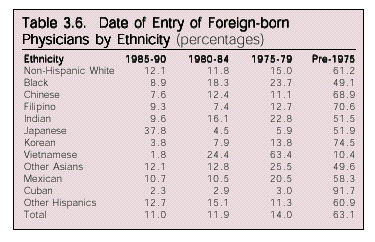
Close to two-thirds of all foreign-born physicians had been here since at least 1975. Almost 92 percent of Cuban physicians had been here since before 1975, an obvious reaction to the Castro revolution in their homeland. Since 1975, very few Cuban physicians have moved to the United States. Similarly, Koreans were early arrivers. The Vietnamese physicians came a little later — over 63 percent came between 1975 and 1980. Again, this reflects the hostilities in that part of the world. Six out of 10 of the largest ethnic group — non-Hispanic Whites — arrived before 1975. The Japanese, though a rather small group, present an interesting picture: Almost 38 percent were newcomers (i.e. they arrived between 1985 and 1990), but over half arrived before 1975. Table 3.6 (page 15) gives additional detail on date of entry.
Comparison of Foreign- and Native-born Physicians by Ethnicity
Since the native born comprised 80 percent of all physicians, separating out the native born from the total did not result in any significant variations. We have already compared the native and foreign born by race, but it is appropriate to compare them internally to examine how the various ethnic groups differ. For example, how do native-born Indian physicians compare to their foreign-born counterparts in number, age, and gender? By examining both groups and then summing them up, we will have a complete ethnic picture of the profession in the United States as of 1990.
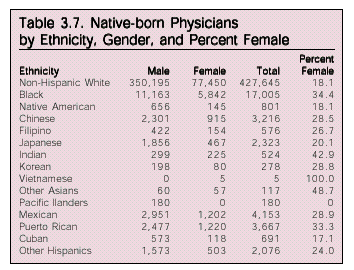
We begin by looking at native-born physicians by ethnicity and gender (Table 3.7, page 16). As expected, non-Hispanic Whites represented over 80 percent of native-born physicians. Among Asian-ancestry groups, American-born Chinese and Japanese are the most numerous.
The lowest female shares in the profession were found among non-Hispanic Whites and Cubans, the latter percent based on a small number. On the other hand, almost 43 percent of American-born Indian physicians were women, and fully one-third of both Black and Puerto Rican physicians were women. Thus, the often cited figure that one in five American doctors is female is true because of the larger proportion of minority women in the profession.
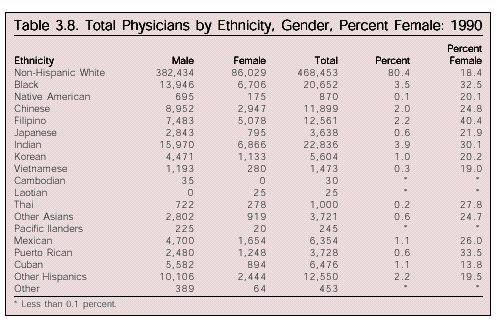
Now that we have gathered data on both native and foreign-born physicians, we can return to our original analysis and look at all physicians in the United States by ethnic background. We can then examine other variables such as age, gender, and income (see Table 3.8 on page 16).
It is not surprising to note that four out of five doctors in the United States in 1990 were non-Hispanic White. What is surprising is the fact that there were more Indian physicians (mostly foreign born) than Black physicians (mostly native born). The share of the adult U.S. population that is of Indian origin (irrespective of place of birth) is infinitesimal compared to that of Blacks. In a similar vein, there were twice as many Filipino physicians as Mexican physicians (again, irrespective of nativity), though the Mexican population in the United States far surpasses the Filipino population.
Following Indians and Blacks in number were Chinese and Filipinos. It is clear that Asians, whether born here or abroad, are a growing proportion of this profession, while other minorities continue to be significantly under-represented.
When comparing racial groups above, we noted that non-Hispanic-White females were under-represented as compared to women of other groups. This is equally true when examining ethnic background. With the exception of Cubans, the proportion of female physicians is lower among non-Hispanic Whites than any other group with sufficient numbers to analyze.
Income
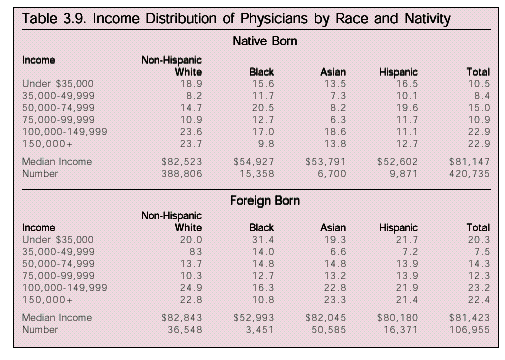
The income data were derived by combining two census items: "Wage and Salary Income" and "Non-Farm Self-Employment Income." We then calculated median income. Because physicians are so highly paid, this method understates total income since many individuals are in the open-ended category of $150,000 or more. Furthermore, by looking at persons under age 25, we included interns and residents whose wages are low. However, given our data source, it was necessary for us to limit our calculation to median income.
To get a good picture of actual income, we limited our analysis to physicians who worked full-time — defined by the Census Bureau as at least 35 hours per week. Approximately nine out of 10 physicians worked full time.
The annual median income of these physicians, according to the 1990 census, was just over $81,000. The mean income in the same year was $155,800, according to a sample telephone survey by the American Medical Association.3 It should be pointed out, however, that this survey did not include residents. The Census does not distinguish between interns, residents, and practicing physicians.
In Table 3.9 (page 17), we list the incomes of physicians by nativity and race. The difference in median income between the native born and the foreign born overall was minimal, though the latter had a slight edge. Among the native born, non-Hispanic Whites had far and away the highest income. They also constituted 92 percent of all the native-born full-time physicians. Almost half of this group earned at least $100,000 annually, with 23.7 percent making $150,000 or more. Thus, their mean income was considerably higher than their median income. The relatively lower and quite similar incomes of all native-born minority groups was somewhat surprising, but may be at least partially explained by their age — minorities were newer to the profession and, as we will see later, had a higher share of residents represented.
The median incomes of the foreign born, with one large exception, were much more comparable, though all but foreign-born Blacks had higher incomes than their native-born counterparts. Foreign-born non-Hispanic Whites again had the highest median income ($82,843), but the Asian born earned $82,045 and Hispanics $80,180. In all three groups, over 40 percent had incomes totaling at least $100,000 per year, suggesting that their mean incomes were higher than the median indicates. The very low income of foreign-born Black physicians is the exception. Their median income of $52,993 was the lowest of all racial groups irrespective of nativity. Less than 11 percent earned over $150,000, compared to well over 20 percent among all other foreign-born groups. A number of factors may have contributed to this large difference in income: Individuals in this group may have been younger than average and had a greater proportion of residents than other groups; they may have been less apt to specialize in higher-paying areas such as surgery and, instead, been in family practice; or they may have opted to serve low-income areas to a greater extent than other groups.
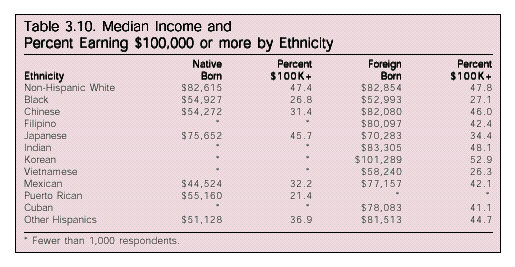
There were also substantial variations in the incomes of physicians by ethnic background. Table 3.10 (page 18) shows the median incomes and the percent earning $100,000 or more annually of those ethnic groups with at least 1,000 physicians. Among the native-born, non-Hispanic Whites and those of Japanese ancestry earned considerably more than the other groups. Chinese-Americans, Mexican-Americans, and Other Hispanic-Americans earned less than African-Americans, and Puerto Ricans earned slightly more than African-Americans. With the exception of Blacks and Japanese, the foreign born of each group for which the sample population was at least 1,000 physicians earned more than their native-born counterparts. Over half of Korean-born physicians earned over $100,000 per year and their median income was $101,289 — by far the highest of any group irrespective of nativity. The next highest paid group of foreign-born physicians were Indians ($83,305), followed closely by non-Hispanic Whites and Chinese. At the other extreme among the foreign born, Blacks earned $52,993, which is slightly less than the median income of native-born Blacks.
Proportion of Population Who Are Physicians
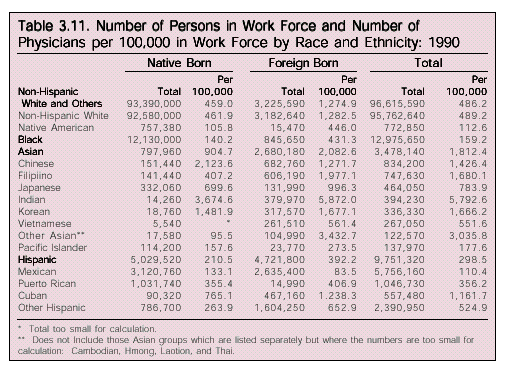
We noted earlier that certain racial and ethnic groups were over- or under-represented in this medical profession. For example, 80.5 percent of all U.S. physicians were non-Hispanic Whites, even though non-Hispanic Whites comprised about 75 percent of the total U.S. population. Similarly, while the foreign-born population in the United States was only 7.9 percent of the total population in 1990, 20.2 percent of all physicians were foreign born. In Table 3.11 (page 19) we have calculated how many physicians, native and foreign born, there were per 100,000 members of the respective work forces by race and ethnicity. This gives us a more accurate picture of the tendency to become a physician among members of various racial and ethnic groups.
Looking first at the four main racial groups, it is clear that Asians, whether native born or foreign born, were far more likely to be physicians than any other group. Overall, Asians were almost four times as likely to be physicians as non-Hispanic Whites — their closest competitor. At the other extreme, only 159 per 100,000 Blacks were physicians. This trend was similar for those born in the United States and those born abroad. African-Americans were at the bottom among the native born, but Hispanics were the least likely to be physicians among the foreign born. The foreign born in all racial categories were significantly more likely to be physicians than their native-born counterparts. By far the highest rate among all groups was for foreign-born Asians, with over 2,000 physicians per 100,000 adults in the workforce.
Both the Hispanic and Asian groups can be examined in more detail by ethnicity. Indians, whether native or foreign born, had a much higher rate of physicians per 100,000 persons in the work force than any other ethnic group. Overall, their rate was an astounding 5,793 per 100,000 Indians in the work force (i.e., almost 6 percent of Indian workers in the United States are doctors). Only "other Asians," with 3,036 per 100,000 adults, were remotely close. The next highest rate was that of Filipinos (1,680 per 100,000). Among non-Hispanic Whites, only 489 per 100,000 were physicians. The lowest rates were found among Mexicans (110 per 100,000) and Native Americans (113 per 100,000), with Blacks doing slightly better than both at 159 per 100,000. The rate among foreign-born Indians was even higher than their overall rate (5,872 per 100,000). No other group came close. Foreign-born Mexicans had by far the lowest rate (84 per 100,000). Just as with the racial groups, the foreign born in all ethnic groups were significantly more likely to be physicians, with the exception of Chinese and Mexicans, whose native-born counterparts had higher rates.
Indian-Americans had the highest rate among the native born, followed by Chinese-Americans. Among the lowest were African-Americans, Native Americans, Mexican-Americans, and Pacific Islanders — all with well under 200 physicians per 100,000 adults in the work force.
According to our sample of the 1990 workforce, we estimated there were almost 13 million Blacks and 9.7 million Hispanics — native and foreign born — in the United States. Together, these two largest minorities produced about 50,000 physicians. In sharp contrast, fewer than 400,000 Indians produced over 22,000 physicians. Similar comparisons can be made with non-Hispanic Whites, where 93 million individuals in the work force produced a mere 468,000 physicians. There were almost 5.8 million persons of Mexican origin in the work force but the number of Mexican-origin physicians was only 6,300. While there were 14 times as many Mexicans as Indians in the work force, doctors among the latter outnumbered the former almost four to one.
It is clear that Asians — especially the foreign born — have contributed tremendously to the growth in the size of the physician profession in the United States. We cannot help but wonder why more native-born minorities have not been recruited into this high-paying profession. For example, if native-born African-Americans exhibited the same rate of physicians per 100,000 adults in the work force as non-Hispanic Whites, there would have been 55,798 African-American doctors, rather than 17,005.
Registered Nurses in the United States in 1990
In our sample of the 1990 census, we estimated a total of 1,896,606 registered nurses in the United States. Our count differs very slightly from the official number based on a complete enumeration (1,885,129). Again, this reinforces the quality of our sampling procedure, since the difference with the total count is a mere 0.6 percent.
Age and Gender
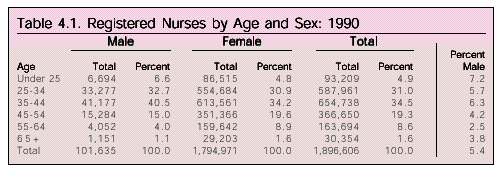
In 1990, 19 out of 20 registered nurses (94.6 percent) in the United States were women. While there was some increase in the male share in recent years, male nurses remained a rarity. In part because of their recent entry into nursing, male registered nurses tended to be slightly younger than their female counterparts (see Table 4.1). About 40 percent of male registered nurses were under 35 compared to 36 percent of females. At the other end of the age spectrum, over 10 percent of female registered nurses were 55 or over, compared to only 5.1 percent of males.
Racial Composition
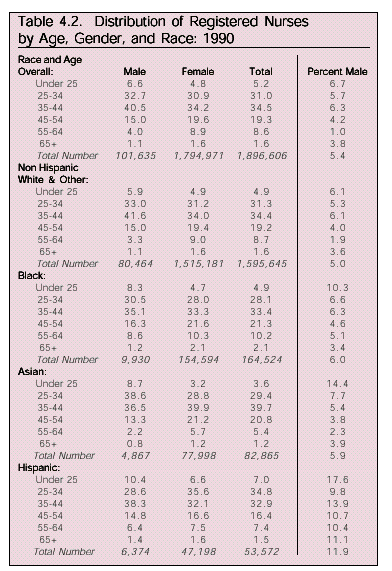
Over 84 percent of all registered nurses in the United States in 1990 were non-Hispanic White. Another 8.7 percent were Black, 4.4 percent were Asian, and 2.8 percent were Hispanic. Hispanic registered nurses were slightly younger than other groups — almost 42 percent were under age 35, compared to 33 percent among both Blacks and Asians — perhaps because of their later entry into the profession (see Table 4.2 on page 22).
The proportion of male registered nurses, though small in all cases, was highest among Hispanics, where men represented almost 12 percent of registered nurses. This was double the male share of all other racial groups. Male registered nurses were likely to be younger in all racial groups. Among non-Hispanic-Whites, the male share was highest (6.1 percent) among those under age 25 and those 35 to 44 years of age. But among all minorities, the share of male registered nurses under age 25 was consistently over 10 percent and reached a high of 17.6 percent for Hispanics.
Nativity
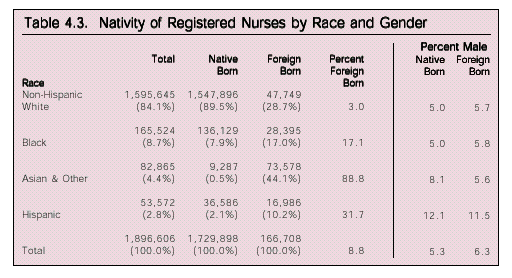
Over 90 percent of all registered nurses in the United States were native born. However, this proportion varied widely by racial background (see Table 4.3 on page 23). For example, 97 percent of non-Hispanic-White registered nurses were native born, but only about 11 percent of Asian nurses were born in this country. The foreign-born proportion among Blacks also was surprisingly high — 17.1 percent — given the small overall foreign-born Black population.
The share of male registered nurses was larger among the foreign born than the native born, but the difference was small — 6.3 percent as compared to 5.3 percent. Differences between the racial groups were more substantial. Around 12 percent of Hispanic registered nurses were male, irrespective of place of birth, and over 8 percent of Asian native-born registered nurses were males. The lowest shares were among native-born non-Hispanic Whites and Blacks and among foreign-born Asians.
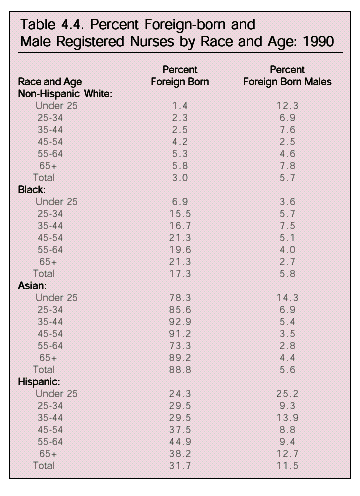
Given the recent growth in male registered nurses, as well as the growing number of foreign born in the profession, we next examined the age composition for foreign-born registered nurses, along with the male share in each age-race group (see Table 4.4 on page 24). For non-Hispanic Whites and for Blacks in general, the older the group, the higher the foreign-born share. Among Asians, on the other hand, the proportion of foreign born was highest among those aged 35 to 44 (92.9 percent) and lowest among those aged 55 to 64 (73.3 percent). For all groups except Blacks, the male share was significantly higher among those under age 25, suggesting a new movement of young males into the profession.
Ethnicity of the Foreign Born
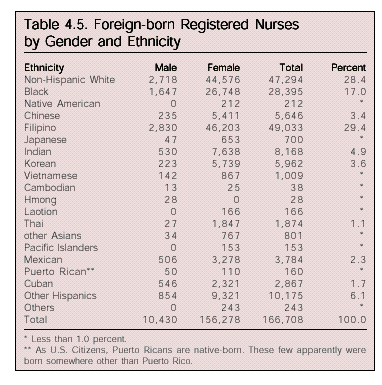
Who were the 167,000 foreign-born registered nurses practicing in the United States in 1990? Table 4.5 (page 25) categorizes them by gender and ethnicity. Further analysis will be limited to those source countries with at least 1,000 registered nurses in the United States.
Almost 30 percent of all foreign-born registered nurses in the United States were Filipino; 28.4 percent were non-Hispanic White; and 17 percent were Black, mainly from Caribbean nations. Thus, three-quarters of all foreign-born registered nurses practicing in this country in 1990 were either Filipino, non-Hispanic White, or Black. No other ethnic group came even remotely close to these three insofar as shares of the foreign born are concerned.
Two unexpected findings are worth noting: There were more Korean than Mexican registered nurses, though the overall Mexican population is vastly larger; and the share of registered nurses who were "Other Hispanic" was considerably greater than either the Cuban or Mexican shares.
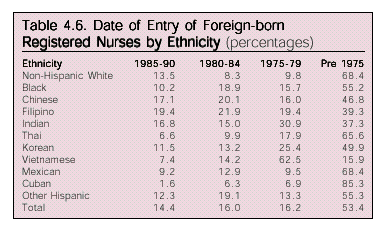
A little over half (53.4 percent) of all foreign-born registered nurses in the United States arrived prior to 1975. This proportion is somewhat lower than that noted for physicians (63.1 percent). Table 4.6 (page 25) summarizes date of entry data by ethnic background for those groups having at least 1,000 registered nurses in practice in 1990.
The latest arrivals were Filipinos and Chinese. Almost one in five Filipino registered nurses arrived in the United States after 1985; the rate for Chinese was only slightly lower (17.1 percent). Over two-thirds of non-Hispanic Whites and 55 percent of Blacks arrived before 1975. In some cases, patterns of entry reflect upheavals in the source countries. Over 62 percent of all Vietnamese registered nurses, for example, arrived between 1975 and 1979, and over 85 percent of Cuban registered nurses came prior to 1975. Only among Asian groups did the share of nurses arriving before 1975 drop to less than a majority.
Comparison of Foreign- and Native-born Registered Nurses by Ethnicity
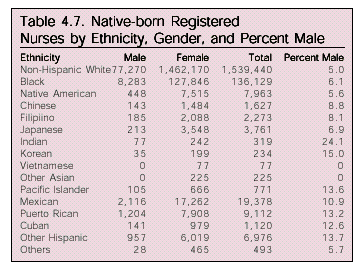
Our initial analysis found that over 91 percent of all registered nurses in the United States in 1990 were native born. Among Asians, however, just the opposite was true — 89 percent of Asian registered nurses were foreign born. Now that we have looked at foreign-born nurses by gender and ethnicity, we will do the same for the native born (see Table 4.7 on page 26).
Non-Hispanic-Whites represented 89 percent of all native-born registered nurses. African-Americans comprised the second largest group, followed by Mexicans, Puerto-Ricans, and Native Americans. The number of native-born Asian registered nurses was small, reflecting their later arrival in this country.
The lowest share of males in the nursing profession was found among non-Hispanic Whites, where they comprised only five percent of all native-born registered nurses. At the other extreme, close to one-quarter of all native-born Indian nurses were male. (Bear in mind, of course, that this is based on a very small sample size.) Interestingly, the pattern among non-Hispanic-White registered nurses complements that among their physician counterparts: Non-Hispanic Whites had the lowest shares of both male nurses and female doctors.
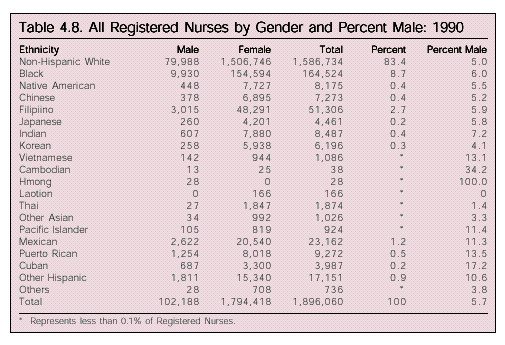
By combining the data from above, we can now look at all registered nurses in the United States by gender and ethnicity (see Table 4.8 on page 26). Later, we will add such variables as age, gender, education, and total income.
Overall, non-Hispanic Whites dominated the nursing profession in 1990, comprising 83.4 percent of the total. Blacks were a distant second, with 8.7 percent. The only other group of any size was Filipinos, most of whom were foreign born. Asian nurses were not nearly as prevalent as Asian doctors. Numerically, at least, the nursing profession appears to be more attractive to Hispanics than to Asians. Koreans and non-Hispanic Whites had the lowest shares of male nurses. On the other hand, males made up over 10 percent of each Hispanic group.
Educational Attainment
We omitted educational attainment as a variable in looking at physicians because we can assume that all physicians have advanced degrees. That is not the case with registered nurses. Two-year post-secondary programs lead to the associate degree, and three year programs result in a registered nurse diploma. There also are complete bachelor's programs. Increasingly, nurses are continuing their education beyond college and receiving master's degrees and even doctorates. In this section, we examine the educational distribution of registered nurses and look at variations by nativity, race, and ethnicity.4
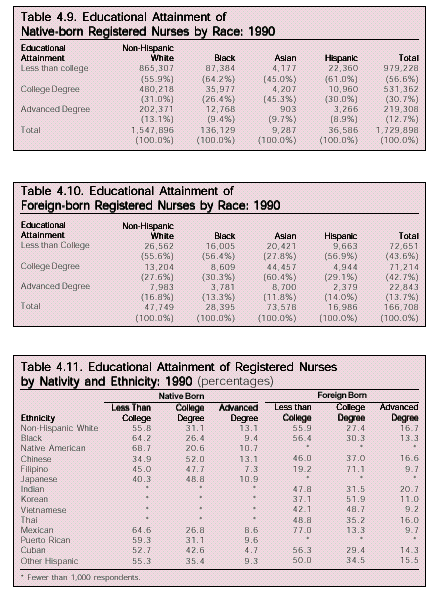
Among native-born registered nurses, Asians had the highest proportion — 55 percent — with college or advanced degrees (see Table 4.9 on page 27). This compared to 44.1 percent for non-Hispanic Whites, 35.8 percent for Blacks, and 38.9 percent for Hispanics. More than half (56.6 percent) of all native-born registered nurses had less than a college degree, while fewer than 13 percent had advanced degrees.
Among the much smaller group of foreign-born registered nurses, the educational dominance of Asians was even more obvious (see Table 4.10 on page 27). Close to three-quarters of Asian-born registered nurses had at least a college degree, compared to just over 44 percent of non-Hispanic Whites. Less than 28 percent of Asians had less than a college education, while over half of the registered nurses in all other racial categories fell into that category.
Overall, foreign-born registered nurses exhibited a somewhat higher level of educational attainment than native-born registered nurses. This is due overwhelmingly to the high educational attainment of nurses from Asian countries. It should be recalled, however, that the foreign-born contingent represents only a small portion of the total number of registered nurses in the United States.
We noted earlier that foreign-born Filipino nurses predominated among those coming from Asia, so it may be that this group was the main factor in the high educational performance of Asian-born nurses in general. Thus, we turn to a more detailed ethnic picture of the nursing profession, examining the educational attainment of selected ethnic groups — both native and foreign born (see Table 4.11 on page 27).
While Asian-born registered nurses, as a whole, fared quite well educationally, the performance of Filipinos was striking. Over 90 percent of Filipino-born registered nurses had at least a college degree. By comparison, only about 23 percent of Mexican-born nurses had that level of education. Among non-Hispanic Whites, whether native or foreign born, about 44 percent had at least a college degree.
Every other Asian-born group (with at least 1,000 respondents) had a majority in the college-plus categories. Only one other foreign-born group had as much education — "Other Hispanics," which had exactly 50 percent.
Among the native born, only three groups — Chinese, Japanese, and Filipinos — had a majority with at least a college education. On the other hand, close to two-thirds of native-born Mexicans, Blacks, and Native Americans had less than a college education, along with almost 56 percent of non-Hispanic Whites.
Thus, foreign-born registered nurses clearly had more formal education than their native-born counterparts, but only because of the higher shares of college graduates among foreign-born Asians, particularly Filipinos.


Income
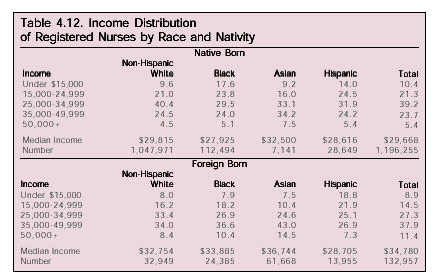
As with physicians, we have combined two census items to arrive at an estimate of the total income of registered nurses: "wage and salary income" and "non-farm self-employment income." We used these to calculate median income. Using median, rather than mean, income may lower the average somewhat, but not to the extent noted for physicians since nurses seldom make six-figure salaries. For example, our estimate of overall median salary for registered nurses in 1990 was about $31,000, while their mean income in 1992 was just over $35,000.5 We also limited our analysis to full-time workers, defined by the Census Bureau as at least 35 hours per week. Unlike physicians, about 90 percent of whom worked full-time, only 70 percent of all registered nurses were classified as full-time employees in 1990. This includes 69.2 percent of native-born registered nurses and 79.8 percent of foreign-born nurses.
Foreign-born nurses earned considerably more than their native-born counterparts. The difference is just over $5,000 per year (see Table 4.12). Within the native-born contingent, Asian nurses earned the most, followed by non-Hispanic Whites, Hispanics, and then Blacks. Asian registered nurses also were the highest paid within the foreign-born contingent, followed by Blacks, non-Hispanic Whites, and then Hispanics. The income of foreign-born Asians — $36,744 — was the highest of all racial groups, irrespective of place of birth.
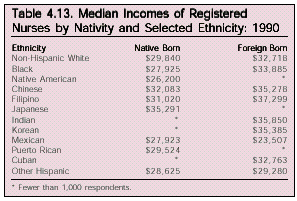
Table 4.13 (page 29) shows 1990 median incomes for selected ethnic groups. Among the native born, Japanese registered nurses were the highest paid, followed by Chinese and Filipinos. Non-Hispanic Whites earned just under $30,000. Native-born Black and Mexican nurses had almost identical median incomes — $27,925 and $27,923, respectively — and earned less than all other native-born groups except Native Americans. Filipino-born nurses, whose median income was $37,299, earned more than any other group, whether native or foreign born. Foreign-born Mexican nurses, whose median income was $23,507, earned significantly less than all other groups. Following the Filipinos at the high end of the spectrum were three other Asian-born groups: Indians, Koreans, and Chinese.
Overall, Asian nurses, whether born in the United States or abroad, earned more than other registered nurses in the United States, undoubtedly because they had considerably more education than nurses of other races. Although we were unable to control for educational attainment while looking at ethnicity, nativity, and income because of the small sample size, increased education almost always results in higher income.
Proportion of Population Who Are Registered Nurses
There were almost two million registered nurses in the United States in 1990, and we have described them demographically, as well as socially — that is, by income and educational attainment. Equally important, however, is the share of each group's adult workforce that registered nurses comprise. For that reason, we have calculated how many registered nurses there were per 100,000 adult members of the respective racial and ethnic work forces. This tells us a little more about the tendency to become a nurse among various racial and ethnic groups, whether native born or foreign born.
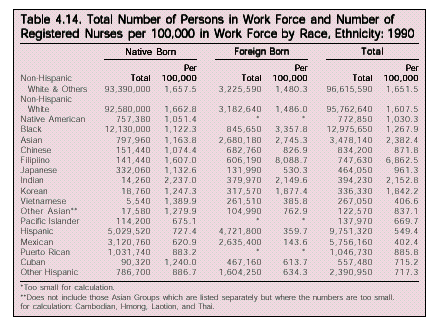
The vast numerical dominance of Asians over other racial groups among physicians was not as prevalent with registered nurses (see Table 4.14 on page 30). To be sure, Asians were more likely to be nurses than any other group, but the differences were not enormous. For example, Asians' rate per 100,000 persons in the work force was 2,382 compared to 1,608 for non-Hispanic Whites (not including Others). However, Asians were about four times as likely to be nurses as were Hispanics. The relatively high rate for Asians is overwhelmingly attributable to Filipinos. Their rate per 100,000 in the work force was a very high 6,863. Indians were the only other group to have a ratio of over 2,000 nurses per 100,000 adults in the workforce.
Among only native-born registered nurses, non-Hispanic Whites had the highest rate (1,663), followed by Asians (1,164), Blacks (1,122), and Hispanics (727). Among native-born ethnic groups, Indians were first (2,237), followed by non-Hispanic Whites.6
The picture for the foreign born was quite different. Among foreign-born racial groups, Blacks had the highest ratio of nurses per 100,000 persons in the work force (3,358), reflecting the large number of Caribbean nurses in the United States. Asians were next (2,745), followed by non-Hispanic Whites (1,486) and Hispanics (360). Looking at national origin, Filipinos were far ahead of any other group (8089), with Indians coming in at a distant second (2,150). At the other extreme, the lowest rate was among Mexican-born registered nurses (144).
Immigration Policy and the Supply of Doctors and Nurses
As noted earlier, the number of physicians and registered nurses in the United States increased rapidly between 1980 and 1990 (by 32 percent and 49 percent, respectively). U.S. immigration policy played a significant role in that growth. According to our census data, almost 23 percent of all foreign-born physicians and 30 percent of all foreign-born registered nurses who were in the United States in 1990 arrived in 1980 or later (see Tables 3.6 and 4.6). That means that 27,400 doctors and 50,000 nurses immigrated to the United States during the 1980s.
There are a number of immigration categories under which physicians and registered nurses may be admitted to the United States: They may enter as employment-based, or skilled, immigrants (i.e., those admitted specifically because of their professional skills); they may enter as family-based immigrants (i.e., those coming to join relatives already living in the United States) who just happen to be trained as doctors or nurses; or they may enter as refugees or under other miscellaneous categories that are not based on skills.
Since there tends to be less competition for employment-based visas than for family-based visas, it seems logical that most doctors and nurses would have entered as skilled workers or professionals. Immigration and Naturalization Service (INS) data, however, show that only a small share — 10 to 15 percent of physicians and 30 to 35 percent of registered nurses — were admitted as employment-based immigrants during the 1980s. The majority entered under non-skills-based immigrant categories, though INS data does not specify which categories.
In addition, beginning in 1982, graduates of foreign medical schools could become permanent immigrants under a special program created by Congress in 1981. This program set up a separate visa category for foreign medical school graduates who had been working as licensed physicians in the United States on temporary (nonimmigrant) visas since at least 1978. A total of 1,443 doctors (or just 5 percent of the total admitted in the 1980s) were granted immigrant status under this program between 1982 and 1989, by which point the pool of potential beneficiaries had dried up (only six doctors benefitted from the program between 1990 and 1996).
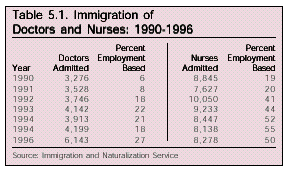
The immigration of physicians and registered nurses to the United States has not only continued but has increased since 1990. According to INS statistics, 28,947 doctors and 60,618 nurses were admitted as immigrants between 1990 and 1996 — in both cases already surpassing the total numbers admitted during the 1980s. These increases are partly the result of major immigration policy changes that took effect during the 1990s, including the Immigration Act of 1990 and the Immigration Nursing Relief Act of 1989 (INRA).
The Immigration Act of 1990 increased total immigration levels by about 35 percent and raised the cap on employment-based visas from 54,000 to 140,000 beginning in 1992. The impact of these increases is obvious in INS statistics: Not only did the total number of immigrant doctors begin to rise steadily, the proportion of both doctors and nurses who were being admitted as employment-based immigrants rose as well (see Table 5.1 on page 32).
The Immigration Act of 1990 had less impact on the number of registered nurses than on physicians primarily because the INRA, which took effect in 1990, had already created a special immigration category for nurses. Passed by Congress in response to claims of a serious shortage of registered nurses in the United States, INRA included two main provisions: It allowed foreign-born nurses who were already in the United States on temporary (nonimmigrant) visas to become permanent residents if they applied within five years of the law's passage and established a separate nonimmigrant visa category (H-1A) specifically for nurses. Under this H-1A program, health care facilities could petition for the admission of foreign-born nurses, who would be permitted to work in the United States for up to five years (six in exceptional cases), provided that the facility agreed to pay prevailing wages, ensure that working conditions for American nurses were not undercut, and take "significant steps" to recruit and retain American nurses among other requirements.
Furthermore, INRA specified that the H-1A program would sunset on September 1, 1995, since it was designed to address a short-term labor shortage. Though the program did, in fact, sunset in 1995, Congress decided in October 1996 to allow all the H-1A nurses who were still in the United States to stay until September 30, 1997. The program has not been extended since then.
What was the impact of INRA? Between 1990 and 1996, 7,823 "temporary" foreign nurses (along with their spouses and children, for a total of 12,162) were granted permanent residence under the first provision of INRA. Between 1990 and 1996, 21,170 H-1A nonimmigrant visas were issued. The 7,823 nurses who received permanent residence are included in the total number of nurses who immigrated between 1990 and 1996 (60,618), as noted above. H-1A nurses, however, are not included in that figure.
Policy changes are not the only reason for the increase in the number of physicians immigrating to the United States in the 1990s. Another factor is the exchange visitor program for medical school students administered by the United States Information Agency (USIA). The Mutual Educational and Cultural Exchange Act of 1961 first authorized the director of USIA to establish "programs intended to promote mutual understanding between the people of the United States and other countries by means of educational and cultural exchanges."7 The theory is that designated organizations sponsor aliens to come to the United States temporarily to teach, lecture, study, conduct research, or receive training, and then the aliens return to their home country to share the knowledge they gained.
Clearly, returning to the home country is an integral part of an exchange program. Thus, the law requires all foreign physicians participating in the program to return to their homeland for at least two years after completing the program. Congress also, however, provided for a waiver of the two-year requirement if it is determined that the requirement would impose exceptional hardship on the participant's spouse or children (who must be either U.S. citizens or legal permanent residents) or if a U.S. government agency (or a state, beginning in 1994) requests that the physician be allowed to remain and work in the United States.
INS statistics lump all exchange visitors in one category (J-1 visa recipients), so the number of foreign physicians participating in the program annually is not available. In 1995, however, of a total of 201,095 J-1 visas issued, just over 9,000 were for foreign physicians. But the number of visas issued is not so important if the physicians are returning home after their stay in the United States. It is the waivers, which allow them to remain here indefinitely, that add to the permanent population of physicians. In 1990, only 70 waivers were granted to foreign physicians. By 1995, the number had reached 1,300.8
The Health Care Labor Market in the 1990s and Beyond
Physicians
Our use of the calculation "physicians per 100,000 in the work force" was not intended as a measure of the supply of physicians to the public as a whole. We were simply illustrating differences by ethnicity and race in the tendency to opt for this profession as a career. The mathematical expression "physicians per 100,000 population" is a more appropriate measure of the supply. In 1990, there were 225 physicians per 100,000 population for the nation. The rate ranged from a low of 130 in Mississippi and 131 in Idaho to a high of 361 in Massachusetts and 335 in Maryland. (It was 667 in the District of Columbia.)
A number of studies have concluded that the United States already has a surplus of physicians, especially in specialty areas. The Graduate Medical Education National Advisory Committee (GMENAC) in 1981 forecast that the nation would have a surplus of physicians in the future and that the surplus would grow from 70,000 physicians in 1990 to 145,000 by 2000.9 A 1995 report by the Pew Health Professions Commission concluded that there was an oversupply of between 100,000 and 150,000 physicians.10 Similarly, the National Academy of Sciences' Institute of Medicine (IOM) in 1996 concluded that there is a growing consensus "that the United States has now, or shortly will have a surplus of physicians. For example, for the past two decades the supply of `active' physicians...has grown one and one-half times as fast as the population at large. In 1970, active physicians numbered 151 per 100,000 persons; by 1992, the figure was 245."11
Because of the many factors involved, such as the growth in managed care systems and new insurance programs, it is difficult to project with accuracy the extent of excess physicians. However, as the Institute of Medicine report concluded:
In view of the inherent weakness in any forecasting methodology, the fact that most studies of the physician workforce in the past 15 years have reached similar conclusions about the adequacy of the U.S. physician supply is perhaps surprising, but it lends credence to the basic judgement about existing and future oversupply.12
According to the medium projections from the Census Bureau, the population of the United States will be just over 288 million in 2005. This represents an increase of over 15 percent since 1990. Maintaining the 1990 ratio of 225 physicians per 100,000 population would require an increase of almost 90,000 such professionals between 1990 and 2005, at which point there would be a total of 671,124 physicians. We have calculated the rate per 100,000 for each of the four major racial groups and applied them to the projected 2005 population as broken down by race by the Census Bureau. If the race-specific rates per 100,000 remain constant over that 15-year period, the nation will have 686,000 physicians in 2005. This suggests a surplus of about 15,000 physicians by that year — over and above the 100,000 or more surplus that already exists.
None of the studies cited suggests a preferred rate of physicians per 100,000 population, except to state that it is presently too high. According to the American Medical Association, by 1994, there were 263 physicians per 100,000 population, and the rate was still rising.13 Based on the various studies' suggested overage of about 20 percent, it seems reasonable to assume that 200 physicians per 100,000 population would be adequate for the foreseeable future.
Let us assume, hypothetically, that all native-born racial groups exhibited the same rate of physicians per 100,000 in the work force as did non-Hispanic Whites and that no foreign-born residents were physicians. How many physicians would have been produced under such hypothetical circumstances? If we apply the non-Hispanic White rate (461.9) to all groups, we arrive at a total of about 514,000 physicians in 1990, or a ratio of about 205 per 100,000 population.
These hypothetical data suggest that the recommendations of the committee from the Institute of Medicine can be met in future years — that is, drastically reduce or eliminate the number of visas, permanent and temporary (unless those granted temporary visas are actually required to return home), allocated to foreign-born physicians, medical students and residents — and still meet the health care requirements of the American people if we prioritize the need to recruit and train American minorities in the appropriate medical fields.
The Institute of Medicine report makes it abundantly clear that the high proportion of foreign-born physicians is a matter of concern: "This [oversupply] results largely from the growth in the numbers of IMGs (international medical graduates), most of whom are not U.S.-born and most of whom remain in the United States to practice after completing their residency training."14 It cites one study that found that in 1992, about 23 percent of physicians in the nation were graduates of foreign medical schools.15 Concern was also expressed about the large proportion of foreign-trained residents in the nation's hospitals. While the number of U.S. medical graduates has remained stable since the early 1980s, between 1988 and 1993, the number of foreign-trained residents has increased 80 percent — from 12,433 to 22,706. Furthermore, some 75 percent of those IMGs who come to the United States for training will remain in this country to practice.16
Based on these findings, the Institute of Medicine recognized that some brake on the ability of foreign-trained physicians to practice in this country was a critical element in dealing with looming oversupply issues. It recommended that:
In particular, the INS could be called on to develop options for limiting entry of physicians, or prospective physicians, into the United States...The INS could more vigorously enforce the "return home" provisions of exchange visas, which would decrease the IMGs going into practice in this country, while not reducing the numbers who receive the benefits of U.S. graduate medical training and who provide needed services while doing so.17
In conclusion, the report advised that:
No new schools of allopathic or osteopathic medicine be opened, that class sizes in existing schools not be increased, and that public funds not be made available to open new schools or expand class size. Maintaining, but not increasing, the current number of medical graduates, especially if more minorities are brought into the student bodies, was judged to be the most appealing short-run strategy for undergraduate medical education.18
On the other hand, it should be noted that some hospitals rely heavily on foreign-trained physicians; for example, "foreign-trained physicians make up 80 percent of the [Univerisity of Illinois and Chicago Hospital's] pediatric residents — a low-profile field that many American-born residents have disdained for more glamorous specialties such as radiology or neurosurgery."19 However, according to Dr. Jordan Cohen, President of the Association of American Medical Colleges, it is a myth that foreign medical school graduates are more willing than graduates of U.S. schools to practice in underserved rural areas:
Graduates of foreign medical schools are not more likely than graduates of U.S. schools to settle in underserved rural areas.... The fact is that a higher proportion of U.S. graduates than foreign graduates end up in permanent practice in rural America.
Americans can be thankful that so many foreign-born (though often American-trained) physicians have opted for some of these lower-profile specialties. However, in light of the current oversupply of physicians, the United States must develop incentives for native-born medical students to choose these specialties and to serve the poor in both rural and inner-city hospitals, rather than continuing our reliance on an increasing supply of foreign-born physicians.
Registered Nurses
As with physicians, the calculation of "registered nurses per 100,000 in the work force" was not intended as a measure of the supply of nurses. "Registered nurses per 100,000 population" is the more appropriate measure. In 1990, there were 690 active registered nurses per 100,000 people in the United States.20 By 1992, that number had risen to 726 per 100,000 and was increasing steadily.
The nursing profession has undergone significant changes since the late 1980s, particularly with the growth in managed care systems. Registered nurses are being replaced with lower-paid licensed practical nurses and nursing aides, while those with advanced degrees have been elevated to nurse practitioners. According to Beverly Bradshaw, a human-resources director at Baylor University Medical Center in Dallas, hospitals no longer offer registered nurses sign-on bonuses or extra pay for weekend work, and annual raises have fallen to 3 percent from a high of 12 percent in the late 1980s.21
There is no question that the labor shortage that prompted the passage of the Immigration Nursing Relief Act in 1989 is over. In fact, as The New York Times reported:
In the name of greater efficiency, most hospitals today are seeking to reduce, or "consolidate," their nursing staffs. Some are offering buyouts and early retirement plans. Many, most notably public hospitals, have exhausted those avenues and have turned to layoffs."22
Given the shifts now taking place in the medical profession, particularly insofar as service delivery is concerned, it is difficult to ascertain the number of registered nurses that will be required in future years. For example, the Institute of Medicine concluded:
Rapid changes in the health care delivery system and the resultant unstable situation fuel the concern among the nursing community that large decreases in RN staffing in hospitals are both occurring and leading to decrements in patient care and to threats to the health and well-being of nursing personnel. The committee finds that lack of reliable data on the magnitude and distribution of temporary or permanent unemployment, reassignments of existing nursing staff, and similar changes in the structure of nursing employment opportunities greatly hampers efforts at understanding the problem and planning for the future.23
Overall, the health care industry is expected to be the fastest growing segment of the economy over the next decade or so. However, a majority of the new jobs are likely to go to home health workers and nurses' aides. In light of these considerations and the ratio of registered nurses to population in the early 1990s, we will assume that a ratio of 700 nurses per 100,000 population will suffice for the near future.
Again, we base our calculations on the Census Bureau's projected 15 percent increase in the U.S. population between 1990 and 2005. If the number of registered nurses grows at the same rate, it will reach almost 2.2 million, or an increase of about 300,000 registered nurses, over that 15-year period. Is such growth realistic, or is it too high or too low?
If the 1990 race-specific rates of registered nurses per 100,000 in the workforce remain constant to 2005, the total number of registered nurses in the population will surpass 2.6 million. That translates into 900 registered nurses per 100,000 population — far more than today and, we suspect, far more than is needed. The reason for this dramatic growth lies in the shifts in the nation's population, even in such a brief period. For example, the Asian population is projected to almost double between 1990 and 2005. Since the Asian rate of nurses per 100,000 in the workforce is far and away the highest of all groups, the number of registered nurses likely will grow accordingly.
Following our example for physicians, let us go back to 1990 and assume that all native-born groups had the same rate of registered nurses per 100,000 in the workforce as did non-Hispanic Whites. Furthermore, let us assume that immigrants did not enter the nursing profession. The total number of registered nurses in 1990 would have been about 1.85 million — almost 50,000 fewer than the actual count in that year. Admittedly, this is all hypothetical. However, it illustrates quite vividly that there is little, if any, need for continued immigration of foreign-born registered nurses. This is not to deny the tremendous contributions of such nurses to the medical profession, but an oversupply of labor hurts all registered nurses, native born and foreign born alike, and it provides a disincentive for native-born minorities who may otherwise choose to become nurses.
Options for the Future
The medical profession in the United States is going through massive changes as the next century approaches. We have examined the growth in the number and share of women physicians and male nurses, and in the number and share of foreign-born physicians and registered nurses, especially those coming from Asia. We have also noted the variations in median income among physicians and registered nurses, with the foreign born earning more than their native-born counterparts, with only minor exceptions.
However, the profession is also undergoing numerous other historical changes, particularly as more and more people shift to managed care programs such as HMOs. Increasingly, what traditionally were physician duties are being shifted to physician assistants and certified registered nurses. In recent decades, several new medical schools opened as the nation feared a potential physician shortage. As we have noted, this shortage never occurred — in fact, the opposite took place, and by the mid-1990s, the nation had an overabundance of physicians. In 1994, there were an estimated 264 physicians per 100,000 population.24 However, the oversupply does not apply to all specialties. There remains a shortage of family physicians, for example, as more and more new residents opt for the higher-paying specialties, such as surgery. Furthermore, some geographic areas of the country remain understaffed, since physicians are not distributed proportionally across the 50 states.
Among nurses, many typical registered nurse assignments are being relegated to lower paid licensed practical nurses and nurses' aides, who have less training than RNs. According to the Institute of Medicine:
[A]lmost all hospitals in the United States use some kind of ancillary nursing personnel. In recent years the position of the nurse assistant has been changing. In some institutions they are assuming, under an RN's direction, increasing responsibility for more direct care activities than in the past. This results in rising levels of management and supervisory skills being required of RNs.25
Recommendations
With ample evidence of an oversupply of both physicians and registered nurses, the next question that must be asked is, What are our options for addressing the oversupply?
1) Should we try to reduce the number of Americans who choose to become doc- tors or nurses?
2) Should we reduce the number of foreign nationals admitted to U.S. medical schools and/or residency programs?
3) Should we eliminate the special immigration categories for foreign-born doctors and nurses?
4) Should we reduce overall immigration levels?
To answer these questions, let us first look at the recommendations included in some of the studies cited in Chapter 6. Although these studies focus exclusively on physicians, many of the recommendations may apply to registered nurses, as well.
The Pew Health Professions Commission: The Pew Commission in November 1995 found a surplus of between 100,000 and 150,000 physicians in the United States. It recommended:
- Reducing the number of residency positions for graduates of foreign medical schools;
- Eliminating waivers that allow foreign physicians participating in USIA's exchange program to remain in the United States to practice and strictly enforcing the requirement that such physicians leave the country when their training is finished; and
- Cutting the number of U.S. medical school graduates by 20 percent both by reducing class sizes and closing some U.S. medical schools.
The National Academy of Sciences' Institute of Medicine: The Institute of Medicine's 1996 report, "The Nation's Physician Workforce: Options for Balancing Supply and Requirements," recommended a number of policy changes to address the oversupply of physicians, including:
- Freezing the number of medical schools in United States and size their classes;
- Eliminating federal programs that subsidize medical residency programs for foreign medical school graduates;
- Establishing a program to provide federal aid to hospitals serving poor and inner-city communities that currently rely on foreign medical graduates so they can replace those doctors with U.S.-trained doctors;
- Eliminating, or reducing substantially, visa categories that allow foreign medical graduates to come to the United States to practice; and
- Strictly enforcing the requirement that foreign physicians participating in USIA's exchange program return to their home country when their training is finished, and eliminating waivers of that requirement.
Professional Associations: On February 28, 1997, a group of prominent national medical associations released a "Consensus Statement on the Physician Workforce." Signatories of the statement included the American Association of Colleges of Osteopathic Medicine, American Medical Association, American Osteopathic Association, Association of Academic Health Centers, Association of American Medical Colleges, and the National Medical Association. These groups agreed that "the United States is on the verge of a serious oversupply of physicians" and recommended:
- Reducing federal government funding of graduate medical education so that the number of funded positions more closely aligns with the number of graduates of U.S. medical schools (i.e., reduce funding for foreign medical school graduates);
- Eliminating waivers that allow foreign physicians in USIA's exchange program to remain in the United States to practice;
- Encouraging medical schools to recruit more minority students, since "historically, minority physicians have been more likely than non-minority physicians to establish practices in [underserved] communities with minority populations;"
- Providing, through the federal government, financial incentives for U.S. medical school graduates to establish practices in underserved areas; and
- Establishing a national physician workforce advisory body to monitor the adequacy of the size and specialty composition of the physician workforce.
Turning back now to the questions posed at the beginning of this section, it is clear that only the Pew Health Professions Commission answered the first question in the affirmative. Its recommendation to reduce the number of U.S. medical school graduates by 20 percent would, in effect, reduce the number of Americans who can become doctors.
All three reports answered the second question affirmatively. This is perhaps the least controversial way to limit the increase in the number of physicians in the United States. There is no reason for U.S. taxpayers to subsidize the training of foreign medical school graduates, particularly if they will be allowed to remain in the United States to practice, thus adding to the current oversupply.
The reports' answer to the third question is less clear. All three recommended eliminating the waivers that allow foreign exchange physicians to remain in the United States to practice and more strictly enforcing the requirement that such physicians return to their own countries after their training is completed. Only the Institute of Medicine, however, recommended eliminating or reducing the special visa categories that allow foreign medical graduates to come to the United States to practice, but it did not specify which categories it meant. The only program that exclusively benefits foreign medical graduates is the one established by Congress in 1981 that gave immigrant status to such graduates who had been practicing in the United States since 1978. But this program benefitted only six doctors between 1990 and 1996.
With one exception, the studies all carefully avoided answering the fourth question. The exception was the Institute of Medicine, which decided that recommending any major changes in overall immigration policy might "send an unfortunate, potentially xenophobic message to the rest of the world."
Conclusion
Now that we have take an in-depth look at how foreign-born doctors and nurses impact these professions, the numbers involved, and the conclusions of several well-respected studies, we can answer the four questions posed in the first chapter:
Is the current supply of doctors and nurses adequate?
Yes. In fact, there is ample evidence that there are too many of these professionals, a surplus made worse by the continuous stream of foreign doctors and nurses entering the United States United States.
Is future demand for these professionals likely to outpace supply?
No. If schools continue to produce doctors and nurses at current levels, the current over supply will get even worse. Allowing foreign doctors and nurses to practice in the United States will only compound the problem.
Are the immigration policies that allow foreign-born doctors and nurses to practice in the United States responsive to the labor market?
No. As discussed above, it is clear that the United States has more doctors that it needs currently or will need in the future, yet there have been no reductions in the number of foreign-born health professionals allowed to immigrate. Allowing continued immigration of foreign-born health professionals while at the same time reducing the opportunities for the native-born, particularly minorities, to enter the profession is clearly not in the best interest of the United States.
Does the continuous flow of doctors and nurses into the United States serve the interests of the United States and the countries from which they hail?
No. According to the American Nurses Association, there are more than adequate numbers of nurses in the United States currently and they predict that this will continue. Also, the countries sending most nurses to the United States (particularly England and Ireland) are experiencing shortages of qualified health professionals.
It is clear that current immigration policies for foreign-born doctors and nurses are not in the best interest of the United States. While the immigration-induced wage reductions that so profoundly affect less well paid professions are perhaps not as pressing for doctors and nurses, we cannot ignore the impact mass immigration has on the health care systems in sending countries. The INS would do well to take a closer look at these programs and make changes to reflect the fact that there are more than enough native-born doctors and nurses without encouraging immigrants to further swell the ranks of these professions.
End Notes
1 Leon F. Bouvier and David Simcox, Foreign-Born Professionals in the United States, Center for Immigration Studies, 1994.
2 The Census Bureau does not distinguish among non-Hispanic-White ethnic groups, nor does it publish data on separate Black groups. However, it does separate the Hispanic and Asian groups and this provides the basis for our analysis.
3 The American Almanac, Statistical Abstract of the United States: 1995-1996, Austin, Texas: Hoover's, 1996, Table 180.
4 While not exactly comparable, and based on a 50 percent reply to a survey of nurses, the American Hospital Association found that, in 1992, 39.4 percent had associate degrees, 27.7 percent had nursing diplomas, 31.0 percent had bachelor's degrees, and 2.0 percent had master's degrees (or higher) in Nursing. American Almanac 1995-1996, Table 181, p. 124.
5 American Almanac 1995-1996, Table 181, p. 124.
6 Recall that when looking solely at race, non-Hispanic Whites are combined with Others; when looking at ethnic groups, these are separated. Both are listed in Table 4.14.
7 United States General Accounting Office, Foreign Physicians, Washington, D.C., December 1996, p. 40.
8 Ibid, p. 2.
9 GMENAC, "Summary Report to the Secretary, Dept. Of Health and Human Services," Washington: Health Resources Administration, April, 1981.
10 Pew Health Professions Commission, Shifting the supply of our health care workforce, October 1995, p. 1.
11 Institute of Medicine, The Nation's Physician Work Force, Washington: National Academy Press, 1996, 17-18.
12 Ibid., p. 34.
13 American Medical Association, Physician Characteristics and Distribution in the United States: 1995-96, p. 34.
14 Institute of Medicine, The Nation's Physician Work Force, p. 17.
15 Mullan, F. "The National Health Service Corps: Service Conditional Medical Examination in the United States," in Social and Community Service in Medical Training and Professional Practice. Josiah Macy Foundation, 1995. (It should be pointed out that only 19,000 of the 139,086 physicians trained overseas were native U.S. citizens. The remainder were foreign born.)
16 Ibid.
17 Institute of Medicine, The Nation's Physician Work Force, 86-87.
18 Ibid., p. 6.
19 Stephen Franklin, "Foreign doctors fear welcome mat will end; changing climate in U.S. medicine may close doors." Chicago Tribune, June 23, 1996.
20 The race-specific rates (irrespective of place of birth) per 100,000 were 839.4 for non-Hispanic Whites and Others; 562.0 for Blacks; 1185.8 for Asians; 239.7 for Hispanics.
21 "Work Week," The Wall Street Journal, February 20, 1995.
22 "Once in Big Demand, Nurses Are Targets for Hospital Cuts," The New York Times, Augu
st 19, 1996.
23 Institute of Medicine, Nursing Staff in Hospitals and Nursing Homes, Is It Adequate?, National Academy Press, Washington D.C., 1996.
24 American Medical Association, op.cit., Table A-16, p. 34.
25 Institute of Medicine, Nursing Staff in Hospitals and Nursing Homes, Is It Adequate?, Washington, D.C.: National Academy Press, 1996.
