Why have soaring numbers of Central American families been traveling to the U.S. border in recent years? According to the narrative presented by high-immigration activists who want looser and looser asylum standards, these migrants are fleeing deteriorating conditions in their home countries. One of the most commonly cited examples of these conditions is the claim that migrants are fleeing for their physical safety from gang violence. I debunked that last month by demonstrating that there is no statistical relationship between homicide rates in Central America and illegal border crossings.
Now, activists have begun trotting out a new argument in favor of open borders: Central American migrants are fleeing climate change. A recent article in The Guardian said that people are leaving Honduras, El Salvador, and Guatemala because those nations have been "deeply affected by environmental degradation" that has damaged soil quality and crops. Another article this month, from The New Yorker, said climate change is "fueling" the border crisis because "farmers are abandoning their lands" due to weak crops.
Crop yields, however, tell a different story. I analyzed annual yield data from the United Nations Food and Agriculture Organization and looked at how the production of the top crops in each Northern Triangle country has changed since 2000.
In all three countries, major crop production has risen in recent years. If climate change were truly adversely affecting farmers, one would expect that crop production would already be down — or at least stagnant.
El Salvador
El Salvador's most valuable agricultural exports include corn (maize), beans, sorghum, coffee, and sugarcane.
Production of corn, beans, and sugarcane have all risen since 2000. For example, in 2000 El Salvador produced 5.14 million metric tons of sugarcane. By 2010, that figure was relatively unchanged, but it soared in the past decade — reaching 7.16 million metric tons by 2017. The eastern region surrounding the Bay of Jiquilisco in particular has seen an explosion in production, despite highly opaque central planning and minimal supply chain coordination. Beans experienced similar gains, reaching over 100,000 annual metric tons of production as some coffee farmers have turned to beans, which are more profitable.
Coffee, rice, and sorghum production has declined, however. Coffee production in particular dropped sharply in the past seven years, partially due to increased competition from other coffee exporters and partially due to political volatility associated with the coffee industry in El Salvador, whereas sorghum declines have been more slow and steady. Rice has always been a smaller product for El Salvador, and although it declined in the early 2000s, rice production has been relatively steady since 2011.
Figure 1. Pct. Change, Top Crop Production in El Salvador, 2000-2017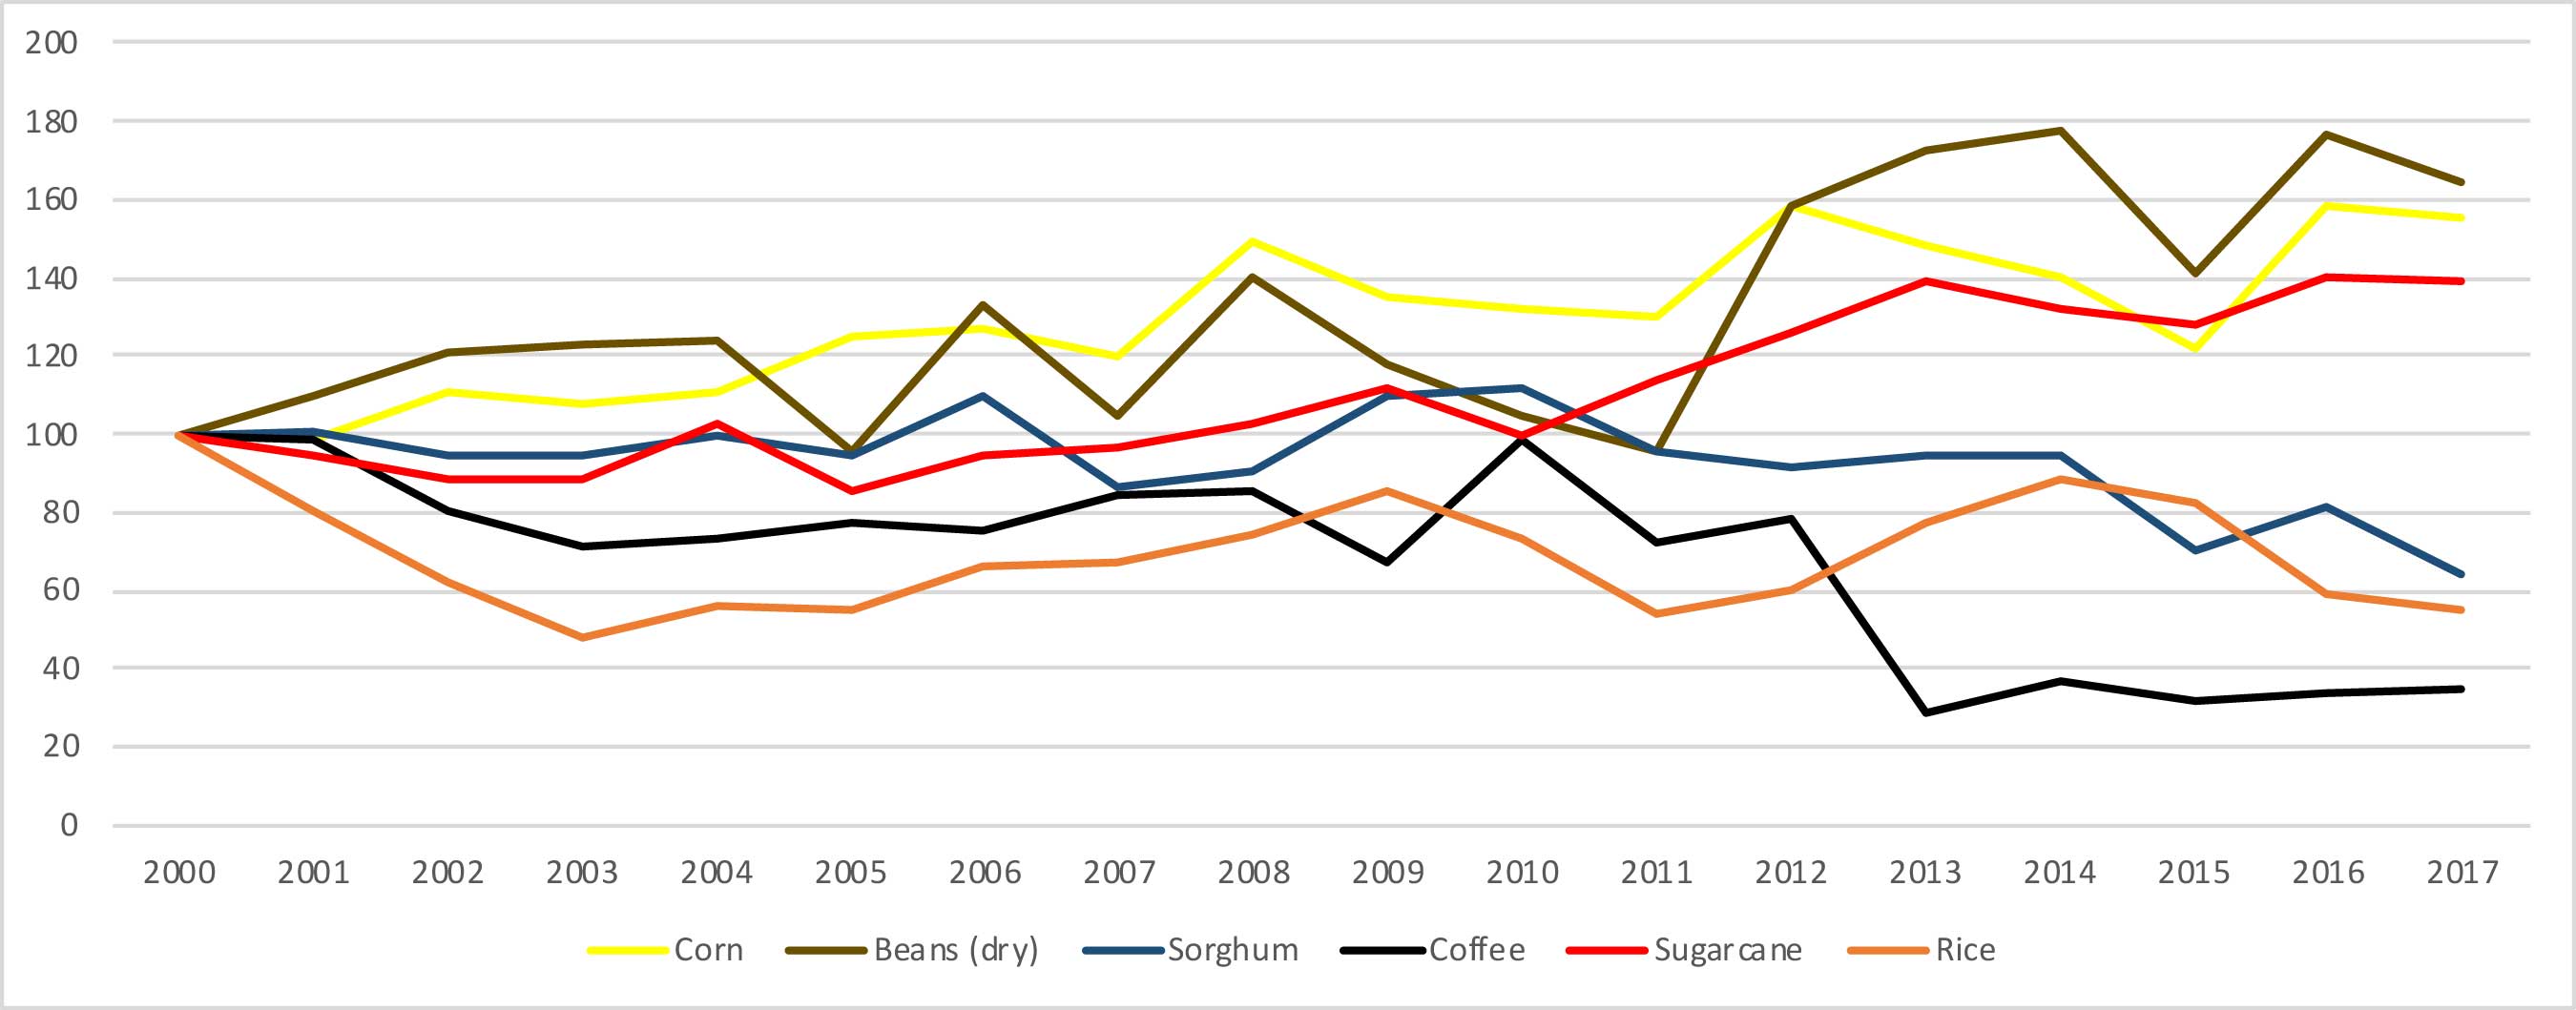
Source: United Nations Food and Agricultural Organization, FAO Statbook. |
Table 1. El Salvador Production (metric tons) |
||||||
| Year | Corn | Beans (Dry) | Sorghum | Coffee | Sugarcane | Rice |
| 2000 | 582,676 | 68,163 | 148,942 | 114,087 | 5,140,322 | 47,204 |
| 2001 | 571,471 | 74,934 | 150,529 | 112,201 | 4,877,241 | 37,720 |
| 2002 | 644,363 | 82,648 | 140,763 | 91,513 | 4,528,167 | 29,098 |
| 2003 | 627,980 | 83,484 | 140,963 | 81,157 | 4,531,531 | 22,515 |
| 2004 | 648,045 | 84,300 | 147,631 | 83,088 | 5,280,400 | 26,519 |
| 2005 | 727,607 | 65,110 | 141,384 | 87,963 | 4,404,850 | 25,984 |
| 2006 | 742,067 | 90,742 | 164,007 | 85,350 | 4,878,039 | 31,011 |
| 2007 | 699,416 | 71,181 | 129,120 | 96,355 | 4,956,477 | 31,540 |
| 2008 | 868,259 | 95,255 | 134,230 | 97,727 | 5,249,939 | 35,218 |
| 2009 | 785,965 | 80,110 | 163,698 | 76,591 | 5,736,063 | 40,188 |
| 2010 | 768,113 | 71,294 | 166,009 | 112,636 | 5,126,693 | 34,479 |
| 2011 | 756,352 | 64,835 | 141,997 | 82,095 | 5,832,008 | 25,589 |
| 2012 | 925,839 | 107,811 | 136,575 | 89,489 | 6,487,423 | 28,325 |
| 2013 | 866,701 | 117,807 | 140,770 | 32,864 | 7,162,995 | 36,254 |
| 2014 | 819,311 | 120,795 | 140,808 | 41,965 | 6,782,795 | 41,838 |
| 2015 | 710,444 | 96,291 | 105,245 | 35,682 | 6,578,486 | 38,782 |
| 2016 | 923,472 | 120,649 | 121,873 | 38,636 | 7,202,141 | 27,617 |
| 2017 | 904,000 | 111,948 | 96,000 | 39,460 | 7,155,699 | 26,000 |
|
Source: United Nations Food and Agricultural Organization, FAO Statbook. |
||||||
Guatemala
Guatemala has seen more consistent production growth among its top crops, such as coffee, bananas, palm oil, sugar, corn, rice, and beans.
Of those crops, only coffee and rice declined, and the coffee declines were very slight, with production relatively unchanged in the past decade, due to increased global competition. Rice fell sharply in the early 2000s, but production has steadily climbed back since, reaching nearly pre-2000 levels of 33,000 metric tons.
The other major crops all saw very consistent, steady production growth since 2000. Production of palm oil in particular has been a bright spot, tripling between 2000 and 2010, and then doubling between 2010 and 2017 to over two million metric tons annually today. Palm oil has various uses for food processing and has experienced a sharp rise in global demand. While the majority is still farmed in Asia, production has become increasingly global, to the benefit of Latin American countries, including Guatemala.
Likewise, Guatemala's banana exports have risen by over 1.5 million metric tons in the latest decades, reaching a record high 3.89 million metric tons in 2017. While Guatemalan banana production still lags Brazil and Ecuador, the fruit plays a key role in Guatemala's economy, accounting for 13 percent of all exports (and rising).
Figure 2. Pct. Change, Top Crop Production in Guatemala, 2000-2017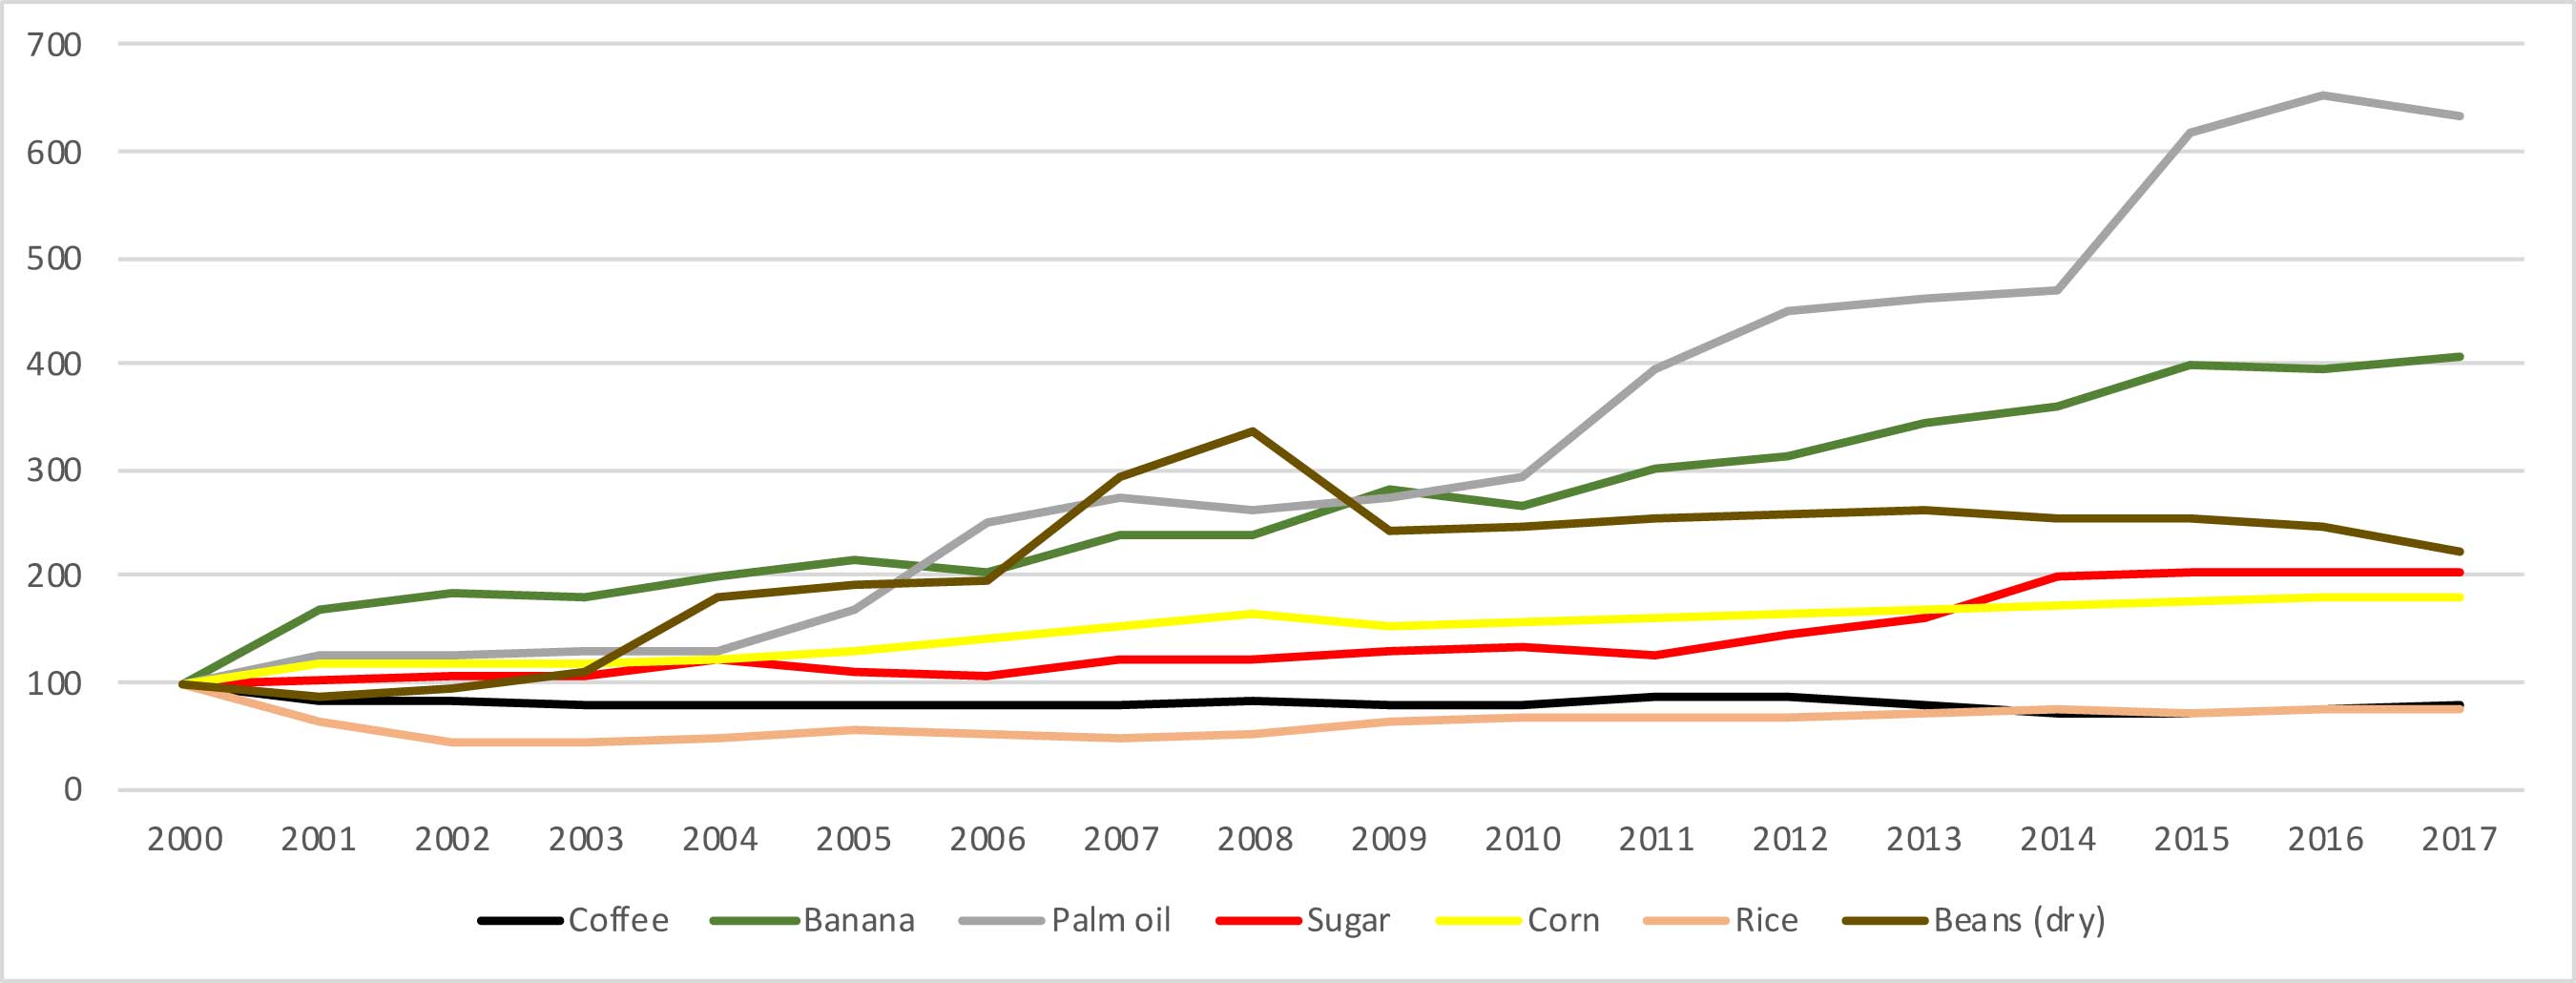
Source: United Nations Food and Agricultural Organization, FAO Statbook. |
Table 2. Guatemala Production (metric tons) |
|||||||
| Year | Coffee | Bananas | Palm Oil | Sugar | Corn | Rice | Beans (Dry) |
| 2000 | 312,060 | 955,000 | 320,000 | 16,552,400 | 1,053,550 | 45,223 | 40,600 |
| 2001 | 261,097 | 1,602,306 | 400,000 | 16,934,900 | 1,224,268 | 28,939 | 34,665 |
| 2002 | 255,091 | 1,762,537 | 400,000 | 17,489,900 | 1,241,723 | 19,219 | 38,230 |
| 2003 | 244,200 | 1,719,165 | 420,000 | 17,400,000 | 1,260,452 | 19,754 | 45,428 |
| 2004 | 250,279 | 1,894,918 | 420,000 | 20,000,000 | 1,280,668 | 22,004 | 72,685 |
| 2005 | 248,277 | 2,057,604 | 540,000 | 18,007,620 | 1,375,986 | 24,952 | 78,556 |
| 2006 | 240,331 | 1,945,049 | 800,000 | 17,631,588 | 1,489,606 | 22,407 | 79,814 |
| 2007 | 248,614 | 2,292,460 | 880,000 | 20,312,464 | 1,598,432 | 21,682 | 118,812 |
| 2008 | 254,914 | 2,297,704 | 840,000 | 20,311,940 | 1,721,610 | 23,972 | 136,285 |
| 2009 | 247,503 | 2,678,159 | 880,000 | 21,525,684 | 1,625,811 | 28,703 | 97,845 |
| 2010 | 248,355 | 2,560,574 | 940,000 | 22,313,828 | 1,638,249 | 29,624 | 100,990 |
| 2011 | 265,401 | 2,880,466 | 1,260,000 | 20,586,052 | 1,675,235 | 30,404 | 103,926 |
| 2012 | 272,432 | 2,978,324 | 1,440,000 | 24,289,900 | 1,723,465 | 31,135 | 104,625 |
| 2013 | 248,668 | 3,307,038 | 1,480,000 | 26,913,622 | 1,795,160 | 32,246 | 107,211 |
| 2014 | 227,653 | 3,424,926 | 1,500,000 | 33,239,196 | 1,815,281 | 33,616 | 103,716 |
| 2015 | 225,653 | 3,796,115 | 1,973,305 | 33,869,277 | 1,853,900 | 32,826 | 103,716 |
| 2016 | 236,145 | 3,775,150 | 2,085,098 | 33,533,403 | 1,899,318 | 33,747 | 100,152 |
| 2017 | 245,441 | 3,887,439 | 2,031,743 | 33,758,389 | 1,917,395 | 33,000 | 90,128 |
|
Source: United Nations Food and Agricultural Organization, FAO Statbook. |
|||||||
Honduras
Like Guatemala, Honduras is a major producer of coffee, bananas, and palm oil, although it also produces large numbers of melons and coconuts, and has a growing number of rice paddies.
Honduran coconut production declined in the early 2000s (from approximately 21,000 to 16,000 metric tons between 2000 and 2005) and has leveled off since, but other agricultural products have been more successful. Honduran coconuts, like in the Caribbean, have suffered from a range of diseases such as lethal yellowing, which have taken their toll on production.
Also like in Guatemala, Honduran palm oil has exploded in popularity, with production quadrupling since 2000 on rising global demand and geographical production shifts.
Very little rice was produced in Honduras in 2000 (about 7,000 metric tons), but by 2017 that number had soared to 59,000 metric tons, driven primarily by small farmers. While still a relatively small part of Honduras' total crop yield, the growth in production has been impressive nonetheless.
Honduras' other major success story has been the rise in melon production. In 2010, Honduras produced 207,000 metric tons of melons, a figure that reached 320,000 in 2017. The majority of those melons are exported to the United States and Europe where demand has been robust.
Figure 3. Pct. Change, Top Crop Production in Honduras, 2000-2017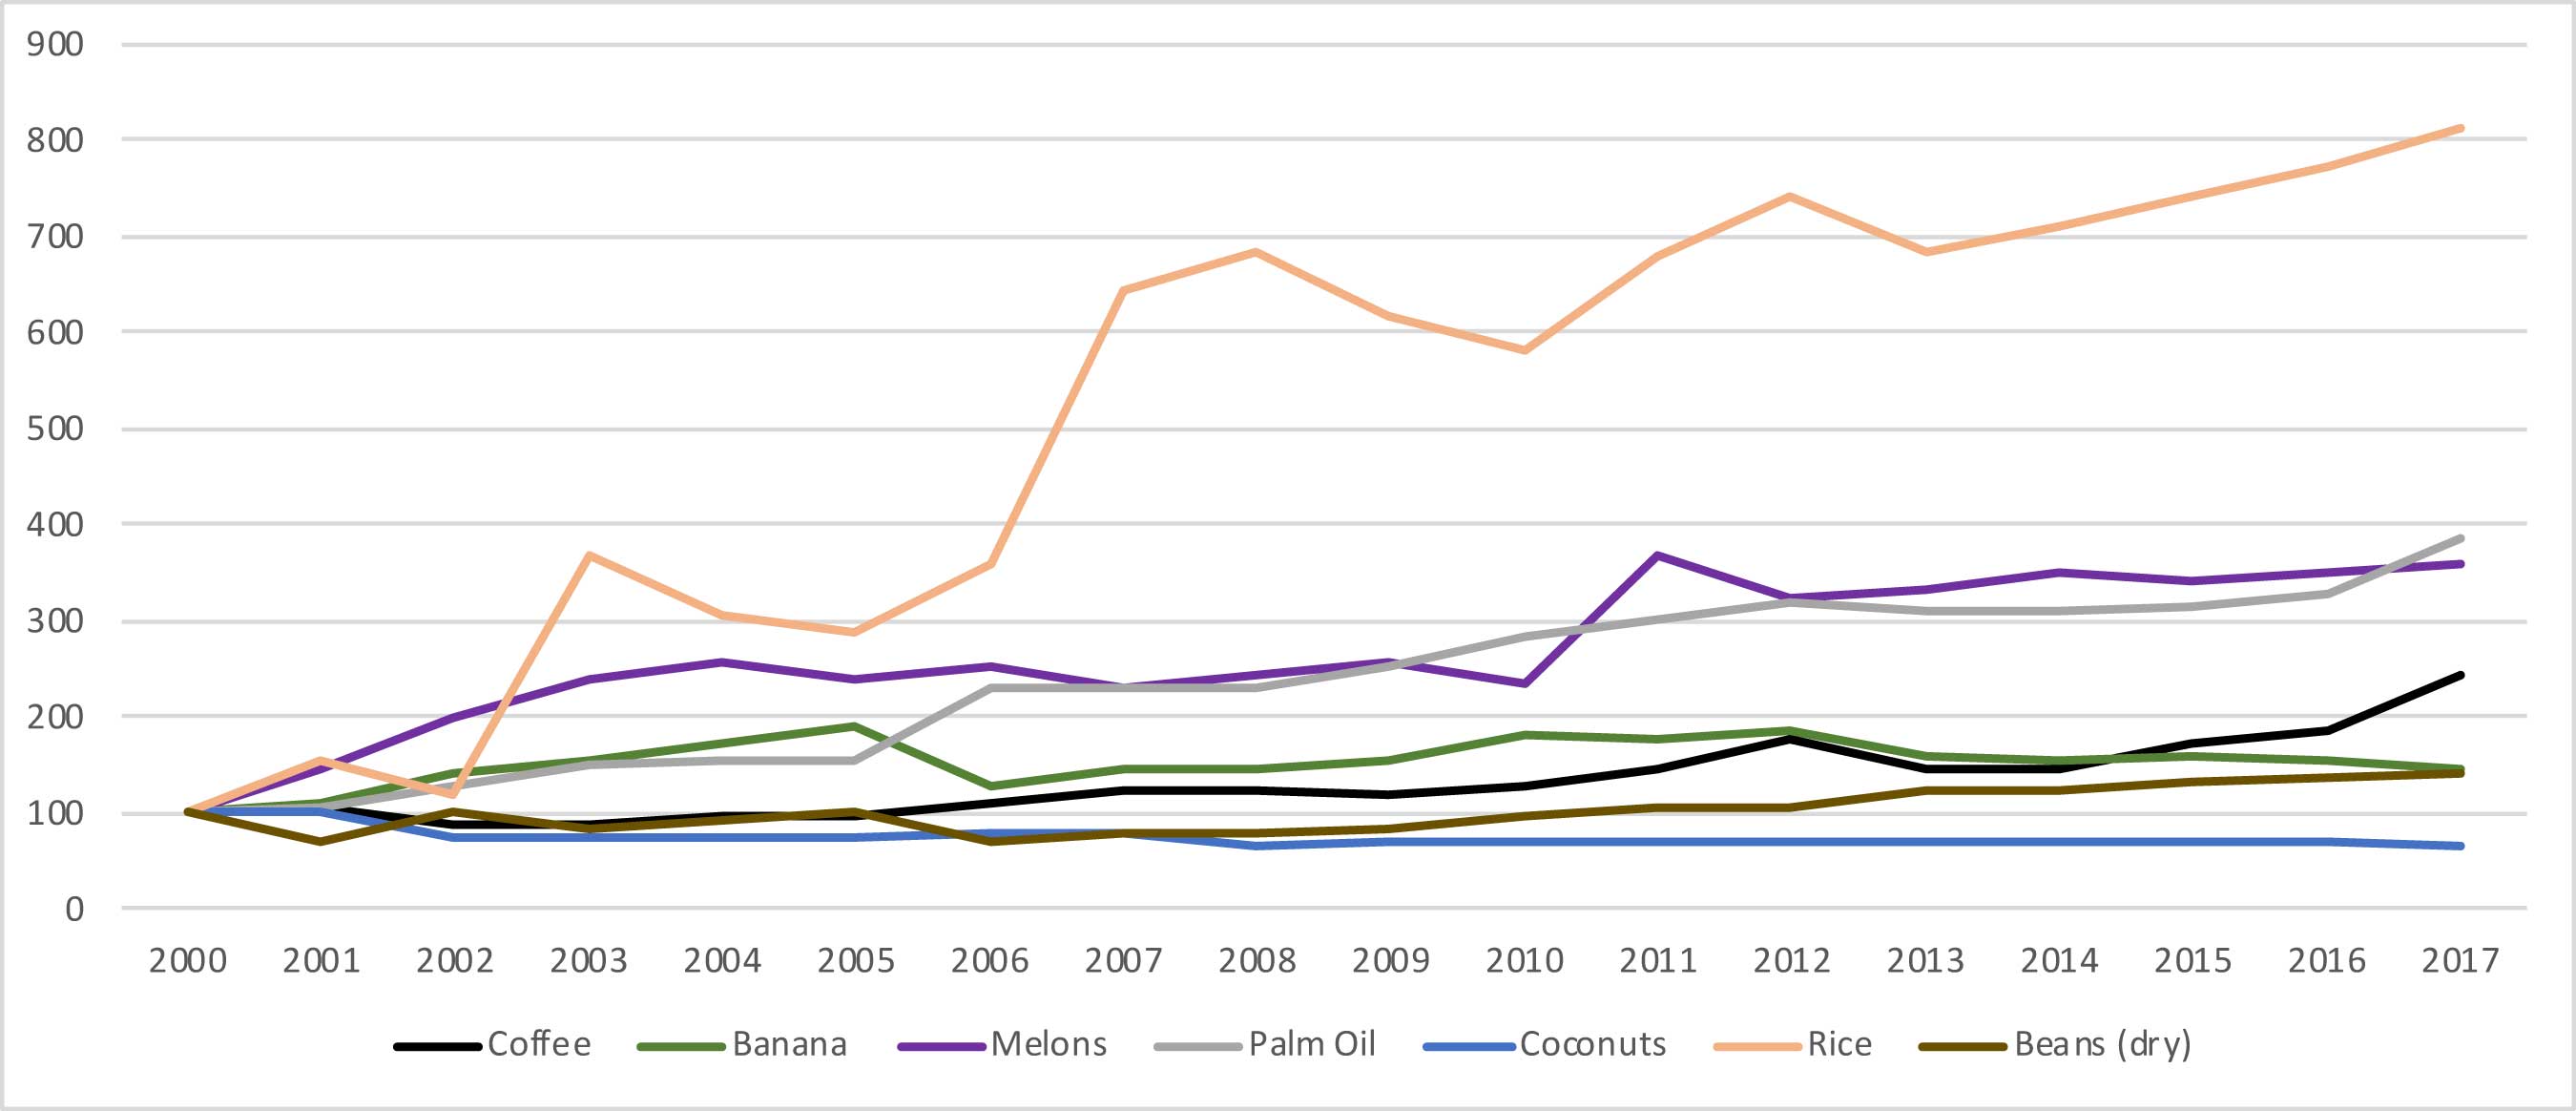
Source: United Nations Food and Agricultural Organization, FAO Statbook. |
Table 3. Honduras Production (metric tons) |
|||||||
| Year | Coffee | Bananas | Melons | Palm Oil | Coconuts | Rice | Beans (Dry) |
| 2000 | 193,309 | 469,000 | 88,717 | 618,600 | 20,739 | 7,262 | 84,980 |
| 2001 | 205,545 | 515,844 | 129,000 | 668,794 | 20,950 | 11,172 | 59,229 |
| 2002 | 172,727 | 659,324 | 178,000 | 797,410 | 16,047 | 8,781 | 87,919 |
| 2003 | 175,284 | 735,174 | 214,000 | 929,752 | 16,027 | 26,736 | 69,950 |
| 2004 | 185,090 | 811,232 | 228,000 | 951,142 | 16,006 | 22,409 | 78,750 |
| 2005 | 190,640 | 887,072 | 213,000 | 972,394 | 15,986 | 21,077 | 86,406 |
| 2006 | 213,636 | 612,511 | 223,000 | 1,420,414 | 16,500 | 25,973 | 60,731 |
| 2007 | 236,302 | 690,479 | 204,622 | 1,427,552 | 16,500 | 46,661 | 68,315 |
| 2008 | 240,948 | 690,503 | 216,899 | 1,432,287 | 13,900 | 49,544 | 66,996 |
| 2009 | 231,288 | 718,597 | 229,912 | 1,578,952 | 14,500 | 44,883 | 70,633 |
| 2010 | 244,335 | 856,270 | 206,799 | 1,768,216 | 14,760 | 42,186 | 83,577 |
| 2011 | 284,347 | 830,322 | 326,563 | 1,866,912 | 14,800 | 49,224 | 88,681 |
| 2012 | 343,403 | 879,522 | 288,272 | 1,988,723 | 14,830 | 53,755 | 91,195 |
| 2013 | 280,697 | 745,717 | 296,553 | 1,929,412 | 14,836 | 49,643 | 103,841 |
| 2014 | 282,071 | 730,788 | 309,793 | 1,927,757 | 14,580 | 51,574 | 105,807 |
| 2015 | 331,157 | 745,736 | 303,850 | 1,947,200 | 14,398 | 53,797 | 111,404 |
| 2016 | 362,366 | 718,478 | 312,669 | 2,045,700 | 14,272 | 56,160 | 116,707 |
| 2017 | 475,042 | 686,765 | 320,456 | 2,403,300 | 14,019 | 58,912 | 121,959 |
|
Source: United Nations Food and Agricultural Organization, FAO Statbook. |
|||||||
Conclusion
In all three Northern Triangle countries, the majority of the top agricultural products have seen production growth in recent years — in some cases tripling or quadrupling in size. Given the successful crop yields in Latin America, it is hard to imagine that climate change is a major factor driving migration flows. Even with regard to areas with declining production, such as coconuts in Honduras or Coffee in El Salvador, the primary explanatory factors appear to have little to do with climate change.
A much better explanation for the migration surge is not push factors but pull factors — namely our own asylum loopholes such as the Flores Settlement that encourage Latin American families to make the dangerous trek to our southern border where they can then make bogus asylum claims and be allowed entry into the country with minimal chance of removal. Put simply, Central American migrants are by-and-large not coming to America because of life-threatening climate catastrophes. Rather, they're showing up because they know we'll let them stay.