Executive Summary
For several years stories in the media have reported a farm labor shortage. This study examines this question and finds little evidence to support this conclusion. First, fruit and vegetable production is actually rising. Second,
wages for farm workers have not risen dramatically. Third, household expenditure on fresh fruits and vegetables has remain relatively constant, averaging about $1 a day for the past decade.
Among the findings:
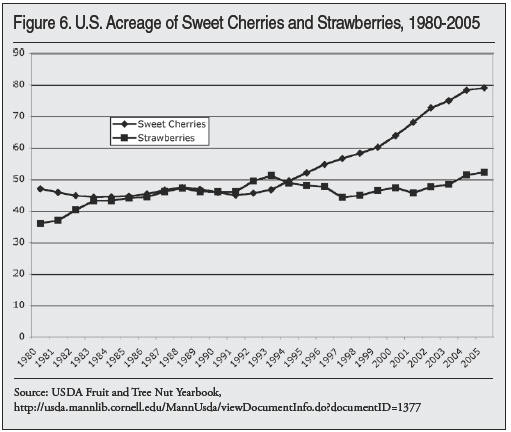
- Production of fruits and vegetables has been increasing. In particular, plantings of very-labor intensive crops such as cherries and strawberries have grown by more than 20 percent in just five years.
- The average farm worker makes $9.06 an hour, compared to $16.75 for non-farm production workers.
- Real wages for farm workers increased one-half of one percent (.5 percent) a year on average between 2000 and 2006. If there were a shortage, wages would be rising much more rapidly.
- Farm worker earnings have risen more slowly in California and Florida (the states with the most fruit and vegetable production) than in the United States as a whole.
- The average household spends only about $1 a day on fresh fruits and vegetables.
- Labor costs comprise only 6 percent of the price consumers pay for fresh produce. Thus, if farm wages were allowed to rise 40 percent, and if all the costs were passed on to consumers, the cost to the average household would be only about $8 a year.
- Mechanization could offset higher labor costs. After the “Bracero” Mexican guestworker program ended in the mid-1960s, farm worker wages rose 40 percent, but consumer prices rose relatively little because the mechanization of some crops dramatically increased productivity.
- Labor-saving mechanization can be difficult for one farmer, since packers and processors are usually set up to deal either with hand-picked or machine-picked crops, but not both. Government has a key role to play in facilitating mechanization.
Introduction
News reports and editorials suggest widespread farm labor shortages. The Los Angeles Times described “a nationwide farm worker shortage threatening to leave fruits and vegetables rotting in fields.”1 The Wall Street Journal in a July 20, 2007, editorial claimed that “farmers nationwide are facing their most serious labor shortage in years.” The editorial asserted that “20 percent of American agricultural products were stranded at the farm gate” in 2006, including a third of North Carolina cucumbers, and predicted that crop losses in California would hit 30 percent in 2007.
The Wall Street Journal editorial continued that, since “growers can only afford to pay so much and stay competitive,” some U.S. growers are moving fruit and vegetable production abroad. The New York Times profiled a southern California vegetable grower who rented land in Mexico to produce lettuce and broccoli because, the grower asserted: “I know beyond a shadow of a doubt that if I did that [raise U.S. wages] I would raise my costs and I would not have a legal work force.”2
These reports of farm labor shortages are not accompanied by data that would buttress the anecdotes, like lower production of fruits and vegetables or a rise in farm wages as growers scrambled for the fewer workers available. There is a simple reason. Fruit and vegetable production is rising, the average earnings of farm workers are not going up extraordinarily fast, and consumers are not feeling a pinch – the cost of fresh fruits and vegetables has averaged about $1 a day for most households over the past decade.
This Backgrounder reviews definitions of farm labor shortages, trends in the production of fresh fruits and vegetables, farm worker earnings and consumer prices, and the ways in which growers would adjust to higher farm wages. The new Farm Bill would spend $286 billion over the next five years on farm subsidies and food assistance, including assistance for specialty crops. Instead of using tax funds to increase production of U.S. fruits and vegetables in ways that require migrant workers, it may be better to subsidize the labor-saving mechanization needed to keep U.S. fruit and vegetable agriculture competitive in an increasingly global marketplace.
Farm Labor Shortages
There is no economic or government definition of persisting shortage. In a market economy, demand curves rank consumers by their willingness to pay a particular price for a commodity, and supply curves rank suppliers by their willingness to sell at particular prices. In the familiar X-diagram, if demand exceeds supply, prices rise, reducing demand and increasing supply; if supply exceeds demand, prices fall. Producers of fresh fruits and vegetables are very familiar with the price changes associated with these workings of the market, especially with shifts in supply.
Demand and supply adjustments to price changes can occur with considerable lags. For example, growers of perennial crops such as apples or oranges must decide if high prices are likely to persist before making the investments necessary for additional production, since it may be three or more years between the time a tree is planted and the grower harvests a first crop. Government intervention can slow the market adjustments that normally bring supply and demand into balance. If there is a ceiling on the price of a commodity, there can be shortages, as with price-controlled apartments in New York City. If suppliers are guaranteed high prices, there can be surpluses, as with some farm commodities.
The labor market adjusts in the same way, using wage changes to send signals about changes in supply and demand. Labor demand curves rank employers by the wages they are willing to pay to fill particular jobs, and labor supply curves rank workers by their reservation wages, which are the wages needed to induce them to fill particular jobs. As with farmers who must decide whether to plant more perennial crops in response to higher prices, there can be lags between changes in the demand for labor and a supply response. For example, an IT-boom can sharply increase the wages of computer programmers but not produce an immediate surge in programmers because it takes time to acquire the needed education and skills.
Government intervention also affects labor market adjustments. Farm and trade policies affect the demand for labor by encouraging new plantings if tariff and other barriers to exports are reduced, as with apples and oranges sent to Japan and Korea. Government policies in areas from education and training to welfare and minimum wages can affect the supply of workers by providing other options for those who would otherwise fill seasonal farm jobs. However, the major government intervention that affects the farm labor market is immigration. According to the most recent U.S. Department of Labor survey, over three-fourths of the hired workers employed on U.S. crop farms were born outside the United States, usually in Mexico. The same survey found that 53 percent of crop workers were unauthorized.3
Media reports of farm labor shortages usually quote farm employers saying they have fewer workers than they want. For example, a farm employer may claim a labor shortage if there is a crew of 30 working but a crew of 40 is preferred, or if the farmer asked for two crews of workers today but contractors do not bring them until tomorrow.
It is important to understand that “labor shortage” can mean different things, even among growers. For example, a Grand Junction, Colo., peach grower complained of a labor shortage because: “There is no labor walking up and down the road like there was years ago.”4
A California strawberry grower complained that, as soon as the earnings of piece rate workers drop because of lower yields, they move on: “They want to make the maximum amount of money in the shortest time possible, which is understandable. But it’s a huge problem for United States.”5
Economists evaluating claims of labor shortages look not to what employers say, but to what they do to attract additional workers. If there are fewer workers available, economists expect wages to rise, which should increase the supply of farm workers by retaining more who would otherwise leave for nonfarm jobs and perhaps draw workers into agriculture from other jobs or areas. Higher wages also reduce the demand for workers as, for example, farmers skip the third or fourth repicking of a field or orchard. Many growers do not raise wages because they “know” that higher wages will not produce more workers. 6
Farm employers can also take steps that do not involve wages to attract or retain workers, including stepping up recruitment efforts, offering additional benefits such as housing, or making work easier with conveyor belts in the field to eliminate carrying harvested produce or hydraulic lifts to eliminate ladders. If wages are expected to continue rising, farmers may mechanize.
Employment and Earnings
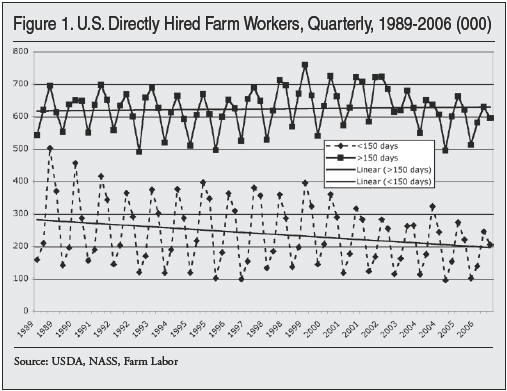
The U.S. Department of Agriculture asks farm employers to report the employment and earnings of farm workers each quarter. Between 1989 and 2006, farm employers reported hiring an average of almost 900,000 workers. Asked how long they expected to employ these directly hired workers, farmers reported that they hired three times more regular workers, employed 150 days or more on their farms, than seasonal workers, employed less than 150 days on their farms.
Additional seasonal workers are brought to farms by labor contractors and other agricultural service firms; their number ranges from 250,000 to 350,000, making average employment on U.S. farms about 1.2 million. Over the past 15 years, farmers have been hiring more workers via contractors and other intermediaries, which explains why there is a downward trend in the employment of directly hired seasonal workers.
Average employment does not entirely describe the farm labor market. Peak employment measures how many workers are employed at the busiest times of the year, since at least this many individuals must be farm workers to get crops harvested. The third concept is a count of the number of individuals employed sometime during the year who were hired for wages on farms. Peak employment on farms is about 1.3 million, but the total number of farm workers is about 2.5 million.7 Average employment is a measure of the number of year-round job slots, so the average farm job is filled by two individuals during the year.
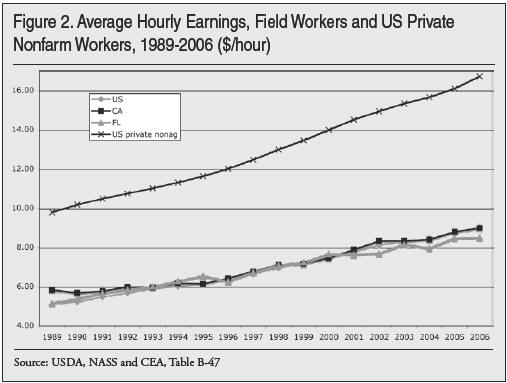
The USDA asks farmers to report the average hourly earnings of the field workers they hire directly four times a year.8 They reported that average hourly earnings rose from $5.12 in 1989 to $9.06 in 2006. If we average the years 1989 and 1990 and 2005 and 2006 to smooth out year-to-year changes, this is a 72 percent increase in average earnings, more than the 64 percent increase in the average hourly earnings of private sector nonfarm workers, which was 64 percent.
We can examine the change in field worker earnings in two subperiods – during the early 1990s, when there were more stories of farm labor surpluses than shortages, and since 2000, when there have been labor shortage complaints. The average increase in earnings was slightly higher for field workers than for private sector nonfarm workers both in the early 1990s and since 2000, 26 versus 23 percent in the early 1990s, and 25 versus 24 percent since 2000. However, California’s wage increase lagged behind the U.S. increase in the early 1990s, and Florida’s since 2000.
Data from the National Agricultural Workers Survey (NAWS), which interviews workers rather than employers, suggest lower farm worker earnings and a slower rate of increase. Between 1990-91 and 2000-01, NAWS reported that the average hourly earnings of crop workers rose from $5.40 to $7.05, an increase of 30 percent, while the average hourly earnings of private-sector production workers rose from $10.34 to $14.26 or 38 percent.9
These employment and earnings data reported do not suggest severe farm labor shortages, especially not in the major fruit- and vegetable-producing states of California and Florida. There are undoubtedly farmers who would like more workers, and would like workers today rather than tomorrow, but their desires have not translated into significant statewide wage and earnings increases.
There is also little evidence that growers are offering workers new benefits such as housing in an effort to keep them from leaving for nonfarm jobs. Indeed, as federal and state regulations raised standards for farm worker housing, many farmers stopped providing housing, especially for seasonal workers. Housing and other non-wage benefits are offered to attract farm workers; if workers are readily available, farmers are less likely to offer what can be an expensive benefit.
Many workers are brought to farms by labor contractors and other intermediaries, which can make it hard to obtain an accurate picture of the farm labor market but easy to understand why there can be complaints of both labor shortage and surplus.10 Contractors are persons who, for a fee, match workers with jobs. Some also provide their often unauthorized workers with other services that range from housing and transportation to providing false documents and cashing checks.
Imagine a farmer wanting to get oranges picked by a contractor who supplies crews of workers. The farmer may pay a piece rate of $15 a bin, plus an overhead or commission to the contractor of 33 percent or $5, which covers the payroll taxes the contractor must pay on worker earnings for social security, unemployment insurance, and workers compensation as well as the contractor’s cost of checking the legal status of the workers and providing toilets and drinking water. The farmer does not pay workers while they are waiting for work to begin, which provides an incentive to request more workers sooner than they are truly needed.
Contractors, on the other hand, have an incentive to promise more workers sooner so that they get the harvesting job. The result may be contractors providing fewer workers later than promised, leading to complaints of labor shortages. The unemployment and underemployment associated with workers waiting for work to begin is less reported, but it explains why many seasonal workers get out of farm work as soon as they can find other jobs that offer higher wages and steadier work.
In a seasonal industry such as agriculture that matches millions of workers with millions of seasonal jobs, a central register to record employer demands for workers and a listing of available workers could help to ensure that farm work is done by the fewest number of workers working maximum hours. During the 1960s, many employers formed associations that acted as central hiring halls, in one case reducing the number of workers hired from over 8,500 to 1,300 to pick the rising number of lemons.11
However, most of these associations have disbanded, and both union hiring halls and the public employment service now play negligible roles in the farm labor market. In their place, a decentralized system of labor contractors matches half of the seasonal farm workers with jobs in states such as California.
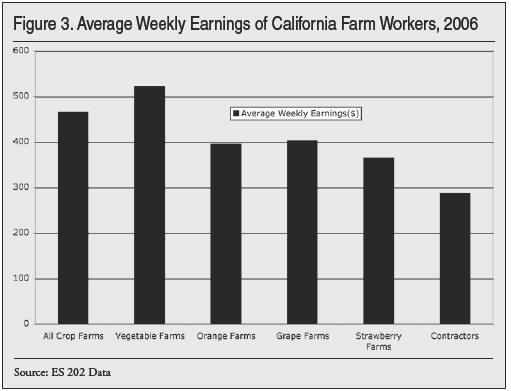
Contractors provide workers cheaply and absorb risks in a farm labor market rife with violations of labor, immigration, and tax laws. The cost advantage of contractor-provided workers is clear in California data for 2006: Workers employed by contractors earned an average $288 a week or $7.20 an hour, just over the state’s minimum wage of $6.75, while all workers employed on crop farms earned an average $466 a week, equivalent to $11.65 an hour. The workers employed directly by crop, vegetable, orange, grape and strawberry farms include a higher share of year-round equipment operators, supervisors, and other types of workers who typically receive higher wages, while the contactor crews usually include workers who perform one task on a farm, such as weeding, pruning, or harvesting.
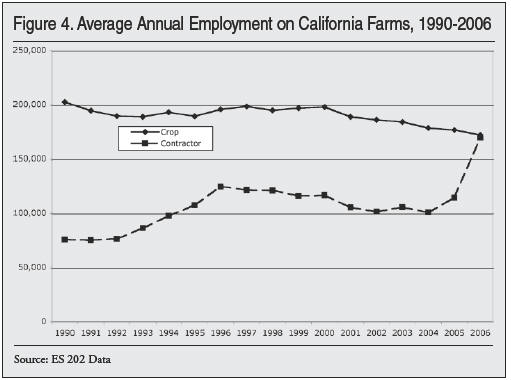
The fact that contractors can provide especially seasonal workers cheaply and are willing to absorb the risks of enforcement of labor, immigration, and tax laws helps to explain their growing role in farm labor markets around the United States. As recently as 1990, there were almost three workers who were hired directly by the farm on which they were employed for each worker brought to a farm by a contractor in California. By 2006, the number of workers hired directly by crop farmers was the same as the number brought to farms by contractors.
Fruit and Vegetable production
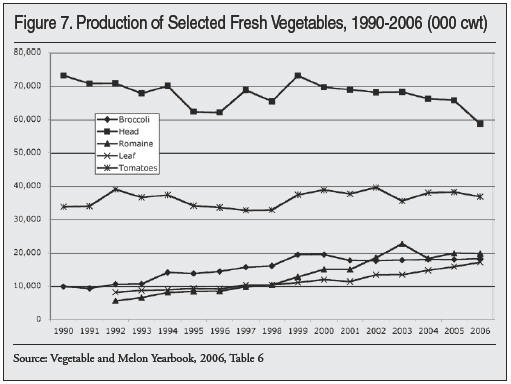
If farmers feared that labor shortages would leave their crops unpicked, they might plant fewer acres of fruits and vegetables. However, fruit and vegetable production has been increasing. The production of noncitrus fruits rose from about 17 million tons a year in 2001-02 to almost 19 million tons in 2006, while the annual production of fresh vegetables has been stable at about 465 million hundredweights since 2001-02.12
The increased production of strawberries and cherries is especially striking. Both are very labor-intensive, and require significant investments that will not yield returns for several years, yet their production jumped more than 20 percent in just five years. With demand increasing,13 the acreage of these labor-intensive fruits rose, suggesting that fears of labor shortages do not deter additional plantings.14
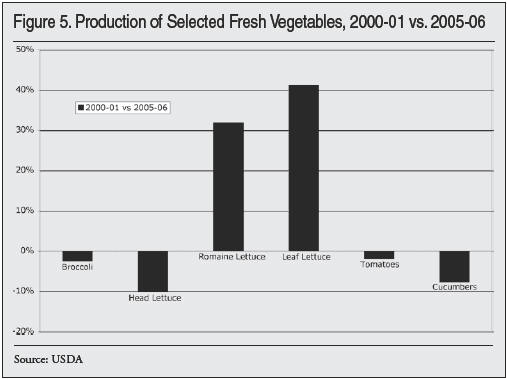
The story for vegetable production is similar. Fresh vegetable production has been stable since 2000, with production of some vegetables rising and others falling. The production of head lettuce declined by five percent over the past decade, but the production of Romaine lettuce more than doubled, while the production of leaf lettuce almost doubled, reflecting changing consumer tastes. The production of fresh broccoli rose over 25 percent, and the production of fresh tomatoes 10 percent.
Production data suggest that fears of labor shortages have not prevented farmers from planting more fruits and vegetables. Instead, as the demand for strawberries, cherries, and Romaine lettuce increased, so did production.
Case Studies
Border-area vegetable farmers began complaining of labor shortages during the winter 2004-05 harvest, blaming Border Patrol stops of farm worker buses for too few harvesters.15
Agents removed unauthorized workers, reportedly discouraging others from attempting to go to work.
Most border-area farm workers are green-card commuters, Mexican citizens with U.S. immigrant visas who live in Mexico and commute daily or weekly to U.S. farm jobs. These green-card commuters are aging, and the younger workers joining the crews are often unauthorized and use false documents to get hired. With the Border Patrol checking buses leaving ports of entry for the fields, unauthorized workers have no incentive to return to Mexico and risk being apprehended the next day. Once inside the United States, they tend to keep going north away from the border, where wages are higher and there is less enforcement.
There were 104,000 acres of vegetables and melons in Imperial County in 2004, up from 95,000 acres in 2003, including 30,000 acres of lettuce, 18,000 acres of carrots, 10,000 acres of broccoli, and 11,000 acres of onions; farm sales were $1.2 billion. Despite fears of labor shortages, Imperial valley farmers planted 10 percent more vegetables in 2005. The unemployment rate in Imperial County averaged 24 percent between 1990 and 2004.
California-Arizona farmers say that they need 77,000 workers, and predicted in spring 2005 that they would be 35,000 workers “short” during the December 2005 to May 2006 vegetable harvest season. However, the employment data that farmers provide to the state showed a peak 34,000 workers employed in three California counties: Imperial, Riverside, and San Bernardino, including 3,900 in vegetables and melons between December 2004 and May 2005. Even if all workers brought to farms by custom harvesters and labor contractors were working on vegetable farms, peak employment was 18,000 in May 2005.
Stephen Birdsall, the Imperial County agricultural commissioner, explained why growers “need” three times more workers than can be employed at any time: “In Imperial Valley there is a need for at least 10,000 full-time workers a day for the [vegetable] harvest. But the reality is they actually need a pool of about 30,000 workers. For every one person that works they need three people, because one person will only work a third of the time. They will work for a couple of days and then not return and then the grower will need others to replace them.”16
During the summer of 2005, there were widespread reports of labor shortages in California’s Central Valley, the nation’s fruit bowl. The Fresno Bee reported that the supply of farm workers was shrinking because of tougher border enforcement and the construction boom, and quoted employers who said that crews that usually have 20 to 25 workers had only 15.
As the raisin harvest approached in August-September 2005, there were predictions of an economic disaster due to a shortage of farm workers. Harvesting raisin grapes may be the most labor-intensive seasonal farm activity in North America, employing 40,000 to 50,000 workers who move through the vineyards cutting bunches of green grapes and placing them on paper trays to dry into raisins. There is a labor shortage every year, as farmers who wait until the sugar levels are high enough to begin harvesting know that the longer they wait, the more likely their drying raisins may be damaged by early rains.
The raisin harvest was delayed in summer 2005 by an unusually wet spring, which contributed to the urgency of farmers finding crews of harvesters. With prices high, some raisin growers paid more than the usual 25 cents a tray to harvest 25 pounds of green grapes, plus a 25 percent overhead to the labor contractor to cover payroll taxes, toilets, recordkeeping, and profits. Manuel Cunha Jr. of the Nisei Farmers League asserted that raisin growers were “short” 20 percent of the workers needed for the harvest, and reported 50 calls a day from growers in Fall 2005 asking for raisin harvesters.17
Some drying raisins were damaged, and some growers requested a “disaster declaration” because of “labor shortages.” Disasters are defined as events that damage at least 35 percent of a crop, and the most credible estimates were that less than five percent of the raisin crop was damaged by September 2005 rains, so there were no labor-shortage disaster payments. California harvested one million tons of (green) raisin grapes in 2004 and 1.3 million tons in 2005.18
There are mechanical alternatives to hand harvesting raisin grapes such as the dried on the vine technique that cuts the stems on which bunches of grapes grow and allows the dried grapes to be harvested with a wine grape harvester.19 An estimated 30 percent of raisins harvested were harvested with some form of mechanical assistance in 2005.
In summer 2006, there were reports of California pears going unpicked for lack of harvest workers; a widely cited story focused on Lake County pears.20 Lake County harvested 2,400 acres of Barlett pears yielding 47,400 tons in 2004, 2,300 acres yielding 28,700 tons in 2005, and 2,100 acres yielding 36,100 tons in 2006. Almost two-thirds of California’s pears are grown in the Sacramento delta region, three hours to the southeast, and the Delta’s large and late crop kept picking crews there longer in 2006.
Pears are a declining industry. Bartlett pear production in California dropped by over 300,000 tons in 1999 to less than 100,000 tons in 2005, and there have been no new plantings for a decade, according to the California Pear Commission, reflecting the fact that the demand, especially for canned pears, has been declining.21
Employment in the Lake County pear industry has also declined, from an annual average of 374 workers employed by 55 establishments in “other noncitrus fruit farming” in 1990 to 172 employees of 22 establishments in 2006.22
A third of U.S. pears are exported, usually to Canada and Mexico. The lack of workers for the Lake County pear industry raises a fundamental question: should the U.S. import workers from Mexico to hand-pick pears, some of which are exported to Mexico? California may have the land and climate for pear production, but should pears be produced in areas of the state that cannot attract local or migrant workers?
The Wall Street Journal’s July 20, 2007, editorial claimed that a third of North Carolina cucumbers were not harvested in 2006 for lack of labor. U.S. cucumber receipts were a record $400 million in 2006, up from $383 million in 2005 and $383 million in 2004. Fresh-market cucumber shipments in 2006 were 14.5 million hundredweight, up from 14.1 million in 2005 and 13.9 million 2004. U.S. production of cucumbers for pickles was about one billion pounds in 2006, down from 1.1 billion in 2005, but prices rose from $256 per 100 pounds to $296 per 100 pounds. About 70 percent of North Carolina cucumbers in 2002 were harvested for processing.
What about farmers shifting vegetable production to Mexico to get legal workers? The New York Times profiled a U.S. grower who began to produce lettuce and broccoli on rented land in Mexico in 2006.23
The United States imports tomatoes and other vegetables from Mexico, usually to take advantage of lower costs and off-season production. The article suggested that a new reason was to obtain legal Mexican workers.
Almost all U.S. lettuce and other vegetables are produced domestically. U.S. imports of lettuce from Mexico began to increase in 2001-02, and have averaged about 45,000 tons a year since. The United States produces about 4.5 million tons of lettuce each year, so imports from Mexico are equivalent to one percent of U.S. production. It has been reported that U.S. farmers may be producing 50,000 acres of vegetables in Mexico for the U.S. market but, with 1.7 million acres of U.S. fresh vegetables harvested in 2006, production in Mexico would represent less than 3 percent of U.S. acreage. Multinationals such as Dole regularly produce or buy produce from foreign fruit and vegetable producers – is foreign investment that creates jobs in Mexico and provides lower-cost produce for U.S. consumers an issue?
Adjusting to Higher Wages
Production of labor-intensive commodities has increased despite worries of labor shortages. However, if tighter enforcement of immigration laws leads to fewer new farm workers, and low nonfarm unemployment rates draw workers out of agriculture, farm wages would be expected to rise.
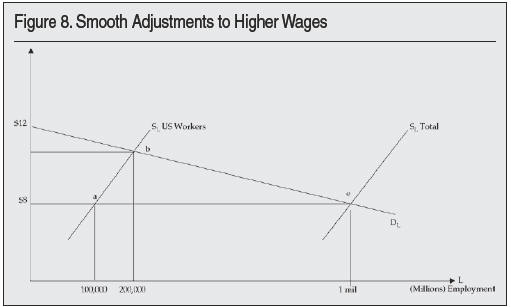
How would farm employers adjust to rising farm wages? The adjustment could be smooth, with the labor supply shrinking along a smooth demand curve, or could be discontinuous, as when the demand for farm workers drops sharply at a particular higher wage as farmers mechanize or switch crops.
Today’s farm labor market is pictured in Figure 8. It portrays the California farm labor market of 2005, when about one million persons, 90 percent immigrants, were reported by the state’s farm employers to unemployment insurance authorities. If the influx of newcomers were slowed by enforcement, and exits of farm workers speed up because of the availability of nonfarm jobs, the labor supply curve would shift leftward. If the adjustment to fewer workers is smooth, we have a new equilibrium at b, where there are more American workers employed at higher wages, but far fewer total farm workers. This figure illustrates the adage that “there is no shortage of workers, only a shortage of wages.”
An alternative adjustment scenario is pictured in Figure 9. It illustrates a “kinked” demand-for-labor curve to highlight the critical or threshold wage at which the demand for farm labor shrinks sharply. Beginning from the same starting point at e, adjustments to fewer workers shift the supply curve leftward, and the demand for labor falls as e.g. farmers skip a third or fourth harvest. However, at the critical wage a, there is a sharp drop in the demand for labor, from 800,000 to 50,000, displacing over 90 percent of the workers who had been employed because of mechanization or shifting to other crops.
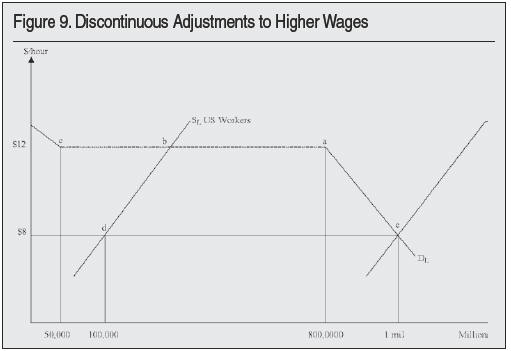
Which picture of farm labor market adjustments to rising wages is more realistic? The mechanization of California’s processing tomatoes illustrates the discontinuous adjustment process. In 1960, over 80 percent of the 45,000 peak harvest workers employed to pick the state’s 2.2 million ton processing tomato crop into 50 to 60 pound lugs were Braceros. A decade later, almost all processing tomatoes were harvested mechanically, and fewer than 5,000 local workers rode on the machines to ensure that only ripe tomatoes were sent to processors.24
Few growers, processors, or researchers anticipated this rapid mechanization. During the summer of 1963, Congress held often emotional hearings on the need for Bracero farm workers. Witnesses argued that Bracero workers were necessary to keep fruit and vegetable prices “reasonable” and to help the United States maintain “food security” during the Cold War. The California Farmer wrote that “all agree that the state will never again reach the 100,000 to 175,000 acres [of processing tomatoes] planted when there was a guaranteed supplemental labor force in the form of the bracero… The industry sees no hope of filling the [labor] gap in tomatoes from the domestic ranks even if competition for workers drives wages up to the average factory wage.”25
The story of the rapid mechanization of the processing tomato harvest begins at UC-Davis, where federal and state funds supported the efforts of plant scientists to develop tomatoes that ripened uniformly so they could be harvested in one pass through the field. Agricultural engineers developed machines that cut the plant, shook off the tomatoes, and conveyed them past sorters before dumping them in trucks outfitted with 12.5 ton tubs. Mechanization reduced harvest labor needs by 90 percent, and production rose sharply. There were also further refinements in the expanding industry, as the water content of processing tomatoes was reduced and tomatoes were “redesigned” to be oblong to reduce cracking when carried in bulk.
Government played a key role in fostering mechanization by helping to resolve age-old farmer-processor conflicts. Farmers are paid by weight, giving them an incentive to include green tomatoes and dirt clods in their lugs, while processors have an incentive to declare some of the tomatoes they received “substandard” and pay less for them.
The new technology raised the stakes for both sides. Processing tomatoes were worth about $50 a ton in 2005, or 2.5 cents a pound. When hand-harvested tomatoes arrived in 50-pound lugs, rejecting a lug cost the farmer $1.25. However, with mechanically harvested tomatoes arriving in 12.5 ton loads, rejecting a load cost a farmer $625. The state government hastened acceptance of mechanical tomato harvesting by creating a network of random sampling stations to determine the quality of the tomatoes. Without these stations, which have since been privatized, it is unlikely that tomato mechanization would have occurred so quickly.
There were many other labor-saving changes in the mid-1960s in response to rising farm wages. Cesar Chavez and the United Farm Workers won a 40 percent wage increase for grape pickers in their first contract in 1966, increasing entry-level wages from $1.25 to $1.75 an hour at a time when the federal minimum wage was $1.25. Farm worker earnings rose faster than nonfarm earnings between the mid-1960s and late 1970s, prompting the use of bulk bins and forklifts in fields and orchards that eliminated thousands of jobs. Conveyor belts moving slowly down rows of vegetables made it possible to pick and pack lettuce, broccoli, and other vegetables in the field, eliminating jobs in packing houses.
Prospects for Mechanization
Firms are developing machines to harvest fruits and vegetables, but their refinement and diffusion has been slowed by the ready availability of farm workers at stable wages. Commodities that are processed, such as oranges used to make juice, are easiest to mechanize, since machine-caused damage is less of a concern.
Oxbo International has developed a machine to harvest Florida’s Valencia oranges that are processed into juice. Each of the $1 million machines can harvest 1.2 million boxes of oranges a season, replacing 100 to 200 hand harvesters, at a cost of $1 per 90-pound box, compared to $1.50 to $2 for hand-harvested fruit. The machines can automatically adjust the shaking force and depth of the fingers that dislodge the fruit, and have yield monitors that allow growers to determine yields precisely.
Given this cost advantage, why aren’t most of Florida’s 775,000 acres of oranges harvested by machine? The answers include the ready availability of hand harvesters and the fact that there are relatively few new plantings of Valencia oranges in Florida because of development, hurricanes, and disease. The machine is being used primarily in the new plantings in the southwestern part of the state, where orange production is moving to take advantage of cheaper land and fewer freezes. New plantings can be designed for mechanical harvesting, with evenly spaced and carefully pruned trees.
Owners of older orange groves in the center of the state are reluctant to make the investments needed to mechanize because they know that Brazil can produce Valencia oranges more cheaply. A free-trade agreement that reduced the tariff on Brazilian orange juice could make investments in pruning trees for machine harvesting and buying machines unprofitable.26
California produces most of the fresh oranges consumed in the United States. A mechanical harvester developed by Vision Robotics has eight arms and can pick as fast as 10 workers, but its real advantage is that it can work around the clock, while most hand harvesters work six or seven hours a day. If wages rise as the cost of computing power falls, harvesting machines could spread rapidly.
Up to half of the nation’s head lettuce is now sold in bags, which prompted Salinas-based Ramsey Highlander to develop a machine that cuts heads of lettuce and eliminates the wrapper leaves. It moves through fields harvesting an acre an hour and eliminating 75 percent of the workers who now harvest lettuce by hand.
The story is similar in the mechanization of many other commodities. Machines are available to harvest olives, raisin grapes, and other commodities, but adopting a machine that replaces hand pickers can be complex. In most cases, machines must be fine-tuned as they are sent into fields and orchards, and the packers and processors of commodities must adjust their standards to accept machine-picked fruit during this refinement process. It is hard for one grower alone to mechanize, since most packers and processors are set up to deal with wither hand-picked or machine-picked commodities, but not both.
For example, peaches are normally taken from the groves to packing plants, where they are conveyed past machines and hand sorters to check their size and to remove those that are blemished. For every 100 hand-picked peaches, 20 to 25 are eliminated in the packing shed, compared with 30 to 40 of those that were shaken from trees by machines. Handling machine-picked peaches may require additional sorters in the packing plants, which explains why mechanization often needs a catalyst that encourages the entire commodity to make the switch. Very large growers may be able to mechanize on their own, but smaller growers often have to work cooperatively with packers and processors to mechanize.
In some cases, technology may make farm work easier rather than eliminate hand workers. Most of the workers who climb trees and pick apples and other fruits are young and unauthorized. Most newly planted fruit trees are much smaller, so that workers can harvest most of the fruit from the ground. Older and taller trees can be pruned so that fruit grows in a canopy or wall easily accessible to pickers, who can use self-propelled mobile platforms rather than ladders harvest fruit. Thus, many commodities are making the transition toward mechanization and harvesting aids, a process that could be speeded up with government assistance.
Implications for Consumers
Americans spend an average 13 percent of their disposable incomes on food, one of the lowest ratios in the world. If farm worker earnings rose, would fresh fruits and vegetables become luxuries, as predicted as the Bracero program was ending in the 1960s? The answer is no, and for three major reasons. First, most Americans do not spend much on fresh fruits and vegetables – the average household spends more on alcoholic beverages each year than on fresh produce. Second, farmers get a relatively small share of retail spending on fresh produce – less than 20 cents of each retail dollar spent on apples or lettuce. Third, farm workers receive only a fraction of what the farmers get, since labor costs are typically less than a third of farm production costs. As a result, farm worker wages are about six cents for a $1 head of lettuce or pound of apples.
Three sources of data demonstrate the negligible role of farm wages in retail food prices. The U.S. Bureau of Labor Statistics (BLS) Consumer Expenditure Survey reports how much households spend on food, the U.S. Department of Agriculture reports the farm share of retail food prices, and land-grant universities prepare cost-of-production budgets that show labor’s cost of producing various commodities.27
BLS refers to households as “consumer units,” of which there were 117 million in 2005. These consumer units had an average of 2.5 persons, 1.3 earners and two vehicles. Average consumer unit income before taxes was $58,700, and average expenditures were $46,400, about $892 a week.
Average consumer unit expenditures included $5,900 for food in 2005, representing 13 percent of household spending. This food spending was split between food for consumption at home and food away from home – 56 percent or $3,300 was for food eaten at home ($63 a week) and 44 percent or $2,600 was spent on food eaten away from home. Much of the cost of food away from home reflects service and convenience, not the cost of the food, such as the ambience in restaurants or convenience at fast-food outlets.
To put food spending in perspective, average consumer unit or household expenditures were $15,200 for housing and utilities, $8,300 for transportation, $2,700 for health care, $2,400 for entertainment, and $1,900 for apparel.
The most expensive foods eaten at home do not include significant farm labor costs. The largest food-at-home expenditures were for meat and poultry, $765; nonalcoholic beverages, $610; and milk and cream, $145. Expenditures on fresh fruits ($182) and fresh vegetables ($175) totaled $357, an average $6.85 a week.28 The average household spent more on alcoholic beverages in 2005, $426, than on fresh fruits and vegetables, $357.
Even though strawberries are picked directly into the plastic clamshells in which they are sold, and iceberg lettuce gets its film wrapper in the field, farmers received only 16 percent of the retail price of fresh fruits and 19 percent of the retail price of fresh vegetables.29 This means that farmers, taken together, receive $62 a year from an average American household for the fresh fruits and vegetables consumed at home. Most farmer revenue covers the cost of land, seeds, fertilizer, and other non-labor costs of production; labor costs are usually less than a third of farmers’ costs. If wages average a third of farmers’ costs, the average household’s spending on fresh fruits and vegetables was $21 in 2005.
If farm wages rose, would apples and oranges become luxuries or would the processing tomato experience be repeated, with mechanization leading to more production and lower costs? There are machines available to harvest most of the fresh fruits and vegetables produced in the United States, but with people better than machines at picking apples and oranges, mechanization is spreading slowly. Many engineers predict that, if farm worker earnings were to rise from about half the average for manufacturing workers to the $17 average, there would be widespread mechanization.
Suppose effective enforcement slowed the influx of immigrant workers, and current farm workers continued to get out of seasonal farm jobs within a decade. As the labor supply tightened, wages would be expected to rise. Instead of doubling to the average earnings of manufacturing workers, what would happen if farm worker earnings rose 40 percent, as in mid-1960s UFW contracts?
Farmers reported average field worker earnings of $8.69 an hour in 2005, so a 40 percent wage increase would raise their average earnings to $12.17. Even if there was no mechanization in response to these higher wages, so that the entire 40 percent wage increase was passed on to consumers, consumers would hardly notice. Since farmers receive only 18 cents of the average retail dollar spent on fresh produce, and farm workers receive only six cents of a dollar spent on a pound of apples or a head of lettuce, a 40 percent wage increase fully passed on to consumers would raise the price of a one dollar item by 2.4 cents, or from $1 to $1.02.
For a typical consumer unit, a 40 percent increase in farm wages would raise spending on fresh fruits and vegetables by $8 a year, from $357 to $366 – about the cost of a movie ticket. However, for a seasonal farm worker, annual earnings would rise from $9,000 for 1,000 hours of work to $12,600, from below the federal poverty line for an individual to above it.
Conclusions
Some farmers are complaining of farm labor shortages. There is no official government definition of labor shortage, but media reports suggest that farmers define labor shortages as wanting more workers than they currently employ, or wanting workers sooner than they show up.
In a market economy, the usual responses to shortages are price or wage adjustments, as when a smaller crop leads to higher prices. The earnings data reported by farmers to the USDA do not suggest significant farm labor shortages, especially in California and Florida, where farm worker earnings have been rising more slowly than in the United States as a whole. The production of labor-intensive fruits and vegetables has expanded, suggesting that fears of labor shortages have not acted as a brake on farmers’ plans for production.
Government reports also suggest that there are no widespread farm labor shortages. The Congressional Research Service in September 2007 concluded that farm labor trends suggest no “nationwide shortage of domestically available farm workers.”a href="#30">30 The GAO in 1997 similarly concluded there is “no national agricultural labor shortage at this time” and that “a sudden, widespread farm labor shortage requiring the importation of large numbers of foreign workers is unlikely to occur in the near future.”31
Individual farmers might not have as many workers as they want, and may be unable to adjust smoothly to rising wages. Government played a key role to promote the mechanization of processing tomatoes in the 1960s by funding research and promoting the acceptance of labor-saving technologies; the federal government largely abandoned its mechanization research efforts in the 1980s.
If current trends continue, the farm workers of tomorrow will continue to grow up somewhere outside the United States, ensuring continued debate over whether farmers “need” foreign farm workers and what happens to them after they finish working on U.S. farms. The Farm Bill being debated in Congress for the first time includes significant assistance for specialty crops such as fruits and vegetables, including funds that should increase consumption and production. It might be better to provide tax funds to promote labor-saving mechanization that helps to keep U.S. fruit and vegetable agriculture competitive in an increasingly global economy.
End Notes
1,2 Imperial Valley vegetable grower Steve Scaroni quoted in Julia Preston, “Short on Labor, Farmers in U.S. Shift to Mexico,” The New York Times, September 5, 2007.
3 The National Agricultural Workers Survey available at:www.doleta.gov/agworker/report9/toc.cfm
4 Quoted in Le Roy Standish, “Too few laborers leave some orchards with rotting fruit,” Daily Sentinel, September 1, 2007.
5 Quoted in Ermina Karim, “Who will pick the crops?” San Luis Obispo Tribune, June 24, 2007
6 Phoenix area vegetable farmer Will Rousseau asserted that: “We know local folks won’t take those jobs, at any price.” Quoted in Farm Labor Shortages. 2006. Rural Migration News Vol. 13 No. 2, April. http://migration.ucdavis.edu/rmn/more.php?id=1110_0_4_0
7 The USDA estimated there were about 2.5 million hired workers employed sometime during the year on U.S. farms by using look back questions attached to the December Current Population Survey during the 1970s and 1980s, that is, interviewers asked if anyone in the household worked for wages on farms during the preceding 12 months. The results of these surveys were published in Hired Farm Workforce reports, which were discontinued after 1987. Oliveria, Victor and Jane Cox. 1989. The Agricultural Work Force of 1987: A Statistical Profile. U.S.DA. ERS. AER Report 609.
8 USDA farm employment and earnings data are available at: http://U.S.da.mannlib.cornell.edu/MannU.S.da/viewDocumentInfo.do?documentID=1063
9 Calculated from Table 5, p16. Levine, Linda. 2007. Farm Labor Shortages and Immigration Policy. Congressional Research Service. RL30395. September 5.
10 The UI or 202 data are available at: www.labormarketinfo.edd.ca.gov/cgi/dataanalysis/AreaSelection.asp?tableName=Industry
11 The Coastal Growers Association in Ventura County north of Los Angeles reduced the number of pickers from 8,517 in 1965 to 1,292 in 1978. The average hourly earnings of workers employed by CGA rose from $1.77 to $5.63 an hour during this period (the minimum wage in 1978 was $2.65). The wage costs of picking lemons rose from $0.53 a box in 1965 to $0.67 a box in 1978, far less than the rate of inflation. Mamer, John and Donald Rosedale. 1980. The Management of Seasonal Farm Workers under Collective Bargaining. UCCE Leaflet 21147. March.
12 Citrus production fell in 2005-06 due to hurricane damage in Florida and freezes in California.
13 Fresh cherry consumption tripled between 1995 and 2003 to almost one pound per person per year, and fresh strawberry consumption rose almost 30 percent to 5.3 pounds per person per year. Fruit and Tree Nut Yearbook 2006. Table A-1. http://U.S.da.mannlib.cornell.edu/MannU.S.da/viewDocumentInfo.do?documentID=1377
14 The acreage of machine-harvested tree nuts such as almonds and machine-harvested wine grapes has also increased rapidly.
15 Miriam Jordan, “Labor Squeeze Along the Border,” Wall Street Journal, March 11, 2005.
16 Quoted in Christine Souza, “Worker shortage makes immigration reform urgent,” Ag Alert, December 7, 2005.
17 Dennis Pollock, “Labor shortage sours citrus harvest,” Fresno Bee, November 24, 2005.
18 County Ag Commissioner reports available at: www.nass.U.S.da.gov/Statistics_by_State/California/Publications/AgComm/indexcac.asp
19 Mason, Bert, R. Keith Stiegler, and Gregory T. Berg. 1997. “Alternatives to Immigrant Labor? Raisin Industry Tests New Harvesting Technology.” February. http://cis.org/sites/cis.org/files/articles/1997/back297.html
20 Julia Preston, “Pickers Are Few, and Growers Blame Congress,” The New York Times, September 22, 2006.
21 Table 3 at: www.calpear.com/brd_annreporttables.cfm
22 Quarterly Census of Employment and Wages (ES 202 data) available at: www.labormarketinfo.edd.ca.gov/cgi/dataanalysis/AreaSelection.asp?tableName=Industry
23 Julia Preston, “Short on Labor, Farmers in U.S. Shift to Mexico,” New York Times, September 5, 2007
24 The University of California was later sued by the United Farm Workers union and California Rural Legal Assistance for using tax funds to mechanize the tomato harvest. The process of mechanization and the suit are examined in: Martin, Philip L. and Alan L. Olmstead. 1985. The agricultural mechanization controversy. Science, Vol 227, No. 4687. February. 601-606
25 California Farmer, July 6, 1963, pp 5 and 47. There were many other predictions of doom and gloom without Braceros. California had about 10,000 acres of strawberries in the early 1960s, and the California Farmer on July 20, 1963 had an article headlined “Bracero Loss will make Strawberries a Luxury.” (p5). California today has almost 35,000 acres of strawberries.
26 Brazil can deliver a pound of frozen concentrate in the United States for under 75 cents, compared to 99 cents for a Florida growers and processors; a tariff of 29 cents a gallon on imports of frozen concentrated orange juice keeps Florida competitive. Brazil produced 18 million tons of oranges in 2002-03, when Florida produced 11 million tons; Brazil exports over 95 percent of its orange juice concentrate.
27 The U.S. Bureau of Labor Statistics Consumer Expenditure Survey data are at www.bls.gov/cex . Farm-retail price spreads are at www.ers.U.S.da.gov/Briefing/FoodPriceSpreads/spreads/
28 The average household spent $110 on processed fruits and $82 on processed vegetables in 2004.
29 This means that $357 in retail spending on fresh produce generates $65 for farmers: (0.16 x 182 = $29 + 0.19 x 175 = $33, and $29+$33 = $62).
30Levine, Linda. 2007. Farm Labor Shortages and Immigration Policy. Congressional Research Service. RL30395. September 5. p8.
31General Accounting Office. 1997. H-2A Guestworker Program: Changes could improve services to employers and better protect workers. Washington, D.C. GAO/HEHS 98-20.; December 31.
Philip Martin is a professor of agricultural and resource economics at the University of California, Davis.