Download a pdf of this Backgrounder
Mr. North, a Fellow at the Center for Immigration Studies, has been working with government immigration statistics for decades.

Maybe I am being a bit paranoid, and what I regard as the deliberate obscuring of government data is, perhaps, just ineptitude, but I sense that when it comes to statistical data U.S. Citizenship and Immigration Services sometimes engages in what I call the "John McCain medical history ploy".
Some readers may recall that in the 2008 presidential election both sides of the race managed not to reveal much about the respective candidates' health.
Then-Sen. Obama's (D-Ill.) physician issued a short letter saying that the senator was in fine fettle, and Sen. McCain's (R-Ariz.) handlers took the other extreme and assembled more than a thousand pages of his medical records (largely from the U.S. Navy) and gave journalists — who were not allowed to take notes — a brief time to examine them.
Happily, both men are, five years later, still in good physical shape — and they are still scrapping with each other.
Returning to USCIS and statistics, sometimes the agency reveals nothing about its operations, as it refused for months to publish the number of denials in the Deferred Action for Childhood Arrivals (DACA) program, and sometimes it follows the McCain medical history approach: floods of information in an indigestible format.
An example of the latter are the statistics relating to this basic question: How carefully does USCIS process the applications for family members (usually of earlier immigrants)? Since the bulk of legal immigrants are admitted for family reasons — not because they have needed skills — this is a key, policy-related question. Further, there is ample room for fraud in this part of the migration process.
There are more than 200,000 of these family-related petitions filed and adjudicated each year, and all this is done on I-130 forms. In many cases more than one alien relative can be included on a single form, so the number of forms is much smaller than the number of immigrants involved in these decisions.
Now suppose that you are a citizen, but an outsider, and you want to know how many of these applications were approved, and how many were denied. Can you learn the answers to those questions by examining data published by USCIS?
Well, yes, theoretically, but there are some very real obstacles.
To start the process you go first to the part of the USCIS website that is headed: "Data on Family-Based Benefit Requests" and you scroll down to an item with the following heading: "USCIS Relative Petitions Form I-130 Performance Data (Fiscal Year 2012, 4th QTR) (CSV), Data as of September 30, 2012". That sounds like what you are looking for.
You then use the offered link and that brings up a document that starts like this:
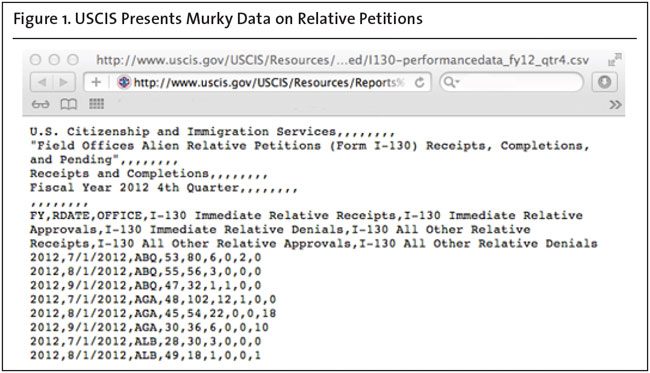
And there it is in Figure 1, everything you might want to know about how I-130 applications were handled in the first three months of FY 2012. These are the first of hundreds (I did not count them) of similar lines. There are no totals of these activities, or explanations, just numbers. It shows, among other things, how many I-130 applications were submitted, approved, and denied in each of the USCIS offices in each of the months of the quarter.
There is no reason why you, the citizen, can't seek to decipher the document, and add up hundreds of numbers to get the answer. The CSV format, shown above, however, certainly discourages such an activity.
ABQ, incidentally, is the USCIS office in Albuquerque, New Mexico, and AGA is the office in the main city in Guam, which the agency calls Agana (more on that later). CSV somehow stands for "comma delimited" which more or less explains the clumsy presentation.
It is not that USCIS just provides raw data along CSV lines, the agency also offers the same data in a somewhat more accessible PDF format here. (See Figure 2.)
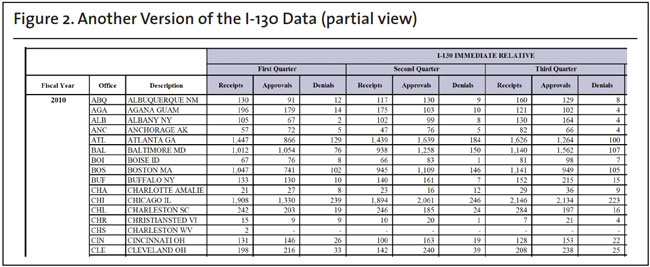
Now I have a nice, wide computer screen and I can, with some difficulty, and glasses on, read the data on the spreadsheet provided by the agency.
The data cover, again, all of the USCIS district offices, and in this case quarterly summaries for all of the offices in three fiscal years, 2010, 2011, and 2012. They also deal with two separate categories — thus doubling the amount of space used. The tabulation includes I-130 petitions for immediate relatives, which constitutes more than 90 percent of the business, and another (puzzling) category "I-130 All Other Relative". It runs for three and a third pages.
This leads to a spreadsheet that is 36 rows wide, that has more than 2,800 cells in it, and one that cannot be read when printed out on normal sheets of paper. Were the two subcategories, noted above, displayed in two sequential tables, instead of a single tabulation, everything would be legible once printed and also be much more readable on the screen.
Beyond the format difficulties, the spreadsheet also displays an all-too-familiar USCIS statistical quirk: lots of information is added up — except denials for the fiscal years. These are shown in quarterly subtotals, but not in annual totals. The reader must tally them for himself.
The Bottom Line. The reader, by now, may have (understandably) lost track of the original question: How frequently does USCIS approve, and how frequently does it deny, applications for these follow-on alien relatives who form the heart of chain migration? What are the denial rates, in percentages, in the three fiscal years covered by the data? USCIS rarely uses percentages in its publications; it prefers the less easily grasped raw numbers, preferably lots of them.
These are the totals I calculated regarding immediate relative I-130 forms, for decisions made (both approvals and denials) and the denial percentage in each of the three fiscal years:
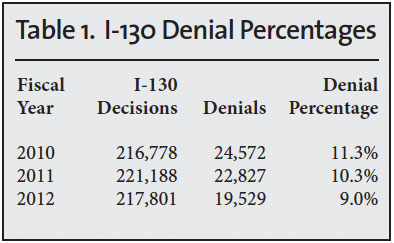
Neither the overall picture of about nine approvals to one denial, nor the falling denial rates is particularly surprising. This is an agency that likes to say "yes", and has liked that word even more since the start of the Obama administration.
The denial percentages, however, are much higher than the 1 percent we are seeing so far in the DACA program, which I suppose is heartening. Maybe, deep in the agency's gestalt there is a sense that saying "yes" to someone who is already in the country — like the DACA applicants — is even easier than saying the same thing to someone who is not here yet, but who wants to enter. We will probably never know.
As noted earlier, the data set includes denial/approval data for every one of the agency's many field offices — thus the thousands of cells in the table — and this opens the way for an analysis of the widely differing denial rates, office-to-office.
Clearly some field offices are dealing with more troublesome populations than others, and the local staff making the I-130 decisions bring to bear varying levels of scrutiny, so some deviation from the 9-11 percent norm is inevitable. Without looking at the data for every local office I noticed some extremes in denial percentages in the FY 2012 part of the table.
For instance, the Imperial (Calif.) office near the U.S.-Mexico border had a denial rate of 1.1 percent in 2012. Much higher rates were seen in Reno (16.5 percent) and in Christiansted in the U.S. Virgin Islands (17.2 percent). Perhaps in the last-named places there was a combination of a higher incidence of questionable claims plus a more-alert-than-usual staff.
Note: USCIS prides itself on its sensitivity to ethnic and linguistic minority groups generally. For instance, it conducts teleconferences on how to get immigration benefits in many languages other than English, such as Cantonese, Mandarin, Spanish, and Vietnamese, as listed here. Its parent agency, the Department of Homeland Security, sees to it that its anti-terrorism funds for local governments are spread to tribal entities, as well as to the big cities that are more likely to be in danger as we reported in an earlier blog, and it makes provisions for some tribes (such as the Pascua Yaqui) to issue their own passport substitutes, as I reported earlier.
In this context of much sensitivity I got an admittedly specialized chuckle from the second local USCIS office name on the massive I-130 data dump mentioned above; the one for Agana. That is about as politically incorrect as calling Mumbai "Bombay" or Harare "Salisbury". In each of these cases the second name is the old imperial name, long-since rejected by the current governments of those places.
Similarly, Agana is the Spanish version of Hagatna, the ancient Chamorro name for the village where the stately Guam territorial government buildings are located (I have been there). The government of Guam wanted to restore the old name. The Board of Geographic Names, an element of the U.S. Department of Interior, agreed over a decade ago that the name of the place should be changed, officially, from Agana to Hagatna. That Board decides, for the federal government, what to call places.
I guess the USCIS leadership either failed to get that memo, or does not read its own statistics, so it remains Agana in these tabulations.
To be totally fair, some USCIS documents refer to the place as Agana, and some to Hagatna, and some, such as is shown in Figure 3, split the difference and use both spellings on a single page.
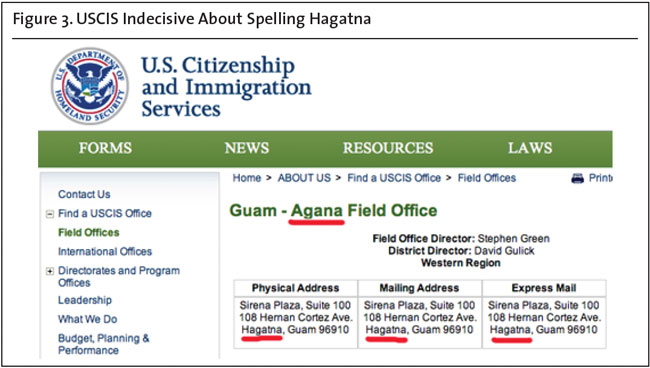
Incidentally, both the omnipresent Postal Service and the omniscient CIA call it Hagatna.