The following is a look at refugee resettlement admissions into the United States during the first three years of the Trump administration (January 20, 2017, to January 20, 2020) and, by way of comparison, the first three years of each of Obama's two terms (January 20, 2009, to January 20, 2012, and January 20, 2013 to January 20, 2016).
Presented below is the following data for each time frame listed above: total number of refugee admissions, refugee religious affiliations, countries of origin, and placement states inside the United States. (All figures were retrieved from the U.S. Refugee Processing Center portal.) I also looked at refugee ceilings and admissions under the Obama and the Trump administrations. Note that refugee ceiling determinations are set by the president in consultation with Congress and apply to fiscal years, not calendar years.
The full details are below, but here's a summary of what I found:
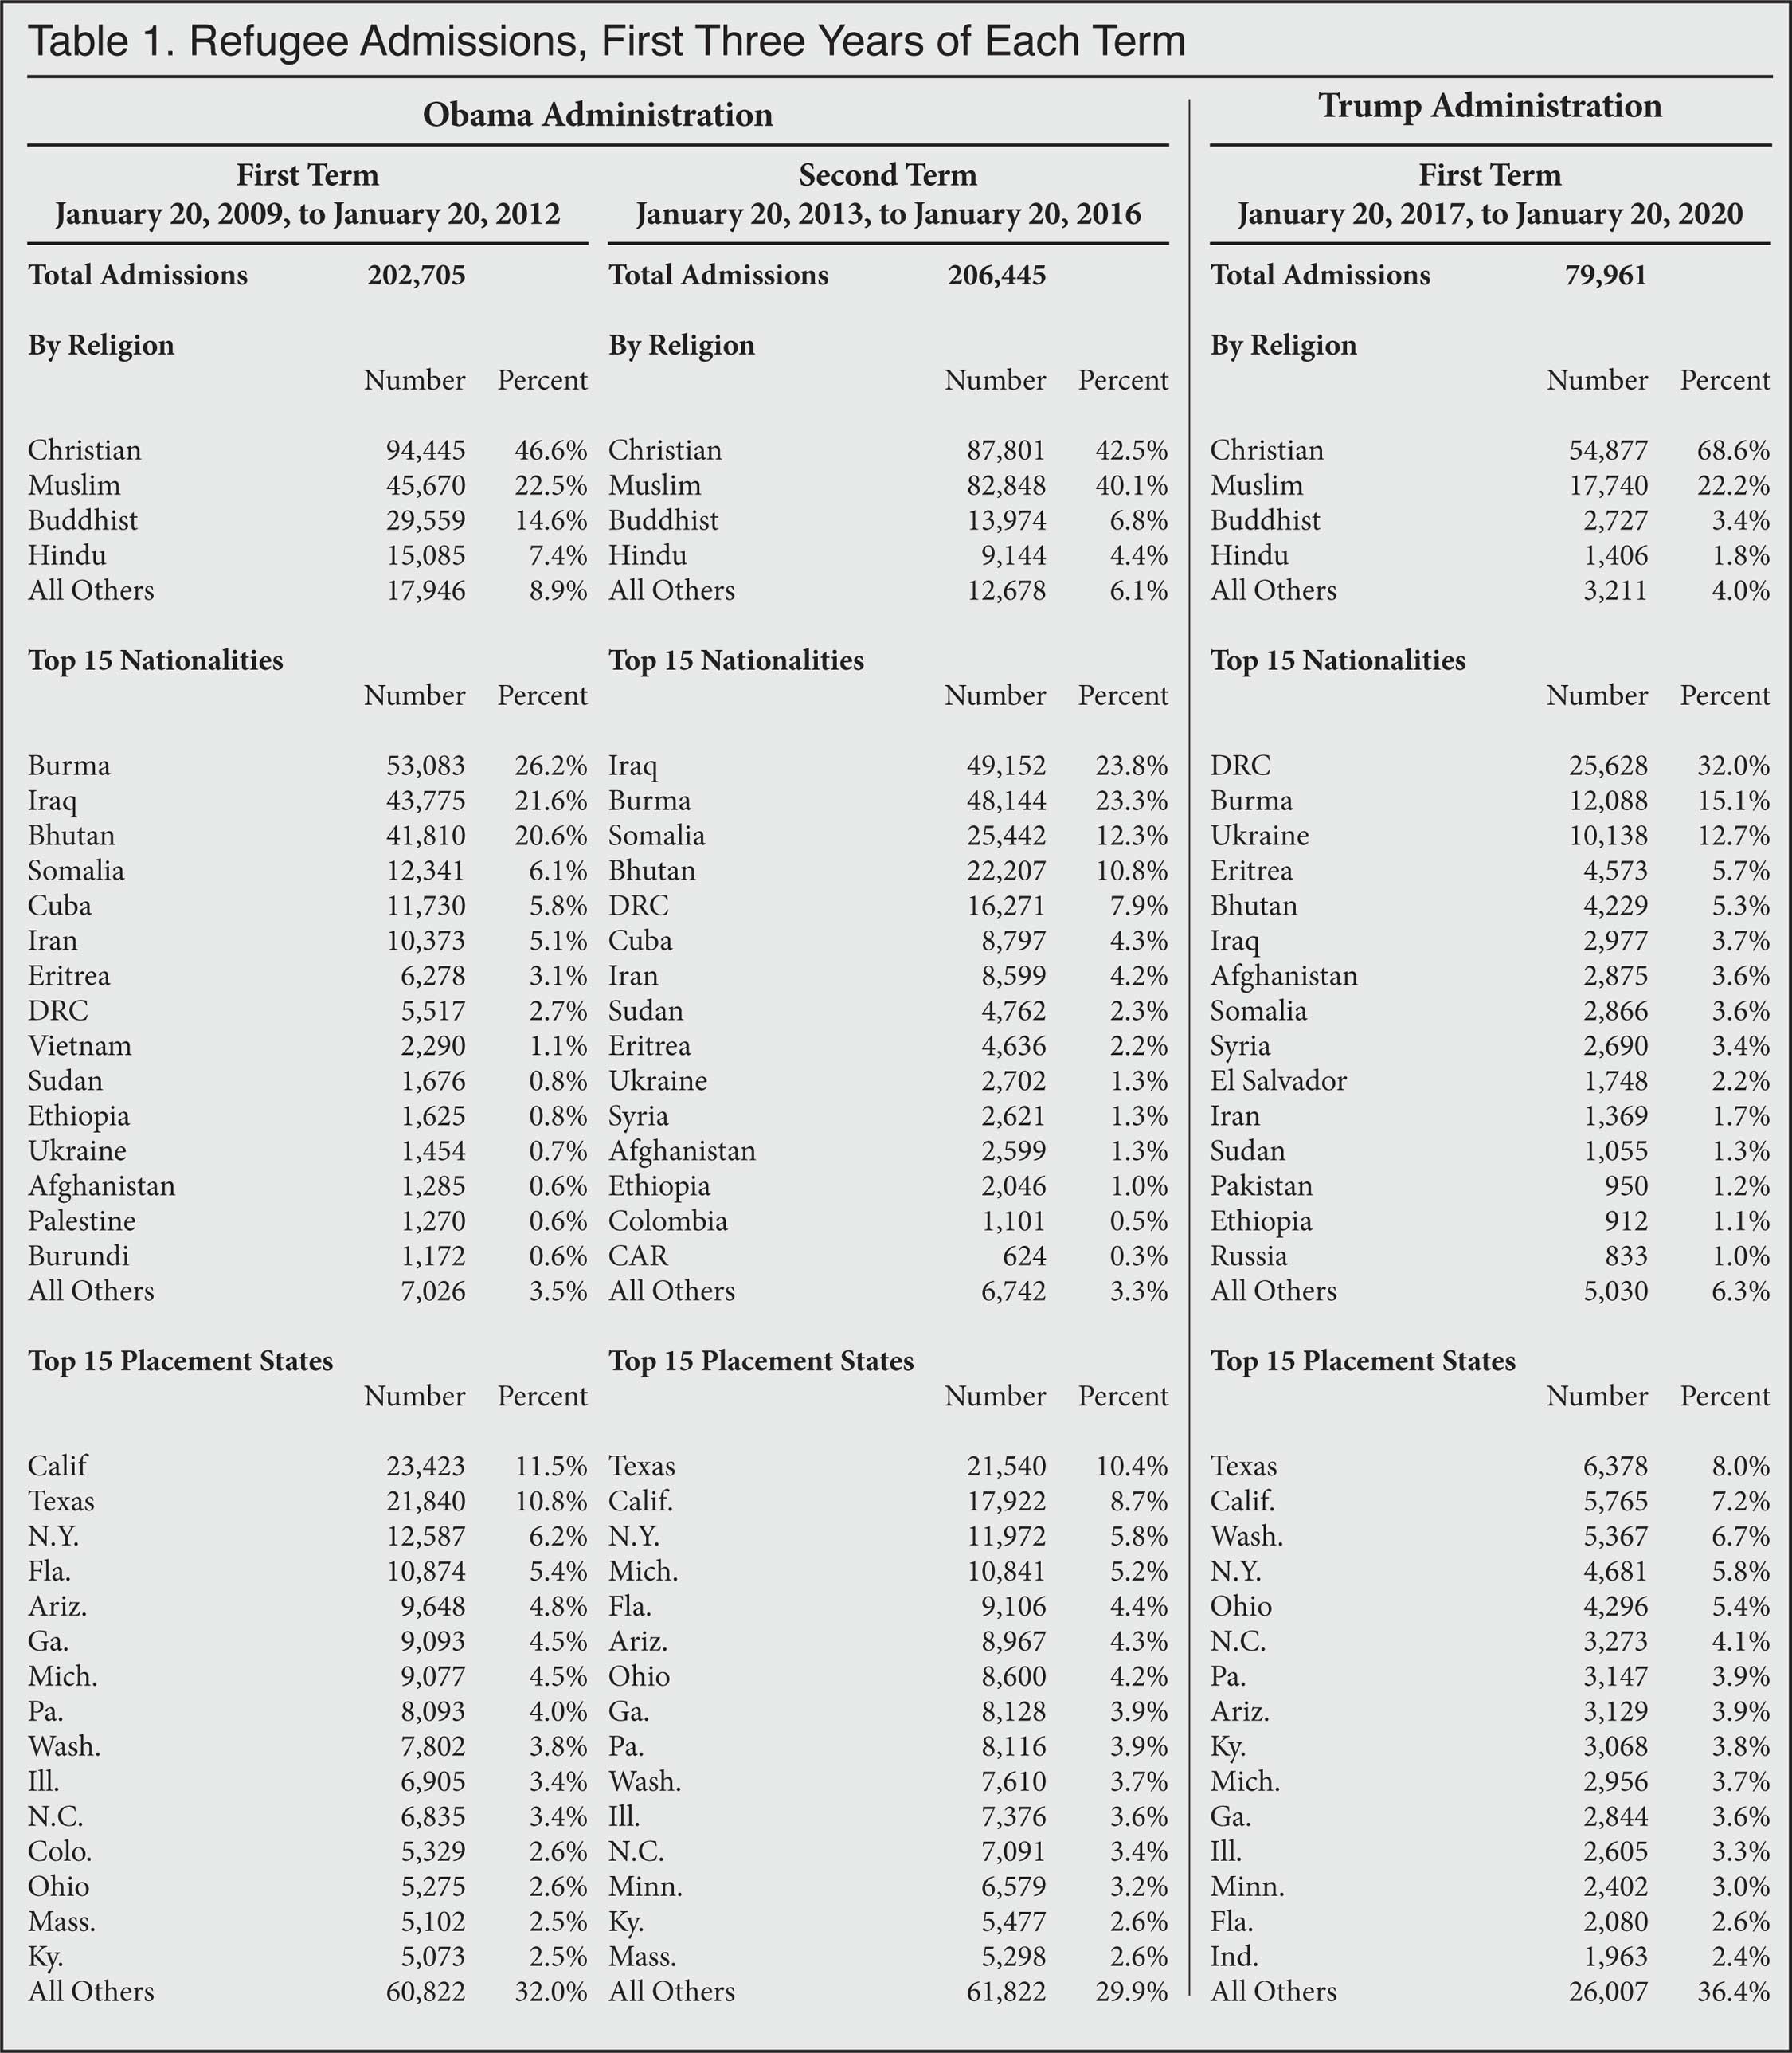
- The Obama administration resettled more than 200,000 refugees during the first three years of each of its two terms. The Trump administration resettled almost 80,000 refugees during its first three years.
- Christians were the largest religious group in all three periods. They constituted 47 percent and 43 percent, respectively, during the first three years of the first and second Obama terms, and around 69 percent during the first three years of the Trump administration.
- Muslims accounted for 23 percent of all refugees admitted during the first three years of the Obama administration’s first term, and for 40 percent the second term. Under the Trump administration's first three years, Muslims accounted for over 22 percent of all admissions.
- Buddhists and Hindus accounted for 22 percent of all refugees admitted during the first three years of the Obama administration’s first term, and for 11 percent the second term. Under the Trump administration' first three years, Buddhists and Hindus accounted for over 5 percent of all admissions.
- The top five countries of origin of resettled refugees during the first three years of the Obama administration's first term were Burma (26.2 percent); Iraq (21.6 percent); Bhutan (20.6 percent); Somalia (6.1 percent); and Cuba (5.8 percent).
- The top five countries of origin of resettled refugees during the first three years of the Obama administration's second term were Iraq (23.8 percent); Burma (23.3 percent); Somalia (12.3 percent); Bhutan (10.8 percent); and the Democratic Republic of Congo (7.9 percent).
- The top five countries of origin of resettled refugees in the first three years of the Trump administration were: the Democratic Republic of Congo (32.0 percent); Burma (15.1 percent); Ukraine (12.7 percent); Eritrea (5.7 percent); and Bhutan (5.3 percent).
- The top five placement states in the first three years of the Obama administration's first term were California (11.5 percent); Texas (10.8 percent); New York (6.2 percent); Florida (5.4 percent); and Arizona (4.8 percent).
- The top five placement states in the first three years of the Obama administration's second term were Texas (10.4 percent); California (8.7 percent); New York (5.8 percent); Michigan (5.2 percent); and Florida (4.4 percent).
- The top five placement states in the first three years of the Trump administration were Texas (8.0 percent); California (7.2 percent); Washington (6.7 percent); New York (5.8 percent); and Ohio (5.4 percent).
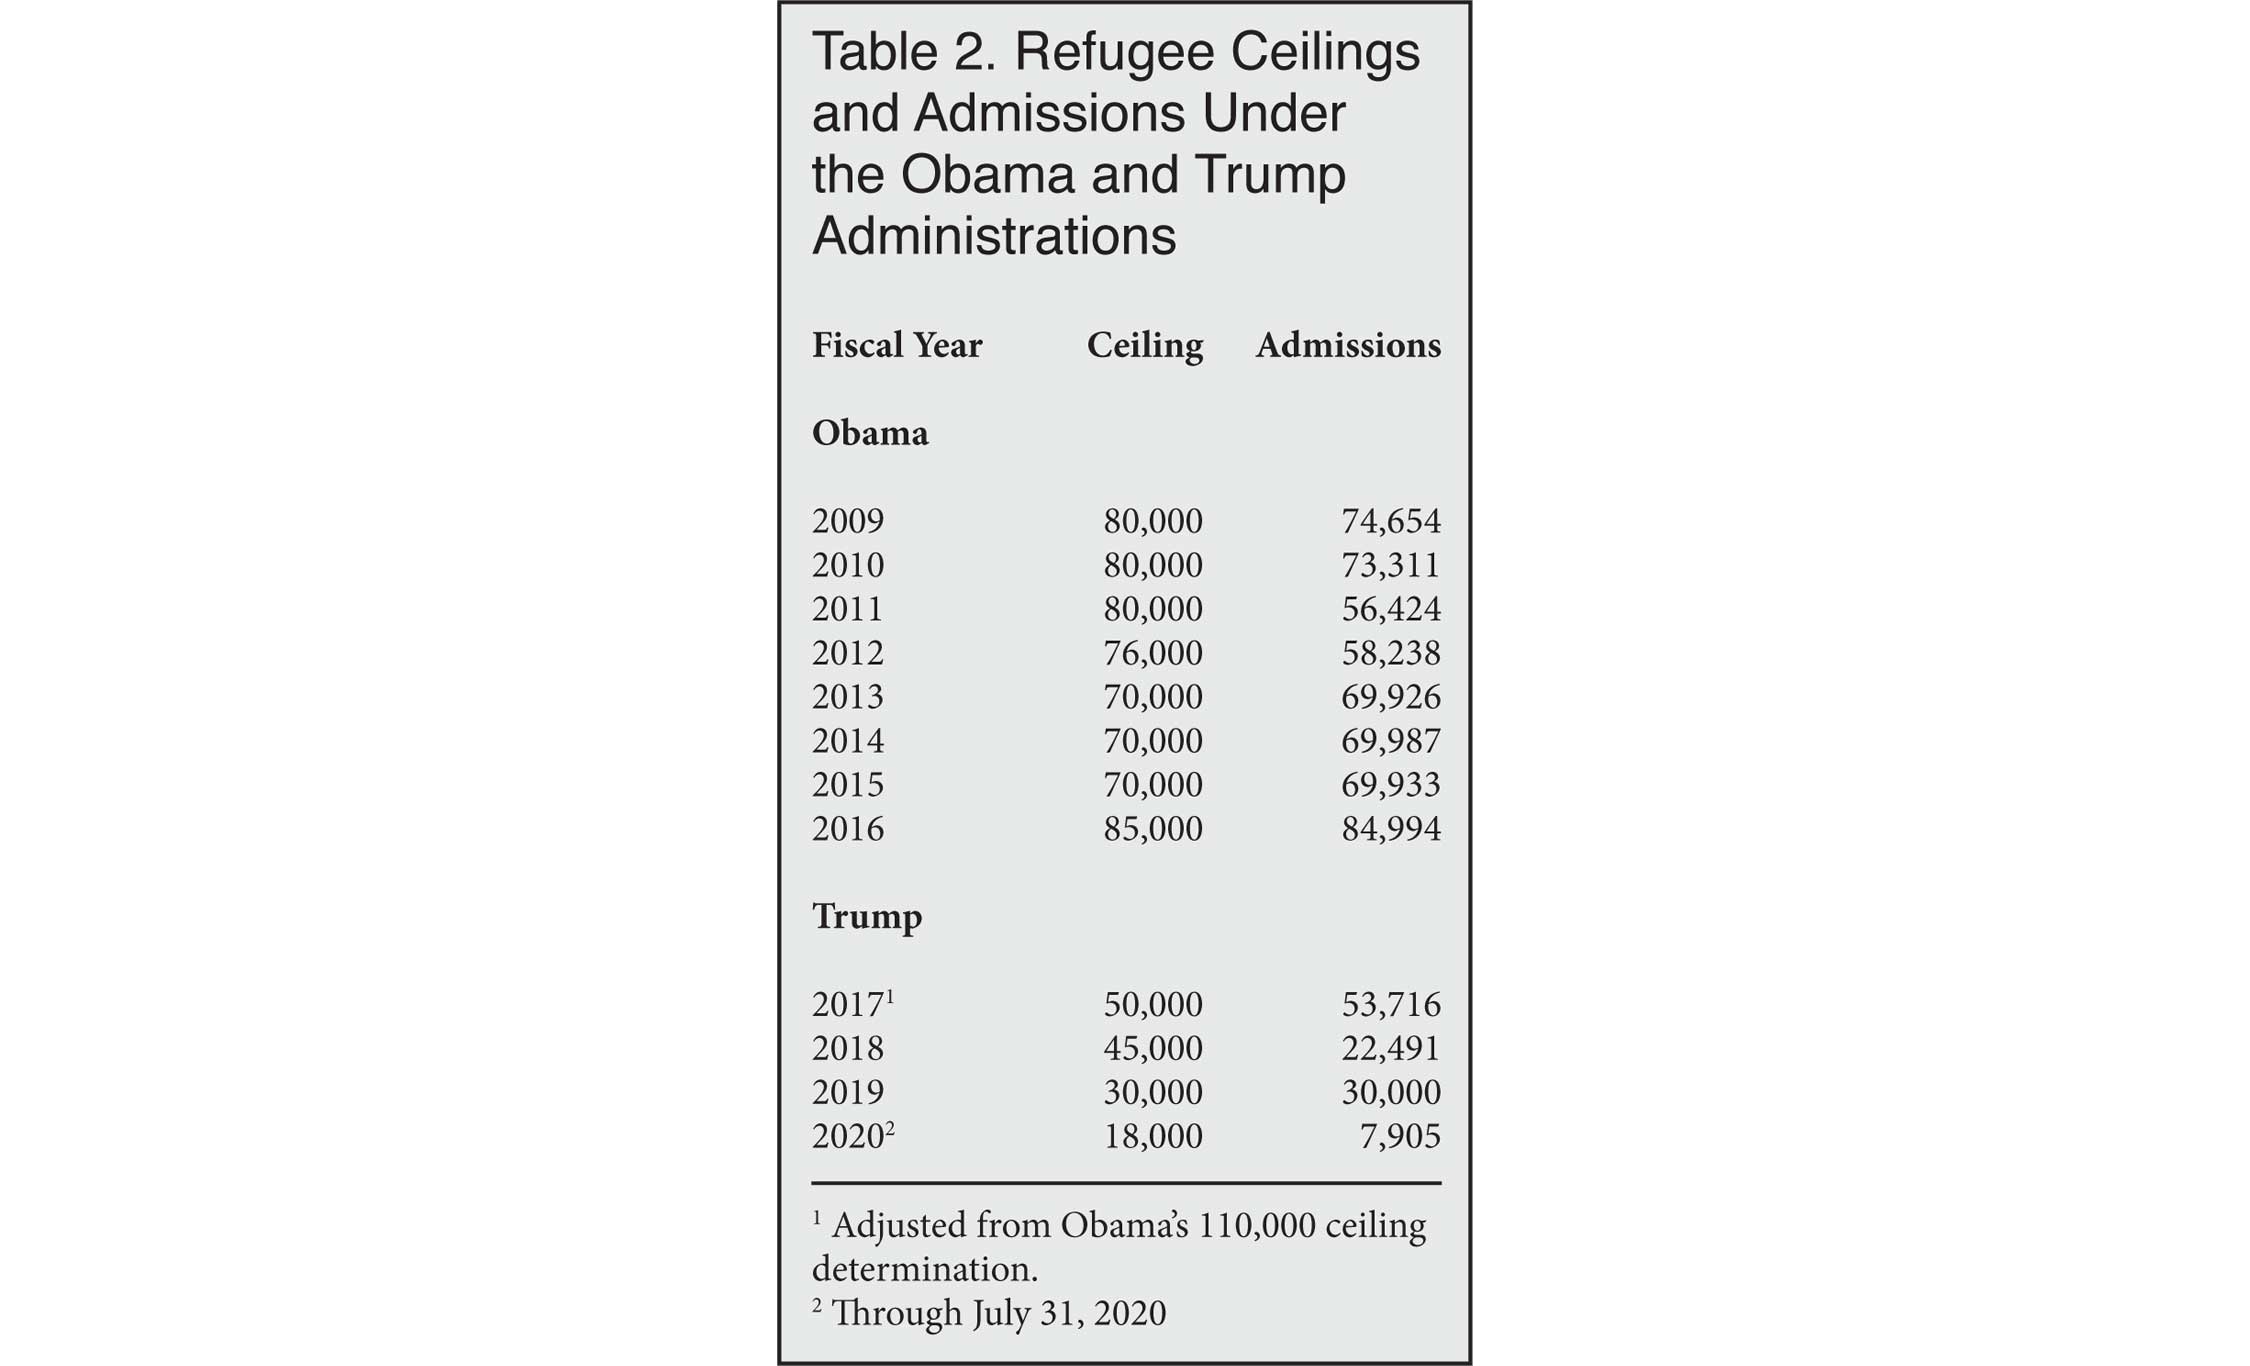
- Refugee ceilings under the Obama administration ranged from 70,000 to 110,000 (the FY 2017 ceiling of 110,000 was later lowered by President Trump to 50,000); admissions ranged from 56,424 to 84,994.
- Under the Trump administration, refugee ceilings ranged from 18,000 (for FY 2020) to 50,000; admissions ranged from 30,000 to 53,716 (FY 2020 admissions are not included here).
 |
 |