Download a PDF of this Backgrounder.
Preston Huennekens is a research associate at the Center for Immigration Studies.
Key Points
- Issuances of H-2A visas for foreign agricultural guestworkers have tripled since 2007, growing an average of 13 percent a year.1
- H-2A workers were paid less than the average nationwide wage in 2017.
- Over half of all H-2A workers are concentrated in just five states: North Carolina, Washington, Florida, Georgia, and California.
- The crops with the largest number of H-2A workers are apples, tobacco, blueberries, and "fruits". These four crops, out of 165 crops identified by the Department of Labor, accounted for 20 percent of all H-2A workers in 2017.
Introduction
The H-2A program allows U.S. companies to employ foreign guestworkers in temporary positions related exclusively to agriculture. This separates it from its cousin, the H-2B program, which allows companies to hire guestworkers for non-agricultural positions and is cap-limited.
H-2A, because it is only an agricultural program, has no visa cap. Foreigners with the H-2A visa can stay and work in the United States a maximum of three years before having to return to their home countries, albeit only for a period of three months. After that three months, they are free to apply for the visa again and return to the United States to work.
The program has its roots in the original blanket H-2 visa, which has been on the books since the 1950s. In 1986, Congress passed the Immigration Reform and Control Act (IRCA, commonly known as the Reagan Amnesty), part of which divided the H-2 program into the H-2A and H-2B visas.2
The H-2A visa is uncapped to encourage as many farmers as possible to legally hire their workers. In a February 2018 Successful Farming article, the author remarked that "the 'elephant in the room' is that many farmworkers are not legally employed in the United States. More than half of all farmworkers are unauthorized to work in the United States, according to a National Agricultural Worker Survey."3
The H-2A program in theory should reduce the number of foreigners working illegally in agriculture jobs, but that clearly has not been the case. A closer look at the H-2A program reveals interesting details.
H-2A Workers Are Paid Less than National Averages
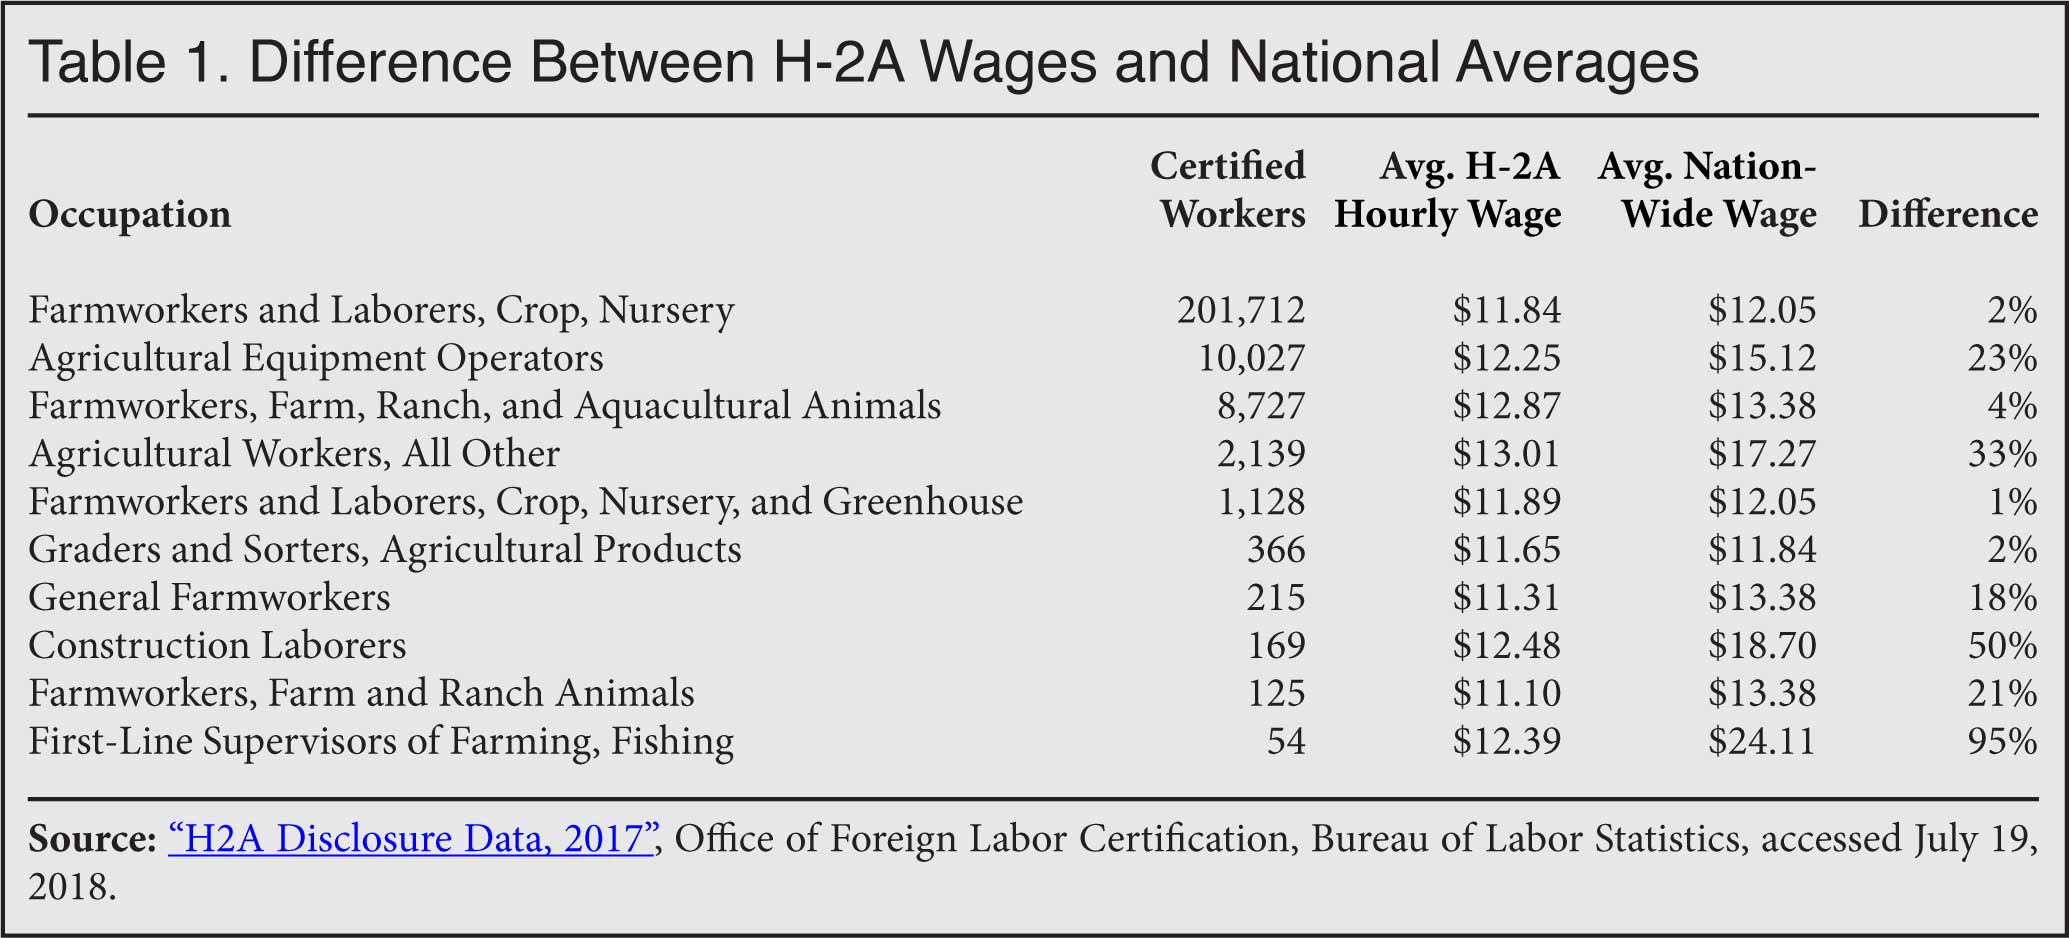
The Department of Labor certified H-2A workers in 31 different job categories, but nearly all (99.86 percent) work in one of 10 DOL job categories:

The average hourly wage for all H-2A certified workers was $12.01 per hour, well above the federal minimum wage of $7.25 per hour. At first glance, it is easy to see why many scoff at the notion that guestworkers are paid low wages.
But equating these jobs to those paying the minimum wage is comparing apples to oranges. As the same Successful Farming article clarified, "farms of all types and sizes are moving to replace labor with new technology. Over time, the result has meant fewer laborers — and higher wages."
The Bureau of Labor Statistics captures average wages for occupational categories and publishes them in its "Occupational Employment Statistics" report, the most recent of which was published in May 2017.4
The same occupational categories are listed in the "H-2A Disclosure Data" report, also published by the Department of Labor.5 By comparing the information from these two reports we can see if H-2A guestworkers are paid at the national average.
The results are clear: H-2A workers are paid less than the national average in each of the top-10 occupational categories.
The differences are more pronounced in some categories than in others. For instance, most ordinary farmworkers are paid only slightly less than the average, around 1 percent to 4 percent less. But others, such as agricultural equipment operators, construction laborers, and supervisors are paid significantly under the average, between 23 percent and 95 percent less.
Half of H-2As Are in Just Five States
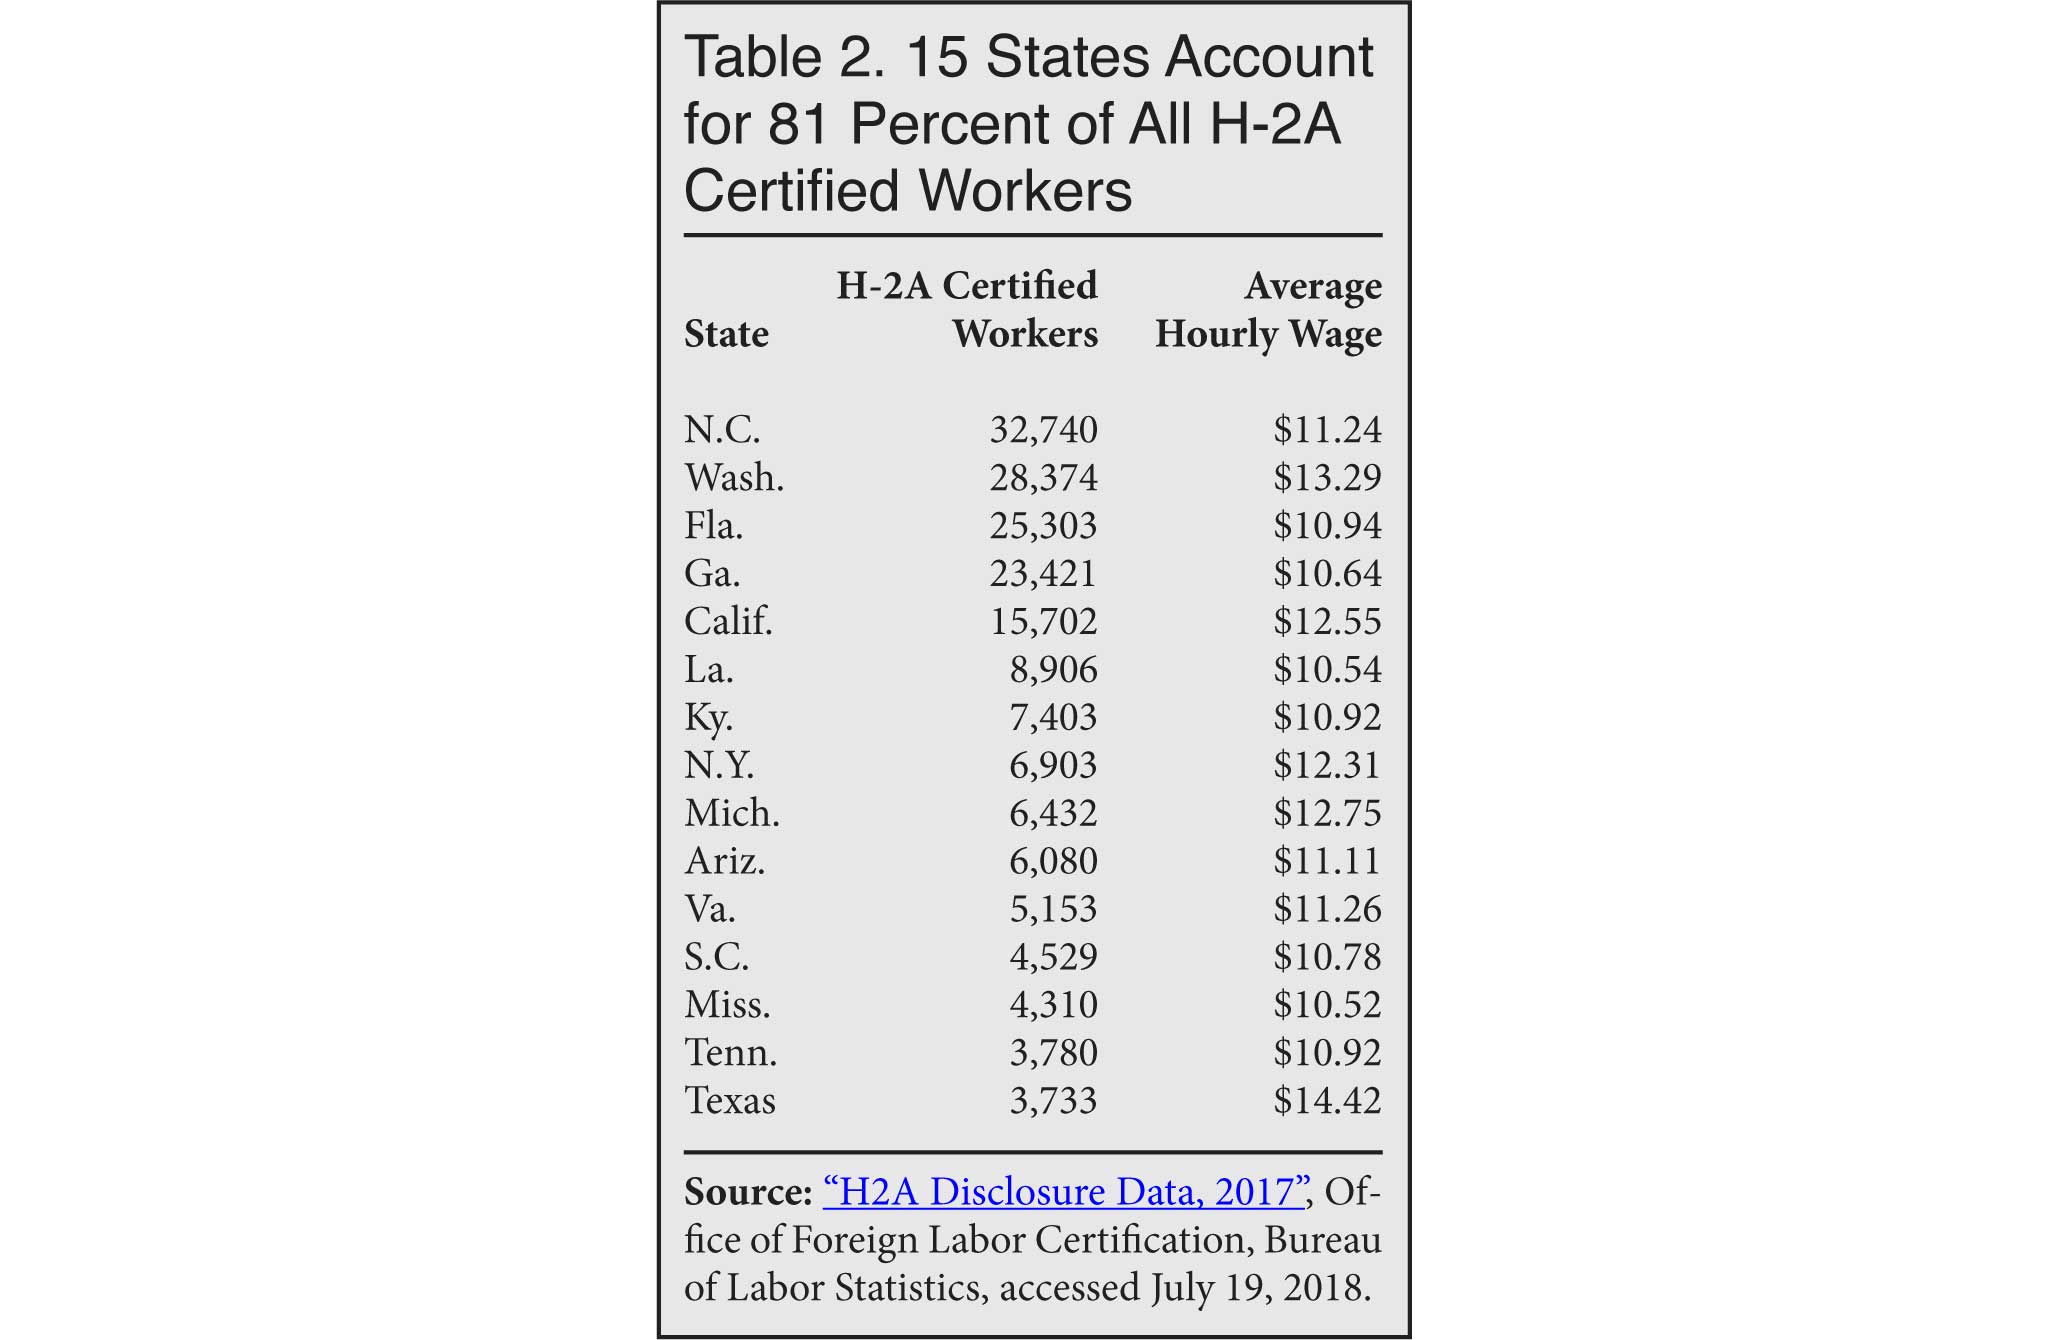
Approximately 55.8 percent of all H-2A-certified workers are concentrated in just five states: North Carolina, Washington, Florida, Georgia, and California. While this is not particularly surprising given the agricultural nature of those states' economies, it shows that the program is only heavily utilized by a handful of states.
Additionally, 15 states account for 81 percent of all H-2A certified workers, as shown in Table 2. Some states with major farm sectors, including the entire mid-section of the United States, nevertheless have few employers sponsoring H-2A farmworkers.

20 Percent of H-2As Labor on Just Four Crops
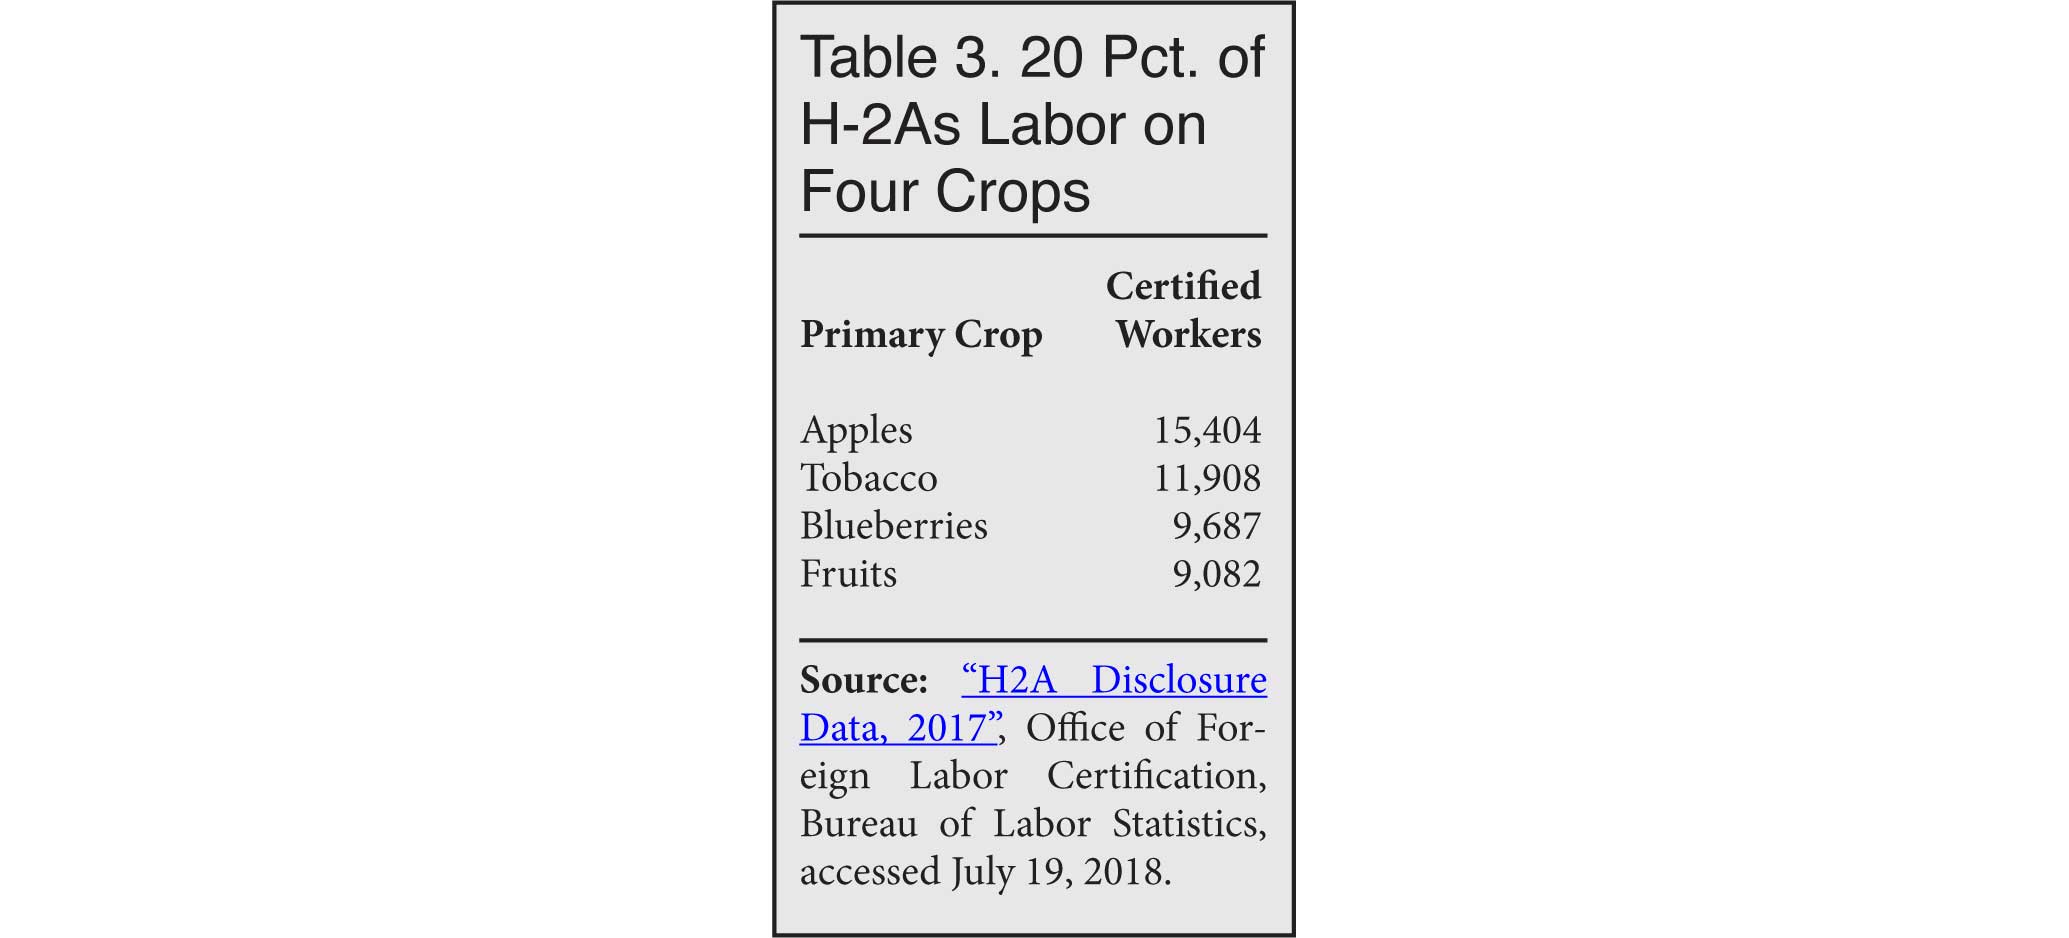
A fifth of H-2A workers are assigned to just four crop categories, according to the Department of Labor. (See Table 3.) The disclosure data lists the type of crop that each H-2A certified worker would be tending to. A total of 165 crop categories were registered in the 2017 data, but it includes ambiguous categories such as "general farmworkers" or "fruits and vegetables".

H-2A Visa Issuances Continue to Grow
The H-2A program is similar to the H-2B program in that certifications from DOL do not necessarily equal the final number of guestworkers who enter the United States. But unlike H-2B program, H-2A visas are not capped and can grow or shrink without additional involvement by Congress.6
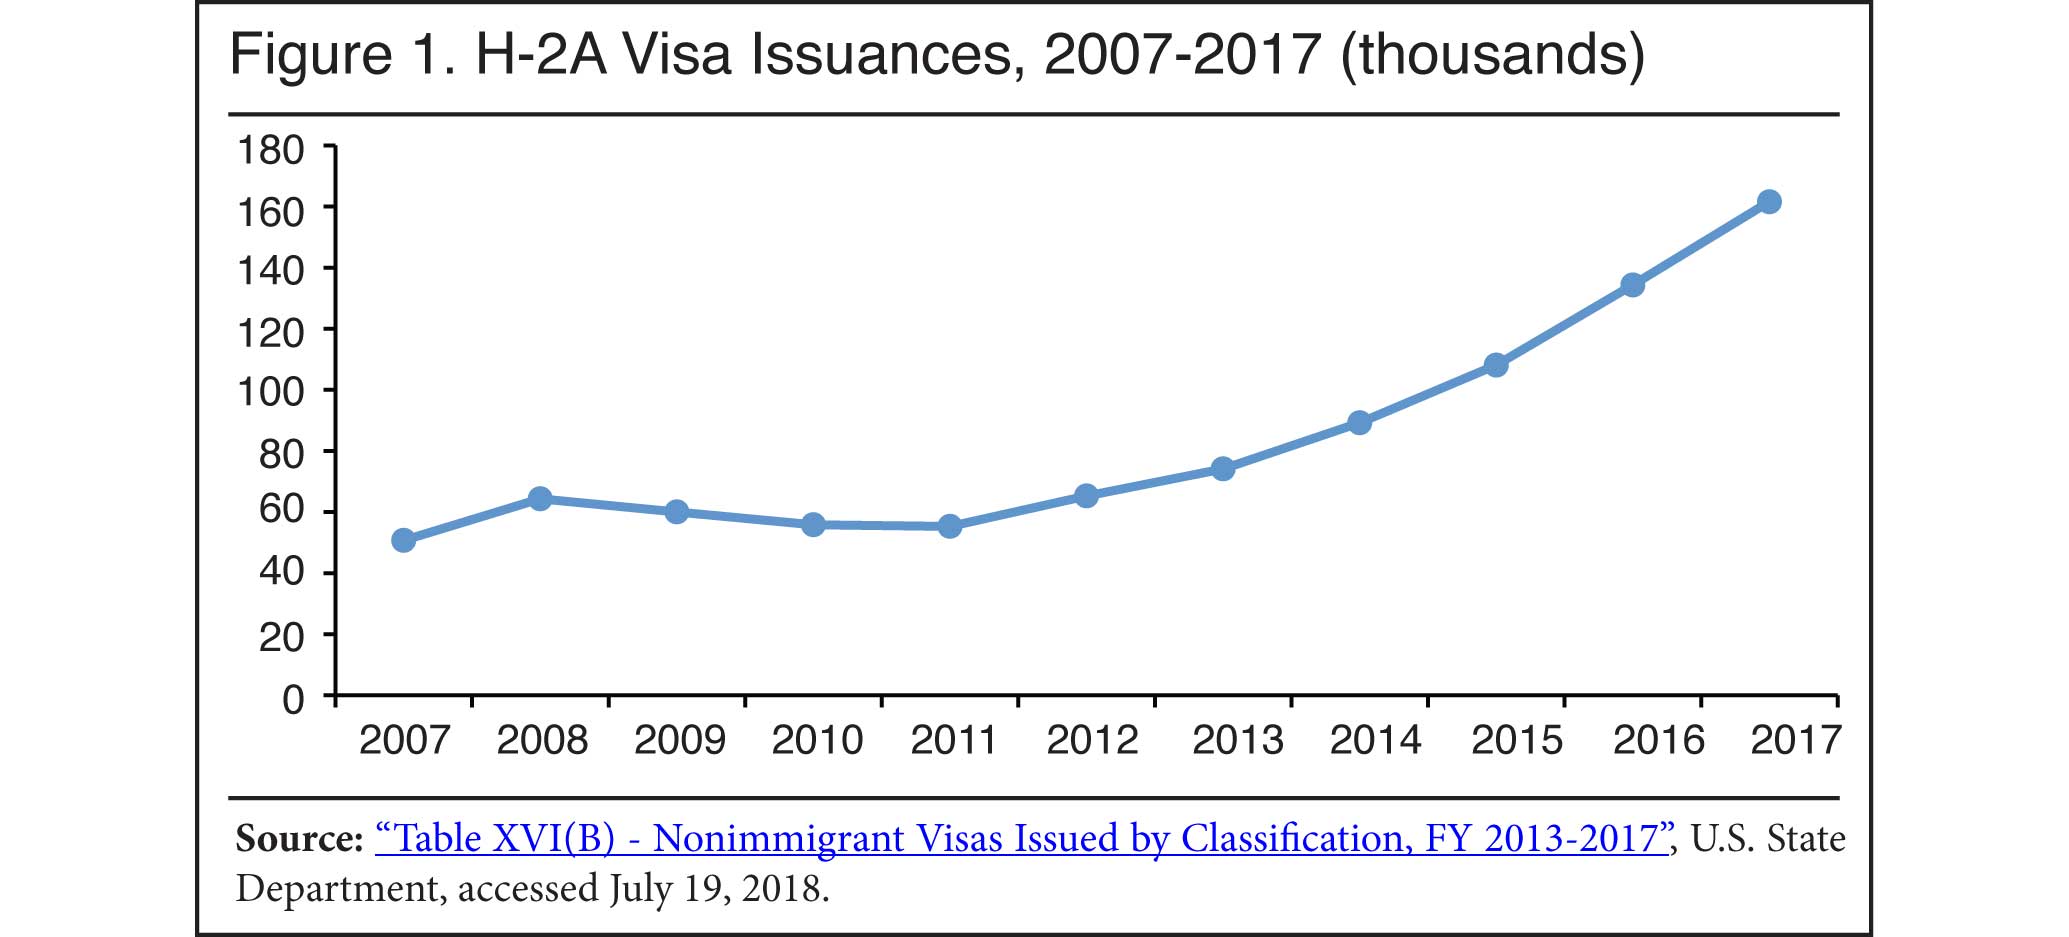
That has allowed H-2A visa issuances to soar in just 10 years. The H-2A program has seen a 218 percent increase between 2007 and 2017. On average, the number of visas increases 13 percent per year and has not decreased since 2011. Following this trajectory, the number of issuances in 2018 could peak over 180,000. (See Figure 1.)

Conclusion
The growth of the H-2A program attracts little fanfare, mainly because it is not as controversial as the H-2B program. That being said, the H-2A program is not without shortcomings.
It is concerning that average H-2A wages are below national averages. The agricultural business lobby is one of the most powerful in America. In 2017, the agribusiness sector spent more money lobbying congress ($131.9 million) than defense contractors ($127.4 million), according to Open Secrets.7 Large agribusinesses are more than happy to import thousands of H-2A non-immigrant guest-workers and pay them below national averages. This may have some bearing on the relative lack of congressional attention to the H-2A program and wages for H-2A farm workers.
As the H-2A program continues to grow in popularity year after year, it is important that policymakers take note of some of the shortcomings of the program and address them as needed.
End Notes
1 "Table XVI(B) - Nonimmigrant Visas Issued by Classification, FY 2013-2017", U.S. State Department, accessed July 19, 2018.
2 "Immigration Reform and Control Act of 1986", Congress.gov, accessed July 19, 2018.
3 John Walter, "Help Wanted: How Farmers Are Tackling a Labor Shortage", Successful Farming, February 5, 2018.
4 "Occupational Employment Statistics", Bureau of Labor Statistics, May 2017.
5 "H2A Disclosure Data, 2017", Office of Foreign Labor Certification, Bureau of Labor Statistics, accessed July 19, 2018.
6 David North, "Open-Borders Advocates Slip EB-5 and H-2B Extensions into Spending Bill", Center for Immigration Studies blog, May 2, 2017.
7 "Ranked Sectors, 2017", Center for Responsive Politics, accessed July 19, 2018.
