Introduction
Immigration-related data for the past year reflect a continuing increase in the number of new immigrants. Those persons entering legally in fiscal year 1993 for permanent residence increased by about 89,000 — or ten percent — compared to the previous year. Not included in this calculation is the continuing, and perhaps growing, large influx of illegal immigrants. Altogether, the total of new residents in FY-93 is over one-and-a-quarter million.
The immigrant tide is rapidly changing the face of America. Between the 1980 and 1990 censuses, the U.S. population grew in size by about 23.1 million persons — slightly over ten percent. During the same period, the foreign-born population size grew by over 40 percent.
Thus, the rate of increase of the foreign born at the beginning of this decade was about four times as great as the rate of increase for the country as a whole. At that level of immigration, newcomers accounted for slightly more than a quarter of all population growth. Then, in 1990, Congress increased legal immigration by about one-third. At the present rate, immigration likely will account for about one-third of all population growth during this decade. Those shares of population growth attributable to immigration — one-quarter in the 1980s and one-third in the 1990s — would be even higher if the U.S.-born children of immigrants were not excluded from the calculation by virtue of being native-born U.S. citizens. Furthermore, the Census Bureau reports that the current trend in immigration will result in the years ahead in a still higher share of population growth attributable to immigration as native-born population growth levels off.
Although the Immigration Act of 1990 (IMMACT-90) established a new "cap" on the level of newcomers, the number of admissions is still increasing because the provisions are flexible and can be stretched. For example, over the past year, much of the increase in legal immigration was due to granting permanent resident status to Chinese students who earlier, after the Tiananmen Square crackdown in China, had received permission to stay here temporarily.
This continuing flexibility in administering the immigration law places in question the assumption of the U.S. Census Bureau that net immigration will hold steady at a rate of 880,000 per year. That assumption was revealed as questionable last year when the Immigration and Naturalization Service (INS) increased by 50 percent its official estimate of the arrival level of illegal immigrants — up from 200,000 to 300,000. The last two Census Bureau projections of U.S. population assumed an annual influx of 200,000 illegal immigrants. For that reason, we have not used the Census Bureau's current projection of 393 million for the U.S. population at mid-century. A projection of 400 million in the year 2050 — during the lifetime of today's young people — seems more likely. That is 60 percent higher than the 1990 census figure.
The INS reports that apprehensions of illegal aliens increased by five percent in FY'93, continuing the upward trend since FY'89. The rise in apprehensions, to over 1.3 million last year, suggests that the number of those who elude the INS and succeed in their illegal entry may also be rising. Major inroads since the end of FY'93 in reducing illegal border crossing at El Paso, Texas as a result of "Operation Hold the Line" and in the San Diego, California area may contribute toward reversing this trend.
The current U.S. refugee resettlement level is 121,000. To put this program into perspective, it is useful to note that 121,000 is less than one-tenth of one percent of the world-wide refugee population.
The intent of this Backgrounder is to pull together for ready reference the most relevant statistics that define the magnitude of the population/immigration issues facing the United States. For the most part, the data are taken from official sources. In some cases the numbers are estimates, as is necessary to project future change or to attempt to quantify illegal immigration. Often estimates from different sources will vary widely. In those cases, the estimates used are those that appear most consistent with other related data.
It is the hope of the Center for Immigration Studies that this statistical compendium will prove useful to those who are grappling with these complex issues. Comments, suggestions and contributions of additional statistical information that may be of general interest are welcome. Other selected data will be reported in Immigration Review, the quarterly journal of the Center for Immigration Studies, as they become available.
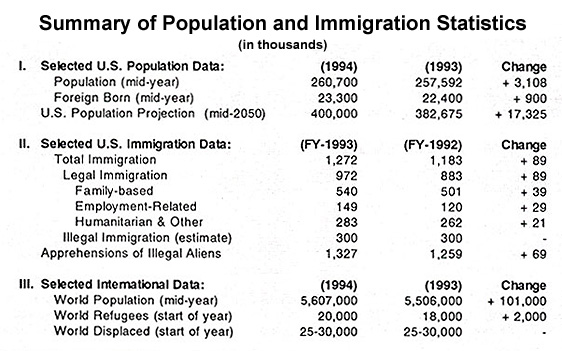
Selected U.S. Population Data
U.S. Population: 260,700,00 (July 1994)
The mid-1994 population of the United States is estimated by the Census Bureau likely to be 260.7 million. This is about 3.1 million more people than the estimated population for 1993 (257.6 million), and it is 11.3 million more persons than the 1990 census found (249.4 million).
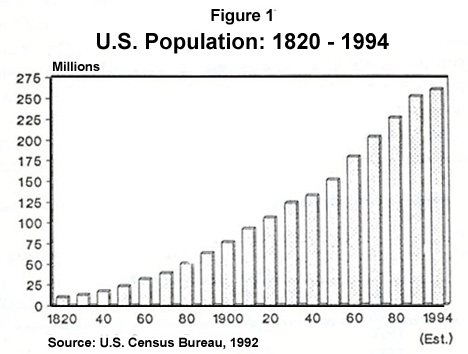
The current annual rate of increase (about 1.1%) — a factor of the nation's birth rate, mortality rate and net immigration — continues the nation's historical upward trend in population growth (see Figure 1). Less than sixty years ago, during the lifetime of many of today's Americans, the population of the country was half of the current level. The population of the United States has quadrupled since 1892, also during the lifetime of a few Americans.
U.S. Foreign-Born Population: 23,300,000 (July 1994)
About one in thirteen people resident in the United States in 1990 was foreign born (19.8 million or 7.9%). Two-fifths (8 million) were U.S. citizens by naturalization and three-fifths (11.8 million) were non-citizen residents — whether legally or illegally. If the reported 7.9 percent share of the total population held constant, the number of foreign-born residents in 1994 would be 20.6 million. However, the foreign-born share of the population is rising — in 1980 it was 6.2 percent. And, because of the undercount in the census of the foreign born, especially that part comprised of illegal immigrants — acknowledged by the Census Bureau — the growth of the foreign-born share is likely to be underestimated.
An alternative approach to estimating the current number of foreign-born residents is to use the trend of change in their numbers. Between the 1980 and 1990 census enumerations, the number of foreign born in the United States rose from 14.1 million to 19.8 (5.7 million, or a 40% increase). That represents an average net increase of 3.5 percent per year over the decade as a result of immigration. If that 3.5 percent growth trend is applied to the period since 1990, then the 1994 foreign-born population would be 22.7 million. However, we know that the rate of increase has been bolstered by provisions of the IMMACT-90 and, therefore, will be higher than the earlier 3.5 percent average rate of increase.
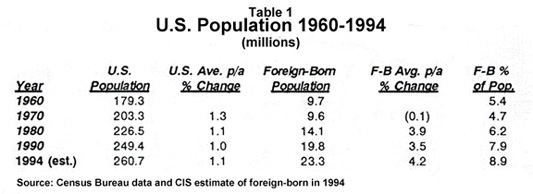
A third approach to estimating the 1994 foreign-born population is to use the Census Bureau's 1993 parameters for its census projection. The Bureau estimates that since 1990 the level of immigration is 880,000, about one-third of the annual U.S. population growth of 2.8 million. The 880,000 is a net figure resulting from immigration of 1,040,000 and emigration of 160,000. The death rate among the resident foreign-born (about 13 per 1,000) would further reduce the annual net increase in the foreign-born population to about 870,000. Adding four years of that level of increase to the 19.8 million foreign-born in the 1990 census results in a 1994 estimated foreign-born population of 23.3 million (see Table 1). This places the current foreign-born share of the U.S. population at 8.9 percent. It should be noted, however, that this estimate of the foreign-born probably is still too low, because the starting point is based on the 1990 census (with its undercount problem), because legal immigration is rising and because of the Bureau's low estimate for illegal immigration.
Projecting to the end of the century on the basis of the current trend, the foreign-born share of the u.s. population is likely to further rise to about ten percent. This is a major demographic change from the average of about five percent of U.S. population that was foreign-born as recently as the 1960s and 1970s. The rapid change is due to a combination of increased legal and illegal immigration and the expanded humanitarian entry program.
The current estimated rate of change in the foreign-born population (4.2%) compared with the comparable rate of change for the general population (1.1%) — nearly a 4:1 ratio — reveals why the foreign-born share of the U.S. population has been steadily increasing over recent years and will grow more rapidly in the future, if the current level of immigration is maintained.
The settlement pattern of newcomers to this country has long reflected concentrations of immigrants in certain regions, cities and even neighborhoods. One of the major factors in the currently contentious debate over immigration policy and the costs of immigration is the fact that, in addition to their rapidly growing numbers, immigrants tend to concentrate in just a few states. Thus, the expenses for educating young foreign language speakers, for providing English language instruction for adults, and for providing medical and social welfare programs are borne disproportionately by those heavily-impacted jurisdictions. Yet the states have no control and little influence over immigrant admission policy or settlement patterns.
The concentration of immigrants is reflected in data on the foreign born from the 1990 census. The settlement pattern for states, counties and municipalities is shown in Table 2. The top four states account for 63 percent of the foreign-born population. Over four-fifths (81.1%) of the foreign-born are located in the top ten states. Over a fifth of California's population and one-eighth of New York's population was foreign-born in 1990. Recent INS data (from the 1992 Statistical Yearbook) reflect a similar pattern. Data on intended residence of 973,977 new legal residents — at least 163,000 of whom were already in the country as long-term illegal residents — identify six states (California, New York, Texas, Florida, New Jersey and Illinois) as the destination of nearly three-quarters (73.4%) of the new residents.
Turning to the local level, the 1992 INS data reveal a similar pattern of concentration. The Los Angeles and New York Metropolitan Statistical Areas (MSA) were the intended residence of over one-quarter (26.4%) of the new residents. With the addition of the next three MSAs (Chicago, Anaheim-Santa Ana and Miami-Hialeah) that share rises to over 37 percent of the annual immigrant intake (see Table 2). The pattern of intended settlement in this INS data is almost identical with the foreign born data revealed in the 1990 census, except Washington, D.C., moves into the top ten municipalities in the more current INS data — in sixth place.
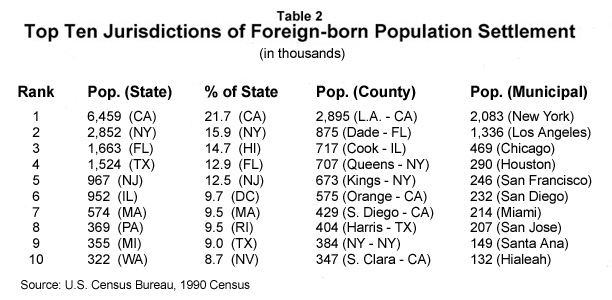
The shifting pattern of immigrant settlement may be seen by comparing data as recent as the 1960 census with the most recent data. New York had a larger foreign-born population than California in 1960, and the combined share of these two states was over one-third (37.3%) of the total, rather than the nearly half (47.1%) these two states account for now. Florida, now the third most popular settlement state for immigrants, was tenth in 1960. The traditional manufacturing states (Illinois, Pennsylvania, Michigan and Ohio) that were, respectively, the third, fifth, seventh and eighth most populous areas for the foreign born in 1960, now have dropped to sixth, eighth, ninth and fifteenth.
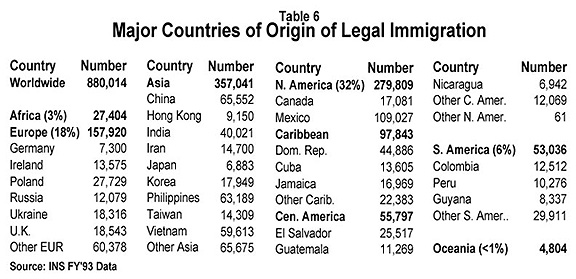
The 1990 census data on countries of origin of the foreign born are shown in Table 3. Immigrants from Mexico constitute over one-fifth (21.7%) of all foreign-born residents. Again, it should be remembered that this data suffers from an undercount, especially of illegal immigrants, which the "legalization" program mandated by IRCA revealed to be comprised in large measure by Mexicans. Following Mexico's 4.3 million immigrants, in order of magnitude, were the Philippines (913,000), Canada (745,000), Cuba (737,000) and Germany (712,000). Also accounting for over half a million immigrants were the United Kingdom, Italy, Korea, Vietnam and China. These top ten countries account for over half (51.9%) of all foreign-born residents. If the Chinese from Taiwan and Hong Kong are added to those from the mainland, the Chinese account for 921,000 — making them the second most populous immigrant population.
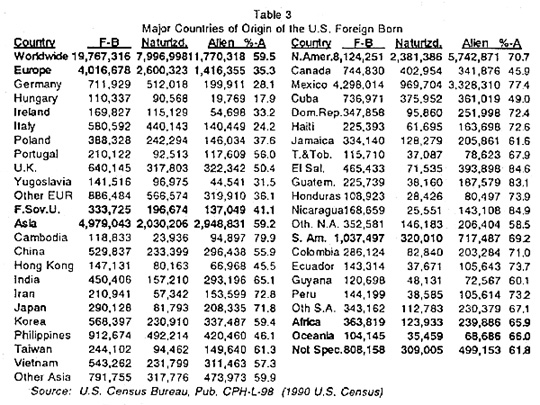
The Census Bureau data on the U.S. foreign-born also reveal the wide variation among nationalities in becoming naturalized U.S. citizens. Included in the data are some illegal immigrants and recent immigrants who are not eligible to become citizens. Nevertheless, that does not explain the great difference in naturalization rates between Hungarians, Germans or Italians, for example, most of whom have become U.S. citizens, and immigrants from countries such as Japan, Iran, Cambodia, Mexico or other Latin American countries — except Cuba — most of whom have retained their foreign nationality.
The Center estimates that the number of resident illegal immigrants in 1994, from all sources, is about 5.1 million, or about one-fifth of the foreign-born population. That is more than one-fourth (27.5%) higher than the estimate of the INS. Inasmuch as the INS is using the same estimate as the Center for post-IRCA annual new illegal settlement in the United States since last year, the difference in the estimates is the size of the illegal immigrant population at the end of the legalization program. Illegal immigrants who entered the U.S. after 1982 were not eligible for the amnesty — except for seasonal agricultural workers. In addition, some illegal immigrants with jobs and established identities did not apply in order to avoid the risk inherent in making a new start. Estimates at the outset of the legalization program were that half or more of an estimated four to ten million illegal immigrants would apply. In fact, the illegal population that applied for legalization was slightly above three million.
The INS Statistical Analysis Branch reported to Congress in 1989, after the legalization program had closed, that as of December 1988 the illegal population had been reduced to approximately 1.5 to 3.0 million. The Center concluded that the INS over-estimated the success rate of the legalization program and the more likely residual number of illegals in 1988 was about 3.4 million, with as many as a third having been ineligible because they entered after the 1982 cutoff date. The INS estimate of the illegal population — 3.4 million in 1992, presumably increasing to 4.0 million in 1994 — presupposes a 1988 post-IRCA population of resident illegals of two million. To the Center's base of 3.4 million is added an estimated net increment of 250,000 in 1989 and 1990 and 300,000 per year since then, for a 1994 total of about 5.1 million illegal immigrants.
U.S. Population Projection: 400,000,000 (July 2050)
Since 1989, the Census Bureau has released three projections of U.S. population through the year 2050, most recently in October 1993. In each of these three studies, the Census Bureau has increased the most likely population size. In 1989, the mid-century projection was for a population of 300 million. In 1992, the estimate was raised to 383 million. Last year the projection was raised again to 392 million residents.
The projections are based on varying assumptions. There are "high," "low," and "middle" scenarios. The middle projection is considered the most likely. The last three middle projections are shown in Figure 2. Especially notable is the difference between the 1989 and 1992 projections. The earlier one portrayed U.S. population peaking just above 300 million in 2040 and then beginning to decline slightly.
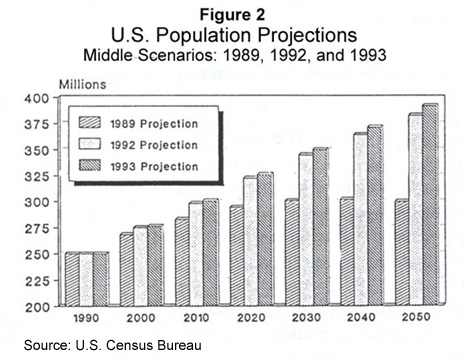
The Census Bureau attributed the enormous increase in the 1992 projection to three factors, all of which involved immigration: (A) the 1990 census revealed an increase in the average fertility rate to slightly above replacement level — in part due to the higher fertility of new immigrants; (B) the Bureau also concluded that the IRCA provision for deterring illegal immigration by the system of employer sanctions against hiring illegal workers was being circumvented; and (C) the 1990 Immigration Act opened the doors wider to legal immigration. The Census Bureau's "middle" scenario in 1989 assumed a net annual increase from immigration of 600,000. In the two post-1990 Immigration Act projections, net annual increase from immigration is estimated at 880,000.
The Census Bureau now projects the mid-21st century population — during the lifetime of today's young people — at about 392 million. This is an increase of nearly 57 percent above the 1990 census level. And, as may be seen in Figure 2, the population still will be rising rapidly. But, an examination of the assumptions used by the Census Bureau in reaching this projection suggests that it is underestimating the influx of illegal immigrants. The Census Bureau, working with the INS, chose a level of 200,000 new illegal immigrants each year in its projection. That estimate is 100,000 lower than the estimate of the Center for Immigration Studies and the estimate of the INS since last year.
In addition, the long-term trend in illegal immigration has been upward — not static — and should continue to increase unless measures to deter illegal immigration now being proposed, by getting better control over the border and over the workplace, are adopted and prove successful. Because of these assumptions about legal and illegal immigration levels, the Center foresees a faster population growth rate than is projected by the Census Bureau, one that more likely will reach 400 million by 2050.
One approach to measuring the impact of immigration on population growth is to project what would be the U.S. population if there were no further immigration. The Census Bureau prepares what it terms a "zero immigration" projection. This is achieved by withholding the estimated net increase of 880,000 from the projection. That assumption would also drop out-migration to zero, or to a level where it would exactly balance newcomers. As Figure 3 indicates, with zero net immigration, the population of the United States would begin to stabilize at about 310 million persons in 2030. With immigration, by contrast, the net effect of the new immigrants and their offspring after the beginning of the new decade is to add an additional 83 million people to the projected "middle" scenario population size in 2050. Only about 53 million are accounted for by the net influx of new immigrants (880,000 per year). The additional 30 million are accounted for by the offspring of the new immigrants.
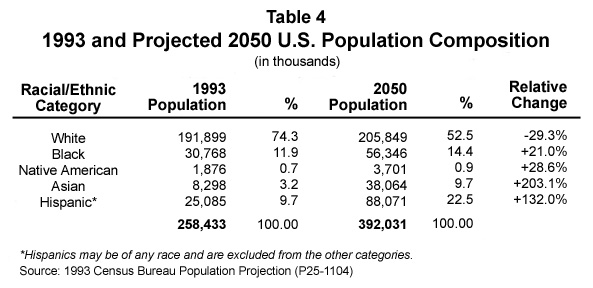
The Census Bureau projection also shows how the demographic face of the United States is rapidly changing in terms of its ethnic/racial composition (see Table 4 below). The major contributing factors to this change are: (A) the magnitude of immigration's contribution to population growth; (B) the difference between the country's current population ethnic/racial composition and that of current immigrants (see Major Countries of Origin of the Foreign Born — Table 2 above, Major Countries of Legal Immigration — Table 5 below, and Major Sources of Refugees — Table 6 below); and (C) the different fertility rates of the ethnic/racial groups. Those groups that have a higher immigration and/or fertility rate will grow proportionately faster. As the Census Bureau first documented in its 1992 population projection, new immigrants generally display higher fertility rates than those prevailing among the general U.S. population.
Selected U.S. Immigration Data
U.S. Immigration: 1,271,896 (FY-1993)
Compared with the Center's calculation of 1.272 million new immigrants in FY'93, the preliminary data to be incorporated in the FY'93 INS Yearbook show immigration at 880,014. The difference is accounted for by the fact that the INS count does not include illegal immigrants and its data on refugees and asylees reflect status adjustments rather than newcomers. The Center's total includes actual refugee entries rather than adjustments, it adds the share of new asylum applicants estimated likely to remain permanently in the United States, and it adds the estimated level of illegal immigration (see Table 5 below).
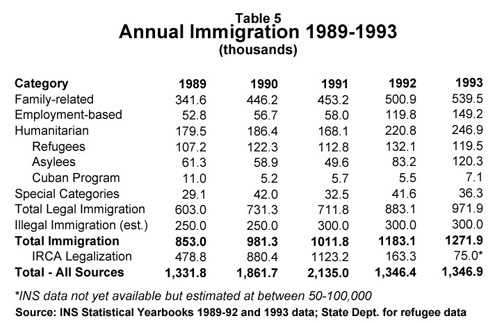
The Census Bureau estimates annual legal immigration at 800,000 (including 115,000 refugees), illegal immigration at 200,000, incoming U.S. citizens at 40,000, and emigration out of the United States at 160,000. This results in a net annual population increase attributable to immigration of 880,000 — coincidentally the same amount as the INS level of new immigrants in FY'93. The Center's data for present levels of legal (972,000) and illegal immigration (300,000) and the upward trend demonstrate why the current Census Bureau middle series population projection is too low (see "Four Hundred Million Americans!" CIS Backgrounder, Jan. 1993).
Family-Based Immigration: 539,538 (FY-1993)
Family-based immigration refers to those immigrants who qualify for entry into the United States because of their relationship to a U.S. citizen or permanent resident non-citizen. The admissions level for family members rose over the past year by almost 40,000 to 539,538 - an increase of nearly eight percent (see Figure 4).
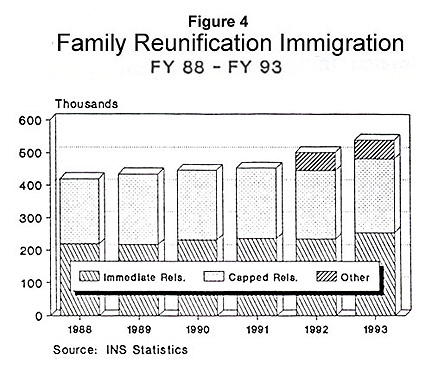
Under this category, parents, spouses and minor children of U.S. citizens are admitted as "immediate relatives" without any numerical limitations. There were 255,059 persons in this category in FY'93 — an increase of about 20 thousand, or over eight percent from the FY'92 level.
Another 226,000 visas are reserved by IMMACT-90 for the adult offspring and siblings of U.S. citizens and the spouses and children of permanent residents — 226,776 were admitted. The increase in this category was about 17,000, also over eight percent from a year earlier.
In addition to this "official" family-based immigration related to the capped preference system and the uncapped immediate relative system, some other family members are admitted under other categories. In FY'93, the other categories included 55,344 family members of immigrants legalized under the IRCA amnesty program and 2,359 others. The entry category for family members of "legalized" immigrants was begun in 1992 and will end after 1994. Subsequently, family reunification for the beneficiaries of legalization will be on the same basis, as for other U.S. citizens or residents.
Altogether, family-related newcomers amount to slightly over 61 percent of total INS admissions for the year.
Employment-Based Immigration: 149,191 (FY'1993)
Employment-based immigration to the United States in FY-1993 was subject to a cap, or limit, under the 1990 Immigration Act of 140,000, plus any unused numbers from the previous fiscal year. The number of immigrants charged by INS against this limit in Fiscal Year 1993 was about 147,000. In addition, another 2,178 persons were adjusted to resident status who entered as non-immigrants to work as nurses and their accompanying family members.
The comparable level of job-related immigration last year was nearly 30,000 less. The increase was nearly 25 percent (see Figure 5). Of the 149,000 admitted in FY'93, over 69,000 (46%) were accompanying family members. This level of work-related immigration, including accompanying family, represents just under 17 percent of the 880,000 total immigration reported by the INS for FY'93.
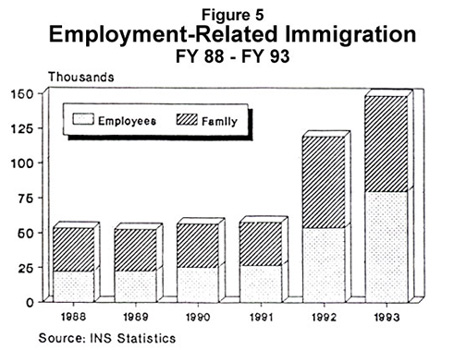
This increase resulted from major increases in the categories for: (A) skilled workers (3rd preference, up 40,100) — which was used to accommodate adjustment of status for Chinese students who were allowed to convert to resident status because of the Tiananmen Square crackdown in China, (B) business executives and other highly qualified professionals (1st preference, up 15,600), and (C) ministers of religion and religious workers (4th preference, up 4,000). Offsetting these increases was a decline of nearly half (from 58,400 to 29,500) in the 2nd preference category for workers with professional degrees.
The work-related category represents 15 percent of the Center's more comprehensive count of legal immigration of 990,000. Keeping in mind that only slightly over half of those entering under the employment visa category are the workers or professionals per se, rather than their accompanying family members, this means that the share of total immigration dedicated to filling needs of the workplace is only about eight percent. That share would be still smaller if it were compared to the total number of new immigrants (including illegal immigrants).
Although the level of employment-related immigration is still a relatively small share of overall immigration, it has increased significantly as a result of IMMACT-90. The number of immigrants in this category has more than doubled from the FY'91 level of 58,000.
Humanitarian Immigration: 246,841 (FY'93)
The U.S. intake of humanitarian immigrants includes refugee admissions, asylum granted to persons in the United States who fear persecution if they were to return to their homeland, and certain other categories of newcomers. Not included are persons who enter legally or illegally and remain without permanent authorization, but whom the federal government decides should not be deported because of unstable conditions in their homeland, e.g., Salvadorans.
The FY'93 level of humanitarian entries, at 247,000, increased over FY'92 by almost 12 percent despite the fact that the ceiling on refugee admissions established by the Administration and Congress was slightly lower.
The INS data on humanitarian immigrants, which reflect adjustments rather than entries, also show an increase (from 134,296 to 137,459). The share of the Center's calculation of total legal immigration that is comprised of these humanitarian entrants is 25.4 percent. This is nearly the same share of humanitarian immigration as for FY'92.
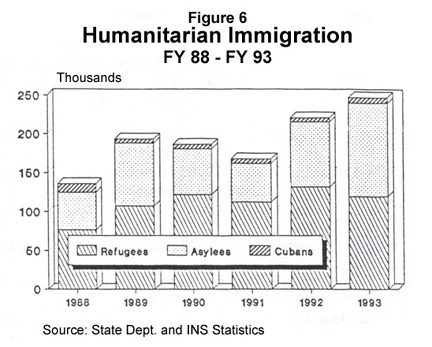
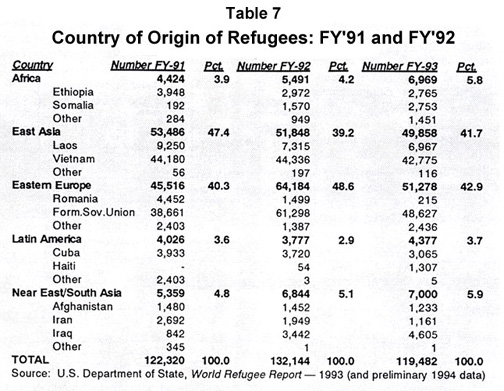
Refugees: 119,482 (FY'93)
When the current system of admission of refugees and asylees was established by the 1980 Refugee Act, it was contemplated that the annual intake of refugees (including asylum seekers) would be less than 50,000. However, no ceiling or cap was enacted. Instead, the refugee admission program is limited by an annual ceiling set by the administration in consultation with the Congress.
Since 1989, actual annual admissions have averaged nearly 120,000, well over twice the level contemplated in the 1980 Act; although the level has never been lower than 50,000 since the 1980 legislation was enacted. For comparison, the average intake of refugees between 1982 and 1988 was 71,707 (see Figure 7).
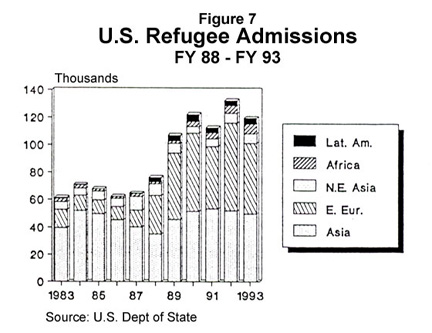
For FY -94, the authorization level decreased to 121,000 from 132,000 in FY-93. This is a further decline from the FY -92 level of 142,000 and below the 131,000 level authorized for FY -91 (for actual admissions, rather than authorized levels, see Table 7 below).
The problem of managing a larger than intended refugee settlement program has been further complicated by the fact that the level of federal funds allocated to support the transition of the refugees to their new life in the United States has not kept pace with the influx of refugees. The concept approved in 1980 was for the federal government to provide three years of support, including cash assistance, medical care, language training, etc. Currently, the federally-funded support services are limited to eight months. The decline in funding, especially relative to the increased admissions level, has been a source of concern to the sponsoring organizations and to the state governments that become responsible for providing social program support for the refugees when the diminished federal transitional funds run out.
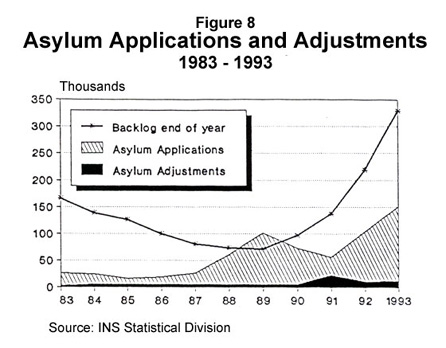
Asylum: 120,306 (FY'93)
Asylum claimants, who are not subject to any numerical limitation, no screening process prior to entry into the United States, and no federally-funded resettlement assistance program associated with them, have been rising more sharply than refugee admissions. The INS data for FY'93 reflect for the first time a higher number of asylum applicants (150,386) than refugee admissions.
The only limit in the asylum process is the number of asylees who may be adjusted to permanent residence each year. That limit was five thousand until the 1990 Immigration Act doubled it to 10 thousand and provided for a one-time higher level, in 1991, to deal with the backlog (see Figure 8). Approved asylees in excess of this number are not forced to leave the United States, but rather are added to a backlog.
It is necessary to estimate the annual admission of asylum applicants who become permanent residents, because the INS only reports the number of asylees who are processed successfully through the asylum adjudication process and are then adjusted to residence status. To obtain a realistic view of the number of asylum applicants who remain in the United States, there must also be an accounting for those who never appear for hearings or do not leave the country even though a decision on their application may be unfavorable.
The INS has estimated that roughly 80 percent of asylum applicants will remain as permanent residents — regardless of the outcome of their asylum claim. On this basis (80% of 150,386 applications), a level of about 120,300 asylees is estimated to have joined the annual influx of immigrants in FY'93. Many of applicants will in fact already have entered the United States earlier — as non-immigrants — before deciding to apply for asylum as a means of remaining in the country.
As a result of a surge in asylum applications beginning in 1988, the backlog of applicants grew from about 73,000 at the end of FY'88 to nearly 330,000 at the end of FY'93. This situation has resulted in a current proposal by the administration to double the corps of INS officers screening these cases to deal with the current case level and in the hope of being able to reduce the backlog.
Cubans and Other Special Humanitarian Categories: 7,053 (FY'93)
In addition to the formal refugee program, there are separate ad hoc categories of humanitarian immigration entrants. Admission categories have been added by specific laws for particular classes of people, such as the Cuban Adjustment Act of 1966 and a 1986 act that applies to Cubans and Haitians paroled into the United States. Although the persons admitted under these provisions are admitted as if they were asylum applicants, they are counted neither against the asylum adjustment limit nor against the Department of State's refugee program limit. In FY'93, Cubans, currently the major beneficiary of special humanitarian entry legislation, constituted nearly all of the about seven thousand persons admitted in this category.
Quasi-Immigrant Humanitarian Categories
In addition to those who enter as refugees and others who are admitted on humanitarian grounds even though they might not qualify as refugees or asylees, like many of the Cubans, still others, who do not qualify for asylum status, are also allowed to stay in the United States for humanitarian reasons for protracted periods of time as non-immigrants. Some of these "persons residing [in the United States] under the color of law" (PRUCOL) — a term that has developed in case law, but does not have any programmatic definition — eventually may become permanent residents through amnesty-type provisions or simply may stay illegally. Even though these additional newcomers, like asylum applicants, are likely to become permanent residents, they have not been included in the annual total U.S. population increase attributable to immigration. For this reason, the 1.27 million level of total immigration may be understated. Over the long run, however, these persons should enter the calculation of either legal or illegal immigration.
The initial category of indefinite non-immigrant status was Extended Voluntary Departure (EVD). The EVD category was developed under the aegis of the discretionary authority of the Attorney General for persons who could not immediately be deported to their home country because of turbulent conditions, but who were found to be ineligible for asylum status because they could not show a well-founded fear of persecution.
The 1990 Immigration Act created a new category of Temporary Protected Status (TPS) to apply to persons in the United States from countries experiencing armed conflict, a natural disaster, or where an extraordinary or temporary condition exists. Under this provision, foreigners from designated countries who are in the United States legally or illegally may be allowed to stay temporarily for renewable periods up to eighteen months and to seek employment. When TPS was enacted, some non-resident aliens who previously had been accorded EVD status — like those from El Salvador, who were specifically designated in the legislation as eligible for the new status —became eligible to apply for TPS. Over 188,000 Salvadorans did so. Other TPS recipients have included aliens from Kuwait, Lebanon, Liberia, Somalia and Bosnia. Currently only Bosnians, Somalis and Liberians are eligible.
Although the TPS status has been accorded to some nationalities and then withdrawn when conditions appeared to warrant it, there are no data available that would indicate whether the temporarily protected persons subsequently have departed from the United States. This process of fine-tuning exceptional categories for non-immigrants whom the United States is not prepared to deport has undergone a further change with the adoption of still yet another provision: Deferred Enforced Departure (DED) status for Salvadorans whose TPS coverage had expired.
The political nature of this status between humanitarian immigration and nonimmigrant status may be seen in the request of the Salvadoran government that DED status be prolonged beyond its mandated expiration date because a large influx of returning Salvadorans to their homeland would be economically destabilizing. Similarly, the Guatemalan government asked the U.S. government in early 1994 to designate Guatemalans in the United States as eligible for TPS status. The reason was presumably the same, i.e., that the government had its hands full with the influx of returning Guatemalans from Mexico and would not welcome additional returnees from the United States. The issue is whether the DED and TPS status should be used for foreign policy convenience to suit the wishes of foreign governments or purely as a provision for temporary humanitarian protection. Experience demonstrates that the longer a given foreign population stays in the United States, finds jobs, becomes married to U.S. citizens or permanent residents, and has U.S.-born children, the more likely it is that those persons will make permanent their temporary stay in this country.
Special Categories: 36,326 (FY'93)
Because the U.S. law has numerous special provisions tailored by legislation to benefit certain classes of immigrant, a "special categories" rubric is necessary as a catchall to round out a description of immigration. Not all immigrants fit into job-related, family-based or humanitarian entry. The largest immigration provision that does not fall into one of the major categories is "diversity" immigrants.
Traditionally, the United States immigration system allowed persons who had no employment or family-based eligibility for a visa to apply as a non-preference immigrant. However, waiting lists for these visas grew to be many years long. As an alternative approach, lottery provisions have been enacted in 1986, 1988 and 1990. At present (and during the 1987-88 period) it is operated as a provision to benefit citizens of "adversely affected countries." Those countries are ones that had immigration levels to the United States significantly reduced by the end of the "national origins" quota system in 1965. This legislation reopens a larger scale of immigration from European countries. The major beneficiaries of the provision so far have been the Irish and the Poles.
In 1993, of the total of 36,326 immigrants who fell under the catchall "special" category, 33,468 (92% of the total) were "diversity transition," or lottery immigrants. Under last year's program, 15,500 Poles and 14,000 Irish obtained access to immigrant visas. As a result, Poland was the major European source of immigration to the United States last year (27,729 immigrants overall) and Ireland (13,575 overall) was the third largest; the United Kingdom, with only a small number entering under the diversity program, was second. The diversity category has a ceiling of 40,000 during the "lottery" period. Beginning in FY'95, the diversity system has a ceiling of 55,000.
Illegal Immigration: 300,000 (1993 estimate)
Quantifying annual illegal immigration is by its very nature imprecise. New illegal settlers in the United States may come across the border surreptitiously — Enter Without Inspection (EWI in INS parlance) — or arrive at a port of entry without proper documents and request asylum (both referred to as "undocumented"), or they may enter the country with legal entry documents as non-immigrants and then stay indefinitely. Examples of the latter illegal status would include tourists, students and temporary workers who stay beyond their authorized period and persons given temporary permission to stay because of unsettled conditions in their home country who do not leave when conditions improve and the permission is withdrawn.
The INS reports exclusions at the port of entry and apprehensions and deportations of illegal aliens, but does not include in its annual statistics an official estimate of the level of illegal entry. Nevertheless, the INS has made a major effort to quantify this sub rosa immigration stream. It has studied data supplied by the illegal immigrants who applied for the 1986 IRCA "legalization" program in order to develop profiles on the historic rate of illegal entry, and it has used computer-assisted matching of entry and departure data on non-immigrants to develop profiles on visa overstayers. Using this data, the INS came up with a new estimate in 1993 that the rate of illegal immigration between 1988 and 1992 was 300,000 per year. Previously the INS had estimated the rate at 200,000. This higher estimate is not based on evidence of an increase in illegal immigration; rather it simply reflects better data.
Researchers have suggested that the rate of illegal immigration is related to the U.S. economy and the ability to find jobs. This is the concept behind the employer sanctions system for deterring hiring illegal immigrants that was adopted in the 1986 IRCA, along with the "legalization" program. Although the employer sanctions system has been undermined as a deterrent to illegal immigration by fraudulent documents and inadequate resources for effective enforcement, which does not necessarily mean illegal immigration is rising. Other factors may have dampened the attraction for would-be illegal immigrants. Among those would certainly be the weak economy and high unemployment. Additionally, remembering that the largest share of the EWI illegal border crossers head for California, and Los Angeles in particular, the tragic earthquakes of last year may have deterred would-be migrants. In addition, it seems likely there would be a continuing deterrent effect from the May 1992 rioting in Los Angeles that led to the arrest of over one thousand illegal aliens and the deportation of hundreds.
Without the benefit of the INS' entry/exit records on non-immigrants, the Center developed an estimate of illegal immigration at about 300,000 per year. The Center has used this same estimate since 1991, because new data are not available that would allow an informed adjustment. In effect, it is plausible that the U.S. economy and unemployment may have offset increases due to easier access to jobs through fraud and the lack of an effective threat of deportation.
There are some data, however, that indicate that illegal immigration is rising. One of these is the increased number of asylum applicants who will remain permanently, even though they are not found eligible for asylum status. This is a form of illegal immigration whereby asylum is being used as a back door to permanent residence in the United States.
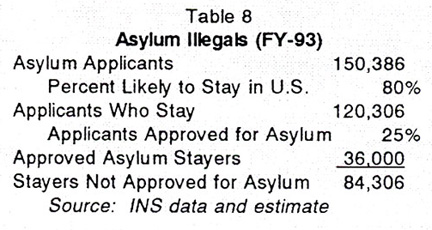
The rate of asylum approval varies, but in recent years it has been around one-quarter of the applicants. In FY'93, the INS approval rate was 22 percent (5,105 cases granted out of 23,215) and 23.2 percent for the separate immigration judges (1,626 approvals out of 7,019). Eighty percent of the asylum applicants, i.e., 120,306 in FY'93, are estimated by the INS likely to remain in the United States regardless of the disposition of their applications, a large share illegally. If only a quarter of the FY'93 asylum applicants are approved, then 36,000 of these claimants will become legal residents, and the balance of over 84,000 will stay as illegal immigrants or find some other means to acquire legal status (e.g., by marriage to a U.S. citizen). This measure of illegal immigration is up about 27,100 (over 7%) over the comparable FY'92 level.
Another indication that the level of illegal immigration may be increasing comes from data on the large-scale illegal alien smuggling from China. Since the Golden Venture ran aground in New York in June 1993 with nearly 300 smuggled would-be Chinese immigrants, there have been several other similar incidents, including ones in which the smuggled Chinese have been found already in the United States. Three hundred recently arrived illegal Chinese were found in California last year, also in June. A month later three ships carrying 659 illegal Chinese immigrants were intercepted and diverted to Mexico. A total of 1,600 smuggled Chinese were intercepted by the INS in the first five months of 1993. In April this year, another boatload of about 100 smuggled Chinese was diverted to Guatemala and over one hundred Chinese were found in Virginia still being held by the smugglers for ransom. The finding of a two-and-a-half year study of illegal Chinese immigration by Rutgers sociology professor Ko-lin Chin, sponsored by the U.S. government and reported in May 1994, is that more than 10,000 illegal Chinese immigrants enter the United States each year, and only one third are intercepted by the INS.
The Census Bureau, in order to project population growth, has to account for illegal as well as legal immigrants. The Census Bureau in its last three projections has used the Service's estimate of 200,000 new illegal residents each year to develop its current middle scenario population projection, i.e., one that results in a population of slightly fewer than 400 million in 2050. As already noted the INS estimate for annual illegal settlement is now 300,000 — 50 percent higher. Only the Bureau's high scenario uses a 300,000 estimate for the annual increase from illegal entries, and that projection — which also includes other assumptions that would cause rising population growth — leads to an estimated U.S. population in 2050 of 522 million persons, one-third higher than the middle scenario.
Estimates from unofficial sources of illegal immigration vary widely from the 200,000 level to as much as 500,000. The Federation for American Immigration Reform (FAIR), an immigration reform group, estimates the annual net increase in illegal immigration at somewhere between 250 and 500,000. (A discussion of the overall number of illegal aliens estimated to be living in the United States in 1994 is included in the section on the foreign-born population.)
Apprehension of Illegal Aliens: 1,327,000 (FY'93)
Apprehension statistics over the past two decades show a steady increase from 1961 to 1976, then a leveling off at about one million until beginning a sharp climb again from 1983 to 1986. This climb was reversed temporarily in 1987, after implementation of IRCA (see Figure 9).
The data reflect a clear correlation between the adoption of the employer sanctions provision of IRCA and decreased apprehensions. This correlation indicates the deterrent effect on would-be illegal immigrants of the prospect of being unable to find employment. However, as ways to circumvent the documentary requirements of IRCA have been found, principally through forged documents, the trend in apprehensions has resumed its climb.
Apprehensions include all INS detentions of illegal aliens, but most of the enforcement effort is at the southern land border with Mexico. That is evident in the fact that most of the apprehensions (97.4% in FY'92) were of aliens entering surreptitiously (EWI). The same INS data show that most of those apprehended (98.7%) were Mexicans. The INS acknowledges that the same individual may be apprehended many times during the course of a year, thus the number of apprehensions should not be used as an indicator of the number of individuals illegally entering or remaining in the United States in a given year.
The Center's recent study of the Border Patrol's innovative deployment for deterrence of illegal entry at El Paso (see "Operation Blockade: A Bullying Tactic or a Border Control Model?" CIS Backgrounder, No. 9-93) makes clear that a large number of apprehensions may be accounted for by persons who are illegally entering the United States for a day or a week rather than in an attempt to establish permanent residence here. Therefore, apprehension data should be used as an indicator of the level of illegal immigration only with a great deal of caution. For example, the INS has stated that, because of the porous nature of the border and its overextended manpower resources, two or three persons probably evade apprehension for everyone caught. Nevertheless, it clearly is a distortion of the data to use that assumption to conclude that two to three million illegal immigrants are entering the country each year.
Furthermore, the continuing El Paso operation — now termed Operation Hold the Line — challenges earlier assumptions. The number of successful illegal border crossers in that sector is likely to be much smaller than previously because of the more efficient deployment of resources. However, it would appear that the operation's impact will be much greater on short-term border crossers than on intending illegal immigrants. The latter are more likely to be simply diverted to weaker enforcement points on the border. Therefore, a declining number of apprehensions will not necessarily equate with a declining incidence of illegal cross-border immigration.
Selected Global Data
World Population: 5,607,000,000 (1994 estimate)
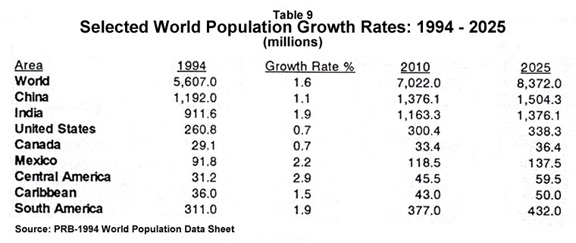
Population growth in the United States should be understood in the context of population growth globally. This is true not just in terms of its relative demographic factors (fertility and mortality) but also because of immigration, which may be influenced by the demographic, economic and political conditions elsewhere. Although the U.S. population size (third largest after China and India) and growth rate seem high, world population growth is much greater, and the populations of China and India dwarf the population in the United States (see Table 9).
China's population is over four and one-half times larger, and India's is nearly three and one-half times larger than that of the United States, according to the Population Reference Bureau (PRB). In addition, the population growth rate in those countries is much higher than in the United States.1 China, by adopting a one-child per family policy, has succeeded in reducing its growth rate to 1.1 percent per year, about the same as the U.S. rate of growth when immigration is included. India is growing at 1.9 percent per year, a rate more than two-and-a-half time more rapidly than that of the United States.
Without considering the sizable numbers of Mexicans who migrate to the United States — 109,000 legally and likely a higher number illegally in 1993 — Mexico's population growth rate would be nearly three times that of the United States.
Mexico's natural rate of population growth reported by PRB is 2.2 percent. That rate implies that Mexico's population will double in 31 years. However, PRB also projects a population for Mexico in 2025 — 31 years from now — of 137.5 million, rather, than the 184 million that doubling implies. That 46.5 million reduction in projected population growth can be achieved only with much lower fertility and/or massive migration to the United States. Even if Mexico's natural growth rate were steadily reduced over the next thirty years to half its current rate (from 2.2% to 1.1%), the 137.5 million population in 2025 could be achieved only with out migration of about 350,000 persons per year.
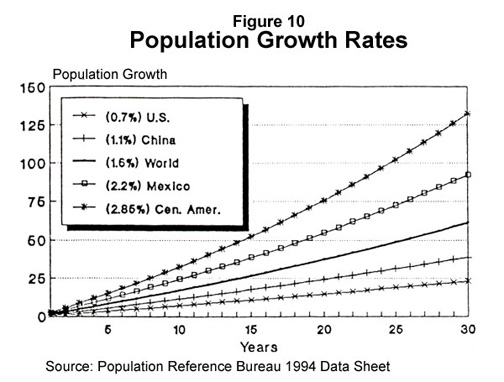
To illustrate the difference between various rates of population growth, Figure 10 depicts the effect of selected growth rates over a thirty year period. At PRB's 0.7 percent estimated natural growth rate of the United States and Canada, the population grows just under 25 percent. China, with a 1.1 percent rate — which reflects the true growth rate of the United States with immigration — achieves the same 25 percent population increase in less than 21 years. The world growth rate of 1.6 percent per year yields a 25 percent population increase in less than 15 years and a 50 percent increase in 25.5 year. For Mexico, with a 2.2 percent per annum rate of increase, the 50 percent growth in population is achieved in a little over 18 years. Central America, by comparison, with a 2.85 percent rate of increase, adds 50 percent in just 14.5 years and it doubles its population in just under 25 years — less than the time during which the U.S. population grows by one-fourth.
Turning back to Mexico, our southern neighbor's natural rate of population increase (at 2.2%) is slightly higher than India's, but less than Central America's rate of growth. At this rate, if it were not for immigration, over the 30 years during which the U.S. population was increasing by about 60 million, to about 123 percent of its present size, the Mexican population would be increasing by 84 million to 192 percent of its current size.
Another way to view relative population sizes and growth rates in this hemisphere is to compare the United States and its southern neighbors Mexico, the Caribbean and Central America. With about 61 percent of the U.S. population size today, in 30 years these countries taken together are estimated by PRB to likely have a combined population 71 percent of that of the U.S. (that estimate allows for immigration). If South America is added to the other southern neighbors, their combined population today is about 80 percent greater than the population of the United States (more than 60% greater if the Canadian and U.S. populations are combined), and in thirty years their combined population growth is projected to be nearly double that of the U.S. (and over 80 percent greater than joint populations of the United States and Canada).
PRB estimates that world population grew by about 101 million persons over the past year. Over one-fourth (27%) of that increase occurred in India (14.2 million) and China (13.5 million). The current estimated rate of growth is decreasing marginally, and it results in a projected world population in 2025 — in just 31 years — of 8.378 billion, about half today's population.
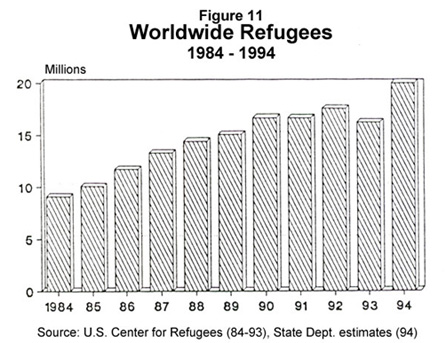
World Refugees: 20,000,000 (1994)
World Displaced Persons: 25-30,000,000 (1994)
The United Nations High Commissioner for Refugees (UNHCR) currently estimates the number of refugees at above 20 million and the number of persons displaced from their homes, but within their own country, at 25-30 million. Despite these magnitudes, the combined figures represent slightly less than one percent of world population (0.8 -0.9%).
The size of the world refugee population has steadily increased over the last several years, according to data collected by the U.S. Committee for Refugees. (See Figure 11)
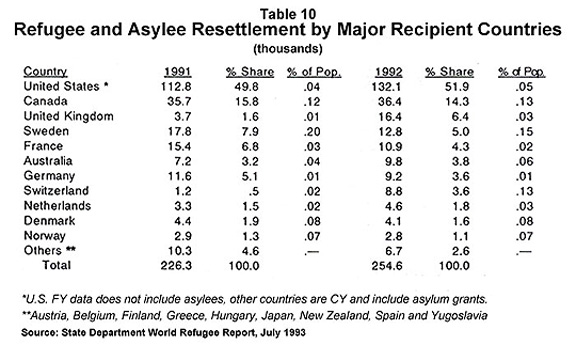
The United States accounts for over half of the refugees resettled in FY'92 according to records of the UN High Commissioner for Refugees (UNHCR) reported by the U.S. State Department. Over 132,000 refugees alone were resettled in the United States compared to 122,540 refugees and asylees resettled for all other major recipient countries. Yet the UNHCR data do not accurately reflect asylum resettlement in either the United States or other countries, because asylum applicants, unlike refugees, usually are screened by the individual country rather than by the UNHCR. Nevertheless, using the UNHCR data, the quarter of a million refugees and asylees settled in the major recipient countries represent only slightly over one percent of the worldwide total of refugees recorded by the UNHCR.
The role of the United States as the major country of refugee resettlement does hot mean, however, that it is carrying a disproportionate burden. When the level of refugees resettled is compared to total population, Canada, Sweden, and Switzerland all appear to be accommodating over twice the U.S. per capita level. Similarly it appears that Australia, Denmark, and Norway have larger settlement programs than the United States on a per capita basis. Also noteworthy in the refugee resettlement data is the appearance that some industrialized countries, such as Japan, Spain, Belgium, and Greece are comparatively uninvolved (see Table 10).
The data, however, should not be relied on as a definitive indication of the refugee policies of other countries or relied on for comparisons among countries. For example, until July 1993 when the constitution was changed, Germany had a very open political asylum policy under which it resettled over one million foreigners since 1989. Data reported in the Migration News Sheet of the European Information Network (BIN) show different levels of asylee settlement from those reported by the State Department, with most countries showing higher numbers. For Germany that publication reports 56,300 asylum seekers permitted to remain in 1991 and 96,400 in 1992. For Sweden the BIN data show 11,700 in 1991 and 35,800 in 1992. Corresponding levels for the U.K. were 24,400 in 1991 and 12,000 in 1992. The number of asylees resettled in the United States, as reported by the State Department, is not included in the table below, because a more accurate level is presented earlier in this paper in Table 5.
End Note
1 The Population Reference Bureau's annual Population Data Sheets reflect natural rates of population increase. This is change based on fertility and mortality but excludes net immigration. Thus, PRB's 0.7% rate of growth for the U.S. is lower than the 1.1% rate of overall population change; and the difference is due to immigration.
Sources of Data
- Population Reference Bureau, Inc., 1994 World Population Data Sheet, Washington, DC, April 1993.
- U.S. Bureau of the Census, Current Population Reports, "Population Projection of the United States...", P-25-1018 (1989), by Gregory Spencer, and P-25-1092 (1992) arid P-25-1104 (1993), both by Jennifer Cheeseman Day, GPO, Washington, DC.
- U.S. Bureau of the Census, Population Division, The Foreign Born Population in the United States: 1990, Pub. CPH-L-98 and CP-3-1; July 1993, both by Susan Lapham, Washington, DC, 1993.
- U.S. Department of Justice, Immigration and Naturalization Service, 1992 Statistical Yearbook, NTIS Order No. PB 94-100120, Washington, DC, October 1993.
- U.S. Department of Justice, Immigration and Naturalization Service, preliminary statistics for FY-1993 covering Table 4 data and Detail Run 401, Washington, DC, 1994.
- U.S. Department of State, Bureau of Refugee Programs, World Refugee Report, Washington, DC, 1993.