It has been argued for years that foreign students contribute to America’s balance of payments because of money they bring with them from abroad. A careful analysis shows that such arguments are false because of three fundamental flaws: 1. The calculations ignore the massive, partially hidden subsidies to higher education coming from American tax dollars and endowment funds; 2. The calculations supporting the balance-of-payments argument use highly questionable data-collection techniques; and 3. Other, stronger, studies show that foreign students make heavy use of U.S. funds to support their graduate educations.
“International students contributed $14.5 billion to the U.S. economy in 2006/2007.”1
That’s the claim of the Institute of International Education (IIE), a New York-based advocacy organization dealing primarily with foreign students at American institutions. It is a balance-of-payments argument that is annually reported by — and never examined by — the media. It is an argument totally without merit.
Now, some myths are organic, growing naturally, and others are carefully nurtured by interest groups. As we will show, this myth has been lovingly nourished by the IIE for decades, using a whole series of dubious statistical practices.
Stepping back a moment from this dollars-and-cents discussion, one could make a totally non-economic argument for the importation of at least some students from overseas. For several decades in the last century many foreign leaders, particularly from Europe’s former colonies, had been educated in America and were friendly to the United States. That was and is a purely good thing.
Further, at the university level, it is helpful to U.S. students to have non-U.S. students in their classes — particularly in the fields of the arts, the humanities, and the social sciences. It makes for a more cosmopolitan experience for the Americans involved.2 Unfortunately, most foreign students, particularly at the graduate level, are studying science, mathematics, and engineering, fields where the students’ overseas backgrounds are of lesser value.
But foreign students as a plus for the American economy, like soy beans grown in Iowa and exported to China? That’s an argument that does not stand up under examination.
There are three problems with the IIE position, which will be reviewed in turn; first it is based on a heroic but false assumption. Second, it is supported by a series of highly questionable data-gathering and statistical practices. Finally, it runs quite contrary to other, better sources of information, including my own extensive experience with the micro-economics of the foreign graduate students I have interviewed at 15 American graduate schools.
But before we tackle these issues, a few facts about foreign or international students (the terms will be used interchangeably) in the United States.
First, there are a lot of them. Open Doors 2007, the most recent of IIE’s annual reports on the subject, reports that there were 582,984 of them in the 2006-2007 academic year, or 3.9 percent of the universities’ total enrollment. Further, their numbers, after a mild post-9/11 dip, keep rising.
Second, most of them are graduate, not undergraduate students; most are here to secure academic credentials that will help them find jobs, either in the United States or elsewhere. Thirdly, the big majority of them are from Asia, with the largest single groups, again according to Open Doors 2007, coming from India, 83,833, and China (including Hong Kong), 75,445.3
Finally, most graduate students (both domestic and foreign) are both workers and students; they are usually employed on campus, at least during the school year. The lucky ones are hired to do research for their professors, often on subjects useful to their own dissertations; less lucky ones teach underclassmen or perform other chores around the campus; members of a small third group have the mixed blessings of a fellowship, which provides money for living expenses without requiring work; this arrangement, however, does not bring the student into the close touch with his or her professor that goes with a job as a research assistant.
Graduate students, as a group, play an important role in the academic labor force, particularly of the larger universities. Without them, and their often ill-paid work, much academic activity would slow considerably.
One of the principal impacts of the large numbers of foreign graduate students, I concluded after an extensive study for the Alfred P. Sloan Foundation, was that they had made a profound impact on the labor market of America’s graduate schools, loosening it and thus tending, indirectly, to undermine a motive for the recruitment of American women and minorities by these graduate schools. Further, their presence resulted in the lowering of the wages for everyone enrolled in them, and in science and engineering generally.4 America’s academic establishment does not agree.
There is another aspect of this argument, that America’s security interests may not be helped by the extensive admission of overseas people studying highly technical matters; I leave that discussion to others.5
It is within this broader debate about the appropriateness of America’s immigration and educational policies regarding foreign students that IIE has inserted its contribution that the foreign students help with the balance of payments, which is the subject of this paper.
How Did IIE Calculate $14.5 Billion?
IIE multiplies the number of international students it estimates, sorting out graduate and non-graduate students, by an estimate of the annual costs for such students6 and finds that tuition and fees come to $9,928,600,000 and “living expenses and dependents” is $10,850,200,000; from this it subtracts $6,279,700,000 in U.S. support for a net of a $14,499,100,000 contribution to the U.S. economy.7In order to separate the personal and overseas contributions from the domestic ones, for the cost of the foreign students’ educations in the United States, IIE relies on an annual survey of foreign student advisers at American universities and colleges. It asks a primacy question of these advisers, i.e., what is the primary source of funds used by these students? The advisers then make a campus-wide estimate of the primary sources, strongly preferring “personal and family” (62 percent in the 2006-2007 survey8). IIE then multiplies the total cost estimates by the percentage estimated as the primary source to get the total “contribution” to the U.S. economy. IIE has been using the same methodology, and pretty much the same questions, on this topic since at least 1988, and probably earlier.9
There are several major problems with this methodology.
IIE’s Unstated & Heroic Assumption
The methodology used by IIE assumes that all pertinent financial costs of a university education are seen by the students and by the foreign student advisers. Tuition, either paid or waived, is an easily knowable number, as are estimates of the cost of living of international students. Put them together, factor out an estimate of U.S. support using these definitions, and IIE gets its $14.5 billion balance of payments contribution.
But, as most people with the slightest exposure to the finances of higher education know, there is another huge factor in this equation, the partially hidden subsidies from taxpayers at state schools and from endowments at private ones. These subsidies are overwhelmingly from U.S. sources, and are completely excluded from IIE’s statistics.
Let’s compare some numbers. Using the most recent IIE estimates we see that the $14.5 billion contribution from the foreign students, who number 582,984, would come to $24,872 each, a number to which we will return later.
In contrast, the National Academy of Sciences, has these estimates, covering both domestic and foreign students, for the year 2000-2001:
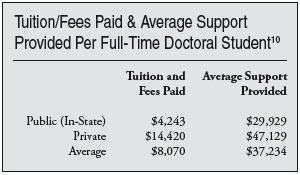
While the extent of support for non-doctoral students is presumably lower, these estimates, from a highly reliable source, indicate that the IIE’s alleged $24,872 per head contribution from overseas sources is totally overshadowed by the $37,234 average support provided shown above.
In the course of an examination of the IIE’s most recent data, to secure the comparison above, we encountered yet another problem with the IIE’s published data — a rather complete lack of proofreading, if nothing else.
On page 15 of the most recent Open Doors, one sees two tables: Figure 7C is headed “Primary Source of Funding of International Students, 2006/07”; Figure 7D is headed “Primary Source of Funding by Institutional Type, 2006/07.” Both tables cover about 582,000 to 583,000 foreign students.
In Figure 7C there are 238,050 undergraduates while in Figure 7D there is a total of 112,636 students in the baccalaureate and associate’s categories; in Figure 7C there are 264,288 in the graduate category, while in Figure 7D the total of doctoral and master’s candidates comes to 443,292.
There is nothing on this page that suggests anything other than two different cross-tabulations of the same data, from the same source, from the same year. There is no explanation of the discrepancies noted above.
IIE’s Peculiar Research Techniques
As an analogy to how the IIE prepared its estimate, let’s assume that there is an imaginary big city political machine run by the Jay Richards family and that it dominates an imaginary American place we will call Dailyville. Two individuals decide, separately and individually, to conduct a study of how well the family has run the city; one is a scholar from a distant place, and the other is a flack employed by the Richards machine.The scholar uses standard statistical sources (Census, BLS unemployment data, birth and death statistics, etc.), he talks to movers and shakers in the city, both people friendly to the Richards family and not-so-friendly; he reads old newspapers and consults observers such as other scholars and journalists, and as a minor part of his research he conducts a survey of the machine’s precinct captains.
The flack’s study is solely based on a poll of the precinct captains.
The scholar secures data in depth and writes a nuanced study of the city, dealing both with the accomplishments and the failures of the Richards regime. The flack, on the other hand, finds that virtually everyone he contacts thinks that the Richards family is doing wonders for Dailyville.
Regarding the question of the how foreign students finance their U.S. education, the IIE had several options. It could have conducted a sample survey of individual foreign students, asking them questions about the various sources of financial support they used. This would have been expensive but would have produced good data. Or, the IEE could have conducted its research based on the financial records of various universities; there would be similar tradeoffs.
The IIE, for decades, has chosen the same research path as the imaginary Richards machine flack — let’s ask one question on this subject, the primary source question, and let’s ask our friends, the foreign student advisers.
Precinct captains and foreign student advisers are good people, by and large, one a bit better educated, on average, than the other, but both populations have understandable biases and should not be used as primary data sources.
Whether it did it on purpose or not, IIE has further loaded the dice when it came to the formulation of the specific questions to be asked of its own precinct captains.
To step back a bit and to use another political analogy, ballot sequence is an important variable in primary elections, when party labels are not used to organize the ballot. Having one’s name first on the primary ballot is a major advantage, particularly in a race for a lesser office; that’s why in many jurisdictions the ballot sequence is determined by a public drawing of names from a hat or a bowl. (In some states the incumbent, by law, gets to be listed first, a substantial additional advantage for an already advantaged candidate.)
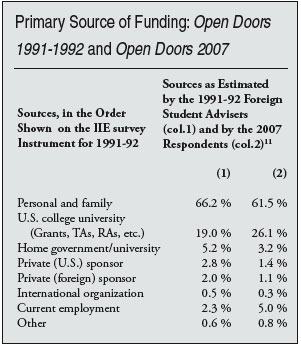
In former years IIE, honorably, published the full text of its survey instrument as it does not now do. As I noted in Soothing, the Establishment, there was an interesting relationship between the order of questions asked of the foreign student advisers, and their answers.
As I pointed out some years ago11, the distribution of the foreign student advisers’ responses was then perfectly mirrored by the ballot order until one drops below the 2.8 percent level, and the responses (and probably the survey instruments) have not changed much since. (See the box on the previous page.)
A Better Approach, Funded by Six Major Federal Agencies
Is there a better data source on this question of who pays for the education of foreign students? Yes. It is a continuing study, handled conservatively, and funded by six major government agencies: the National Science Foundation, the National Institutes of Health, the National Endowment for the Humanities, the U.S. Department of Education, the U.S. Department of Agriculture, and the National Aeronautics and Space Administration.
It does not deal with all international students, but it does work with those getting doctoral degrees — and PhD candidates are probably the majority of foreign students.
The annual study is called Doctoral Recipients from United States Universities; Summary Report;12 it is based on a survey of everyone receiving a PhD in a given year. My impression is that one does not actually obtain the degree without completing the survey; this does not guarantee 100 percent replies to all questions, but it does produce a lot of completed survey instruments.
The study, run by the well-regarded National Opinion Research Center in Chicago, asks the same question that IIE asks: What is the primary source of financial support for the PhD recipients? But there is a major difference. It asks the doctoral recipients directly. It is first-hand data, not the second-hand, group-estimate data that IIE has on this point.
What does the Summary Report show? As Exhibit 113 indicates, only 5.3 percent of the temporary visa doctoral recipients say that their own resources are the primary source of financial support, as opposed to the 55.2 percent of the doctoral candidates in the IIE estimates. This is a remarkable difference and, over the years, might have been expected to shake up IIE.
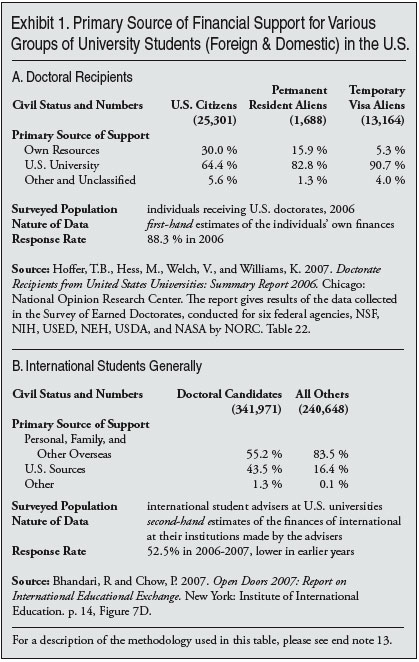
As the exhibit shows, the Summary Report has different findings on the question for three subsets of doctoral recipients; U.S. citizens say that the primary source of their funding, in 30.0 percent of the cases, came from their own resources. Comparable findings were 15.9 percent for permanent resident aliens (greencard holders), and only 5.3 percent for those with temporary visas.
Interestingly, the response rates for the IIE and the Summary Report surveys were quite different. More than 88 percent of the doctoral recipients responded to this question, while only 55.2 percent of the foreign student advisers answered that question in the latest IIE survey, and the percentage of the advisers in prior years dealing with this question had been as low as 36.9 percent. Presumably the overwhelming majority of the PhD recipients were comfortable answering a question about their own finances — one does know such things about oneself — while a near majority of the foreign student advisers were, again presumably, worried about how much they knew about the subject.
So we have a solid majority of the doctoral recipients saying with confidence where most of the money came from — and with those on temporary visas saying it was in 90.7 percent of the cases an American institution. In contrast we have a weak IIE response rate that estimates that only 43.5 percent of the foreign students relied mainly on U.S. resources.
Dealing, First-Hand, with Real, Live Foreign Graduate Students
Both the studies discussed so far deal with the primacy question: i.e., what was the primary source of support for international students generally (IIE), or of doctoral recipients (the Summary Report)? Was there any data available on a more nuanced question: What percentage of your income, Mr. Graduate Student, came from overseas, and what percentage came from U.S. sources?I was unable to find a source of such information when I first began exploring the matter in the mid 1990s. I then secured a small grant from the Alfred P. Sloan Foundation, which had supported the research for Soothing,14 to look further into the micro-economics of the funding of the education, in the United States, of foreign doctoral candidates in science, math, and engineering.
I decided to conduct an as-random-as-possible survey of doctoral candidates in three disciplines, civil engineering, mathematics, and biology; I selected four departments, one in each of the four reputational quartiles, then for other reasons I added three more university departments, one each in civil engineering, oceanography, and in health sciences.15 The 15 departments were scattered around the United States and included both private and state universities. In addition to five Turkish students in health sciences, all fully-funded by a World Bank grant, my study group consisted of 87 doctoral candidates all on, or quite recently on, temporary visas.
Since the Sloan Foundation paid them each $40 for a 40-minute interview, the response rate was good. With one possible exception, I felt that the financial information I secured was truthful. In each of the 87 cases I worked out an annual statement of income, from a combination of domestic and foreign sources.
The results closely parallel those of the Summary Report. When all the income data had been collected and tabulated, I found that 10.4 percent of the students’ incomes came from overseas, and the rest from U.S. sources. There was no difference between men and women, but there were strong differences along two other variables: students with J-1 visas, which make it more difficult to remain in the United States as an immigrant, reported 32 percent of their resources came from abroad, while those with the more common F-1 visas had 5.9 percent of their income from overseas.
The other telling variable was the difference between students from China and those from the rest of the world; the Chinese reported only 4.8 percent of their support came from abroad, while the others said 15.5 percent of their support came from overseas.
In fact, this study group of 27 grad students from Mainland China showed a trend that IIE never discusses — the flow back to China of U.S. education funds. Of the 27, 15 reported sending remittances back home.
In four cases it was simply low-income students in the United States sending money to even lower-income parents in the home country. In the other 11 cases it reflected a Chinese Government scheme to, in effect, tax their own expatriate students. In China much of higher education is funded by the government, provided that the recipient of the education stays in the homeland for, I believe, five years. If they want a passport to leave the country within five years, they have to pay back all or some of what had previously been free tuition. Since China is a nation with tight exit controls, it can use them to make sure that the tuition is repaid.
In practice, what happens is that the family of the student must borrow several thousand U.S. dollars to make the tuition repayments, a small fortune for most Chinese, and then the student repays the loans out of his or her stipends.
I asked many, many people from many nations about policies like this, but found that only China had such a practice. (And China is also the country with which we have the largest trade deficit!)
Whether this practice continues to this day, I don’t know, but it certainly did 10 years ago.
In the course of my interviews with the 87 foreign students I asked a question about their family’s finances in 78 cases – did they own a car? These were the responses:
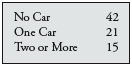
I find it hard to accept the IEE estimate that on average international students bring $24,872 from overseas — every year — when a majority of the parents of the people I interviewed did not even have an automobile.16
It is more than slightly ironic that the other annual publication of the IIE is entitled “Funding for United States Study: A Guide for International Students and Professionals.”17 It is a how-to book, as its introduction states, “designed to be a descriptive guide to financial assistance for prospective international students interested in studying or doing research in the United States.”
End Notes
1 Bhandari, R. and Chow, P. (2007). Open Doors 2007: Report on International Educational Exchange. New York: Institute of International Education. p 14.2 I was a graduate student abroad, once upon a time, in political science. Unfortunately, I missed most of the cultural stimulation noted above. As a Fulbright and the only American in a small graduate program at Victoria University College in Wellington, New Zealand, I had an American education, an experience as a sacrificial candidate for my party for a seat in the New Jersey state legislature, and some time with an assertive American advertising agency— capitalism was then pretty passive in New Zealand — so I was the exotic presence.
4 North, D. (1995). Soothing the Establishment: The Impact of Foreign-Born Scientists and Engineers on America. Lanham, Md.: University Press of America.
5 See, for example, the participation of Jessica Vaughan, a former State Department official, in the “On Line Debate: Foreign Students” in Economist.com, December 19, 2007, p. 2. http://www.cis.org/sites/cis.org/files/articles/2007/jmvoped121907.html
6 The source of this all-important estimate is given as “2006/007 tuition, living and miscellaneous expenses data obtained from Peterson’s”; see Open Doors 2007, footnote 1, p. 14.
7 Open Doors 2007, p. 14, Figure 7A.
9 See, for example, Open Doors 1988-1989, table 9.4. Personal and family funds headed the list of primary sources that year with these estimates provided: undergraduates, 76.8 percent, graduates 42.0 percent, and other 61.3 percent.
10 Committee on Policy Implications of International Graduate Students and Postdoctoral Scholars in the United States, The National Academies. (2005). Policy Implications of International Graduate Students and Postdoctoral Scholars in the United States. Washington: National Academies Press. Table 1-3. These data are based on studies by the National Center for Educational Statistics, with the precise sources cited in the original.
11 Soothing the Establishment op. cit., p. 81.
12 Hoffer, T.B., Hess, M., Welch, V., and Williams, K. (2007). Doctorate Recipients from United States Universities: Summary Report 2006. Chicago: National Opinion Research Center (The report gives results of the data collected in the Survey of Earned Doctorates, conducted for six federal agencies, NSF, NIH, USED, NEH, USDA, and NASA by NORC.).
13 To make the results of these two studies as comparable as possible in Exhibit 1, we combined the responses to the two different surveys into three roughly coherent groupings.
In the case of the Summary Report we combined the replies “own resources” and “foreign government” into the “own resources” category in Exhibit 1; we combined the other specific responses, “teaching assistantships,” “research assistantships,” “fellowships,” and “employer,” presumably a U.S. employer, into “U.S. university.” “Other,” a tiny category, was left as it is.
Similarly, with Open Doors, we combined “personal & family,” “home government/ university,” “foreign private sponsor,” and “international organization” into the new category “personal, family and other overseas;” we then merged “U.S. college or university,” with “U.S. government,” “U.S. private sponsor,” and “current employer” to form the new “U.S. sources” category. Again, “other” was left alone.
The response rates used in the Exhibit 1 come from these sources:
For the Summary Report we used the number of respondents to its Table 22 (40,272) and the total number of doctorates reported (45,596) to get the figure of 88.3 percent.
For Open Doors 2007 we used its table 45, which showed the response rate on the question “source of funds” over the years. It was 52.5 percent for 2006/2007 and as low as 36.9 percent in 2002/2003. The foreign student advisers routinely answered more than 90 percent of the other Open Doors questions, but they were, apparently, often — and honorably — reluctant to estimate the funding source and marital status variables (36.3 percent on the latter in 2002/2003, for instance). Bear in mind, according to Open Doors, p. 98, that the 52.5 percent of the foreign student advisers responding to the funding question worked for the 65.2 percent of the institutions responding to the survey itself.
For a comment on the remarkably different estimates of the use of domestic and foreign resources for the financial support of the international graduate students, see the text.
14 The author is grateful to the Alfred P. Sloan Foundation and its project officer, Michael S. Teitelbaum, for their support on these two projects.
15 The oceanography department was added because I was curious about job opportunities in a discipline that lacks an undergraduate program, and thus, perhaps, teaching opportunities for PhD candidates; the health sciences department at a particular mid-Atlantic institution was selected because it, alone of these departments, was known for its active recruitment of fully-funded overseas graduate students; and the other civil engineering department joined the program because I found myself, accidentally, with more departmental acceptances than the initial design anticipated. For the full text of this lightly-distributed report see The U.S. Pays: A Study of the Funding of Foreign-Born PhD Candidates in Science and Engineering, 1998. A limited number of copies are available from the author at [email protected].
16 While some of the parents of the 87 doctoral candidates had comfortable, middle-class incomes, and many had advanced degrees, many other students came from struggling families. In one instance, I asked the person on the other side of the table if his father, a rice farmer, had retired. His stark answer: “In China peasants do not retire, they die.” Since he was a math student we then worked out the size of the family farm; it turned out to be one-sixth the size of a U.S. football field; the whole thing could fit in the “red zone” of football, the territory between the goal line and the 20 yard line.
17 Institute of International Education, Funding for United States Study: A Guide for International Students and Professionals 2007-2008, New York: Institute of International Education.
David North, a former Assistant to the U.S. Secretary of Labor, was an immigration policy researcher for several decades.